


Below is the uncorrected machine-read text of this chapter, intended to provide our own search engines and external engines with highly rich, chapter-representative searchable text of each book. Because it is UNCORRECTED material, please consider the following text as a useful but insufficient proxy for the authoritative book pages.
69  The Highway Capacity Manual (HCM) defines QOS, or quality of service, as âa description of how well a transportation facility or service operates from a travelerâs perspectiveâ (1). From a pedestrian perspective, factors that influence QOS include the presence, condition, and con- nectivity of a pedestrian facility; perceived safety and security; comfort (e.g., separation from traffic, protection from the elements, hills and slopes); pedestrian delay, speed, and crowding; wayfinding information and provision of pedestrian amenities; and the aesthetics of the facility and adjacent land use (1). Many performance measures have been developed to quantify QOS. Some measures are narrowly focused and address only a single aspect of QOS, a single pedestrian crossing, or those factors under the direct control of a roadway agency. Other measures are much broader and incorporate both transportation- and land useârelated factors or quantify the performance of a pedestrian facility or network. Chapter 5 presents a selection of both narrow and broad measures, emphasizing those measures that have been applied relatively widely in practice, along with newer measures developed by NCHRP Project 17-87. Additional pedestrian QOS measures proposed in the literature are documented in NCHRP Web-Only Document 312 (2). Pedestrian QOS measures can be used in combination with pedestrian safety measures described in Chapter 3 to provide additional justification for installing pedestrian safety countermeasures. They can also be used as stand-alone measures within pedestrian plans to describe how pro- posed projects would improve pedestrian satisfaction, in Complete Streets planning to help assess trade-offs in roadway right-of-way allocation between travel modes, and within policies or standards to specify when pedestrian improvements are needed. Some pedestrian QOS measures (e.g., delay) are previously presented as operational mea- sures in Chapter 4 (e.g., to help design dimensions of pedestrian facilities or to assess traffic signal timing plans). However, these operational measures can also be used to forecast how pedestrian satisfaction might improve with changes such as wider sidewalks or shorter delays at traffic signals, and these uses are discussed in Chapter 5. Factors Influencing Quality of Service Factors influencing pedestrian QOS include the following (1): ⢠Facility presence. The presence of pedestrian facilities such as sidewalks and crosswalks has a positive impact on pedestriansâ perception of their walking experience. However, factors such as sidewalk width are also importantâincreased width results in increased QOS perception (1). ⢠Facility condition. The condition of sidewalks and crosswalk markings affects pedestrian QOS. Poor pavement condition negatively impacts QOS and can deter some users from using C H A P T E R 5 Pedestrian Quality of Service Analysis
70 Guide to Pedestrian Analysis the facility. The presence of obstructions along the sidewalk can also reduce the perceived service quality. ⢠Connectivity. The presence of connected pedestrian facilities in a network can increase per- ceived service quality, as the connected facilities expand the range of places people can walk to, which in turn can encourage more pedestrians to use facilities. ⢠Perceived safety and security. Facilities perceived to be safe and secure are rated higher by pedestrians with respect to QOS. Factors improving safety and security include the presence of adequate lighting, the presence of barriers to separate the facility from motor vehicles, and lower motor vehicle speeds. ⢠Comfort. Factors affecting safety, such as vehicular volumes and speeds, lateral separation, and number of traffic lanes also affect pedestrian comfort. In general, factors that increase pedestrian comfort lead to an increase in pedestrian QOS. Other factors that affect comfort include traffic noise, fumes, and the level of crowding on pedestrian facilities. ⢠Delay. Increased pedestrian delay negatively affects pedestrian LOS because it increases pedestriansâ wait time. ⢠Speed. An increase in pedestrian speeds (i.e., reduction in delay and crowding) can positively affect pedestrian QOS, whereas higher motor vehicle speeds adjacent to a pedestrian facility negatively affect QOS because of a decrease in the perception of safety and an increase in traffic noise. ⢠Wayfinding information and amenities. The provision of wayfinding information improves pedestrian QOS by reassuring persons unfamiliar with the area that they are heading in the right direction toward their destination. Amenities such as sun or rain protection (e.g., awnings), benches, or artwork can make the walking trip more pleasant. ⢠Facility and adjacent land use aesthetics. The condition and aesthetics of the pedestrian facility and adjacent land uses can make a walking trip more pleasant (if attractive) or make a pedestrian feel less secure (if unmaintained). Measuring Quality of Service Overview Efforts to assess pedestrian QOS have differed in terms of the methods used, the definition of QOS employed, and the facility type(s) measured. These attempts to construct defensible, sensitive, and accurate measures have faced numerous challenges. First, measuring perceptions is a difficult task to accomplish reliably and validly. For example, consumer research highlights how peopleâs evaluations of experience transcend simple rating schemes. Instead, people tend to draw upon a complex array of cognitive appraisals and emo- tions when judging their experience of something (3). Second, depicting actual walking scenarios is challenging, because it is impossible to capture the full range of potential infrastructure, traffic, environmental, and land use variables within a limited study area and time frame. Instead, many researchers have used video clips or still images to more accurately control the range of conditions to which study participants are exposed; however, this approach also places participants outside the context of an actual walking trip. Even when in real pedestrian contexts, participants have often been asked to act in contrived ways (e.g., acting as though one was in a hurry or rating environments âobjectivelyâ as one is being observed), which can elicit a host of response biases (4). Third, different QOS measures have been developed for different purposes. For example, the HCMâs pedestrian measures are transportation-focused (i.e., they incorporate only those
Pedestrian Quality of Service Analysis 71  factors found within the street right-of-way) and are primarily intended for application on collector and arterial streets (for compatibility with HCM measures for other modes). Measures of walkability, however, typically incorporate land use, aesthetics, and pedestrian comfort factors but not necessarily more operations-focused factors. As a result, an analystâs choice of QOS measure(s) needs to consider the purpose of the analysis. Finally, trade-offs between the level of detail incorporated in a measure and the level of effort required to conduct an analysis need consideration. The more factors included in a measure, the more comprehensively it may reflect pedestriansâ experiences while walking; yet, increasing the number of levers available to the analyst to improve QOS requires a greater effort to collect data in order to use the measure. Including statistically significant factors in a performance measure that have no practical impact on the measureâs results increases the analystâs data collection burden without providing a corresponding decision-making benefit. Pedestrian QOS can be measured directly, by using surveys that record pedestrian percep- tions regarding pedestrian facilities, or indirectly, by using operational performance measures such as delay, pedestrian satisfaction measures such as pedestrian LOS or pedestrian level of stress, or walkability measures that incorporate aspects of the surrounding environment. ⢠Surveys. Surveys assess how actual users feel about existing facilities. They can be used to identify locally important issues that might not be assessed by nationally used performance measures. They can also be used to develop locally calibrated relationships between satisfac- tion and facility characteristics. Surveys can be time-consuming and expensive to conduct in person; however, they can also be performed online. ⢠Operations measures. Operations performance can be directly measured in the field and provide counterparts (e.g., speed, delay, density) to commonly used vehicular performance measures. Poor operations performance may lead to safety issues (e.g., long delays encouraging pedestrians to cross against the red light, crowded sidewalks causing pedestrians to step out into the street to move around slower-moving pedestrians). A facilityâs future performance can be estimated with these measures (e.g., by changing pedestrian demand or facility width). ⢠Pedestrian satisfaction. Measures of satisfaction estimate the average level of pedestrian satisfaction with a facility. These measures are typically developed from surveys of pedestrians in different communities and along a variety of facility types. Satisfaction measures tend to focus more on assessing a pedestrian facility as a transportation facility and can incorporate factors related to perceived comfort and safety. These measures can be used to evaluate large networks on the basis of readily available information as well as to forecast changes in satis- faction that would result from potential changes to the facility being studied. ⢠Walkability. Walkability measures assess the attractiveness of a facility to pedestrians (both aesthetically and with regard to usage), and typically incorporate factors considering adjacent land uses, aesthetics, and personal security in addition to considerations of a facilityâs func- tionality and safety. Operations Measures Pedestrian Delay Pedestrian delay at pedestrian crossings is described in Chapter 4 as an operations measure, but it has also been shown to have a strong effect on pedestrian satisfaction (2), which has made it a commonly used QOS measure for crossings. The HCM 6th ed. (1) presents LOS criteria for pedestrian delay at uncontrolled crossings, as shown in Table 5-1. Appendix A provides a method for estimating pedestrian delay (s/p) at uncontrolled crossings.
72 Guide to Pedestrian Analysis Earlier editions of the HCM (5) also presented LOS criteria for pedestrian delay at signal- ized intersections, as shown in Table 5-2. The HCM 6th ed. (1) uses a pedestrian satisfaction measureâintersection pedestrian LOS scoreâto evaluate pedestrian LOS at signalized cross- ings, as described later in this chapter. Appendix A provides a method for estimating pedestrian delay at signalized crossings. Pedestrian Space Average pedestrian space on sidewalks and other pedestrian facilities is another operations measure that also reflects pedestrian QOS on the basis of pedestrian crowding and ability to maneuver. Chapter 4 provides LOS criteria for pedestrian space on a variety of pedestrian facilities. Pedestrian Satisfaction Measures Sidewalks and Sidepaths Sidewalks are paved walkways adjacent or in close proximity to the roadway. Sidepaths are defined here as walkways that parallel the roadway but usually at a greater distance than sidewalks. Research has found that motorized vehicle traffic influences the satisfaction of non- motorized users on facilities located within at least 35 ft of a roadway (6â8). Evaluation of the QOS of sidewalks and sidepaths can identify facilities with poor QOS that may discourage pedestrian use and can be used to describe how pedestrian satisfaction with the facility may improve as a result of proposed improvements. LOS Control Delay (s/p) Comments A 0â5 Usually no conflicting traffic B 5â10 Occasionally some delay due to conflicting traffic C 10â20 Delay noticeable to pedestrians, but not inconveniencing D 20â30 Delay noticeable and irritating, increased the likelihood of risk taking E 30â45 Delay approaches tolerance level, risk-taking behavior likely F >45 Delay exceeds tolerance level, high likelihood of pedestrian risk taking Source: HCM 6th ed. (1). LOS Control Delay (s/p) Likelihood of Noncompliance A 0â10 Low B 10â20 C 20â30 Moderate D 30â40 E 40â60 High F >60 Very high Source: HCM 2000 (5). Table 5-1. Level-of-service criteria for pedestrian delay at uncontrolled crossings. Table 5-2. Level-of-service criteria for pedestrian delay at signalized crossings.
Pedestrian Quality of Service Analysis 73  HCM 6th Edition Method. Chapter 18 of the HCM 6th ed. (1) presents a pedestrian LOS score as the basis for measuring QOS on sidewalks and sidepaths. These facilities can be studied at the link (between signalized intersections), segment (link plus the downstream signalized intersection), and facility (multiple consecutive segments) levels. A regression equation incorporating a number of factors (listed in the next paragraph) pro- duces a score that generally falls into the range of 1 through 6 (lower values represent better conditions), although higher and lower values are possible. The score can be converted into an LOS letter, as shown in Table 5-3. Sidewalk crowding (pedestrian space) is also considered in the calculation of segment and facility LOS, with the worse LOS result (pedestrian LOS score or space) determining the segment or facility LOS. In practice, pedestrian volumes need to exceed 1,000 pedestrians per hour to move out of the LOS A range for pedestrian space; therefore, the pedestrian LOS score will determine LOS in all but the busiest pedestrian environments. The data required to apply the HCM method at the link level include traffic and geometric characteristics, with the option to substitute local or national default values for the items marked with an asterisk: ⢠Traffic characteristics, ⢠Midsegment motorized vehicle flow rate (vehicles per hour, veh/h), ⢠Proportion of occupied on-street parking,* ⢠Geometric characteristics, ⢠Number of midsegment through lanes, ⢠Outside through lane width* (ft), ⢠Bicycle lane width* (ft), ⢠Paved outside shoulder width (ft), ⢠Striped parking lane length* (ft), ⢠Curb presence (yes/no), ⢠Landscape strip width (ft), ⢠Street tree/bollard/vertical buffer presence (yes/no), and ⢠Width of total walkway (edge of curb to far edge of sidewalk)* (ft). Calculation of the pedestrian LOS score at a segment level is done with a time-weighted average of the link (i.e., time spent traversing the link, time spent crossing the downstream intersection) and the LOS scores of the downstream signalized intersection. The segment score is then modi- fied by a factor reflecting the ease or difficulty of crossing the street at a midblock location, with easier crossings tending to improve the score and more difficult (e.g., higher-delay or prohibited) midblock crossings tending to reduce the score. In practice, except for very short Segment-Based Pedestrian LOS Score Segment-Based LOS by Average Pedestrian Space (ft2/p) Link-Based Pedestrian LOS >60 >40â60 >24â40 >15â24 >8.0â15a â¤8.0a Link-Based LOS Score LOS â¤2.00 A B C D E F â¤1.50 A >2.00â2.75 B B C D E F >1.50â2.50 B >2.75â3.50 C C C D E F >2.50â3.50 C >3.50â4.25 D D D D E F >3.50â4.50 D >4.25â5.00 E E E E E F >4.50â5.50 E >5.00 F F F F F F >5.50 F aThe LOS E/F threshold is 13 ft2/p in cross-flow situations. Source: HCM 6th ed. (1). Table 5-3. HCM level-of-service criteria for sidewalks and sidepaths.
74 Guide to Pedestrian Analysis segments, it is difficult to devise a crossing treatment that will produce a significant effect on the segment LOS score (2). NCHRP Web-Only Document 312 (2) presents a refinement to this factor that addresses this issue. Calculating a segment score requires all data required for a link (listed above) and all data required for a signalized intersection (see the discussion of the HCM 6th ed. method in the subsection on signalized crossings below) plus segment length, crossing distance of the down- stream intersection, and information about delay crossing the street at midblock and end-of- segment locations. Finally, the facility score uses a time-weighted average of facilityâs segment scores. The advantages of the HCM method include a strong basis in research, the availability of software and computational engines to perform calculations, and the ability to compare pedes- trian LOS scores to similar scores for the bicycle, transit, and motor vehicle modes. The latter advantage allows analysts to investigate how allocating the available street right-of-way in different ways to different modes will affect each modeâs QOS. At the same time, the method is data- intensive, even with the use of defaults, and the results are relatively insensitive to a number of required inputs, including roadway lane widths, traffic speed, landscape buffer width, and side- walk width (except in the case of the installation of a sidewalk where none existed previously) (2). A computational engine for calculating link scores for the pedestrian, bicycle, and transit modes is provided within the online HCM Volume 4 (hcmvolume4.org) in the applications guide section covering NCHRP Report 825: Planning and Preliminary Engineering Applications Guide to the Highway Capacity Manual (9). Florida DOT Pedestrian Level of Service. The Florida DOTâs pedestrian level of service (PLOS) is described in the 2009 version obits Quality/Level of Service Handbook (10). It is based on the pedestrianâs perception of the roadway or nearby roadside environment. The original research basis of the PLOS is the same as that of the HCM method but the PLOS is designed to be applied on a planning level and use the following few inputs (10): ⢠Sidewalk existence, ⢠Lateral separation of pedestrians and motor vehicles, ⢠Motor vehicle volumes, and ⢠Motorized vehicle speeds. A regression equation models the effects of each of these inputs on pedestrian satisfaction, resulting in a numerical LOS score that generally ranges from 0.5 to 6.5. The methodology was designed for use in generalized and conceptual planning and refers users to HCM method- ologies when more detailed operational analysis is required (10). The current version of the Florida DOT handbook refers analysts to the current HCM link method for operational analysis described above and provides simplified tables based on the percentage of sidewalk coverage and motorized vehicle volumes to estimate LOS for planning applications (11). Oregon DOT Pedestrian Level of Traffic Stress. The level of traffic stress (LTS) method was developed by researchers at the Mineta Transportation Institute to evaluate the QOS of bicycle travel (12). Bicycle facilities are classified into four groups according to the LTS classification, with LTS 1 being a level that children can tolerate and LTS 4 being a level for strong and fearless riders (13). While the LTS methodology has been primarily applied for bicycle travel, the Oregon DOT created a pedestrian LTS methodology for pedestrian travel. The pedestrian level of traffic stress (PLTS) serves to create a high-level inventory and a walkability/connectivity performance rating of pedestrian facilities in a community without significant data requirements that necessi- tate detailed measurements (14). The PLTS methodology classifies roadway segments in a series of lookup tables according to level of pressure or strain experienced by pedestrians and other
Pedestrian Quality of Service Analysis 75  sidewalk users (14). Similar to bicycle LTS, PLTS also incorporates four levels, with PLTS 1 representing little or no traffic stress and PLTS 4 representing high traffic stress. The sidewalk inputs required for estimating PLTS are as follows (14): ⢠Sidewalk condition (good/fair/poor); ⢠Sidewalk width (ft) (use the effective width if obstructions are present); ⢠Buffer type (none, solid surface, landscaped, landscaped with trees, vertical); ⢠Buffer width (ft), the distance from the outside of sidewalk to the edge of the pavement or curb; ⢠Buffering width (ft), the distance from the edge of the sidewalk to the edge of the travel lane; ⢠Parking lane width (ft); ⢠Number of lanes; ⢠Prevailing speed or, if not available, posted speed (mph); and ⢠Prevailing land use in the area. Criteria are also provided for determining the PLTS of crossings, as described below in the sections on uncontrolled crossings and signalized crossings. The Oregon DOTâs Analysis Proce- dures Manual (14) describes the methodology in detail. It is intended for use in urban areas but may be used in rural areas; however, higher traffic speeds (in rural areas) can result in higher PLTS. Other factors that affect PLTS but are not explicitly included in the methodology are steep grades, neighborhood crime/personal security, access density, crash history, and heavy bicycle use (on sidewalk or path). The methodology can be modified to include these factors. Selecting a Method. The three major methods for determining pedestrian satisfaction pre- sented above have different strengths: ⢠The HCM method is well-suited to evaluating different ways of allocating the street right-of- way among travel modes because counterpart methods exist for the bicycle, transit, and motor vehicle modes. The LOS scores produced for each mode are designed to represent equiva- lent levels of traveler satisfaction, which facilitates interpretation. Although the method is data intensive, defaults can be used for many inputs, and a computational engine is available to perform the calculations. Link and intersection LOS results can be combined to determine the LOS of a facility or route. ⢠The Oregon DOT PLTS method has a counterpart in the well-used bicycle LTS method, and it is easy to explain the method and interpret its results. PLTS is determined from a series of lookup tables instead of a series of calculations, which can make it easier to apply than the HCM method. Although this method is also data intensive, defaults can be used for many inputs. The PLTS of a facility or route is based on the worst PLTS score for a link or inter- section along the facility or route. ⢠The 2009 Florida DOT PLOS method is designed for planning applications and requires a minimum of data. The calculations can be easily performed in a spreadsheet. It is best suited for screening to select poor-performing roadways for more detailed analysis to identify ways to improve the roadwayâs QOS. However, the method does not incorporate measures of crossing QOS. Off-Street Paths Pedestrian QOS measures for off-street paths primarily reflect the interactions of facility users with each other (1). Off-street paths can be exclusively for pedestrians or shared with bicyclists. On exclusive pedestrian facilities, the HCM quantifies pedestrian QOS by pedestrian space (ft2/p). As the number of pedestrians increases, the LOS decreases. On shared paths, the service measure is the average number of bicycle meeting and passing events per hour. As the number of bicycles on shared paths increases, the pedestrian LOS decreases.
76 Guide to Pedestrian Analysis Methodologies for calculating LOS for off-street paths are described in Chapter 24 of the HCM (1). The procedure for exclusive pedestrian off-street paths is identical to the proce- dure described in Chapter 4 for sidewalks and uses the same LOS criteria. The required input data are 15-minute or hourly directional pedestrian and bicycle volumes and average pedes- trian and bicycle speeds. Default values can be used for the speeds, but volumes must be provided by the analyst. Three equations are then used to calculate the average number of bicycle meeting and passing events, which can be converted into an LOS by using Table 5-4. A separate procedure is provided in HCM Chapter 24 to evaluate bicyclistsâ LOS on shared- use paths. Uncontrolled Crossings HCM 6th Edition Method. The HCM (1) uses pedestrian delay to quantify pedestrian LOS at uncontrolled crossings at midblock locations and the uncontrolled crossings of two-way stop-controlled intersections. Chapter 4 and Appendix A describe an updated version of the HCM method that addresses issues with the motorist-yielding portion of the methodology and describe the methodâs data requirements. Table 5-1 presents the HCMâs criteria for delay. NCHRP Project 17-87 Method. A new satisfaction-based performance measure for assessing pedestrian QOS at uncontrolled crossings was developed under NCHRP Project 17-87, which also produced this guide (2). The measure predicts the average number of pedestrians who would be satisfied with their crossing experience on the basis of their probability of crossing without delay and the type(s) of crossing treatment used (unmarked crosswalk, marked crosswalk, median refuge island, RRFB). The method is described in Appendix A, and a computational engine for implementing the method is described in Appendix B. The method requires the following input data (items marked with an asterisk can substitute local or national default values): ⢠Number of lanes crossed in the first crossing stage, ⢠Crosswalk length for the first crossing stage (ft), ⢠Conflicting vehicular flow rate for the first crossing stage during analysis period (veh/s), ⢠AADT (both directions),* ⢠Average pedestrian crossing speed (ft/s),* LOSa Eventsb/hour Related Measure: Bicycle Service Flow Rate per Directionc (bicycles/hour) Comments A â¤38 â¤28 Optimal conditions, conflicts with bicycles rare B >38â60 >28â44 Good conditions, few conflicts with bicycles C >60â103 >44â75 Difficult to walk two abreast D >103â144 >75â105 Frequent conflicts with cyclists E >144â180 >105â131 Conflicts with cyclists frequent and disruptive F >180 >131 Significant user conflicts, diminished experience aBased on number of events per hour; applies to any directional split. bAn event is when a bicycle meets or passes a pedestrian. cBicycle service flow rates (i.e., flow during the peak 15 min) shown for reference and based on a fifty-fifty directional split of bicycles. Source: HCM 6th ed. (1). Table 5-4. Level-of-service criteria for pedestrians on shared-use paths.
Pedestrian Quality of Service Analysis 77  ⢠Pedestrian start-up and end clearance time (s),* ⢠Presence of crossing treatments, and ⢠Average motorist yield rate.* If field measurements are available for the number of pedestrians who were not delayed when using the crossing (i.e., an adequate gap in traffic was available when they arrived or the first conflicting motorist[s] who could stop yielded to them), then only AADT and type(s) of crossing treatment are required. A regression model uses these inputs to predict the average percentage of pedestrians who would give their crossing experience a rating of dissatisfied or worse. This result can then be used with Table 5-5 to determine the LOS. Oregon DOT Pedestrian Level of Traffic Stress. The Oregon DOT PLTS method described above for sidewalks provides criteria for uncontrolled crossings. The following data about the crossing are required (14): ⢠Roadway functional class, ⢠Number of lanes, ⢠Prevailing or posted speed (mph), ⢠AADT, ⢠Sidewalk ramp presence (yes/no), ⢠Median refuge presence (yes/no), ⢠Roadway illumination presence (yes/no), and ⢠Presence of other safety countermeasures. Lookup tables are used to determine a base PLTS for the crossing; this PLTS can be adjusted downward (i.e., be improved) on the basis of the presence of various pedestrian safety counter- measures or upward (i.e., be made worse) if no illumination is provided. As with segment PLTS, uncontrolled crossing PLTS ranges from PLTS 1, representing little or no traffic stress, to PLTS 4, representing high traffic stress. Selecting a Method. The choice of method depends in part on the objective and scale of the analysis. If the analysis is already using the PLTS method to evaluate pedestrian facilities between intersections, then it makes sense to also use it for crossings. The PLTS method also lends itself to high-level screening efforts to identify crossings where adding physical safety countermeasures would improve the PLTS of a pedestrian route. In comparison with the other methods described LOS Condition Comments A PD < 0.05 Nearly all pedestrians would be satisfied. B 0.05 ⤠PD < 0.15 At least 85% of pedestrians would be satisfied. C 0.15 ⤠PD < 0.25 Less than one-quarter of pedestrians would be dissatisfied. D 0.25 ⤠PD < 0.33 Less than one-third of pedestrians would be dissatisfied. E 0.33 ⤠PD < 0.50 Less than one-half of pedestrians would be dissatisfied. F PD ⥠0.50 The majority of pedestrians would be dissatisfied. Note: PD = proportion of pedestrians giving a dissatisfied rating or worse. Source: NCHRP Web-Only Document 312 (2). Table 5-5. Level-of-service criteria for pedestrian satisfaction at uncontrolled crossings.
78 Guide to Pedestrian Analysis above, the PLTS method incorporates factors such as sidewalk ramp and the presence of crossing illumination that relate to the usability of a crossing by pedestrians of varying abilities. The NCHRP 17-87 method is well suited for quantifying changes in pedestrian delay and satisfaction at specific uncontrolled crossings. In addition to being sensitive to the effects of physical infrastructure on motorist yielding, it can also be used to quantify the effects of educational and enforcement campaigns on yielding and, thus, on pedestrian delay and sat- isfaction when data on changes in motorist yielding rates are available. The method is intended to replace the current HCM 6th edition method. Signalized Crossings HCM 6th Edition Method. Chapter 19 of the HCM 6th ed. (1) presents an âintersection pedestrian LOS scoreâ as the basis for measuring the QOS of signalized pedestrian crossings. A regression equation incorporating a number of factors produces a score that generally falls into the range of 1 to 6 (lower values represent better pedestrian satisfaction with conditions), although higher and lower values are possible. The score can then be converted into an LOS letter, as shown in Table 5-6. The data required to apply the HCM method are as follows: ⢠Volumes for each motorized vehicle movement crossing over the crosswalk (veh/h); ⢠Right-turn-on-red volume over the crosswalk (veh/h); ⢠Permitted left-turn volume over the crosswalk (veh/h); ⢠Pedestrian delay using the crosswalk (s)âeither field measured or estimated (which requires additional data listed in Chapter 4); ⢠Through traffic volume of the parallel street (veh/h); ⢠Midblock speed of the parallel street (mph); ⢠Number of through lanes on the parallel street; and ⢠Number of right-turn channelizing islands crossed while making the crossing. NCHRP Project 17-87 Method. As for uncontrolled crossings (see above), NCHRP Project 17-87 gathered pedestrian satisfaction data at signalized crossings. The purpose of the data collection was primarily to evaluate the pedestrian satisfaction benefit of LPIs compared with ordinary signalized crossings; the research found no significant difference in satisfaction (2). A large majority of pedestrians surveyed (82%) at the 20 study intersections rated their crossing experience as satisfied or very satisfied. The only factors found to be significantly related to satisfaction were the left-turn volume during the pedestrian phase that passed over the cross- walk and the city in which the intersection was located. Given the relatively limited range of signalized intersections included in the study (i.e., high-activity urban intersections where LOS Score LOS â¤1.50 A >1.50â2.50 B >2.50â3.50 C >3.50â4.50 D >4.50â5.50 E >5.50 F Source: HCM 6th ed. (1). Table 5-6. HCM level-of-service criteria for signalized pedestrian crossings.
Pedestrian Quality of Service Analysis 79  LPIs might be considered), further research is needed to quantify the effects of a broader range of characteristics of signalized intersection on pedestrian satisfaction (2). HCM 2000 Method. As described earlier in this chapter, the HCM 2000 (5) and earlier HCM editions used pedestrian delay as a proxy for pedestrian satisfaction at signalized inter- sections and provided guidance relating LOS letters to the likelihood of pedestrian non- compliance with the signal. Oregon DOT Pedestrian Level of Traffic Stress. The Oregon DOT PLTS method described above for sidewalks can also be applied to signalized crossings. The guidance provided in the Oregon DOTâs Analysis Procedures Manual (14) is that signalized midblock crossings, along with intersection crossings with no conflicting traffic during the pedestrian phase, are generally PLTS 1 (i.e., low stress). Signalized crossings with conflicting left- or right-turning traffic during the pedestrian phase are generally PLTS 2. Some conditions, such as the presence of free-flow or yield-controlled right turns, multiple or narrow refuge islands, lack of sidewalk ramps, more than six lanes crossed at once, and highly skewed approaches, result in PLTS 3. Selecting a Method. The choice of method depends in part on the objective and scale of the analysis. If the analysis is already using the HCM 6th ed. or PLTS methods to evaluate pedestrian facilities between intersections, then it makes sense to also use the same method for signalized crossings, as both methodsâ segment and intersection methods are designed to work in tandem. The HCM 6th ed. method is more sensitive to the magnitude of the effect of conflicting traffic volumes on pedestrian satisfaction, while the PLTS method accounts for factors such as illumination and sidewalk ramps that make the crossing usable by pedestrians of varying abilities. Given that both the PLTS method and the results from the NCHRP 17-87 data collection at a limited range of sites indicate that pedestrians are generally satisfied with signal- ized crossings, the HCM 2000 delay method can also be considered as an alternative, in that it is a method with low data needs that produces a result that indicates the likelihood of pedes- trian noncompliance with signal indications. Networks FHWAâs Guidebook for Measuring Multimodal Network Connectivity (15) lists the key components of multimodal network connectivity: ⢠Network density, ⢠Network completeness, ⢠Route directness, ⢠Access to destinations, and ⢠Network quality. When evaluated in combination, these components provide a complete picture of the options pedestrians have to move from Point A to Point B, including whether routes exist, whether pedes- trians are accommodated, and how direct the routes are (network completeness, density, and route directness), along with how attractive routes are for getting to where one wants to go (access to destinations and network quality). Network-level measures can be used to assess pedestrian con- nectivity to transit stops, within neighborhoods or campuses, or even within entire cities. Example Network-Level Measures. Network-level measures can be used over an area and provide a means of assessing walkability on a neighborhood or even city-wide basis. Example performance measures include the following: ⢠Intersection density (intersections per square mile), ⢠Connected node ratio or link-node ratio (both of which look at the prevalence of dead-end streets or disconnected grids),
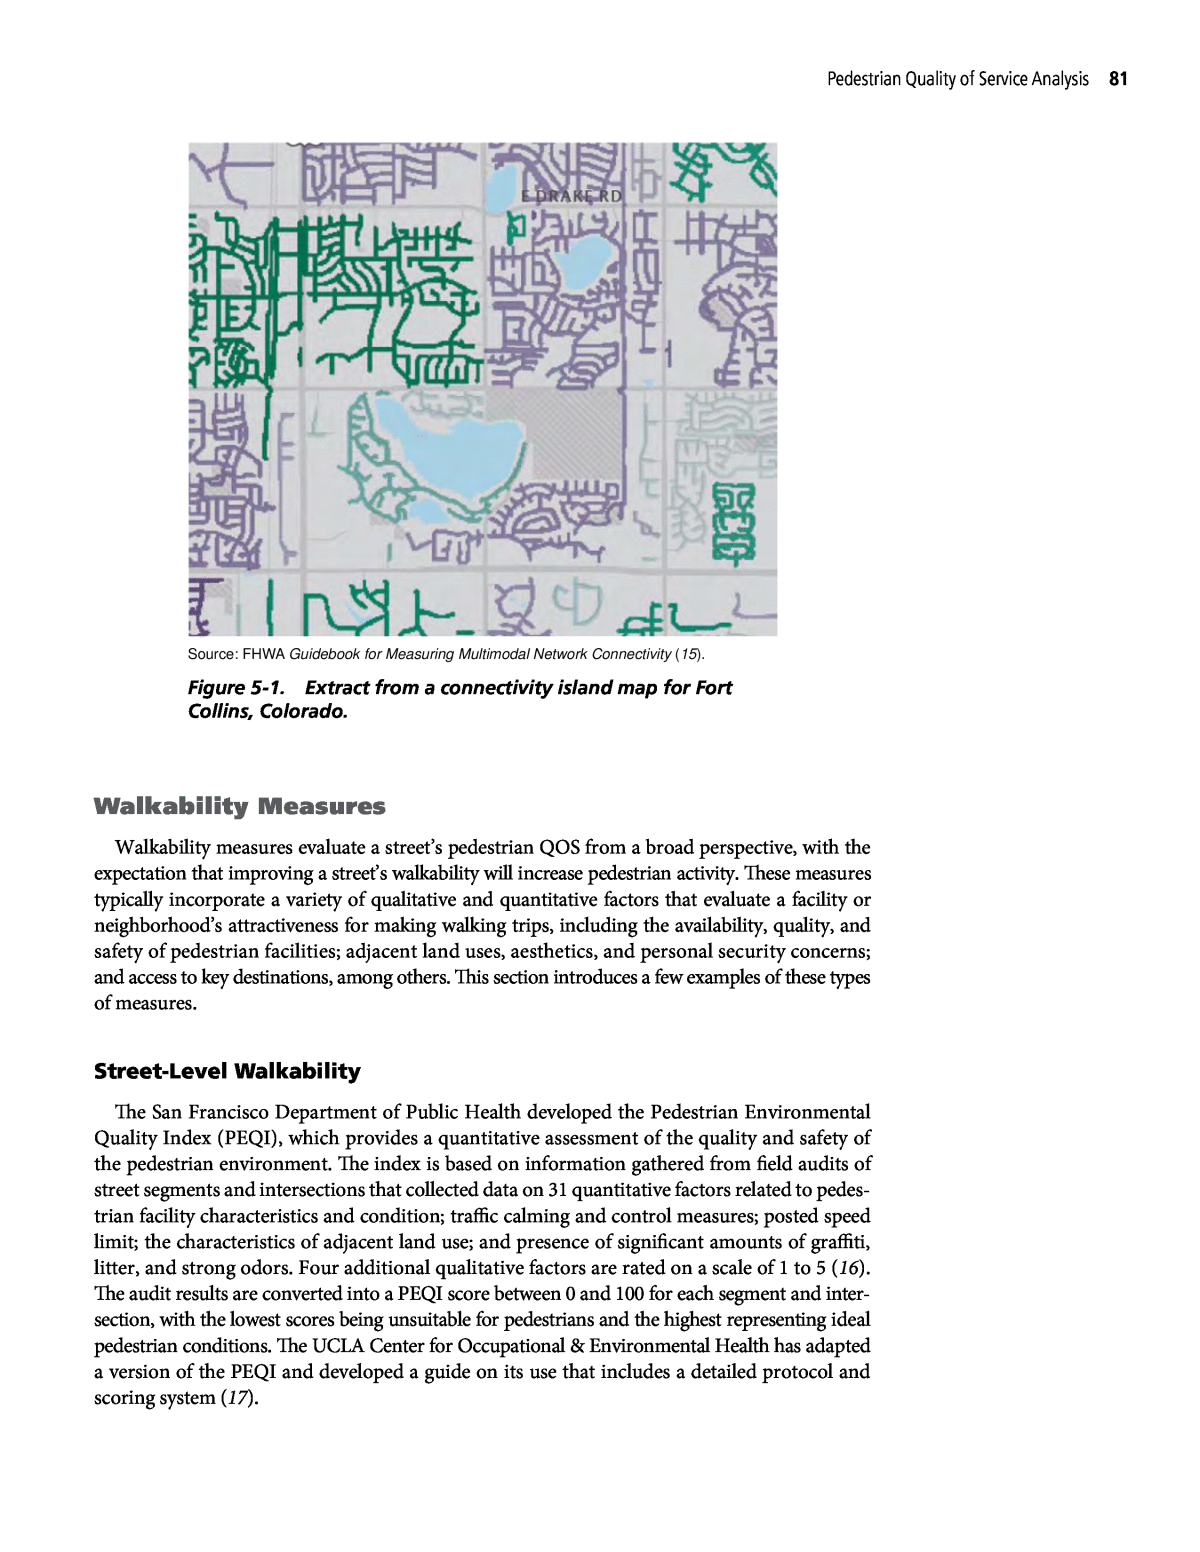
80 Guide to Pedestrian Analysis ⢠Street density (miles of street per square mile), ⢠Sidewalk density (miles of sidewalk per square mile), ⢠Average block length, and ⢠Network completeness (ratio of completed to planned facility miles). These measures tend to rely on data sets that are already assembled and may be pub- licly available. The measures can also be used without consideration of origin, destination, or route, which make them relatively easy to employ. Factors that influence origin and desti- nation can also be considered on a network-wide basis; for example, population or employ- ment density can be considered as proxies for the number of trips that might start or end in an area. One step more complex are network-level measures that take route aspects into account. These include considerations of the route taken to get from Point A to Point B. Examples include pedestrian route directness (the route distance over the straight line or as-the-crow- flies distance), intersection counts, and turn factors (or the influence of the number of inter- sections or turns on walkability) as well as measures of elevation and slope. The concept of an effective walking area, walkshed, or pedestrian (ped) shed, which maps out the area that can be covered by using the pedestrian network when starting at a given location (e.g., a tran- sit stop) and walking out in any direction, is related to these route-level measures. An out- put from a ped shed analysis may be the walkable area (i.e., how many square miles could be reached from a starting location given a quarter- or half-mile allowance or budget) or may consider the number or types of destinations, or both, that may be reached within the shed, similar to the Walk Score methodology (www.walkscore.com). While these measures are based on generally available network data, the assessments require greater input and judg- ments to be made about which origins and destinations to use and how many are necessary and feasible. Using PLTS in Evaluating Components of Network Connectivity. The PLTS method described earlier in the chapter can be used as a starting point for measuring four of the five com- ponents of network connectivity. The basic process is to (a) determine the PLTS of each street segment within the study area and then (b) use GIS software to identify the extent of each subnetwork within the study area connected by segments and crossings of a specified PLTS or better (PLTS 2 to describe networks usable by many users and PLTS 3 for basic connectivity). These subnetworks form connectivity islands that can be visualized as shown in Figure 5-1, where each shade of green and purple indicates a separate connected subnetwork providing the specified PLTS or better, and grey indicates portions of the network that do not provide the specified PLTS. Once the subnetworks have been identified, GIS software can then be used to quantify the following components of network connectivity: ⢠Network quality (miles or percentage of the study area network providing the specified PLTS or better), ⢠Network density [average miles per subnetwork (connectivity island) or number of subnetworks], ⢠Route directness [shortest path (if one exists) along the PLTS network between a given origin and destination, compared with the straight-line (air) distance], and ⢠Access to destinations (percentage of specified destinations reachable along the PLTS network from a given origin). The final component, network completeness, can be assessed separately as the percentage of the planned network that has been completed.
Pedestrian Quality of Service Analysis 81Â Â Walkability Measures Walkability measures evaluate a streetâs pedestrian QOS from a broad perspective, with the expectation that improving a streetâs walkability will increase pedestrian activity. ese measures typically incorporate a variety of qualitative and quantitative factors that evaluate a facility or neighborhoodâs attractiveness for making walking trips, including the availability, quality, and safety of pedestrian facilities; adjacent land uses, aesthetics, and personal security concerns; and access to key destinations, among others. is section introduces a few examples of these types of measures. Street-Level Walkability e San Francisco Department of Public Health developed the Pedestrian Environmental Quality Index (PEQI), which provides a quantitative assessment of the quality and safety of the pedestrian environment. e index is based on information gathered from eld audits of street segments and intersections that collected data on 31 quantitative factors related to pedes- trian facility characteristics and condition; tra c calming and control measures; posted speed limit; the characteristics of adjacent land use; and presence of signi cant amounts of gra ti, litter, and strong odors. Four additional qualitative factors are rated on a scale of 1 to 5 (16). e audit results are converted into a PEQI score between 0 and 100 for each segment and inter- section, with the lowest scores being unsuitable for pedestrians and the highest representing ideal pedestrian conditions. e UCLA Center for Occupational & Environmental Health has adapted a version of the PEQI and developed a guide on its use that includes a detailed protocol and scoring system (17). Source: FHWA Guidebook for Measuring Multimodal Network Connectivity (15). Figure 5-1. Extract from a connectivity island map for Fort Collins, Colorado.
82 Guide to Pedestrian Analysis Grading Category Street Segments Signalized Intersections Nonsignalized Intersections Capacity management and mobility Sidewalk presence Crosswalk presence Walkway width Pedestrian delay Sidewalk presence Curb ramp presence Crosswalk presence Sidewalk presence Curb ramp presence Crosswalk presence Economic vitality Pedestrian volumes Adjacent bicycle accommodations Pedestrian volumes Pedestrian volumes Raised crosswalk presence Safety Pedestrian crashes Pedestrianâvehicle buffer Vehicle travel speed Sufficient crossing time Pedestrian crashes Pedestrian signal phase type Vehicle travel speed Lanes of travel Pedestrian crashes Crossing distance Vehicle travel speed System preservation Sidewalk condition Sidewalk condition Sidewalk condition Source: Claude (18 ). Table 5-7. Rating factors in the Boston Region Metropolitan Planning Organization Pedestrian Report Card Assessment. The Boston Region Metropolitan Planning Organization (MPO) developed the Pedestrian Report Card Assessment to assess the pedestrian environmental quality of street and path seg- ments, signalized intersections, and nonsignalized intersections throughout the Boston region (18). These ratings, when combined with transportation equity factors (described below) are used to prioritize locations for pedestrian network improvements. Each facility type is rated on one or more factors in the areas of capacity management and mobility, economic vitality, safety, and system preservation, as shown in Table 5-7. The factors listed below are used to assess transportation equity. Areas meeting zero or one factor are considered lower priority, areas meeting two or three factors are considered moderate priority, and areas meeting four or five factors are considered higher priority (18). Figure 5-2 shows an example of the Boston Region MPOâs equity mapping overlaid with the following eco- nomic vitality ratings of facilities within the displayed area that have been rated to date: ⢠Transportation analysis zones (TAZs) where the low-income population is greater than or equal to the Boston region median, ⢠TAZs where the minority population is greater than or equal to the Boston region median, ⢠TAZs where the share of the population older than 75 years of age is greater than or equal to the Boston region average, ⢠TAZs where the number of zero-car households is greater than the Boston region average, and ⢠Locations within one-quarter mile of a school or college. Areawide Walkability Moving out from a segment-by-segment or intersection-by-intersection analysis are walk- ability measures that assess areas or zones for pedestrian friendliness. For example, the Pedes- trian Index of the Environment (PIE) was developed to assess a 264- by 264-ft PAZ, or pedestrian analysis zone, to estimate pedestrian mode choice. PIE took the Portland Metro Context Toolâ a built environment index that considers bicycle access, block size, access to parks, people per acre, sidewalk density, transit access, and destinationsâand weighted these on the basis of their relationship to pedestrian trip activity. Ultimately, the top weighted factors were, in order, people per acre, transit access, destinations, block size, sidewalk density, and bicycle access (access to parks was removed due to poor or even negative correlation with walk trip activity) (19, 20).
Figure 5-2. Extract from the Boston Region Metropolitan Planning Organization Pedestrian Report Card Interactive Database. Source: Boston Region MPO, https://www.ctps.org/geoserver/www/apps/pedReportCard/index.html (as of April 9, 2020).
84 Guide to Pedestrian Analysis References 1. Transportation Research Board. 2016. Highway Capacity Manual: A Guide for Multimodal Mobility Analysis, 6th ed. Washington, DC. 2. Ryus, P., A. Musunuru, K. Lausten, J. Bonneson, S. Kothuri, C. Monsere, N. McNeil, K. Nordback, S. LaJeunesse, W. Kumfer, L. Thomas, and S. I. Guler. 2022. NCHRP Web-Only Document 312: Enhancing Pedestrian Volume Estimation and Developing HCM Pedestrian Methodologies for Safe and Sustainable Communities. Transportation Research Board, Washington, DC. 3. Liu, W., B. Sparks, and A. Coghlan. Measuring Customer Experience In Situ: The Link Between Appraisals, Emotions and Overall Assessments. International Journal of Hospitality Management, Vol. 49, pp. 42â49. 4. Mazor, K. M., B. E. Clauser, T. Field, R. A. Yood, and J. H. Gurwitz. 2002. A Demonstration of the Impact of Response Bias on the Results of Patient Satisfaction Surveys. Health Sciences Research, Vol. 37, No. 5, pp. 1403â1417. 5. Transportation Research Board. 2000. Highway Capacity Manual. Washington, DC. 6. Landis, B. W., V. R. Vattikuti, and M. T. Brannick. 1997. Real-Time Human Perceptions: Toward a Bicycle Level of Service. Transportation Research Record 1578, pp. 119â126. 7. Dowling, R. G., D. B. Reinke, A. Flannery, P. Ryus, M. Vandehey, T. A. Petritsch, B. W. Landis, N. M. Rouphail, and J. A. Bonneson. 2008. NCHRP Report 616: Multimodal Level of Service Analysis for Urban Streets. Trans- portation Research Board, Washington, DC. 8. Jensen, S. U. Pedestrian and Bicyclist Level of Service on Roadway Segments. 2007. Transportation Research Record: Journal of the Transportation Research Board, No. 2031, pp. 43â51. 9. Dowling, R., P. Ryus, B. Schroeder, M. Kyte, F. T. Creasey, N. Rouphail, A. Hajbabaie, and D. Rhoades. 2016. NCHRP Report 825: Planning and Preliminary Engineering Applications Guide to the Highway Capacity Manual. Transportation Research Board, Washington, DC. 10. Florida Department of Transportation. 2009. 2009 Florida Quality/Level of Service Handbook. Tallahassee. 11. Florida Department of Transportation. 2018. 2018 FDOT Quality/Level of Service Handbook. Tallahassee. 12. Mekuria, M. C., P. G. Furth, and H. Nixon. 2012. Low-Stress Bicycling and Network Connectivity. Report 11-19. Mineta Transportation Institute, San Jose, CA. 13. Zuniga-Garcia, N., H. W. Ross, and R. B. Machemehl. 2018. Multimodal Level of Service Methodologies: Evaluation of the Multimodal Performance of Arterial Corridors. Transportation Research Record: Journal of the Transportation Research Board, No. 2672, pp. 142â154. 14. Oregon Department of Transportation. 2019. Analysis Procedures Manual. Version 2, updated October 2019. Transportation Planning Analysis Unit, Salem. 15. Twaddell, H., E. Rose, J. Broach, J. Dill, K. Clifton, C. Lust, K. Voros, H. Louch, and E. David. 2018. Guidebook for Measuring Multimodal Network Connectivity. Report FHWA-HEP-18-032. Federal Highway Administra- tion, U.S. Department of Transportation, Washington, DC. 16. San Francisco Department of Public Health. 2012. Pedestrian Environmental Quality Index: Street Auditorâs Training Manual. Program on Health, Equity, and Sustainability, San Francisco, CA. 17. UCLA Center for Occupational & Environmental Health. 2016. Pedestrian Environmental Quality Index: Los AngelesâToolkit for Implementation. University of California, Los Angeles. 18. Claude, C. 2019. Pedestrian Report Card Assessment Interactive Database. Technical Memorandum. Boston Region Metropolitan Planning Organization, Boston, MA. https://www.ctps.org/data/pdf/programs/ bike_ped/prca_app/2019-11-21_PRCA_Interactive_Database.pdf (as of April 7, 2020). 19. Singleton, P. A., R. J. Schneider, C. Muhs, and K. J. Clifton. 2014. The Pedestrian Index of the Environment: Representing the Walking Environment in Planning Applications. Presented at 93rd Annual Meeting of the Transportation Research Board, Washington, DC. 20. Clifton, K. J., J. P. Orrego-Oñate, P. A. Singleton, and R. J. Schneider. 2019. Transferability & Forecasting of the Pedestrian Index of the Environment (PIE) for Modeling. Report NITC-RR-1028. National Center for Transportation and Communities, Portland, OR.
