
8
Gaps in Lake and Watershed Monitoring
Chapter 2 summarized the various long-term water quality data collected throughout the Coeur d’Alene (CDA) watershed, including the Lake and its tributaries, as well as the CDA and St. Joe Rivers, by the U.S. Geological Survey (USGS), the Idaho Department of Environmental Quality (IDEQ), and the CDA Tribe. Those data were analyzed by the committee in Chapters 3 through 6 to reveal trends in water quality parameters and highlight particular issues of concern. Subsequent to those analyses and building off of their limitations, this chapter describes gaps in the long-term monitoring networks and in the evaluation of monitoring data that, if filled, would allow for more comprehensive understanding of water quality in CDA Lake into the future.
There are five major aspects of the Lake and river monitoring programs considered here: (1) where monitoring should take place; (2) which analytes should be monitored (including questions of detection and precision); (3) how samples should be collected; (4) how many samples should be collected each year; and (5) how to select the times when samples should be collected. Gaps in the current long-term monitoring programs that relate to these five areas are discussed below, first for the watershed and then for the Lake.
IMPROVEMENTS TO RIVER MONITORING
It is worth reflecting on the reasons why the river monitoring program is important to the future of CDA Lake. Monitoring the movement of the relevant metals and nutrients through the tributaries of the Lake is a crucial part of an adaptive management approach to enhancing the water quality of the Lake. Very substantial cleanup efforts have already taken place in the watershed (expenditures of over $600 million to date), and very substantial investments will be made in the future. Monitoring the movement of the major contaminants through the system along with ongoing data analysis are vital to understand the effectiveness of the investments made up to the present and to help prioritize and plan for the remediation efforts to take place in the future.
Where Monitoring Should Take Place
The current system of regular fixed-station monitoring of the rivers that is carried out by the USGS (shown in Figure 2-3) seems highly appropriate for covering the monitoring of the metals of concern and obtaining mass balance information for the whole Lake watershed (by including two major tributaries that are not major contributors of metals—the St. Joe River and the North Fork of the CDA River). The primary feature that is lacking is coverage of the nutrient fluxes from the portions of the CDA Lake watershed that are not within the CDA River or
St. Joe River watersheds. Of the total watershed of the Lake, 16 percent of the land area has not been monitored on a systematic basis. Although it is safe to assume that the metal input from these areas is a very small portion of the total metal input to the Lake, it is not safe to assume that these areas are unimportant sources of nutrients.
A substantial amount of the population growth in the watershed in recent decades is in this unmonitored portion of the watershed. Given the level of concern expressed by stakeholders regarding the potential importance of nutrients derived from these areas, it is important that a program of monitoring and modeling (some combination of statistical and deterministic modeling) be developed to assess these nutrient inputs and their changes over time. This is not a simple task because the sources are so dispersed and there is no single location that can be monitored to evaluate these nutrient inputs. There needs to be some combination of fixed station sampling coupled with synoptic sampling of locations in the 16 percent of the watershed that is currently unmonitored. (The committee is aware that the IDEQ has started a new monitoring effort for nutrients in these areas and has reported preliminary results in early 2022. Because this effort is very new and the committee had no documents about its design, it is not considered in this report. However, the committee believes it to be an important addition to the overall watershed monitoring efforts.)
In the simplest terms, what is needed is perhaps two locations that can be monitored on a frequent basis (e.g., 18 times per year) for several years, with the samples allocated to cover much of the range of variation in streamflow as well as season. To be useful, these locations need to be monitored for streamflow as well, just as is the case with the existing fixed-station monitoring locations. Ideally these two sites would have rather different land use characteristics, focusing on agriculture and residential land use. Then, in conjunction with these fixed sites, a set of synoptic sampling sites should be developed where a few samples are collected over a period of perhaps three years, including samples under a range of different hydrologic conditions (e.g., snowmelt, rainstorms, and base flow). These sites would not require stream gages but should be coupled with onsite discharge measurements at the time of sampling. The strategy should be developed such that the more intensive sampling of the fixed stations can put the infrequently monitored synoptic sites into context so that watershed-wide estimates of nutrient inputs to the Lake can be made and trends in these inputs can be assessed. This kind of sampling strategy is not a simple matter, but given the level of concern over potential increases in nitrogen and phosphorus inputs to the Lake, some focused monitoring and modeling efforts must be a part of an overall adaptive management strategy for the Lake.
Sampling Frequency
At many of the river monitoring locations, the frequency of sampling in the past decade has been on the order of five samples per year. Given the significant investment made in the Superfund cleanup and the challenges that remain in the future for the protection of CDA Lake, this is considered by the committee to be an inadequate frequency of monitoring. The purpose of sampling the rivers is to characterize how water quality varies with respect to season and hydrologic conditions and how these relationships are changing over time. Describing these trends (or lack of trends) is crucial to the ongoing evaluation of the effectiveness of current and past remediation efforts, including targeting the locations that need more aggressive remediation and the types of conditions (e.g., seasons and flow conditions) that are in the greatest need of improved control. In those situations where the transport of the contaminants of interest is focused on times of high discharge, the sampling required to characterize the behavior of the system demands that these high-discharge conditions be sampled frequently. For lead and phosphorus, the concentrations tend to increase with increasing discharge at all of the monitored sites. For cadmium and zinc, concentrations tend to decline with increasing discharge for sites in the South Fork of the CDA watershed, but for the main stem of the CDA River near Harrison, concentrations rise with increasing discharge. For those contaminants for which concentration declines with increasing discharge, one could argue that long-term trends and average transport can be characterized well with small numbers of samples per year (less than 12). However, lead and phosphorus are sampled at the same sites and they need substantially more intensive sampling to characterize their trends; given that the largest part of the monitoring program cost is related to traveling to and from the river site and collecting the samples (versus the cost of laboratory analysis), consideration needs to be given to more intensive sampling of all constituents at the river sampling sites.
The biggest challenges for further reduction of metals input to the Lake will be to reduce the future transport of the metals that are stored in the alluvial material of the lower CDA River. Finding effective control strategies for these kinds of materials is not a routine environmental cleanup task. It is much more scientifically challenging than dealing with the tailings, tunnels, and settling ponds, which have been central features of the successful ongoing cleanup of the mined areas of the South Fork of the CDA River. The strategies for remediating the lower basin will require much more of an adaptive management approach, implementing novel remediation strategies, attempting to build predictive models of their likely effectiveness, monitoring their performance over a number of years, and using the monitoring data to provide feedback to the modeling and to enhance these remedial measures. The U.S. Environmental Protection Agency (EPA) has published an Adaptive Management Plan (EPA, 2020) that has a section on “monitoring and assessment,” but with no specifics regarding the approaches to monitoring and assessment that will be used. Monitoring strategies will require mass balances by event and by year for the entire segment (the upstream end being the inputs from the South Fork near Pinehurst and the North Fork at Enaville, the downstream end being the CDA River near Harrison), which will require several high-flow samples at each site as well as several samples at moderate to low flows over a period of several years. Indeed, more frequent sampling of high-flow events is needed to capture the “first flush” of contaminants from the landscape, which happens upon the first snowmelt and other early storm events. Understanding first flush is particularly relevant to metals contamination, because it is during first flush that a large mass of particulate metal is transported and acute water quality criteria are most likely to be violated.
Looking to another watershed-scale restoration program as an example for CDA Lake, the Chesapeake Bay watershed has a monitoring network of more than 100 monitoring sites that are sampled about 20 times per year (Chanat et al., 2016; see Box 2-1). The sampling design is discussed in Gilroy et al. (1990), Sprague (2001), and Oelsner et al. (2017); the latter contains extensive analysis of the impact of sampling frequency on the analysis of decadal nutrient flux trends. In general, the findings were that in some cases sampling frequencies as low as four per year could provide fairly reliable estimates of trend (errors mostly less than 10 percent), but in other cases, sampling frequencies even as high as nine samples per year could result in flux trend errors of as much as 60 percent. Only when frequencies reached 12 per year were the errors in trend results consistently small (i.e., less than 10 percent error). Applying these results to the CDA River, one can conclude that, particularly for evaluating trends in total lead or total phosphorus, sampling frequencies of less than about 12 per year could be problematic. The consequence of continuing a low sampling frequency, particularly at the upstream and downstream ends of the lower basin, is that the time it will take to demonstrate if the strategies are working will be stretched out over many years. The evaluation of very costly future cleanup strategies, particularly in the lower CDA River, will need a higher degree of accuracy than what the past records have provided. For example, the 90 percent confidence interval for total lead flux for the CDA River near Harrison in the year 2020 covers the range of about 400–1,400 metric tons (MT)/yr (data not shown).
As mentioned in Chapter 3 in the discussion of the suspended sediment budget of the lower CDA River, the accuracy of load estimates for sediment and for total lead and total phosphorus would be greatly enhanced if continuous turbidity monitors were placed at the inflow points (from the North Fork and South Fork) and at the outflow at Harrison. These turbidity sensor data could then be related to sediment, lead, and phosphorus concentrations measured in the discrete samples. Using turbidity as a surrogate measurement,1 a continuous record of concentration could be estimated. This would greatly improve the ability to describe the dynamic nature of the deposition, resuspension, and transport of these three constituents. This type of information will be crucial to assessing the success of any strategies to reduce lead and phosphorus inputs to the Lake. Use of such surrogate relationships will still require the collection of the discrete samples, and those relationships will require recalibration over a period of years at each location, as the size and type of particulate material changes over time. Improved understanding and predictive capabilities would also be enhanced if the samples that are collected were analyzed in more detail, providing information on particle size distribution and the major forms of the metals and nutrients in the suspended and dissolved loads.
___________________
1 https://www.usgs.gov/mission-areas/water-resources/science/sediment-surrogate-techniques#overview
Sample Timing
Evaluating the effectiveness of remediation strategies in situations where concentrations increase with discharge depends on placing extra effort on sampling multiple high-flow events before the remediation efforts get underway and multiple events after they have been put in place. In the case of the Chesapeake Bay river monitoring system (see Box 2-1), for the past 30 years the sampling strategy used a stratified approach that calls for monthly sampling, typically on a calendar basis (e.g., the first Monday in the month) supplemented by about eight high-flow samples per year. Managing that sampling process can be challenging because one cannot know the timing and extent of the high-flow conditions for the year in advance. For example, a large storm event may trigger a major high-flow sampling effort perhaps including three to four samples taken, some on the rising limb of the hydrograph and some on the falling limb. Then later in the year an extraordinarily large event may happen, but the sampling budget may be nearly exhausted, and this crucial event may be poorly sampled. Conversely, the first high-flow event of the year may be the only one that happens, and the remaining samples for the year may be used on less-important lower-flow conditions. The bottom line is that this type of sampling can be a management challenge and the results will be imperfect, but there must be enough sampling effort allocated so that seasonal variation and the role of high-flow events can be characterized.
The simulations documented by Oelsner et al. (2017) also explore the question of the importance of high-flow sampling to the accuracy of flow-normalized fluxes. For these simulations, the high-flow threshold is defined as the 85th percentile on the daily flow duration curve (i.e., the highest 15 percent of daily discharges). The study found that having at least 14 percent of the samples being above the high-flow threshold was sufficient to obtain a fairly high accuracy of flow-normalized flux. The USGS monitoring program in the CDA watershed has used this kind of sampling design that focuses on high-flow conditions, even though the overall sampling frequency is much lower than 20 per year. Using the dataset for total lead samples collected at the CDA River near Harrison as an example, about 27 percent of the samples over the period of record were collected at discharges that exceeded the 85 percent high-flow threshold. That is a good result, reflecting a high degree of attention to sampling at the higher discharges. Lee et al. (2019) also explored the question of the impact of sampling frequency on the accuracy of flux estimates for a variety of constituents at a number of sites. Those results showed that below frequencies of about six per year, the accuracy of estimates diminished rather sharply, but there is little difference in accuracy between sampling strategies that used 12 scheduled samples plus about six high-flow samples versus strategies that used as many as 26 samples per year.
To illustrate how important the days of high discharge can be in the lower basin, particularly for total lead transport, the committee conducted a simple numerical experiment. The 3,653 days in the water years 2011–2020 were ranked from the lowest discharge to the highest. For each of these days, there is also an estimate of the flux of total lead transported on that day (these estimates come from the Weighted Regressions on Time, Discharge, and Season model described in Chapter 3). For purposes of this illustration, these flux estimates are treated as if they were the true value for that day. (Of course, they are not true values, but they are a reasonable representation of how total lead flux varies with season and discharge.) The following question is then posed: What fraction of all the total lead transported during this decade was transported on the top half of the days? The answer is 98.5 percent. Thus, when it comes to estimating total lead, the lower half of the days (from a discharge perspective) are responsible for a tiny fraction of all the transport. This suggests that collecting samples on those lower discharge half of the days is almost irrelevant to the ability to estimate the total transport of lead. Looking at the days in the top 10 percent of the discharge distribution, the total transport on those days is 76 percent of the total for the decade. Finally, the top 1 percent of the discharge days (36 days in the ten-year period) constitutes 34 percent of the total transport. The results of such an analysis for zinc or cadmium are not as extreme as the results for lead, but management of the lead coming out of the lower CDA River is such a crucial aspect of managing the future quality of CDA Lake. Thus, sampling for this system needs to be designed with this discharge versus lead flux relationship in mind.
How well does the current sampling design reflect this issue of the importance of sampling the high-flow days? Using the same 2011–2020 decade as an example, there were only 51 days sampled, but they were sampled with an appropriate bias toward the higher discharge days (see Figure 8-1). The boxplot on the left shows (on a log scale) the discharge on the 51 sampled days, while the one on the right shows the discharges on all 3,653 days.
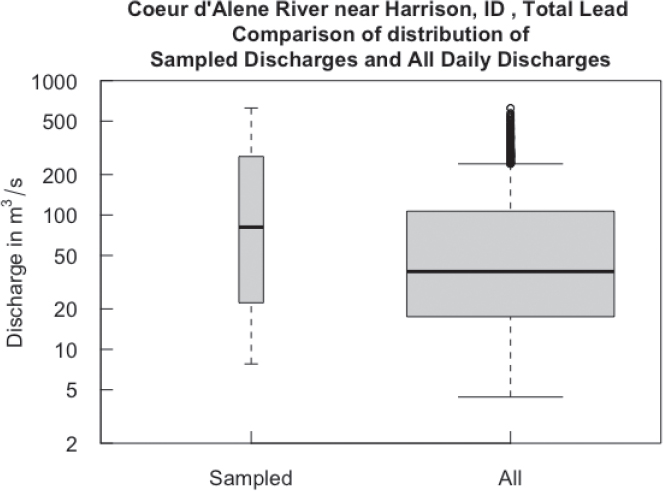
(Note that the width of the boxes is proportional to the square root of the sample size). Figure 8-1 shows that the median of the sampled dates is only slightly less than the upper quartile of the full distribution, and the highest sampled date is very nearly equal to the highest discharge of the entire ten-year record. This shows an effective distribution of sampling effort, even though the total amount of sampling is quite low.
In summary, the overall sampling frequencies employed, particularly at the upstream and downstream ends of the lower CDA River segment, are simply too low given the role that this segment plays in the future delivery of contaminants to the Lake. However, the allocation of sampling efforts toward high-flow conditions is appropriate, and even if overall sampling frequencies can be increased in the future, this high-flow biased sampling strategy should continue to be used.
IMPROVEMENTS TO LAKE MONITORING
Spatial Resolution
As in many limnological monitoring programs, the focus of long-term monitoring within CDA Lake has been on pelagic sampling, with the main routine sampling sites (C1–C6) aligned longitudinally from the dam to the stream inflows. Although this has meant good spatial representation of the main Lake, it means that changes in the littoral zones of the Lake are unmonitored. Littoral regions are where the greatest interactions with the public occur and the greatest watershed impacts manifest. They are difficult to monitor because the shoreline is highly heterogeneous, and no one location can be considered representative.
Approaches that have proven useful at other lakes include variations and combinations of the following four approaches. First, it is valuable to establish a finite number of fixed sites that encompass the range of variability. This could include littoral areas adjacent to highly populated regions, undisturbed regions, creek mouths, and wetland areas to name a few. These fixed sites could be monitored on a regular (monthly) basis for the usual limnological variables, but with added emphasis on littoral algae, coliforms, etc. In addition, it is possible to install automated sampling stations that can measure key physical and chemical factors at high resolution (every 1–10 minutes). Such variables include water temperature, wave height, chlorophyll fluorescence,
phycocyanin fluorescence (an indicator of cyanobacteria), water clarity, chromophoric dissolved organic matter (CDOM), dissolved oxygen, pH and turbidity.
The second concept is synoptic sampling of a broader range of sites at one time of year, particularly when littoral algae are near their peak. Synoptic sampling is the collection of samples from many locations during a short period of time, typically a few hours (Kimball, 1997). Such a “snapshot” can help identify spatial trends more effectively than the smaller number of routine stations. For CDA Lake, synoptic sampling could include 30–40 sites, whereas the routine littoral sites would typically include fewer than ten.
Third, the use of remote sensing should be considered to better understand dynamics in the littoral zones. Although spaceborne remote sensing does not currently have the resolution needed for littoral monitoring,2 the use of drones, fixed-wing aircraft and helicopters can overcome the issue of resolution. These platforms can be equipped with something as simple as GoPro cameras to something more complex, such as multispectral or even hyperspectral cameras. The images obtained can provide quantifiable data on variables such as the extent of littoral algae, inflow plumes, and sediment resuspension. Such data could be valuable prior to the establishment of the fixed sites.
Fourth, the engagement of private citizens in data collection is a valuable and often untapped resource. Simple reporting of both ordinary and extraordinary events can provide researchers and lake managers with data over a spatial range that is impossible to achieve in other ways. Such observations can also serve as an important early warning system. The near universality of high-quality cameras on personal cell phones and the simultaneous and automatic recording of GPS location can provide valuable data. What is required to make such data useful is the creation of an app or other data portal that makes uploading simple for the private citizen, and structures the data in a way that minimizes the time and effort required by the user. There are now examples of such app at many lakes.
A cross-lake transect, which is distinct from the littoral monitoring program, could be added to the routine pelagic program. It would not be prohibitively expensive and would provide information on the connections between the littoral and pelagic zones.
The Lake’s vertical profile monitoring program is generally well designed. The depth resolution for the vertical profiles is very good, with contemporary intervals of < 1 m generally. The only major suggestion regarding the location of the vertical profile sampling program is that it would be very advantageous to have an observation collected during each sampling event from a depth relative to the sediment–water interface (e.g., 0.5 or 1.0 m above the sediments). As it currently stands, it is not clear how far the deepest profile observation is from the sediment interface for any of the historic data. This is very important because the most important redox reactions (i.e., nutrient and metals release from the sediments) are directly related to oxygen concentrations at the immediate sediment–water interface.
Temporal Resolution
The temporal sampling resolution of the program is adequate, with monthly sampling most of the year and most recently twice monthly sampling during the summer months. Nonetheless, the profile sampling is incomplete during much of the November to March period. It would be good if the Lake was monitored monthly during this period, or, if that is not possible, if it was consistently sampled every other month (e.g., December and February) to facilitate long-term trend analyses for those winter months that have the most data. Most important is being more consistent in which months are sampled during the winter—for example, sampling October, December, and February every year and November and January when feasible.
It should be noted that monthly sampling can miss limnological events such as the onset of algal blooms that signal water quality degradation. Although intensifying sampling frequency can add costs, especially for samples that are intensive to process (such as phytoplankton community samples), higher temporal resolution will increase the chances of capturing such short-lived events and allow them to be placed into a broader context of long-term trends.
___________________
2 Regarding the potential for satellite remote sensing on CDA Lake, this could be limited by the narrowness of the Lake, and satellite algorithms for chlorophyll and suspended sediment would need to be groundtruthed with traditional measurements for some time.
Sampling Methods
When using the profile data collected from CDA Lake it is very important to screen for any data collected during sonde upcasts. An upcast is when the sonde is retrieved from the bottom of the profile to the top while recording data. This is evident by comparing the time stamp for sonde readings to the corresponding depths. Upcast data are invalid because when the probe is being pulled upward through the water column it creates a void behind it that gets filled with water that has been turbulently mixed and displaced upward. Conversely, downcast data are collected as the probe is being lowered through the water column; therefore, the sensors, which are located on the bottom of the probe, encounter laminar conditions. Upcast data are very noisy and offset compared to downcast data. Upcast data commonly occur when, for example, a cable gets tangled and needs to be lowered 1–2 m to resolve the tangle. Upcasts also occur if a regular downcast is collected and the sonde is left on when retrieving the sonde to the surface. In both of these cases, the upcast causes no serious problem, and the upcast data can just be discarded. In most cases, only a small portion of the profile data collected from CDA Lake was discarded. However, many profiles collected during 2016 were solely taken as upcasts, such that downcast data were not available for these profiles. Similarly, most of the 2015–2021 data collected at the Cougar 2 station were collected as upcasts. Upcast data should not be used, and those collecting profile data from CDA Lake in the future should be cautioned to collect sonde data only as downcasts.
Better Monitoring of Nutrients
As mentioned in Chapter 2, the large majority of the phosphorus data in the IDEQ and CDA Tribe datasets are currently presented only for the total phosphorus fraction. Many fewer data points are available on dissolved phosphorus or soluble reactive phosphorus, and no particulate phosphorus data have been reported. The Total Phosphorus Nutrient Inventory, 2004–2013 (IDEQ and CDA Tribe, 2020) presented a comparison of total phosphorus, total dissolved phosphorus, and soluble reactive phosphorus as a function of river flow for the CDA River at Harrison. The report showed that dissolved phosphorus concentrations are nearly constant with regard to flow, whereas total phosphorus concentrations increase sharply at river flows > 5,000 cfs. Since much of the phosphorus loading to CDA Lake is associated with high river flow, the report indicated that much of the phosphorus transported from the CDA River to the Lake is in the particulate phase.
The bioavailability of the particulate phosphorus fraction can vary greatly depending on whether this phosphorus is associated with organic matter (e.g., leaf litter or sloughed-off algae) or is part of mineral complexes with iron, aluminum, calcium, or clays. Particulate phosphorus associated with high-sediment transport events is less likely to be bioavailable, and more likely to rapidly settle to the lake sediments, than particulate phosphorus that is not associated with high-sediment transport events. Future research on the CDA basin would benefit from consistently quantifying both the total and dissolved phosphorus fractions, including the mineral composition and bioavailability of the particulate fraction. Indeed, on a few occasions when particulate phosphorus concentrations are particularly high, the mineral composition of the particulate phosphorus should be characterized to determine whether this phosphorus is associated with organic matter or is in mineral associations with calcium, aluminum, iron, etc.
Most long-term limnological monitoring programs on oligotrophic lakes have total phosphorus reporting limits of approximately 1 μg/L. These low reporting limits are achieved by using 4- or 10-cm length spectrophotometer cells (as opposed to the standard 1-cm cell) and detailed protocols for washing the glassware. The Lake Tahoe Environmental Research Center, which consistently deals with lake phosphorus concentrations close to the detection limit of 1 μg/L, washes its phosphorus glassware between each phosphorus analysis by autoclaving in a dilute acid solution.
In addition to the above considerations for phosphorus, the long-term monitoring program needs to consider regular monitoring of nitrogen, including the entire suite of species (total N, NH3/NH4+, NO3−) in the epilimnion or euphotic zone. Given the fact that CDA Lake may be nitrogen-limited for part of the year, both nutrients are important. By analyzing the total nutrient data set in the Lake Tahoe watershed, for example, it could be concluded that decreasing trends in nitrogen and phosphorus were related to fire suppression and forest growth (Coats et al., 2016).
Monitoring of Physical Parameters
The physical characteristics of a lake provide information on the transport, mixing, and dilution of dissolved and particulate material (both horizontally and vertically) and can provide insights into the spatial distributions of variables such as dissolved oxygen, metals, nutrients, and the biota. With an understanding of these characteristics, it is possible to infer the future trajectory of lake conditions in the face of factors such as changing watershed characteristics and climate change.
As physical characteristics vary over a very broad range of timescales (from seconds to years), intermittent sampling at monthly or similar intervals does little to improve understanding. Instead, time series data provided by in situ sensors are more useful. Thermistor chains, where a set of high-resolution temperature sensors are distributed along a taut vertical mooring line, are the most ubiquitous, economical and useful for providing such data. Including sensors for electrical conductivity, turbidity, and dissolved oxygen make such an installation highly informative of the conditions that drive water quality change. Typically sampling at intervals between 30 seconds and 10 minutes, with the instruments staying in place throughout the year, will yield a data record with information on a broad range of important processes, including duration and extent of thermal stratification, occurrence of episodic mixing events triggered by storms, insertion depth of river plumes, causes of vertical mixing that can transfer oxygen to the lake sediments, and year-to-year differences in these processes. When combined with water sampling, these measurements can provide a phenomenological explanation and understanding of changes in lake chemistry and biology (see, e.g., MacIntrye et al., 2009; Marcé et al., 2016; Meinson et al., 2016; Roberts et al., 2020; Ward et al., 2022). Such data are critical for calibrating and validating the performance of lake models, which are valuable tools for exploring the future state of the Lake.
Typically, the data from these instruments would be downloaded two to three times a year. The moorings can be enhanced to provide real-time data, which would require a surface buoy to transmit the data. Real-time data provide the unique advantage of observing critical phenomena as they occur, thus allowing for additional measurements to be taken as needed by dispatching a sampling vessel. A minimum of three stations (C1, C4, and C5) should be considered; if resources are available for a fourth station, C3 could be added.
Although velocity can in part be inferred from thermistor chain records, it is better to directly measure lake velocities. Water velocities are universally measured at present with acoustic Doppler current meters—instruments that can be deployed at the bottom of the Lake and can measure the velocity from the bottom to the surface of the Lake. The information they yield would help managers better understand periods when sediments are resuspended (during high inflow events and possibly during internal seiches events) and could also be useful for calibrating and validating Lake models.
The final element of determining the Lake’s physical characteristics would be the use of high-resolution, multiparameter profilers. These would be used to take a profile at each station visited during a water-sampling day, falling through the water column at 0.5 m/s and sampling at 4-8 hz. The profilers typically measure temperature, electrical conductivity, dissolved oxygen, turbidity, chlorophyll fluorescence, pH, photosynthetically active radiation, and beam attenuation. They provide high spatial resolution (5–10 cm) data albeit at monthly intervals. As such, they complement the vertical instrument chain data that have lower spatial resolution (possibly located at 10 depths in the water column) but very high temporal resolution.
Improvements to Metals Sampling
Measurements of particulate and dissolved lead, zinc, and cadmium including metal(loid)s in the water column are reported on a near-monthly basis, along with special water column studies (e.g., profiles, intense studies at selected sites). The existing continuous dataset is less than 15 years old—a short window of information on the scale at which the Lake has changed and continues to change. It is critical to continue the heavy metal monitoring as well as to collect data that aid interpretation of the metal data (e.g., manganese, iron, dissolved oxygen, hardness). Although resource constraints always require choices in monitoring, the suggestions below should not come at the expense of maintaining long-term water column monitoring.
Although monthly sampling is adequate for some interpretations, the gap in monitoring in the winter prevents a full understanding of metal dynamics. More frequent sampling or well-designed special studies targeted at specific questions about winter influences or intramonthly temporal variability at critical times could help fill in gaps.
Methods for Determining Particulate versus Dissolved Metals
Metal concentrations measured by USGS, IDEQ, and the CDA Tribe (i.e., both inputs and in CDA Lake) are reported as “total,” “filterable,” and “total recoverable” concentrations. There are two major issues with these methods that must be considered when interpreting the metals data. First, the water column metal concentrations reported as “filterable” by the CDA Tribe and IDEQ refer to anything that passes through a 0.45-μm filter, and this concentration is interpreted to be the dissolved metal concentration. However, metals bound to colloid-sized particles have been observed on occasion to pass through the 0.45-μm filters; at times, the quantities were sufficient to make the filtrate cloudy (Chess, 2021). These cloudy filtrates can be decomposed with a strong acid treatment (pH < 2) to free the colloid-bound metal (resulting in “total recoverable metal” according to EPA method 200.7). Hence, the “filtered” sample includes dissolved + colloidal metal in the filtrate, and thus may overstate at least dissolved lead concentrations. This is a more important issue for lead than for zinc and cadmium (because very little zinc and cadmium associate with colloids in CDA waters—Balistrieri and Blank, 2008) and is most important during periods of high runoff. It is not clear in the metals datasets when the total recoverable treatment has been done, but it is not routine. Clear designation of samples where total recoverable digestions were conducted would be a minimal correction for these issues. Including both “dissolved” determinations and “dissolved after total recoverable digestion” would help quantify where such issues exist.
The second problem has to do with the measurement of “total” metal concentrations, which are unfiltered samples that have been preserved at pH 2—a pH low enough to desorb much (but not all) metal from particulate material (Balistrieri et al., 1994). Hence, “total metal concentration” in the water column does not actually represent the total metal concentration on the particles, because only particulate metals desorbed at pH 2 are included. Thus, the actual mass of particulate metal in a sample is larger than represented by “total” minus “dissolved” metal determinations. The actual concentration of metal on particulate materials can only be determined from a completely decomposed particulate sample (as was done in Balistrieri et al., 2002, and Kuwabara et al., 2006). Metal concentration on particulates is then determined by dividing this value by the weight of the particulate in the sample (reported as μgmetal/gparticulate). This is termed total particulate metal, and it is the measure that influences reactions with dissolved metal and effects on biota.
Conventional practice is to use total metal and not total particulate metal, when doing flux calculations, which is the approach taken by this committee and throughout the literature. This will have little effect on trends, which are of interest in this report, because total metal is typically a function of total particulate metal for each element. But this issue will lead to understating the absolute masses of metal deposition or transport based upon fluxes versus those determined from dated cores that used total particulate metals. This issue becomes important if a budget of deposited lead across the entire system is needed (e.g., historically, at present, or into the future).
Need for Additional Sediment Cores
One of the most important gaps in the collection of data critical to understanding the influence of mining legacy inputs on water quality in CDA Lake is data on lateral and vertical distribution of metals in the Lake sediments. A number of studies have measured lead, zinc, cadmium, arsenic and other metals in sediments since the comprehensive studies of Horowitz et al. (1993), including Horowitz et al. (1995), Harrington et al. (1998), Toevs et al. (2006), Morra et al. (2015), and Kuwabara et al. (2003, 2007). Nevertheless, there is not a systematic understanding of the spatial distribution of metals in sediments. Areas of extreme metal enrichment (10,000 μg Pb/g dw) are still present, and in some locations, in-shore areas with much less contamination (< 350 μg/g dw) are also present (EcoAnalysts, Inc., 2017; Scofield et al., 2021). Few studies have been sufficiently intensive to allow generalizations or identification of areas of greatest and least concern. Better understanding the patterns of distribution and locations of “hot spots” is critical to better understanding the Lake-wide flux of metal from the sediments to the water column, ecological risks to the benthic food web, and human exposures to lead during activities in the Lake.
A spatial assessment of lakeside soils is also essential to evaluate if there are human health risks in the shoreline area, especially associated with areas where flooding might have occurred in the past. Given the extreme
concentrations of lead in the particulate material in flood waters from the CDA River, soil monitoring of lakeside areas that can be flooded would also fill an important gap.
Dated vertical cores of sediments in many different locations (including but not limited to the CDA River mouth and Harrison Slough) will be critical to understanding the degree to which metal enrichment in Lake sediments is receding as remediation continues to reduce inputs of metals from the watershed. Only one dated core has been studied since 2010 (Morra et al., 2015). Thus, very little is known about recent changes in sediments. Such understanding is crucial to interpreting future changes in the Lake. Well-studied cores in critical locations would be an effective means to monitor changes in sediment enrichment in different pools of the Lake and might aid understanding of sediment transport—another important gap. Once a sense of the time series in sediments in different locations in the Lake is known, monitoring of surface sediments (e.g., every three years) might be sufficient to evaluate sediment changes over time.
Lack of Ecological Data
Although CDA Lake is heavily enriched with potentially toxic metals, the ecological implications of that contamination remain ambiguous. In many locations, lead, zinc, cadmium, and arsenic concentrations in water and particulate material (the food of many invertebrates) are higher than concentrations that cause toxicity in controlled studies. Yet, lack of ecological monitoring makes it difficult to extrapolate from such high concentrations to changes in the pelagic or benthic food webs of the Lake. The ambiguities point to the challenges in establishing how ecosystem services in the Lake have been affected by the legacy wastes of mining. As discussed in Chapter 9, building a body of understanding at different levels of ecological organization, from exposure through effects, is crucial to determining what benefits might arise from remediation of the metal contamination in the system. Specifically, systematic pilot studies and monitoring of metal enrichment in muscle and livers of sport fish and fish from the pelagic and benthic food webs are major gaps. Stable isotopes studies (15N and 12C) along with studies of metal bioaccumulation could allow evaluation of exposures of pelagic and benthic food webs. Possible effects on the benthic food web are of particular concern given the extreme concentrations of metals in sediments. Only two studies have evaluated the benthic community of the Lake in association with metal exposures in the past two decades (Kuwabara et al., 2006; EcoAnalysts, Inc., 2017), and those studies illustrate the complexity of attempting to assess lake-wide effects of contaminated sediments on the benthos (see Chapter 9). Given the importance of benthic food webs to lake ecosystems in general, this is a major gap (Vander Zanden and Vadeboncouer, 2002). Mesocosm studies, as described in Chapter 9, could also greatly aid understanding of pelagic influences of metal contamination in particular; but would also be useful with benthos.
Although the scientific program at CDA Lake is impressive in some ways, one of its striking shortfalls is the relative paucity of monitoring data for higher trophic levels (zooplankton, fish) as well as focused studies of ecological interactions such as food web structure or benthic–pelagic coupling. In a region where tourism, boating, and fishing are important, a comprehensive understanding of lake food webs could enhance these ecosystem services, and facilitate future assessment of shifts in these services as watershed remediation efforts, climate change, and shoreline development proceed.
***
The appropriate monitoring program for a lake is highly site-specific and dependent on many local considerations; however, much can be learned from existing long-term lake-monitoring programs. Boxes 8-1 and 8-2 provide summaries of the monitoring programs at Flathead Lake and Lake Tahoe. Compared to CDA Lake, the Flathead Lake Monitoring Program (FMP, Box 8-1) has more extensive characterization of nutrient chemistry, direct assessment of phytoplankton productivity via the carbon-14 method, and a thorough quantification of zooplankton biomass and community composition. Another advantage of the FMP is a more frequent and regularized
sampling program that provides data on at least 15 dates per year. However, since Flathead Lake is less like a “run-of-the-river” system than CDA Lake, FMP focuses on a single deep-water sampling station with much less assessment of spatial variation than occurs at CDA Lake. Similarly, the water quality monitoring program at Lake Tahoe (Box 8-2) provides an excellent example of more effective time series measurements of temperature and dissolved oxygen, it conducts separate monitoring of littoral zones, it monitors both nitrogen and phosphorus and multiple forms of these nutrients, and it uses calibrated models in conjunction with the monitoring data to inform management decisions.
INSTITUTIONAL CONSIDERATIONS
Chapter 2 discussed the reports that IDEQ, the CDA Tribe, the USGS, and EPA produce on a regular basis to summarize and analyze their long-term monitoring data to determine whether the Superfund remedy and the Lake Management Plan (IDEQ and CDA Tribe, 2009) are effective. Trend and special study results need to be published with minimal latency and coordinated among agencies and localities in the watershed and the Lake. That is, they should be published within one year after the end of the time period being evaluated (e.g., trends through water year 2020 should be published sometime in 2021). The publication of trend results needs to be very explicit about the analysis methods that were used, including issues such as treatment of censored data (“less-than” values). This kind of publication is common in other highly visible and highly complex systems such as the Chesapeake Bay, Lake Champlain, Lake Erie, the Mississippi River, and Lake Tahoe.
Chapter 2 also mentioned the many benefits of making water quality data widely available to interested parties, and the agencies involved in data collection are encouraged to provide a mechanism to make the relevant data available to the wider community of stakeholders, agencies, and scientists. Placing the data in an easily accessible platform can increase public trust, and it has the advantage of giving external scientists the chance to do analysis that could provide confirmation of the agency’s own conclusions or open up discussion because of differences in findings among scientists. The river data are already available through such a system (USGS, 2020), but the Lake data are not in a common system. A unified data-management and data-sharing system would need to be created.
Finally, a system such as the Coeur d’Alene should have a process for regularly producing data synthesis products that interpret the spatial and temporal characteristics of the data, with particular attention to trends. The required synthesis tasks are regularly evaluating mass balances, evaluating and explaining concentration trends, estimating exceedances of criteria, generating hypotheses about system drivers, and evaluating the ecological and human health implications of findings. This regular synthesis analysis depends on a robust and long-term monitoring program that collects a variety of physical, chemical and biological data as discussed in this report. The analysis of trends should be applied to the various datasets frequently (e.g., once every two years) using agreed-on methods that have been published in scientific journals. The data analysis methods should have at least these characteristics: (1) they need to be able to capture and evaluate non-monotonic trends, (2) they need to use methods appropriate to censored data (non-detects) where censoring exists, (3) they need to use methods appropriate to seasonal datasets, and (4) they should be designed to resist the potentially confounding effects of sequences of wet and dry years. The methods should be agreed to by a consensus of the organizations involved in long-term action and/or monitoring of the water quality of the Lake and watershed. This does not preclude subjecting the data to new and experimental data-analysis methods, nor should it preclude evolving toward better methods as the field of environmental data-analysis progresses, but there needs to be a basic set of assessment methods that are applied regularly over time.
Evaluation of the success of management actions should be based on monitoring and analysis designed to quantify the impact of those actions on ecosystem health. This is crucial to supporting future steps needed for the improvement of water quality in the Lake and understanding the Lake responses to remediation and shoreline development. Bringing the agencies and stakeholders together on a regular basis (every five years, at minimum) to publish a synthesis on the state of the CDA watershed and Lake and the regional/global changes in conditions would enhance public trust and help point toward agreements among the agencies and stakeholders about future priorities for protection of the Lake. The institutional structure could take many forms, and it should enhance collaboration among federal (USGS, EPA), state (IDEQ, Fish and Game) tribal (CDA Tribe) and academic (University of Idaho and Idaho State University) parties to ensure that resources can be maximized.
CONCLUSIONS AND RECOMMENDATIONS
The main features of the long-term monitoring program for the CDA watershed are carried out in a highly professional manner with good sampling protocols and quality-assurance/quality-control procedures. Although the river sampling has an appropriate level of focus on high-flow sampling and the Lake sampling provides good coverage of the main body of the Lake, the following improvements to the long-term monitoring program are needed
to better understand the water quality changes likely to accompany growth in the region and climate change. This is especially critical given the Lake’s historical importance to the CDA Tribe, its proximity to a major Superfund site, and as the focus of a rapidly expanding regional center (around the city of Coeur d’Alene).
- Understanding of the water quality status of CDA Lake could be improved by increasing the spatial and temporal intensity of sampling in the Lake. The Lake program could expand to encompass littoral areas by (1) establishing a finite number of fixed littoral sites, (2) conducting synoptic sampling of a broader range of littoral sites at one time of year, (3) considering use of remote sensing to better understand dynamics in the littoral zones, and (4) engaging private citizens in data collection. In terms of temporal improvements, monthly sampling can miss important limnological events such as the onset of algal blooms that signal water quality degradation. Although intensifying sampling frequency can add costs, especially for samples that are intensive to process (such as phytoplankton community samples), higher temporal resolution will increase the chances of capturing such short-lived events and allow them to be placed into a broader context of long-term trends. A strategy to increase temporal resolution in Lake sampling can also be achieved by implementation of carefully chosen sensors targeting physical (temperature), chemical (oxygen), and biological (chlorophyll, fluorescence) properties of interest.
- The monitoring strategy for rivers in the CDA watershed could be improved by increasing the sampling frequency, particularly at the upstream and downstream ends of the lower basin, with continued attention to sampling high-flow events (including the first flush). Use of new continuous monitoring strategies, particularly for turbidity, can be of great value to the estimation of transport into and out of the lower CDA River. Knowledge of transport (particularly for lead and phosphorus) will be critical to the design, evaluation, and enhancement of whatever strategies are employed in the future to limit pollutant delivery to the Lake.
- An efficient sampling strategy designed to better understand inputs of nutrients from the lakeshore tributaries would benefit lake management as the population in nearshore areas grows. Since the time this study began, the IDEQ has initiated a strategy to fill this information gap. It will be crucial after a few years of data have been collected to undertake and publish a synthesis of what can be learned from this monitoring of Lake tributaries, and to use that to improve the monitoring network and ongoing analyses. The goal would be to use these new data and geospatial landscape and development data to produce estimates of nutrient fluxes across the majority of the previously unmonitored 16 percent of the CDA Lake watershed.
- The dissolved phosphorus data available for the major tributaries to CDA Lake are of limited quantity and quality due to methodological constraints. Better assessment of the chemical composition and bioavailability of phosphorus entering the Lake from tributaries is needed. That is, knowing what proportion of the total phosphorus load to CDA Lake comes as inorganic particulate phosphorus and the mineralogy of this phosphorus (i.e., if it is bound to aluminum, iron, calcium, lead, etc.) could be very informative for understanding whether these inputs are likely to stimulate primary production and generate organic matter in the Lake. Hence, both total and dissolved phosphorus should be quantified for all samples so that particulate phosphorus concentrations can be estimated. On a few occasions, the mineral composition of the particulate phosphorus fraction should be characterized for each of the main tributaries. The river and Lake sampling programs need to consistently meet a 1 μg/L detection limit for both total and dissolved phosphorus.
- More monitoring of the physical characteristics of CDA Lake would provide information on the transport, mixing, and dilution of dissolved and particulate material (both horizontally and vertically) and insights into the spatial distributions of key variables such as dissolved oxygen, metals, nutrients, and the biota. Time series data provided by in situ sensors on vertical chains, particularly for temperature and dissolved oxygen, would be highly informative. Acoustic Doppler current profilers deployed at the bottom of the Lake could be used to measure water velocity from the bottom to the surface of the Lake. The use of high-resolution, multiparameter profilers that measure temperature, electrical conductivity, dissolved oxygen, turbidity, chlorophyll fluorescence, pH, PAR, and beam attenuation would complement the vertical instrument chain data.
- Monitoring of water-column metal enrichment is adequate and must be sustained. Greater attention to detection limits, interlaboratory comparisons, periodic evaluation of total particulate metal, and “total recoverable” treatments would benefit the existing programs. Quantifying the differences between traditional dissolved concentrations and colloidal concentrations, at least during periods of elevated discharge, could reduce uncertainties about the forms of metal in the dissolved fraction. Periodic calculation of dissolved metal speciation might also reduce uncertainties about metal bioavailability during high discharge events. Support for the monitoring program and coordination among jurisdictions are necessary priorities into the future as changes in the Lake manifest.
- As mentioned in Chapter 7, new data on sediment cores could help to better understand the spatial distributions of metal contamination and trends through time. Understanding the effects of metals on the benthic food web of the Lake requires more granular information on metals contamination of sediments as a function of water depth, hydrodynamics and other drivers, including the location of hot spots. Knowledge on the spatial patterns of lead contamination in littoral sediments and historically flooded soils could aid anticipating human exposure pathways.
- Important ecological components of the Lake are understudied. Targeted expansion of ecological monitoring beyond the phytoplankton community could help identify how ecological processes in the Lake are responding to changing metal and nutrient concentrations. Obvious questions relate to the effects of the legacy of metal enrichment on the pelagic and benthic food webs as well as the status of fish populations in parts of the Lake with different exposures to metals and different water-column communities (e.g., algal communities). Data on zooplankton, phytoplankton, and bacterioplankton taxonomic composition and dynamics are notably limited. There is very little monitoring of higher trophic levels (zooplankton, fish), nor are there focused studies of ecological interactions such as food web structure or benthic–pelagic coupling.
- The agencies involved in data collection are encouraged to provide a mechanism to make the relevant data available to the wider community of stakeholders, agencies, and scientists. The river data are already available through such a system, but the Lake data are not. A common data repository, mechanisms to facilitate data sharing, and regular discussions of data interpretations among interested parties would benefit the lake-wide syntheses necessary to anticipate changes into the future (see below).
- To succeed at adaptively managing the Lake for decades into the future, a scientific and institutional structure for carrying out data synthesis, coordinated among jurisdictions and interest groups, is needed. The synthesis tasks undertaken should be to regularly evaluate mass balances, relate concentration trends to lake processes and inputs, generate hypotheses about system drivers, and periodically evaluate the ecological and human health implications of the findings. Lake-wide monitoring with the goal of evaluating change and management into the future can only benefit from improved coordination among all the parties.
REFERENCES
Balistrieri, L. S., J. W. Murray, and B. Paul. 1994. The geochemical cycling of trace elements in a biogenic meromictic lake. Geochim. Cosmochim. ACTA 58(19):3993–4008.
Balistrieri, L., S. Box, A. Bookstrom, R. Hooper, and J. Mahoney. 2002. Impacts of Historical Mining in the Coeur d’Alene River Basin. Chapter 6 In: Pathways of Metal Transfer from Mineralized Sources to Bioreceptors: A Synthesis of the Mineral Resources Program’s Past Environmental Studies in the Western United States and Future Research Directions. USGS Bulletin 2191. L. S. Balistrieri and L. L. Stillings, eds.
Balistrieri, L. S., and R. G. Blank. 2008. Dissolved and labile concentrations of Cd, Cu, Pb, and Zn in the South Fork Coeur d’Alene River, Idaho: Comparisons among chemical equilibrium models and implications for biotic ligand models. Appl. Geochem. 23:3355–3371.
Chanat, J. G., D. L. Moyer, J. D. Blomquist, K. E. Hyer, and M. J. Langland. 2016. Application of a weighted regression model for reporting nutrient and sediment concentrations, fluxes, and trends in concentration and flux for the Chesapeake Bay Non-tidal Water-Quality Monitoring Network, results through water year 2012. U.S. Geological Survey Scientific Investigations Report 2015–5133. http://dx.doi.org/10.3133/sir20155133.
Chess, D. 2021. Water Quality Data Summary. Presentation to the NASEM Committee. February 26, 2021.
Coats, R., J. Lewis, N. Alvarez, and P. Arneson. 2016. Temporal and Spatial Trends in Nutrient and Sediment Loading to Lake Tahoe, California-Nevada, USA. JAWRA 52(6):1347–1365.
EcoAnalysts, Inc. 2017. Couer d’Alene Lake Management Plan 2011-2015 Benthic Survey Summary Report. Prepared for Idaho Department of Environmental Quality.
Ellis, B. K., J. A. Stanford, D. Goodman, C. P. Stafford, D. L. Gustafson, D. A. Beauchamp, D. W. Chess, J. A. Craft, M. A. Deleray, and B. S. Hansen. 2011. Long-term effects of a trophic cascade in a large lake ecosystem. Proceedings of the National Academy of Sciences 108(3):1070–1075. https://doi.org/10.1073/pnas.1013006108.
EPA. 2020. Adaptive Management Project Management Plan for the Lower Basin of the Bunker Hill Mining and Metallurgical Complex, Shoshone County, Idaho. 20-019(E)/041320.
Gilroy, E. J., R. M. Hirsch, and T. A. Cohn. 1990. Mean-square error of regression-based constituent transport estimates. Water Resources Research 26(9):2069–2077.
Harrington, J. M., M. J. LaForce, W. C. Rember, S. E. Fendorf, and R. F. Rosenzweig. 1998. Phase associations and mobilization of iron and trace elements in Coeur d’Alene Lake, Idaho. Environ. Sci. Technol. 32(5):650–656.
Horowitz, A. J., K. A. Elrick, and R. B. Cook. 1993. Effect of mining and related activities on the sediment trace element geochemistry of Lake Coeur d’Alene, Idaho, USA. Part I: surface sediments. Hydrol. Process. 7:403–423.
Horowitz, A. J., K. A. Elrick, J. A. Robbins, and R. B. Cook. 1995. Effect of mining related activities on the sediment trace element geochemistry of Lake Coeur d’Alene, Idaho, USA part II: subsurface sediments. Hydrol. Process. 9:35–54. https://doi.org/10.1002/hyp.3360090105.
IDEQ and CDA Tribe (Idaho Department of Environmental Quality and the Coeur d’Alene Tribe). 2009. Coeur d’Alene Lake Management Plan.
IDEQ and CDA Tribe. 2020. Coeur d’Alene Lake Management Program: Total Phosphorus Nutrient Inventory, 2004–2013.
Kimball, B. A. 1997. Use of tracer injections and synoptic sampling to measure metal loading from acid mine drainage. USGS Fact Sheet 245-96. https://doi.org/10.3133/fs24596.
Kuwabara, J. S., P. F. Woods, W. M. Berelson, L. S. Balistrieri, J. L. Carter, B. R. Topping, and S. V. Fend. 2003. Importance of sediment-water interactions in Coeur d’Alene Lake, Idaho, USA: management implications. Environmental Management 32:348–359. https://doi.org/10.1007/s00267-003-0020-7.
Kuwabara, J. S., B. R. Topping, P. F. Woods, J. L. Carter, and S. W. Hager. 2006. Interactive effects of dissolved zinc and orthophosphate on phytoplankton from Coeur d’Alene Lake, Idaho. USGS Scientific Investigations Report 2006–5091. http://pubs.usgs.gov/sir/2006/5091.
Kuwabara, J. S., Topping, B. R., Woods, P. F., and J. L. Carter. 2007. Free zinc ion and dissolved orthophosphate effects on phytoplankton from Coeur d’Alene Lake, Idaho. Environ. Sci. Technol. 41(8):2811–2817. https://doi.org/10.1021/es062923l.
Lee, C. J., R. M. Hirsch, and C. G. Crawford. 2019. An evaluation of methods for computing annual water-quality loads. U.S. Geological Survey Scientific Investigations Report 2019–5084. https://doi.org/10.3133/sir20195084.
MacIntyre, S., J. P. Fram, P. J. Kushner, N. D. Bettez, W. J. O’Brien, J. E. Hobbie, and G. W. Kling. 2009. Climate-related variations in mixing dynamics in an Alaskan arctic lake. Limnol. Oceanogr. 54(6, part 2):2401–2417.
Marcé, R., G. George, P. Buscarinu, M. Deidda, J. Dunalska, E. de Eyto, G. Flaim, H.-P. Grossart, V. Istvanovics, M. Lenhardt, E. Moreno-Ostos, B. Obrador, I. Ostrovsky, D. C. Pierson, J. Potužák, S. Poikane, K. Rinke, S. Rodríguez-Mozaz, P. A. Staehr, K. Šumberová, G. Waajen, G. A. Weyhenmeyer, K. C. Weathers, M. Zion, B. W. Ibelings, and E. Jennings. 2016. Automatic high frequency monitoring for improved lake and reservoir management. Environ. Sci. Technol. 50(20):10780–10794.
Meinson, P., A. Idrizaj, P. Nõges, T. Nõges, and A. Laas. 2016. Continuous and high-frequency measurements in limnology: history, applications, and future challenges. Environmental Reviews 24(1). https://doi.org/10.1139/er-2015-0030.
Morra, M. J., M. M. Carter, W. C. Rember, and J. M. Kaste. 2015. Reconstructing the history of mining and remediation in the Coeur d’Alene, Idaho Mining District using lake sediments. Chemosphere 134:319–327. https://doi.org/10.1016/j.chemosphere.2015.04.055.
Oelsner, G. P., L. A. Sprague, J. C. Murphy, R. E. Zuellig, H. M. Johnson, K. R. Ryberg, J. A. Falcone, E. G. Stets, A. V. Vecchia, M. L. Riskin, L. A. De Cicco, T. J. Mills, and W. H. Farmer. 2017. Water-quality trends in the Nation’s rivers and streams, 1972–2012: Data preparation, statistical methods, and trend results (ver. 2.0, October 2017). U.S. Geological Survey Scientific Investigations Report 2017–5006. https://doi.org/10.3133/sir20175006.
Roberts, D. C., G. C. Egan, A. L. Forrest, J. L. Largier, F. A. Bombardelli, B. E. Laval, S. G. Monismith, and S. G. Schladow. 2020. The setup and relaxation of spring upwelling in a deep, rotationally influenced lake. Limnol. Oceanogr. 66(4):1168–1189.
Scofield, B. D., K. Torso, S. F. Fields, and D W. Chess. 2021. Contaminant metal concentrations in three species of aquatic macrophytes from the Coeur d’Alene Lake basin, USA. Environ. Monit. Assess. 193:683. https://doi.org/10.1007/s10661-021-09488-y.
Smith, D. W., and R. C. Naranjo. 2021. Model Archive Summaries for Fine Sediment Particles Surrogate Regression Models, Lake Tahoe, California and Nevada: U.S. Geological Survey data release.
Spencer, C. N., B. R. McClelland, and J. A. Stanford. 1991. Shrimp stocking, salmon collapse and eagle displacement: Cascading interactions in the food web of a large aquatic ecosystem. Bioscience 41:14–21.
Sprague, L. A. 2001. Effects of storm-sampling frequency on estimation of water-quality loads and trends in two tributaries to Chesapeake Bay in Virginia: U.S. Geological Survey Water- Resources Investigations Report 2001–4136.
Toevs, G. R., M. J. Morra, M. L. Polizzotto, D. G. Strawn, B. C. Bostick, and S. Fendorf. 2006. Metal(loid) diagenesis in mine-impacted sediments of Lake Coeur d’Alene, Idaho. Environ. Sci. Technol. 40(8):2537–2543. https://doi.org/10.1021/es051781c.
USGS (U.S. Geological Survey). 2020. National Water Information System (NWIS): U.S. Geological Survey, web interface, accessed January 2022. https://waterdata.usgs.gov/nwis.
UC Davis. 2021. Tahoe: State of the Lake Report. https://tahoe.ucdavis.edu/stateofthelake.
Vander Zanden, M. J., and Y. Vadeboncoeur. 2002. Fishes as integrators of benthic and pelagic food webs in lakes. Ecology 83(8):2152–2161.
Ward, N. K., J. A. Brentrup, D. C. Richardson, K. C. Weathers, P. C. Hanson, R. J. Hewett, and C. C. Carey. 2022. Dynamics of the stream–lake transitional zone affect littoral lake metabolism. Aquat. Sci. 84:31. https://doi.org/10.1007/s00027-022-00854-7.
This page intentionally left blank.


