National Academies Press: OpenBook

The Future of Water Quality in Coeur d'Alene Lake (2022)

Chapter: Appendix A: Coeur d'Alene Watershed Analysis Methodology for Metals and Nutrients

« Previous: Acronyms
Suggested Citation:"Appendix A: Coeur d'Alene Watershed Analysis Methodology for Metals and Nutrients." National Academies of Sciences, Engineering, and Medicine. 2022. The Future of Water Quality in Coeur d'Alene Lake. Washington, DC: The National Academies Press. doi: 10.17226/26620.
×

Appendix A

Coeur d’Alene Watershed Analysis Methodology for Metals and Nutrients

This appendix details the committee’s methodological analysis of the history of concentration and fluxes from the Coeur d’Alene (CDA) Lake watershed described in Chapter 3. The committee’s analysis uses the statistical method known as Weighted Regressions on Time, Discharge, and Season (WRTDS; Hirsch et al., 2010) to make inferences about concentration and flux, on a daily time step, based on the types of records that are typically available in the rivers of the CDA Lake watershed (typically on the order of 250 observations for each of the key contaminants at a given monitoring location over nearly three decades). WRTDS has been used extensively for many river systems in the United States, including in this watershed (see Zinsser, 2020).

The WRTDS model uses statistical smoothing in order to partition the variations in concentration into components that are related to (1) season of the year, (2) watershed hydrologic condition (characterized by the daily mean discharge on the day of sample collection), (3) long-term trend, and (4) a random component (the unexplained portion of the variation). The analysis in Chapter 3 considered six U.S. Geological Survey (USGS) monitoring locations, shown in Figure A-1 and described in Table A-1.

Suggested Citation:"Appendix A: Coeur d'Alene Watershed Analysis Methodology for Metals and Nutrients." National Academies of Sciences, Engineering, and Medicine. 2022. The Future of Water Quality in Coeur d'Alene Lake. Washington, DC: The National Academies Press. doi: 10.17226/26620.
×
Image
FIGURE A-1 Map of the CDA River watershed showing the locations of six river gages used in the following analysis of metals and nutrients concentration and flux trends. SOURCE: Zinsser (2020).

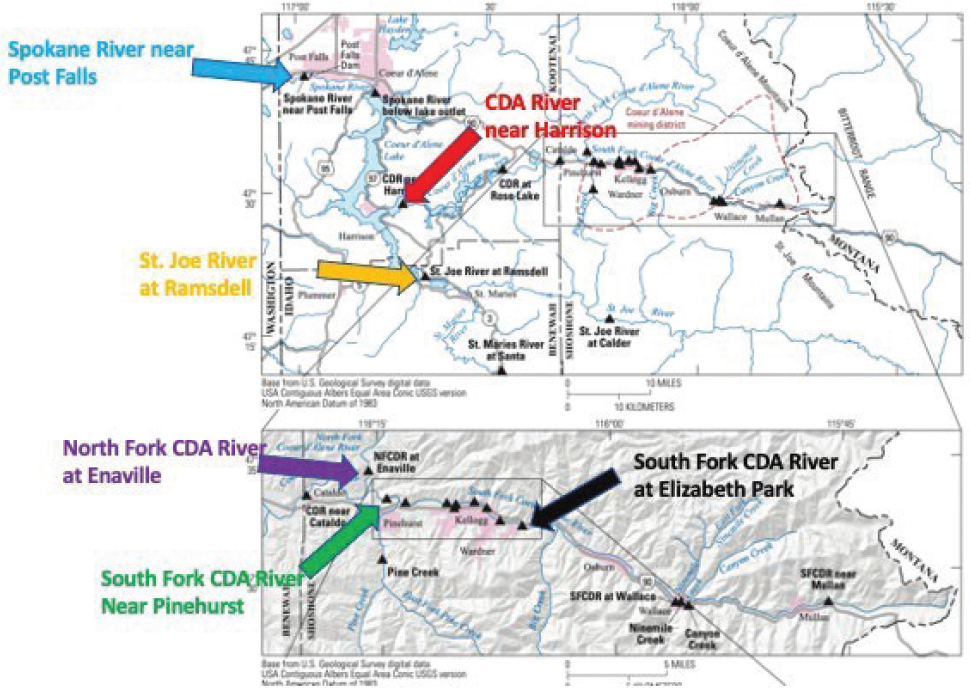
TABLE A-1 Station Codes for USGS Data Used in WRTDS Analysis

Gage Location Station Code
NF CDA River at Enaville 12413000
SF CDA River at Elizabeth Park 12413210
SF CDA River near Pinehurst 12413470
CDA River near Cataldo 12413500
CDA River near Harrison 12413860a
St. Joe River at Ramsdell near St. Maries 12415135 (also 12415140)
Spokane River below Lake Outlet at Coeur d’Alene 12417610 (for water quality)
Spokane River near Post Falls 12419000 (for discharge)

a Recent record uses acoustic velocity meter discharge measurements; earlier records are based on a model that relies on stage data at Cataldo and at the Lake outlet along with channel geometry data to produce a discharge record (see discussion of this and other adjustments in Zinsser, 2020).

NOTE: NF = North Folk; SF = South Fork.

Suggested Citation:"Appendix A: Coeur d'Alene Watershed Analysis Methodology for Metals and Nutrients." National Academies of Sciences, Engineering, and Medicine. 2022. The Future of Water Quality in Coeur d'Alene Lake. Washington, DC: The National Academies Press. doi: 10.17226/26620.
×

TABLE A-2 Parameter Codes for All USGS Water Quality Data Used in WRTDS Calculations

Parameter name Parameter code
Total P 00665
Dissolved P 00671
Total N 00060
Dissolved NO2+NO3 00631
Suspended Sediment 80154
Total Cd 01027
Dissolved Cd 01025
Total Pb 01051
Dissolved Pb 01049
Total Zn 01092
Dissolved Zn 01090

NOTE: Cd = cadmium, N = nitrogen, NO2 = nitrite, NO3 = nitrate, P = phosphorus, Pb = lead, and Zn = zinc.

DESCRIPTION OF RIVER TREND CALCULATIONS

All of the river water quality trend results are developed using the USGS EGRET 3.0.7 open source software package. The R packages involved can all be downloaded for free from CRAN1 (The Comprehensive R Archive Network). The details of the methods discussed below are described in the USGS EGRET User Guide (Hirsch and De Cicco, 2015), including the method of downloading the data from the USGS Web Service. Additionally, the Kalman filter estimates of daily fluxes use a method described by Zhang and Hirsch (2019), and further information on the Kalman filter estimates is provided at the EGRET web page for WRTDSKalman.2 An illustrative example calculation is provided below for total phosphorus trends at the South Fork of the CDA River near Pinehurst (full list of parameter codes described in Table A-2).

The uncertainty calculations are done using the EGRETci package3 (EGRETci 2.0.4) described by Hirsch and De Cicco (2015). Examples of these calculations are provided below. The determination of the color of the cells in the Chapter 3 summary tables (e.g., Table 3-9) is based on the likelihood results described below. The example provided below is 200 replicates, which is typical of the analyses in the report; however, for less exact results, 50 replicates could be used.

Total Phosphorus Trends Calculation Example

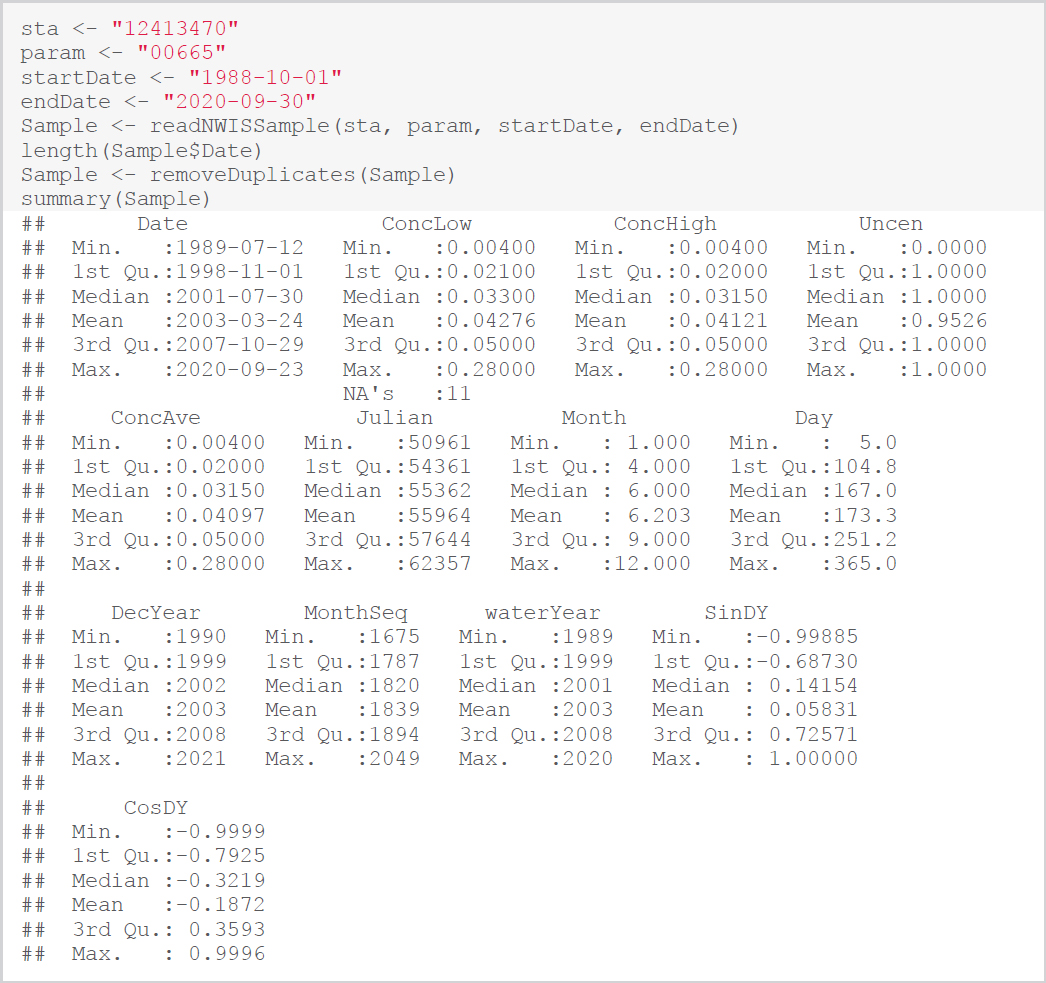
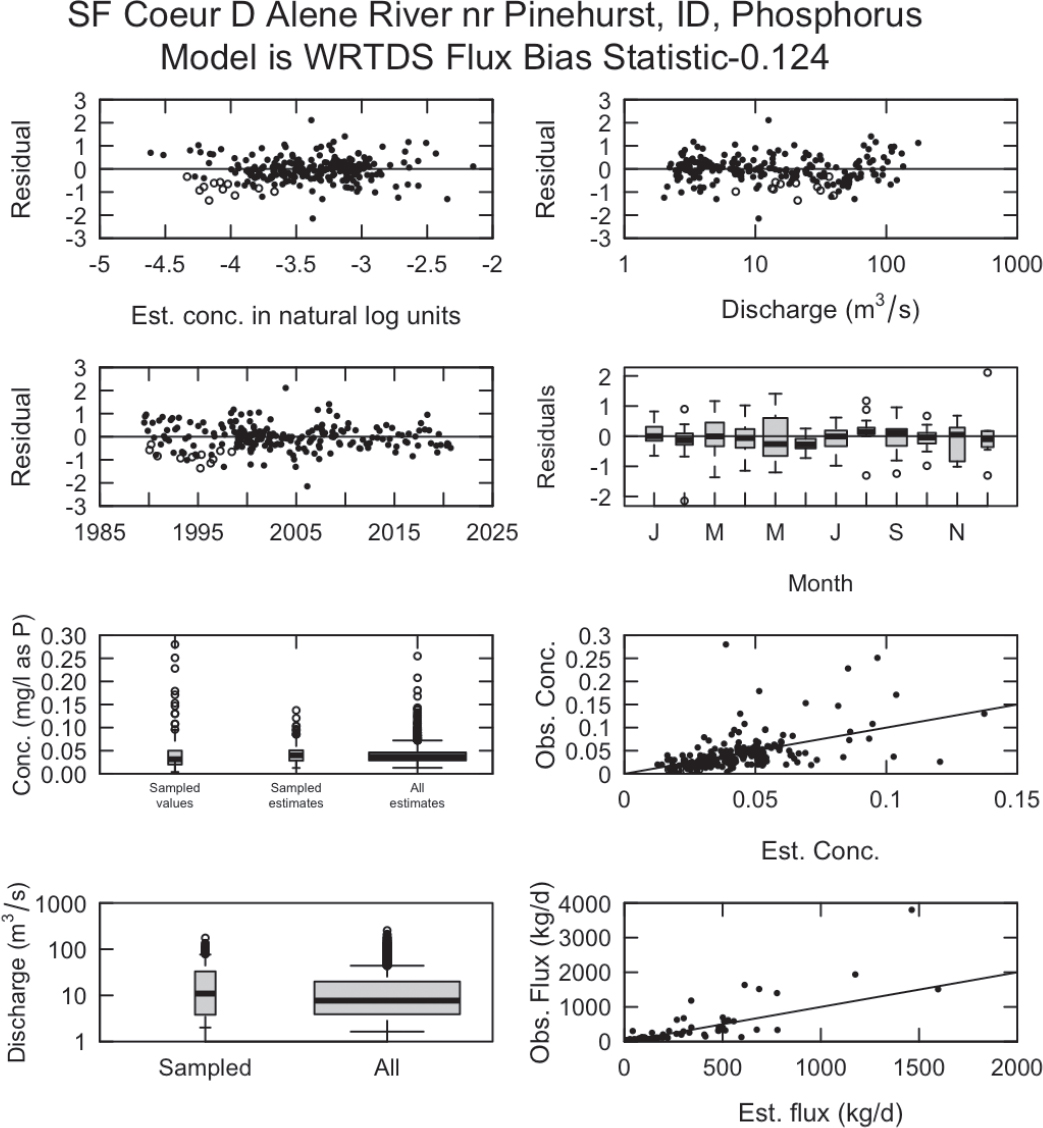
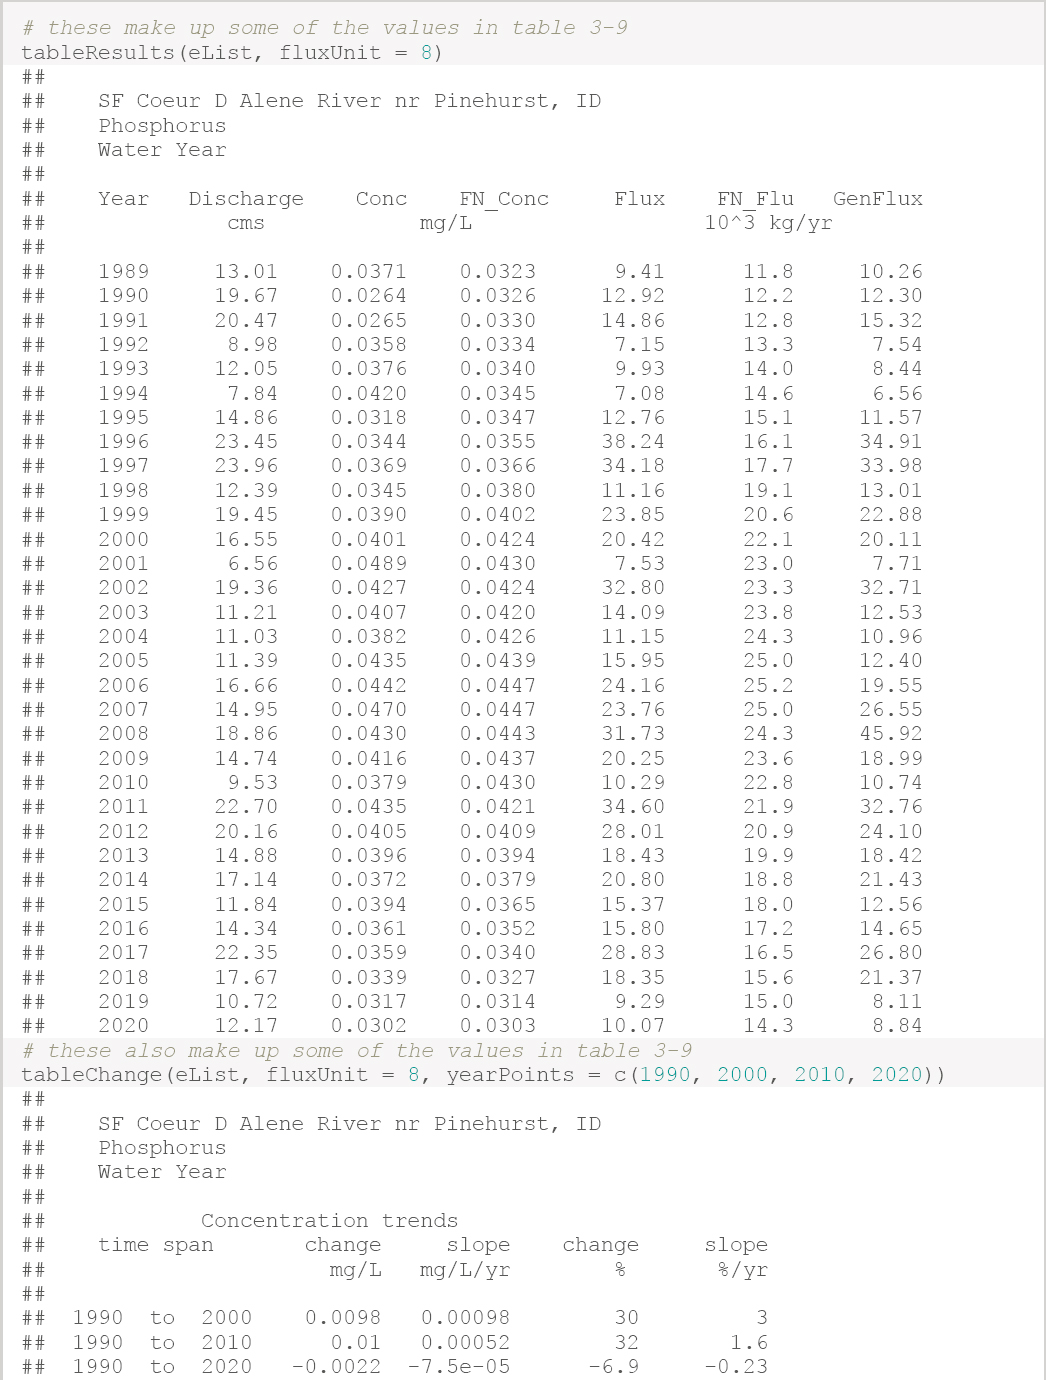
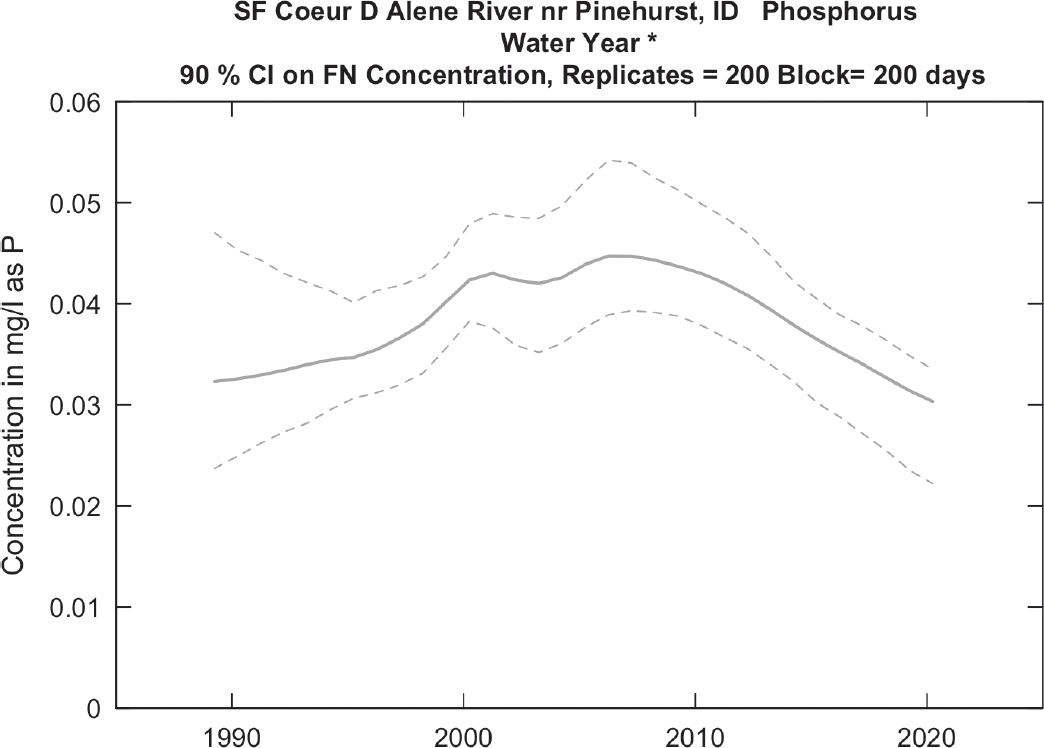
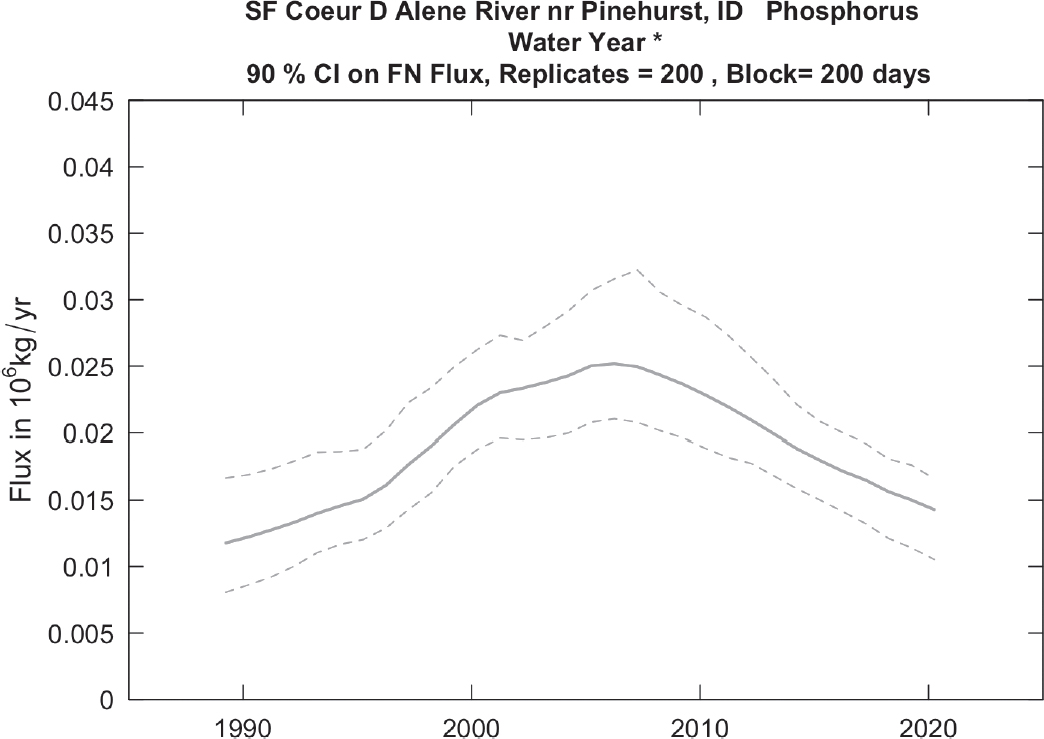
An illustrative example is provided here to step through calculations of total phosphorus (parameter code 00665) trends at CDA River near Pinehurst (station 12413470) from October 1988 to September 2020. R scripts, commands, and printouts are provided below, with the corresponding results shown in Figures A-2 to A-8.

___________________

1 https://cran.rstudio.com/web/packages/index.html

2 http://usgs-r.github.io/EGRET/articles/WRTDSK.html

3 http://usgs-r.github.io/EGRETci/

Suggested Citation:"Appendix A: Coeur d'Alene Watershed Analysis Methodology for Metals and Nutrients." National Academies of Sciences, Engineering, and Medicine. 2022. The Future of Water Quality in Coeur d'Alene Lake. Washington, DC: The National Academies Press. doi: 10.17226/26620.
×

Retrieve Data from USGS Web Service

Image

Suggested Citation:"Appendix A: Coeur d'Alene Watershed Analysis Methodology for Metals and Nutrients." National Academies of Sciences, Engineering, and Medicine. 2022. The Future of Water Quality in Coeur d'Alene Lake. Washington, DC: The National Academies Press. doi: 10.17226/26620.
×

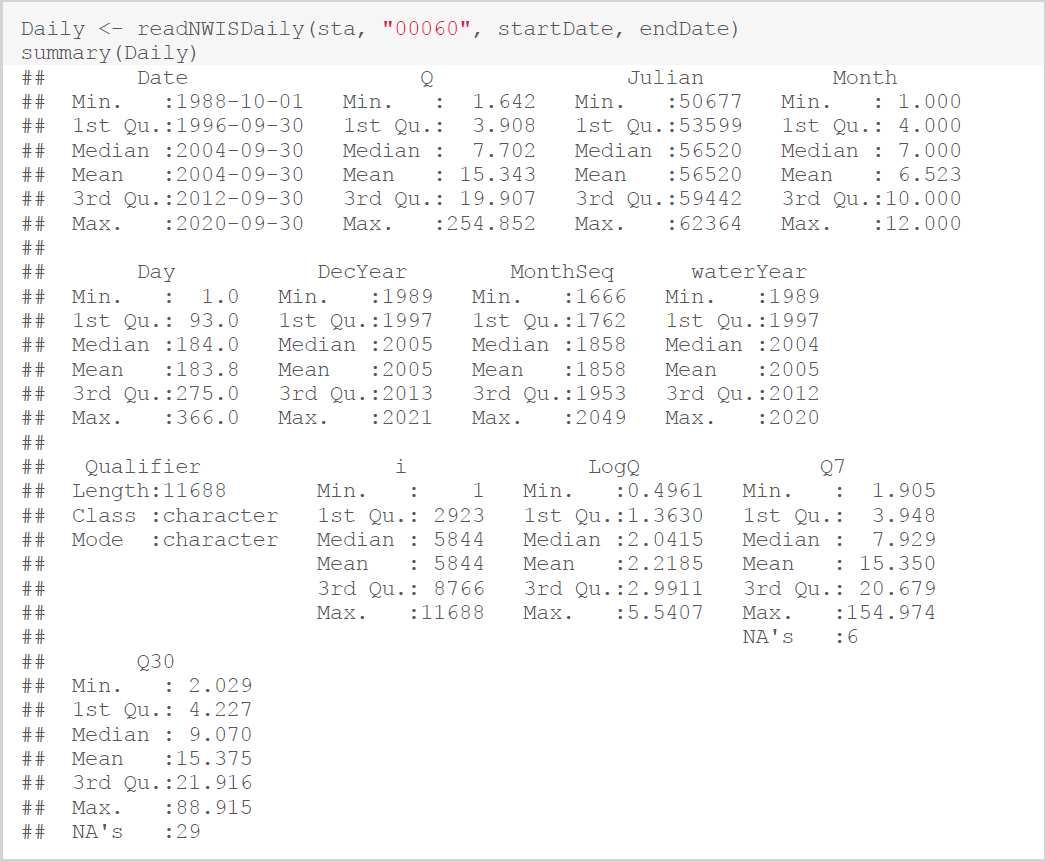
Retrieve Daily Discharge Data (code “00060”)

Image

Suggested Citation:"Appendix A: Coeur d'Alene Watershed Analysis Methodology for Metals and Nutrients." National Academies of Sciences, Engineering, and Medicine. 2022. The Future of Water Quality in Coeur d'Alene Lake. Washington, DC: The National Academies Press. doi: 10.17226/26620.
×

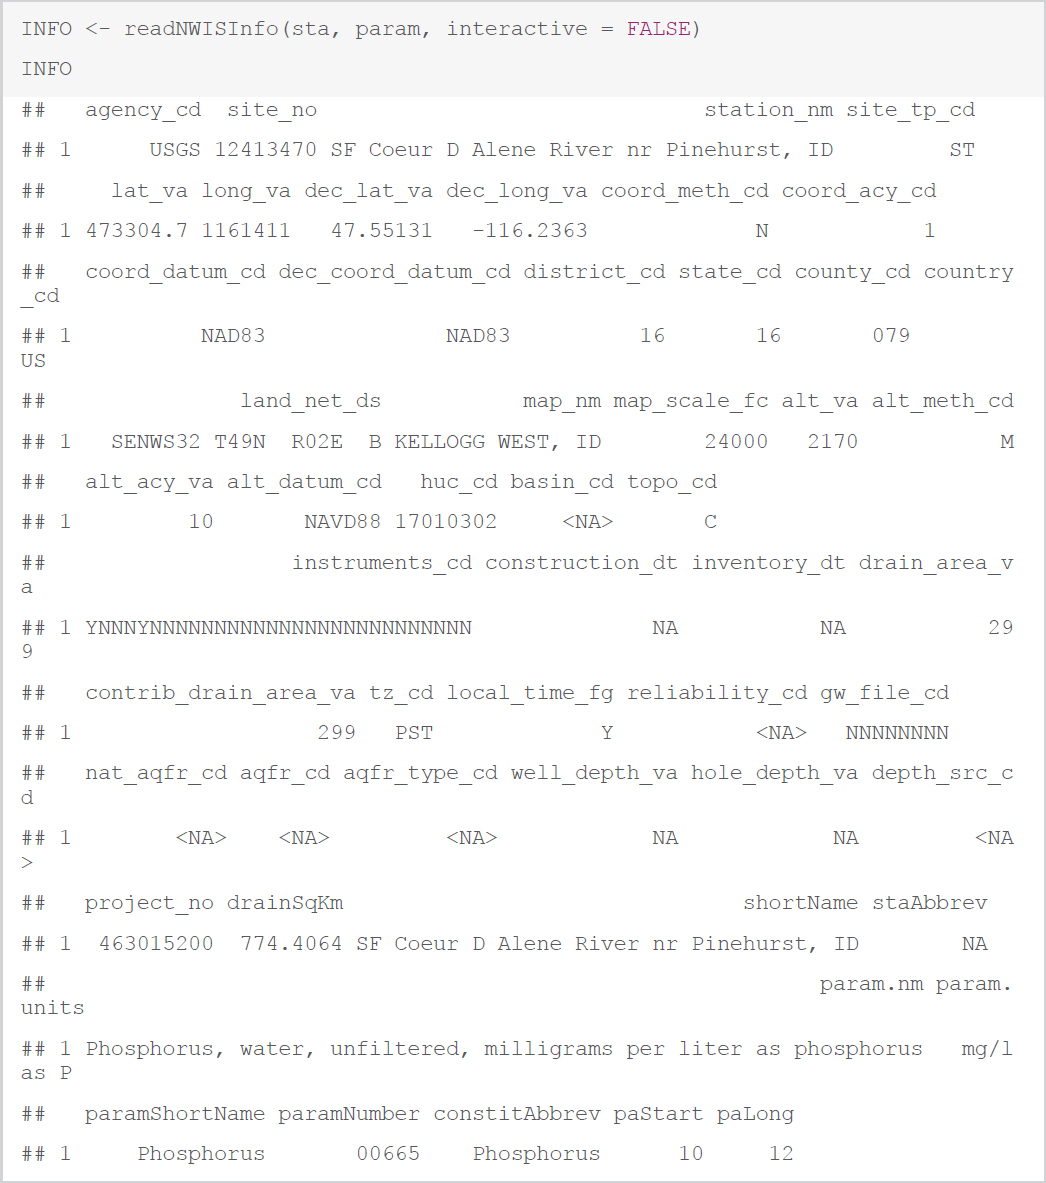
Retrieve the Metadata

Image

Suggested Citation:"Appendix A: Coeur d'Alene Watershed Analysis Methodology for Metals and Nutrients." National Academies of Sciences, Engineering, and Medicine. 2022. The Future of Water Quality in Coeur d'Alene Lake. Washington, DC: The National Academies Press. doi: 10.17226/26620.
×

Create the eList and Estimate the WRTDS Model

Image

Suggested Citation:"Appendix A: Coeur d'Alene Watershed Analysis Methodology for Metals and Nutrients." National Academies of Sciences, Engineering, and Medicine. 2022. The Future of Water Quality in Coeur d'Alene Lake. Washington, DC: The National Academies Press. doi: 10.17226/26620.
×
Image
FIGURE A-2 WRTDS-generated plots of total phosphorus at the South Fork of the CDA River near Pinehurst showing discharge versus concentration (top left), concentration time series (top right), concentration binned by month of the year (bottom left), and boxplots of the discharge data (bottom right).

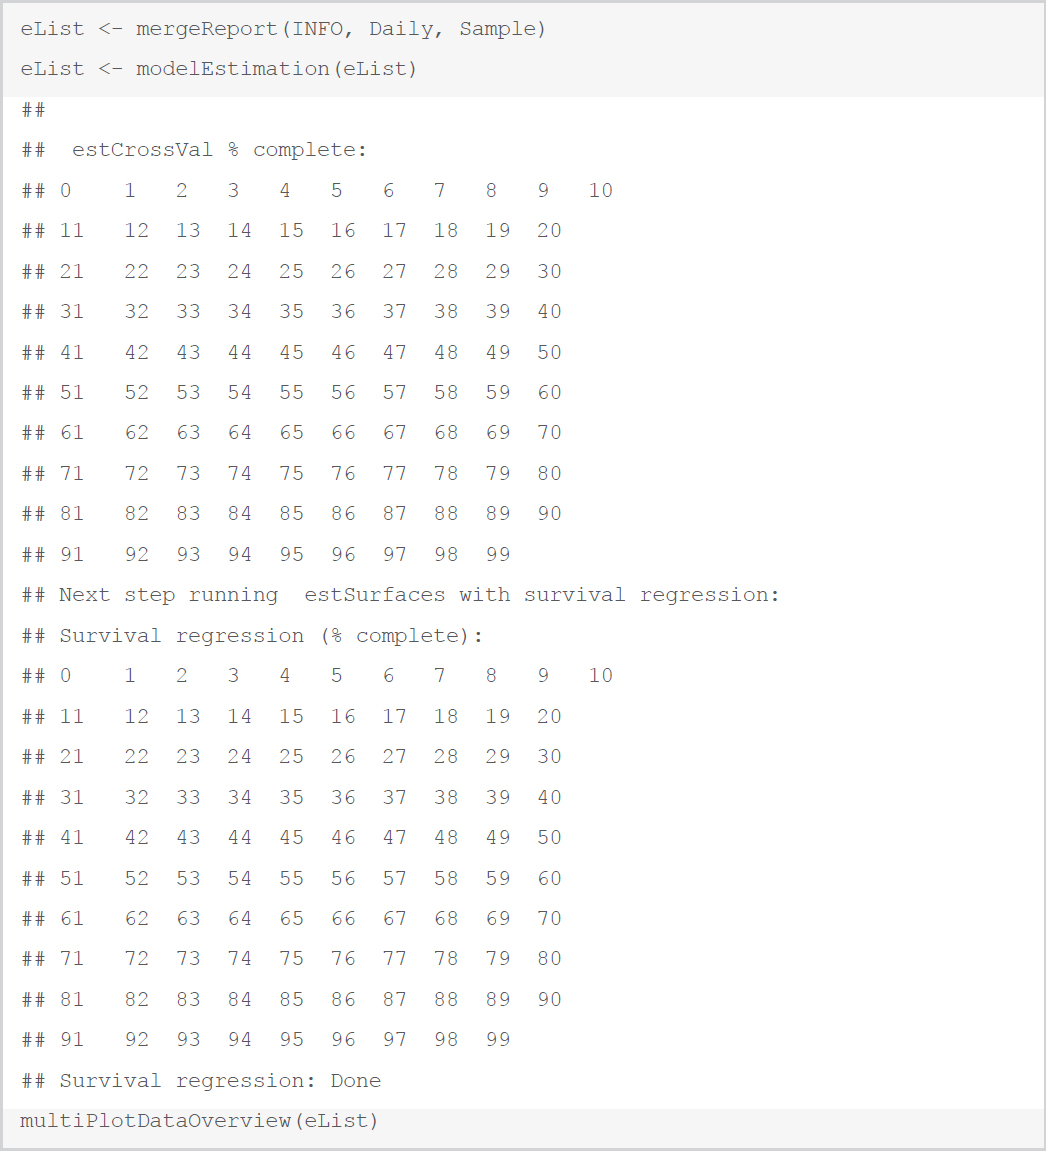
Calculate Error Statistics

Image

Suggested Citation:"Appendix A: Coeur d'Alene Watershed Analysis Methodology for Metals and Nutrients." National Academies of Sciences, Engineering, and Medicine. 2022. The Future of Water Quality in Coeur d'Alene Lake. Washington, DC: The National Academies Press. doi: 10.17226/26620.
×
Image
FIGURE A-3 WRTDS-generated plots of total phosphorus at the South Fork of the CDA River near Pinehurst showing discharge versus concentration (top left), concentration time series (top right), concentration binned by month of the year (bottom left), and boxplots of the discharge data (bottom right). The same plots as shown in Figure A-2, shown here with random realization of censored values.

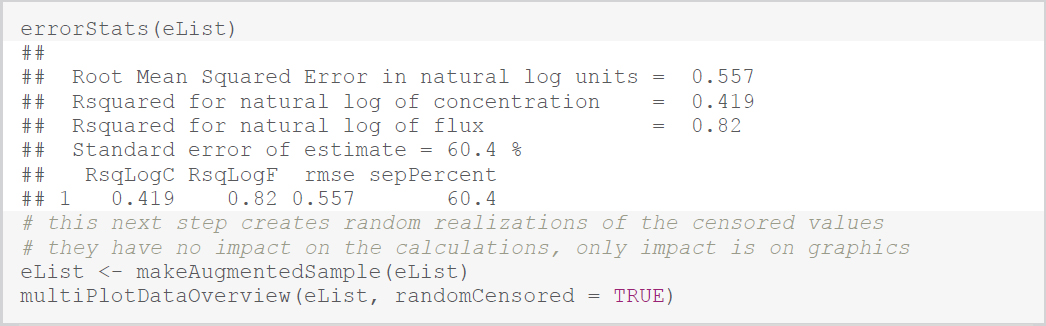
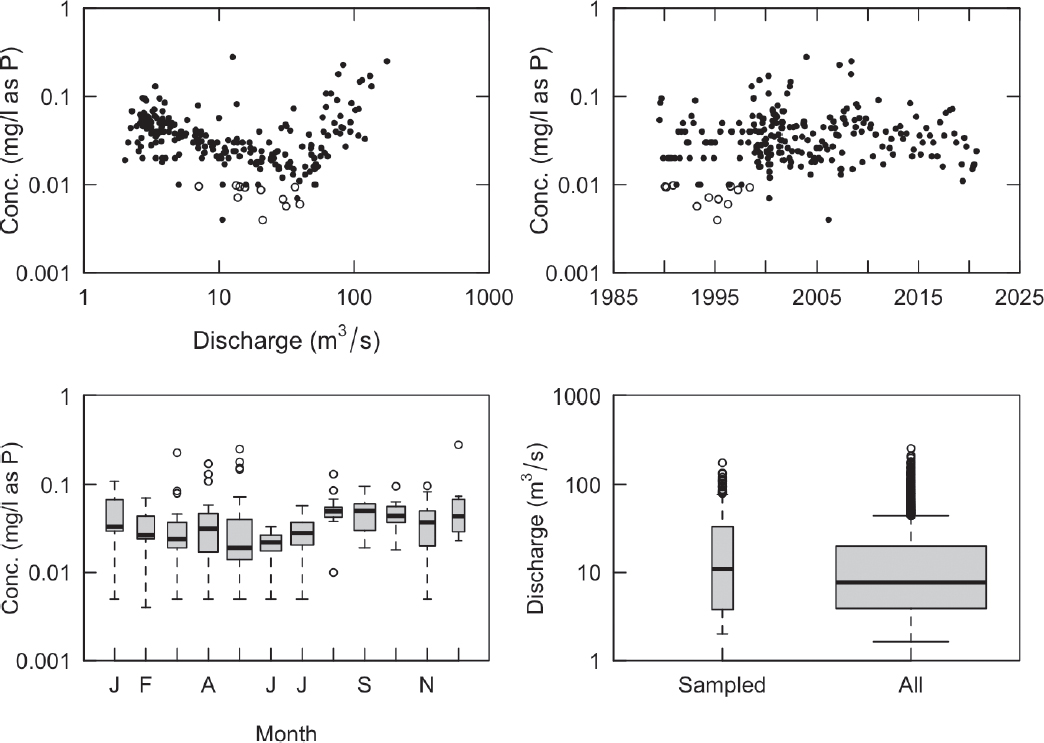
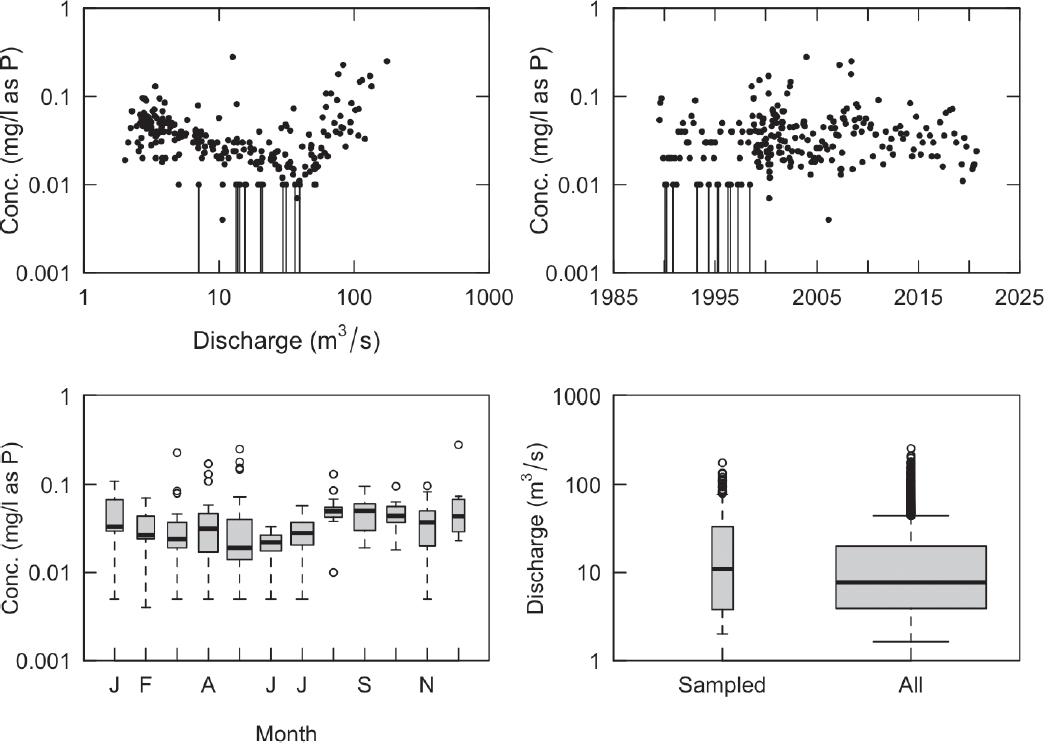
Additional Diagnostic Figures

Image

Suggested Citation:"Appendix A: Coeur d'Alene Watershed Analysis Methodology for Metals and Nutrients." National Academies of Sciences, Engineering, and Medicine. 2022. The Future of Water Quality in Coeur d'Alene Lake. Washington, DC: The National Academies Press. doi: 10.17226/26620.
×
Image
FIGURE A-4 Additional set of statistical diagnostic plots for total phosphorus trends at the South Fork (SF) of the CDA River near Pinehurst.
Suggested Citation:"Appendix A: Coeur d'Alene Watershed Analysis Methodology for Metals and Nutrients." National Academies of Sciences, Engineering, and Medicine. 2022. The Future of Water Quality in Coeur d'Alene Lake. Washington, DC: The National Academies Press. doi: 10.17226/26620.
×

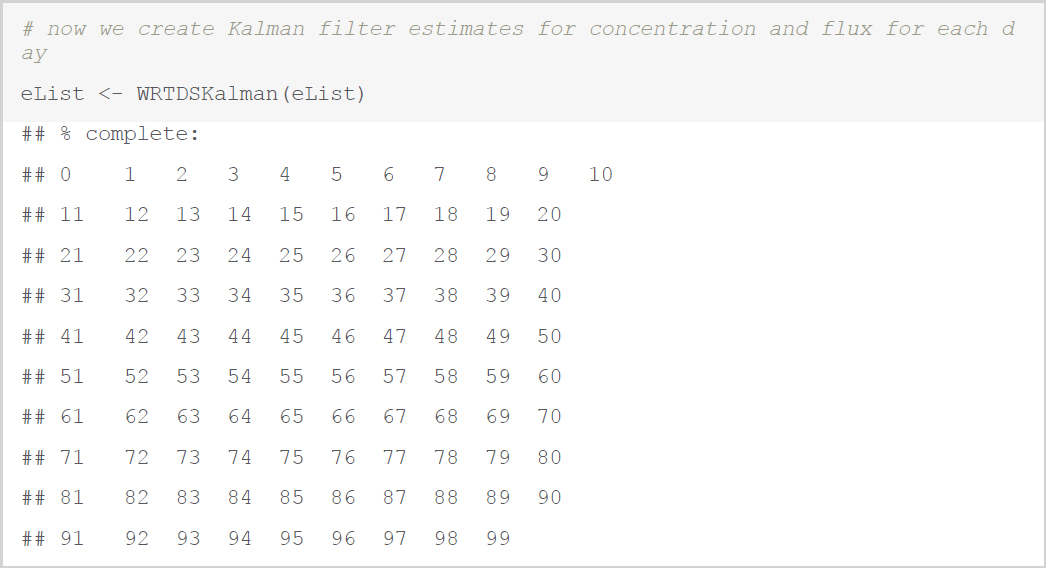
Kalman Filter Estimates for Concentration and Flux for Each Day

Image

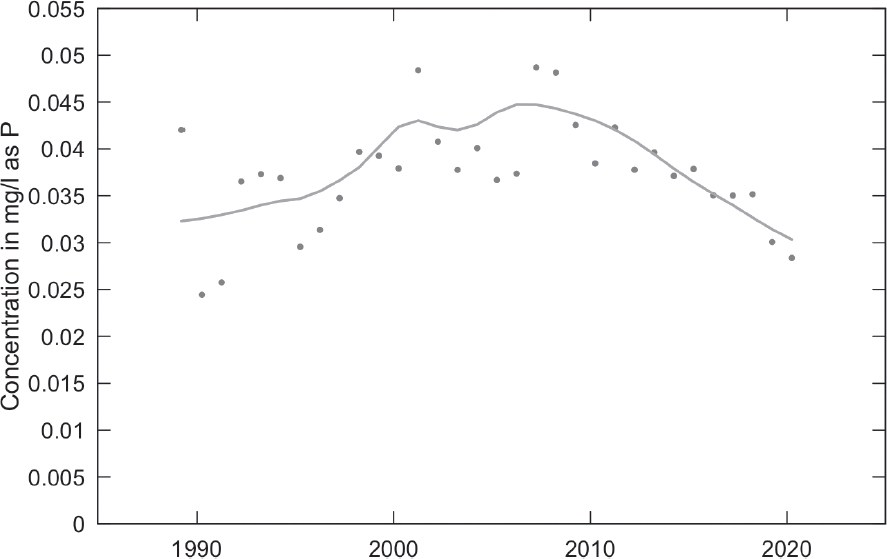
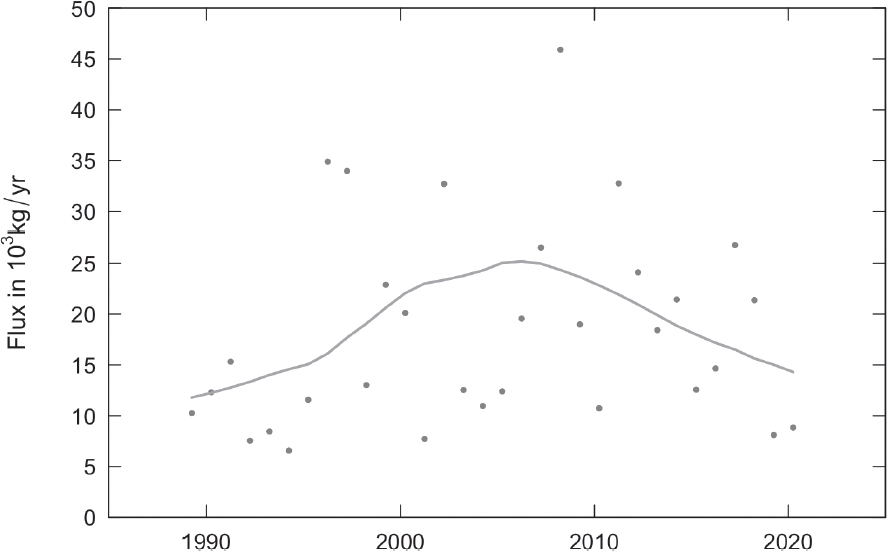
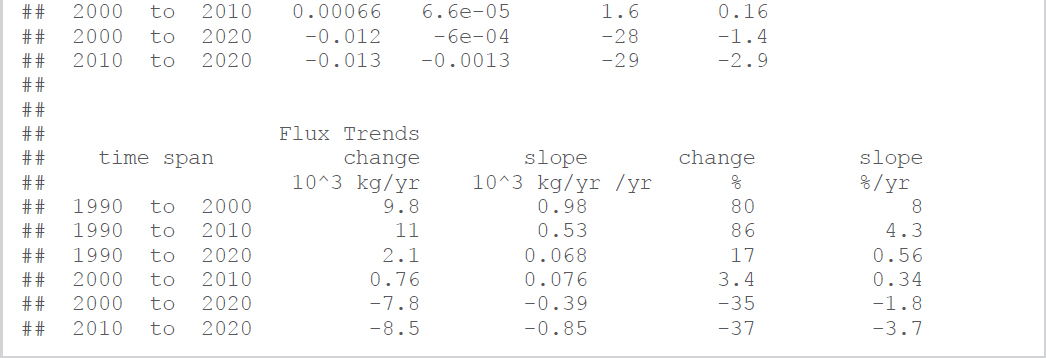
Plot Trend Results and Create Summary Table of Trends (such as Table 3-9)

Image

Suggested Citation:"Appendix A: Coeur d'Alene Watershed Analysis Methodology for Metals and Nutrients." National Academies of Sciences, Engineering, and Medicine. 2022. The Future of Water Quality in Coeur d'Alene Lake. Washington, DC: The National Academies Press. doi: 10.17226/26620.
×
Image
FIGURE A-5 Total phosphorus concentration as a function of water year at the South Fork of the CDA River near Pinehurst. Dots show the mean and the line shows the flow-normalized concentration.

Image

Image
FIGURE A-6 Total phosphorus flux as a function of water year at the South Fork of the CDA River near Pinehurst. Dots show the mean and the line shows the flow-normalized flux estimate.
Suggested Citation:"Appendix A: Coeur d'Alene Watershed Analysis Methodology for Metals and Nutrients." National Academies of Sciences, Engineering, and Medicine. 2022. The Future of Water Quality in Coeur d'Alene Lake. Washington, DC: The National Academies Press. doi: 10.17226/26620.
×

Image

Suggested Citation:"Appendix A: Coeur d'Alene Watershed Analysis Methodology for Metals and Nutrients." National Academies of Sciences, Engineering, and Medicine. 2022. The Future of Water Quality in Coeur d'Alene Lake. Washington, DC: The National Academies Press. doi: 10.17226/26620.
×

Image

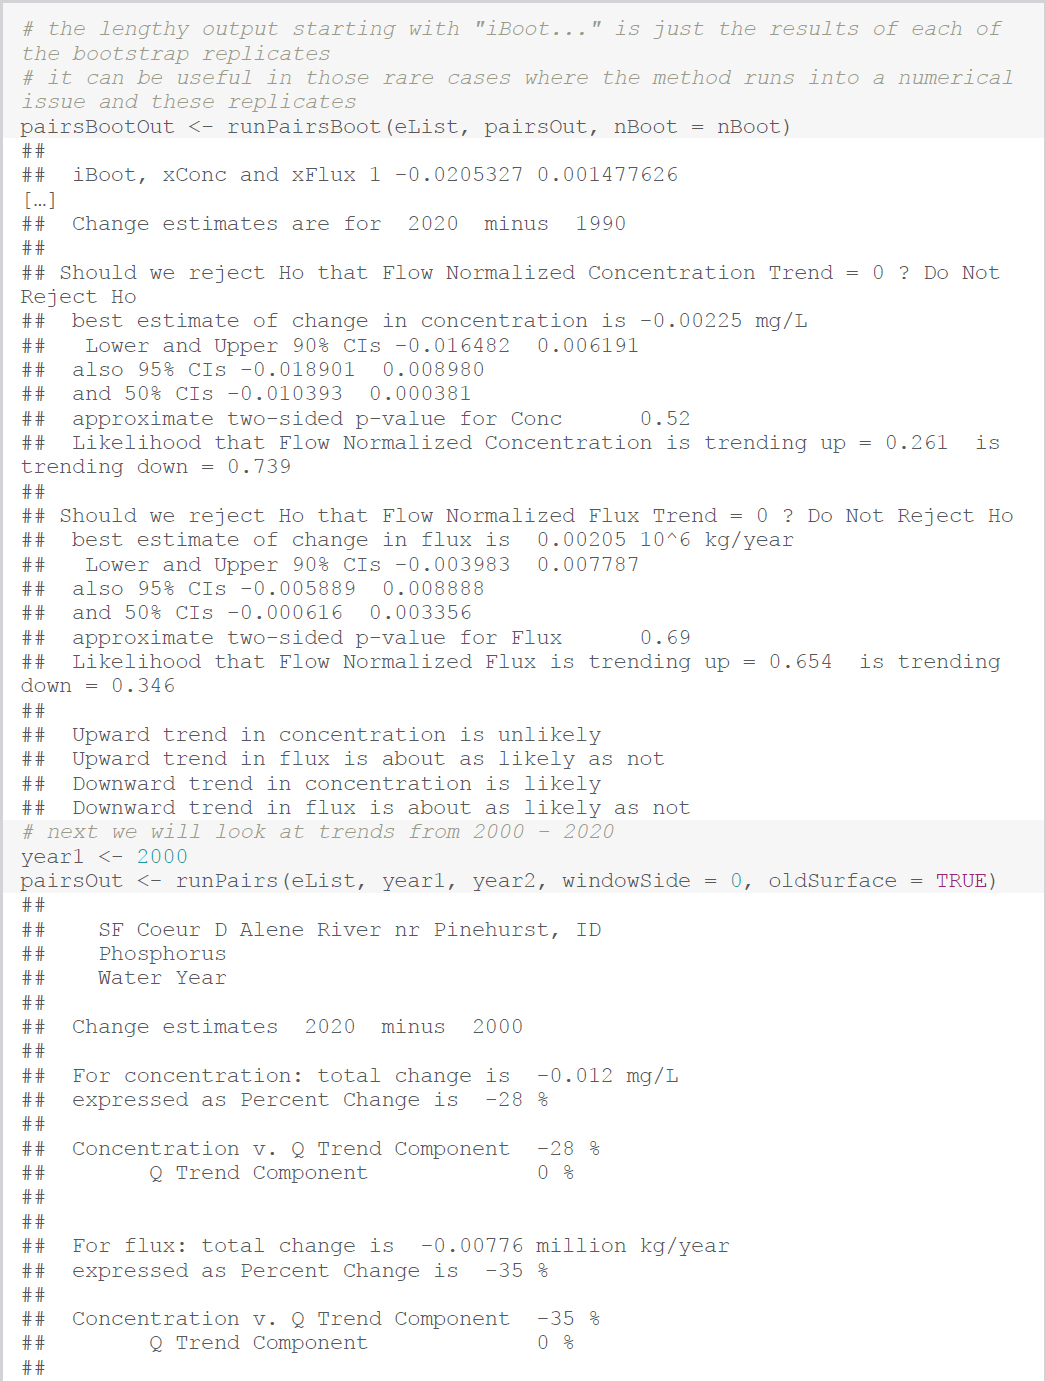
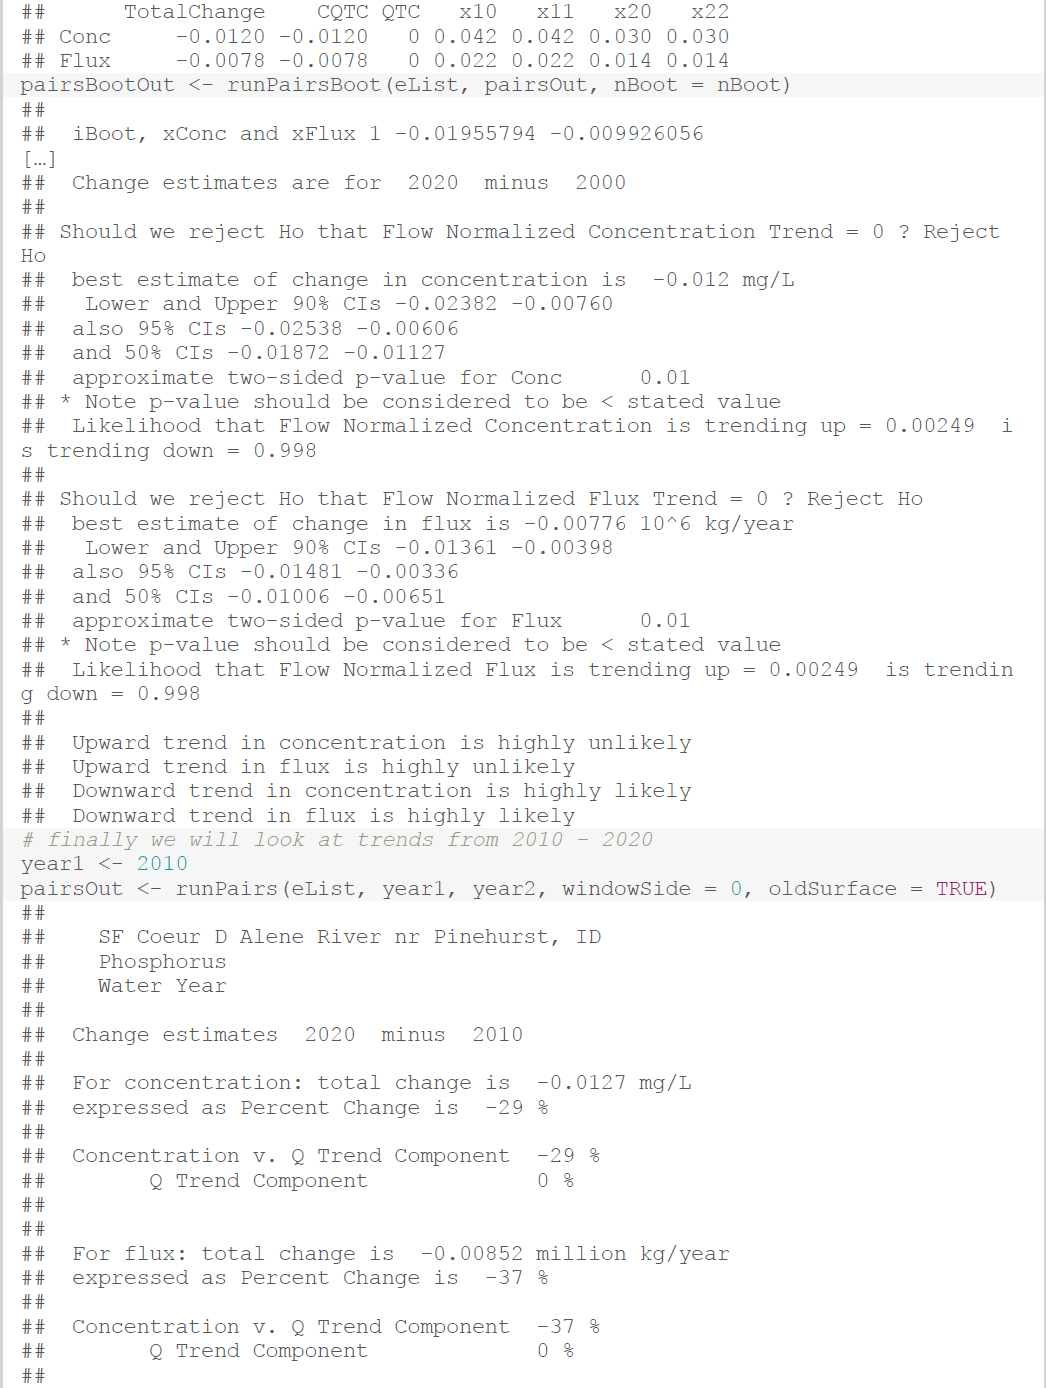
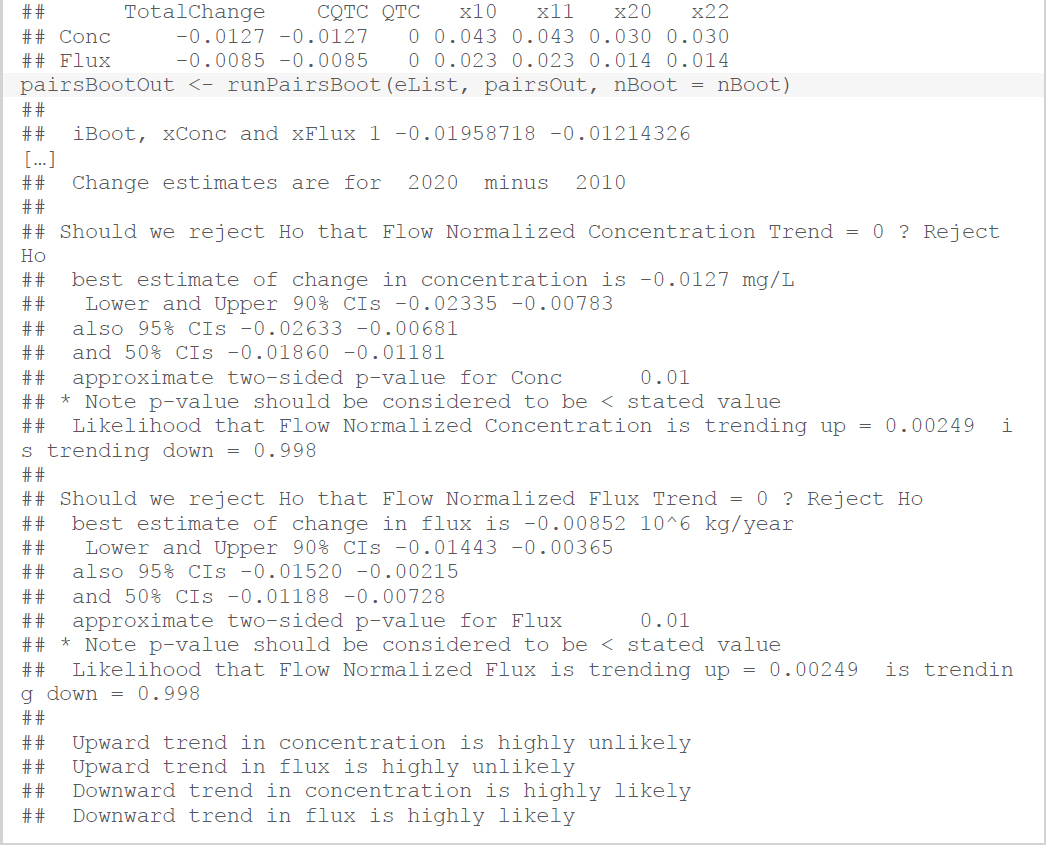
Total Phosphorus Trends Uncertainty Calculation Example

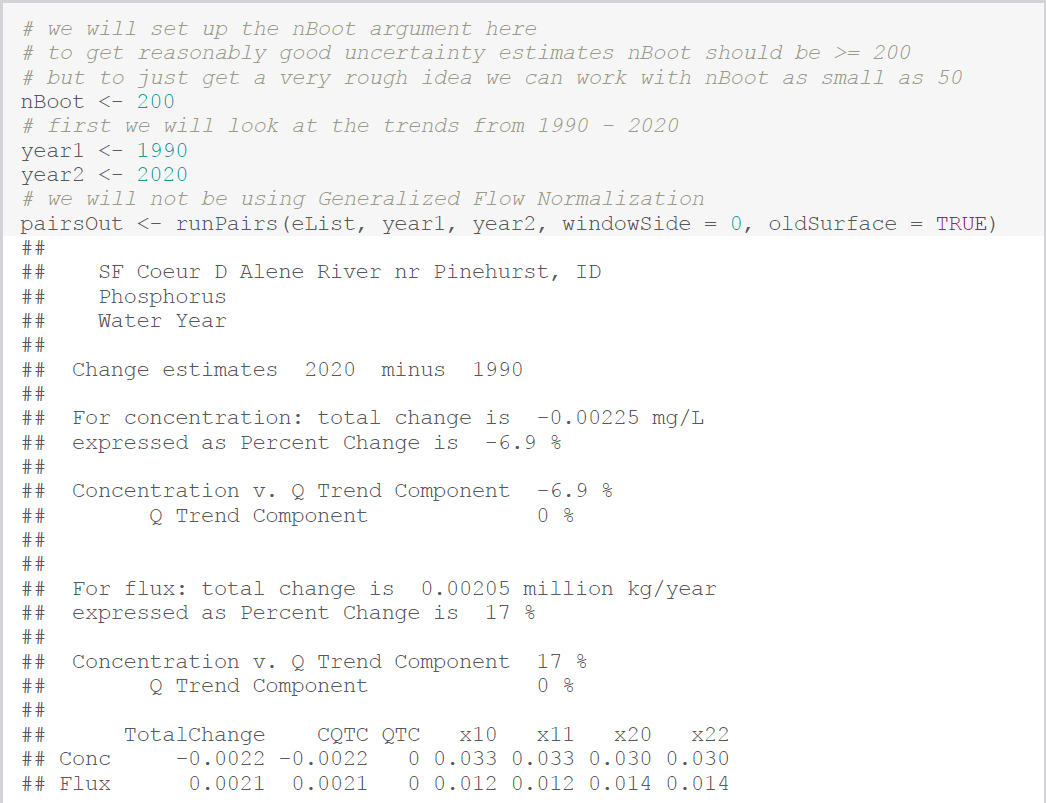
For the same example of total phosphorus trends at the South Fork of the CDA River near Pinehurst, calculations of uncertainty are detailed below.

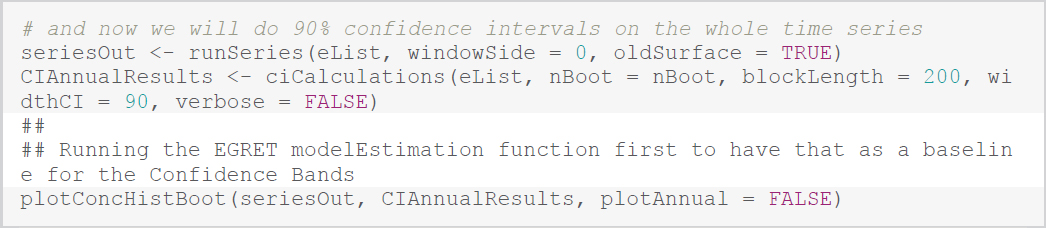
Quantifying Uncertainty of the Trend Results

Image

Suggested Citation:"Appendix A: Coeur d'Alene Watershed Analysis Methodology for Metals and Nutrients." National Academies of Sciences, Engineering, and Medicine. 2022. The Future of Water Quality in Coeur d'Alene Lake. Washington, DC: The National Academies Press. doi: 10.17226/26620.
×

Image

Suggested Citation:"Appendix A: Coeur d'Alene Watershed Analysis Methodology for Metals and Nutrients." National Academies of Sciences, Engineering, and Medicine. 2022. The Future of Water Quality in Coeur d'Alene Lake. Washington, DC: The National Academies Press. doi: 10.17226/26620.
×

Image

Suggested Citation:"Appendix A: Coeur d'Alene Watershed Analysis Methodology for Metals and Nutrients." National Academies of Sciences, Engineering, and Medicine. 2022. The Future of Water Quality in Coeur d'Alene Lake. Washington, DC: The National Academies Press. doi: 10.17226/26620.
×

Image

Image

Suggested Citation:"Appendix A: Coeur d'Alene Watershed Analysis Methodology for Metals and Nutrients." National Academies of Sciences, Engineering, and Medicine. 2022. The Future of Water Quality in Coeur d'Alene Lake. Washington, DC: The National Academies Press. doi: 10.17226/26620.
×
Image
FIGURE A-7 Total phosphorus concentration at the South Fork of the CDA River near Pinehurst as a function of water year. Solid line shows the flow-normalized concentration, and the dotted lines show the 90 percent confidence interval.

Image

Suggested Citation:"Appendix A: Coeur d'Alene Watershed Analysis Methodology for Metals and Nutrients." National Academies of Sciences, Engineering, and Medicine. 2022. The Future of Water Quality in Coeur d'Alene Lake. Washington, DC: The National Academies Press. doi: 10.17226/26620.
×
Image
FIGURE A-8 Total phosphorus flux at the South Fork of the CDA River near Pinehurst as a function of water year. Solid line shows the flow-normalized flux, and the dotted lines show the 90 percent confidence interval.

REFERENCES

Hirsch, R. M., D. L. Moyer, and S. A. Archfield. 2010. Weighted regressions on time, discharge, and season (WRTDS), with an application to Chesapeake Bay river inputs 1. Journal of the American Water Resources Association 46(5):857–880.

Hirsch, R. M., and L. A. De Cicco. 2015. User guide to Exploration and Graphics for RivEr Trends (EGRET) and dataRetrieval: R packages for hydrologic data (version 2.0, February 2015): USGS Techniques and Methods Book 4, Chapter A10, 93 p. https://dx.doi.org/10.3133/tm4A10.

Zhang, Q., and R. M. Hirsch. 2019. River water-quality concentration and flux estimation can be improved by accounting for serial correlation through an autoregressive model. Water Resources Research 55:9705–9723. https://doi.org/10.1029/2019WR025338.

Zinsser, L. M. 2020. Trends in Concentrations, Loads, and Sources of Trace Metals and Nutrients in the Spokane River Watershed, Northern Idaho, Water Years 1990-2018. USGS Scientific Investigations Report 2020-5096.

Suggested Citation:"Appendix A: Coeur d'Alene Watershed Analysis Methodology for Metals and Nutrients." National Academies of Sciences, Engineering, and Medicine. 2022. The Future of Water Quality in Coeur d'Alene Lake. Washington, DC: The National Academies Press. doi: 10.17226/26620.
×

This page intentionally left blank.

Suggested Citation:"Appendix A: Coeur d'Alene Watershed Analysis Methodology for Metals and Nutrients." National Academies of Sciences, Engineering, and Medicine. 2022. The Future of Water Quality in Coeur d'Alene Lake. Washington, DC: The National Academies Press. doi: 10.17226/26620.
×
Page 341
Suggested Citation:"Appendix A: Coeur d'Alene Watershed Analysis Methodology for Metals and Nutrients." National Academies of Sciences, Engineering, and Medicine. 2022. The Future of Water Quality in Coeur d'Alene Lake. Washington, DC: The National Academies Press. doi: 10.17226/26620.
×
Page 342
Suggested Citation:"Appendix A: Coeur d'Alene Watershed Analysis Methodology for Metals and Nutrients." National Academies of Sciences, Engineering, and Medicine. 2022. The Future of Water Quality in Coeur d'Alene Lake. Washington, DC: The National Academies Press. doi: 10.17226/26620.
×
Page 343
Suggested Citation:"Appendix A: Coeur d'Alene Watershed Analysis Methodology for Metals and Nutrients." National Academies of Sciences, Engineering, and Medicine. 2022. The Future of Water Quality in Coeur d'Alene Lake. Washington, DC: The National Academies Press. doi: 10.17226/26620.
×
Page 344
Suggested Citation:"Appendix A: Coeur d'Alene Watershed Analysis Methodology for Metals and Nutrients." National Academies of Sciences, Engineering, and Medicine. 2022. The Future of Water Quality in Coeur d'Alene Lake. Washington, DC: The National Academies Press. doi: 10.17226/26620.
×
Page 345
Suggested Citation:"Appendix A: Coeur d'Alene Watershed Analysis Methodology for Metals and Nutrients." National Academies of Sciences, Engineering, and Medicine. 2022. The Future of Water Quality in Coeur d'Alene Lake. Washington, DC: The National Academies Press. doi: 10.17226/26620.
×
Page 346
Suggested Citation:"Appendix A: Coeur d'Alene Watershed Analysis Methodology for Metals and Nutrients." National Academies of Sciences, Engineering, and Medicine. 2022. The Future of Water Quality in Coeur d'Alene Lake. Washington, DC: The National Academies Press. doi: 10.17226/26620.
×
Page 347
Suggested Citation:"Appendix A: Coeur d'Alene Watershed Analysis Methodology for Metals and Nutrients." National Academies of Sciences, Engineering, and Medicine. 2022. The Future of Water Quality in Coeur d'Alene Lake. Washington, DC: The National Academies Press. doi: 10.17226/26620.
×
Page 348
Suggested Citation:"Appendix A: Coeur d'Alene Watershed Analysis Methodology for Metals and Nutrients." National Academies of Sciences, Engineering, and Medicine. 2022. The Future of Water Quality in Coeur d'Alene Lake. Washington, DC: The National Academies Press. doi: 10.17226/26620.
×
Page 349
Suggested Citation:"Appendix A: Coeur d'Alene Watershed Analysis Methodology for Metals and Nutrients." National Academies of Sciences, Engineering, and Medicine. 2022. The Future of Water Quality in Coeur d'Alene Lake. Washington, DC: The National Academies Press. doi: 10.17226/26620.
×
Page 350
Suggested Citation:"Appendix A: Coeur d'Alene Watershed Analysis Methodology for Metals and Nutrients." National Academies of Sciences, Engineering, and Medicine. 2022. The Future of Water Quality in Coeur d'Alene Lake. Washington, DC: The National Academies Press. doi: 10.17226/26620.
×
Page 351
Suggested Citation:"Appendix A: Coeur d'Alene Watershed Analysis Methodology for Metals and Nutrients." National Academies of Sciences, Engineering, and Medicine. 2022. The Future of Water Quality in Coeur d'Alene Lake. Washington, DC: The National Academies Press. doi: 10.17226/26620.
×
Page 352
Suggested Citation:"Appendix A: Coeur d'Alene Watershed Analysis Methodology for Metals and Nutrients." National Academies of Sciences, Engineering, and Medicine. 2022. The Future of Water Quality in Coeur d'Alene Lake. Washington, DC: The National Academies Press. doi: 10.17226/26620.
×
Page 353
Suggested Citation:"Appendix A: Coeur d'Alene Watershed Analysis Methodology for Metals and Nutrients." National Academies of Sciences, Engineering, and Medicine. 2022. The Future of Water Quality in Coeur d'Alene Lake. Washington, DC: The National Academies Press. doi: 10.17226/26620.
×
Page 354
Suggested Citation:"Appendix A: Coeur d'Alene Watershed Analysis Methodology for Metals and Nutrients." National Academies of Sciences, Engineering, and Medicine. 2022. The Future of Water Quality in Coeur d'Alene Lake. Washington, DC: The National Academies Press. doi: 10.17226/26620.
×
Page 355
Suggested Citation:"Appendix A: Coeur d'Alene Watershed Analysis Methodology for Metals and Nutrients." National Academies of Sciences, Engineering, and Medicine. 2022. The Future of Water Quality in Coeur d'Alene Lake. Washington, DC: The National Academies Press. doi: 10.17226/26620.
×
Page 356
Suggested Citation:"Appendix A: Coeur d'Alene Watershed Analysis Methodology for Metals and Nutrients." National Academies of Sciences, Engineering, and Medicine. 2022. The Future of Water Quality in Coeur d'Alene Lake. Washington, DC: The National Academies Press. doi: 10.17226/26620.
×
Page 357
Suggested Citation:"Appendix A: Coeur d'Alene Watershed Analysis Methodology for Metals and Nutrients." National Academies of Sciences, Engineering, and Medicine. 2022. The Future of Water Quality in Coeur d'Alene Lake. Washington, DC: The National Academies Press. doi: 10.17226/26620.
×
Page 358
Suggested Citation:"Appendix A: Coeur d'Alene Watershed Analysis Methodology for Metals and Nutrients." National Academies of Sciences, Engineering, and Medicine. 2022. The Future of Water Quality in Coeur d'Alene Lake. Washington, DC: The National Academies Press. doi: 10.17226/26620.
×
Page 359
Suggested Citation:"Appendix A: Coeur d'Alene Watershed Analysis Methodology for Metals and Nutrients." National Academies of Sciences, Engineering, and Medicine. 2022. The Future of Water Quality in Coeur d'Alene Lake. Washington, DC: The National Academies Press. doi: 10.17226/26620.
×
Page 360
Next: Appendix B: In-Lake Analysis Methodology for Metals, Nutrients, and Dissolved Oxygen »
The Future of Water Quality in Coeur d'Alene Lake Get This Book
×
 The Future of Water Quality in Coeur d'Alene Lake
Buy Paperback | $50.00 Buy Ebook | $40.99
MyNAP members save 10% online.
Login or Register to save!
Download Free PDF

Coeur d'Alene Lake in northern Idaho is an invaluable natural, recreational, and economic resource for communities in Idaho and eastern Washington. Starting in the late 1880s, mining in the Lake’s watershed sent heavy metals and other mining wastes into the Lake, resulting in contamination of lake sediments with lead, cadmium, arsenic, and zinc that persists today. The watershed was designated a Superfund site and cleanup has been ongoing for 30 years. However, the Lake's environmental quality and cleanup is overseen by a Lake Management Plan, originally implemented by the Coeur d’Alene Tribe and the state of Idaho. A major focus of that plan is whether lakeshore development might promote low-oxygen (anoxic) conditions that could release toxic metals from lake sediments back into the water column.

This report analyzes water quality data collected from the Lake and the watershed over the past 30 years. The analyses indicate that, although the Lake is still heavily contaminated, concentrations of metals in the major inputs to the Lake have declined, and there is no evidence that phosphorus concentrations have been increasing in the last decade or that low-oxygen events are becoming more common. However, the shorelines of the Lake, where exposure to metals or harmful algae is more likely, are not currently monitored. Protecting the water quality of Coeur d'Alene Lake will require that monitoring efforts be expanded to provide an early warning of deteriorating conditions, regular syntheses of data, and targeted studies—all coordinated among interest groups—followed by application of those results to managing the Lake.

READ FREE ONLINE

  1. ×

    Welcome to OpenBook!

    You're looking at OpenBook, NAP.edu's online reading room since 1999. Based on feedback from you, our users, we've made some improvements that make it easier than ever to read thousands of publications on our website.

    Do you want to take a quick tour of the OpenBook's features?

    No Thanks Take a Tour »
  2. ×

    Show this book's table of contents, where you can jump to any chapter by name.

    « Back Next »
  3. ×

    ...or use these buttons to go back to the previous chapter or skip to the next one.

    « Back Next »
  4. ×

    Jump up to the previous page or down to the next one. Also, you can type in a page number and press Enter to go directly to that page in the book.

    « Back Next »
  5. ×

    Switch between the Original Pages, where you can read the report as it appeared in print, and Text Pages for the web version, where you can highlight and search the text.

    « Back Next »
  6. ×

    To search the entire text of this book, type in your search term here and press Enter.

    « Back Next »
  7. ×

    Share a link to this book page on your preferred social network or via email.

    « Back Next »
  8. ×

    View our suggested citation for this chapter.

    « Back Next »
  9. ×

    Ready to take your reading offline? Click here to buy this book in print or download it as a free PDF, if available.

    « Back Next »
Stay Connected!