
1
Introduction
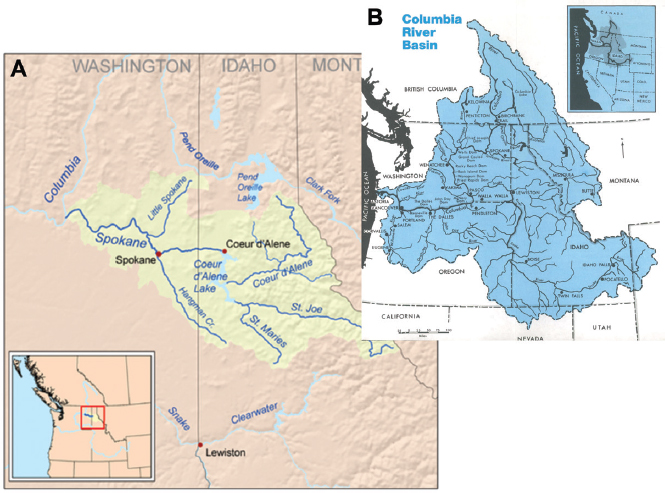
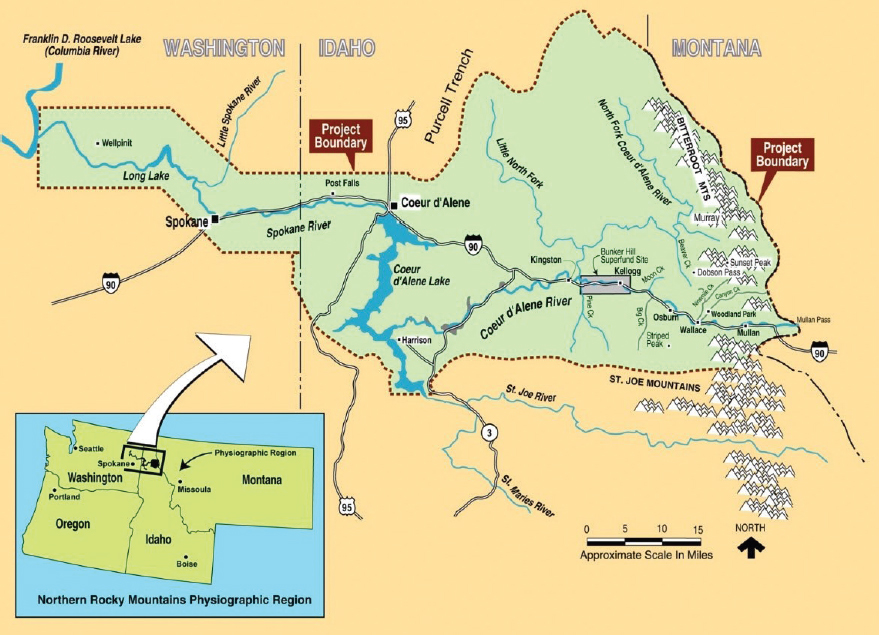
Coeur d’Alene Lake (hereafter CDA Lake, or the Lake) in northern Idaho is an invaluable natural, recreational, and economic resource to residents of Idaho and eastern Washington. The CDA basin that drains into the Lake encompasses approximately 3,740 mi2 (9,690 km2), and ranges in elevation from 2,000 to 6,850 ft above sea level (Woods and Beckwith, 2008; Zinsser, 2018). It is located within the 6,680 mi2 (17,300 km2) Spokane River basin, which is a subbasin of the Columbia River basin (Figure 1-1).
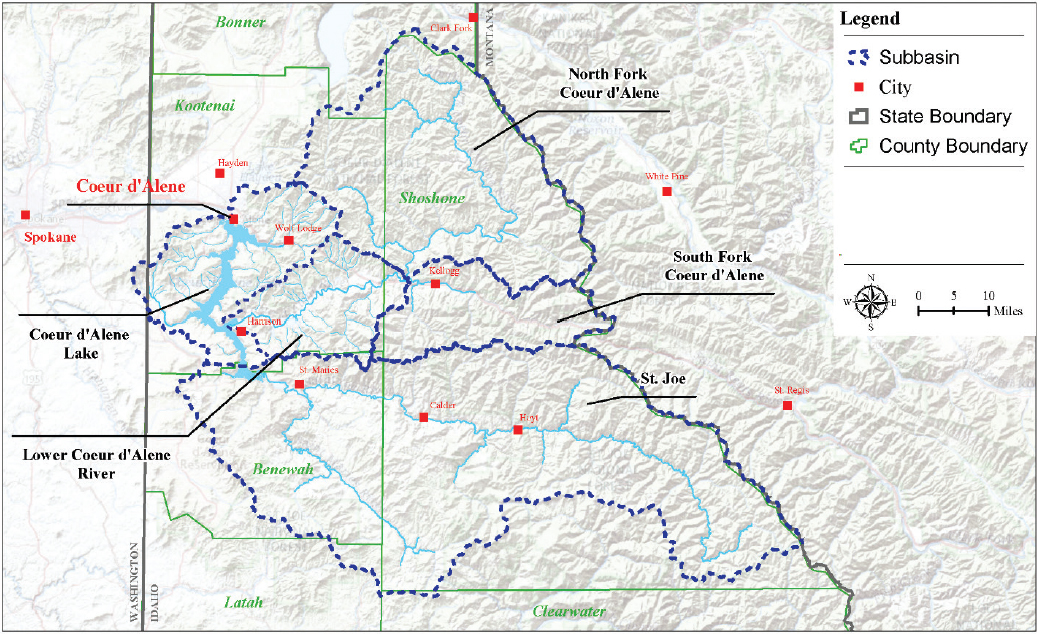
The CDA basin encompasses much of Kootenai, Shoshone, and Benewah Counties in Idaho. As seen in Figure 1-2, the CDA basin is composed of five major subbasins that are mentioned repeatedly in this report: the North Fork of the CDA River, the South Fork of the CDA River, the lower CDA River basin, the St. Joe River basin, and the so-called nearshore watershed directly surrounding CDA Lake. The most populated city in the Lake’s watershed is the city of Coeur d’Alene near the Lake’s northern outlet, home to about 166,000 people and a rapidly growing economic center in the region (Wall Street Journal, 2021). Other population centers around the basin include Harrison, Pinehurst, Smelterville, Kellogg, Wallace, Mullan, and St. Maries. Discussed in greater detail later, land cover within the CDA basin consists of approximately 74 percent forested land, 15 percent shrubland, and the remaining 11 percent a mix of agriculture, barren land, small water bodies, wetlands, and urban development. This entire area lies within the homeland of the Coeur d’Alene Tribe (hereafter CDA Tribe), for whom the entire Lake holds immense cultural, cosmological, and natural importance.
Starting in the late 1880s, the area along the South Fork of the CDA River was mined for gold and silver (and hence was named the Silver Valley). Waste from these mining activities was historically discharged to the South Fork of the CDA River, which flowed downstream and subsequently contaminated over 75 million metric tons (MT) of CDA Lake sediments with metals such as lead, cadmium, arsenic, and zinc. There are also about 32 million MT of contaminated sediments in the floodplain of the lower CDA River (Bookstrom et al., 2001) that could potentially make their way to the Lake in the future. Although metal inputs to CDA Lake have declined since the diminution of mining in the 1980s, metal concentrations in CDA Lake and its sediments remain above ambient water quality standards set by the State of Idaho and the CDA Tribe.
In 1983 the Bunker Hill mining district in the Silver Valley was designated as a regulated hazardous waste site under the nation’s Comprehensive Environmental Response, Compensation, and Liability Act of 1980 (CERCLA, or Superfund Act). Administered by the U.S. Environmental Protection Agency (EPA), the Superfund Act requires the cleanup of listed hazardous waste sites to prevent risks to human health and the environment. Remediation at the Bunker Hill Superfund site has focused primarily on the basin of the South Fork of the CDA River, with plans to begin work along the main stem of the CDA River (i.e., the lower basin)
in the coming years. Although heavily contaminated with metals from mining waste, CDA Lake itself was not included as a target of remediation under Superfund. Rather, protection of water quality in the Lake was left to a Lake Management Plan (LMP) to be implemented by the CDA Tribe, which owns the bed and banks of the southern third of the Lake, and the State of Idaho, which controls the northern two-thirds. The LMP, which was made necessary by the sociopolitical complexities of the early 2000s, emphasizes control of nutrient loading to the Lake in order to maintain adequate dissolved oxygen throughout the water column. It was based on the assumption that increased nutrient loading to the Lake could lead to anoxic conditions, which might remobilize metals from the Lake sediments that would then pose a threat to ecosystems and human health. In addition, there was concern that Superfund remedial activities in the basin could lower the Lake’s zinc concentration, which was hypothesized to suppress primary productivity and concomitant anoxia (Kuwabara et al., 2006, 2007).
Water quality data from both the Lake and the CDA basin that could shed light on the Lake’s current status and potential future conditions have been collected variously over the past 30 years by the U.S. Geological Survey (USGS), the Idaho Department of Environmental Quality (IDEQ), the CDA Tribe, EPA, independent researchers, and other stakeholder groups. Monitoring data have been reported annually to comply with the LMP, and summarizing statements are released periodically (e.g., “total phosphorus levels in the lake are steadily increasing and the rate may be accelerating”—IDEQ, 2020a). Comprehensive analyses of the monitoring data and explicit testing of hypotheses, however, are rare. Given the uncertainties in the data analysis activities, along with divergent concerns of various stakeholder groups, in late 2020, IDEQ, Kootenai County, and EPA requested that the National Academies of Sciences, Engineering, and Medicine (the National Academies) establish an ad hoc committee to analyze available data and information about CDA Lake and provide recommendations that address the observed trends in water quality.
INTRODUCTION TO THE CDA REGION
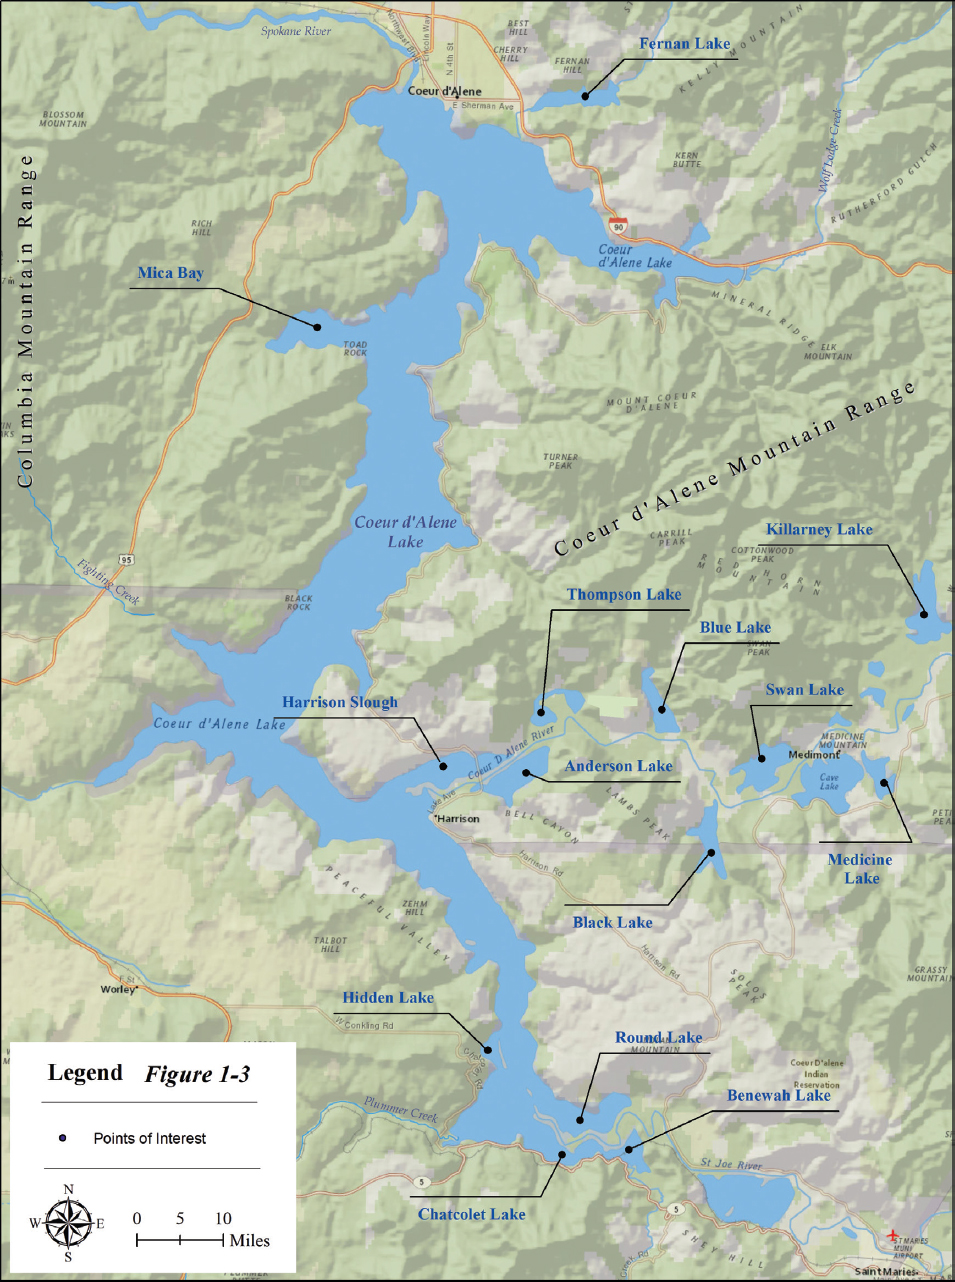
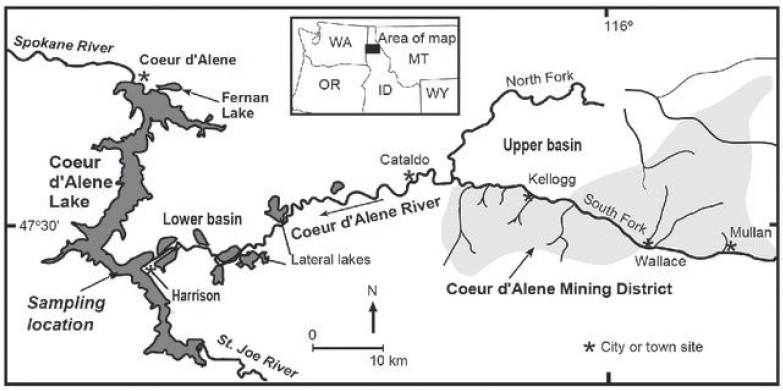
CDA Lake, located in the northern panhandle of Idaho, is the second largest naturally occurring lake in Idaho (Horowitz et al., 1993a; Woods and Beckwith, 2008). It lies between the Selkirk and Coeur d’Alene Mountains, extending from the mouth of the St. Joe River to the headwaters of the Spokane River near the city of Coeur d’Alene. The lake formed 18,000 to 13,000 years ago when ice dams on glacial Lake Missoula breached, releasing catastrophic flood waters and coarse sediment downstream (Horowitz et al., 1992, 1995; Horowitz et al., 1993b; Kahle and Bartolino, 2007). As a result of these floods, the Spokane River was dammed, forming CDA Lake. Figure 1-3 shows the primary hydrologic features of CDA Lake, including its major inputs (the St. Joe River and the CDA River) and output (the Spokane River), the names of locations of interest with CDA Lake that are extensively studied, and the main lateral lakes that lie east of CDA Lake along the CDA River. This diagram is used throughout the report to denote major features of the Lake.
Within the CDA Basin, most of the population lies within Kootenai County, which is also where there is the most extensive lakeshore development and active recreational use of the Lake (e.g., swimming, boating, and fishing). Indeed, the CDA Lake region appeals as a resort area for vacationers and to those looking to relocate to a rural and relatively inexpensive location (Wall Street Journal, 2021). Much of the economic activity in the basin is found in the city of Coeur d’Alene, whose future job growth over the next decade is predicted to be 44.7 percent—higher than the U.S. average of 33.5 percent.1 Construction is also growing in Kootenai County as indicated by the more than 45 percent increase in building permits in 2021 compared to 2020 (Hardy, 2021).
Nearly all of the shoreline around the Lake is occupied by campgrounds, marinas, or single-family houses (Maupin and Weakland, 2009). Not surprisingly, the growth in population and economic prosperity of the CDA region has been tied to the water resources in the area; for example, Liao et al. (2016) found that property values were positively associated with Secchi depth (a measure of water clarity) and negatively associated with the presence of the invasive aquatic plant watermilfoil.
___________________
1 https://www.bestplaces.net/economy/city/idaho/coeur_d’alene
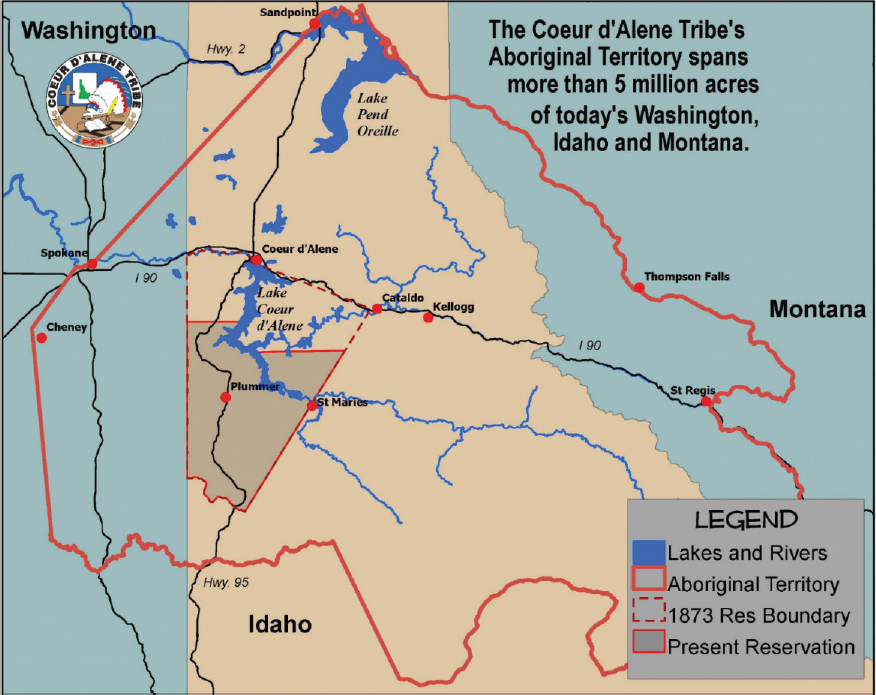
The CDA Tribe’s Aboriginal Territory originally encompassed all of CDA Lake and covered more than 5 million acres of land across the states of Idaho, Washington, and Montana (see Figure 1-4). The current boundaries of the CDA Tribe’s reservation now span 345,000 acres, with about one-third of the southernmost region of the Lake under tribal jurisdiction (NCAI Partnership for Tribal Governance, 2016; Woods and Beckwith, 2008).
The following sections describe several features of the CDA region that play a role in controlling water quality in the Lake. These include climate (particularly temperature and precipitation), hydrology of the region and hydraulics of the Lake, land use in the CDA basin, and population. These descriptions are not intended to provide a comprehensive overview of the physical, chemical, and biological characteristics of the Lake and its watershed. The reader is referred to the LMP (IDEQ and CDA Tribe, 2009), National Research Council (NCR, 2005), and numerous EPA reports on the Superfund site (e.g., the final Remedial Investigation/Feasibility Study—URS Greiner, Inc., and CH2M Hill, 2001) for relevant background information.
Climate
The watershed of CDA Lake typically has mild and dry summers followed by cold and wet winters, but the region’s steep topography leads to wide variations in temperature and precipitation across the watershed.
Precipitation
Mean annual precipitation in the CDA watershed during the period of 1991–2020 was estimated to be 1,090 mm/yr (Daly et al., 2008, 2015). Orographic effects cause significant spatial variation to the mean annual
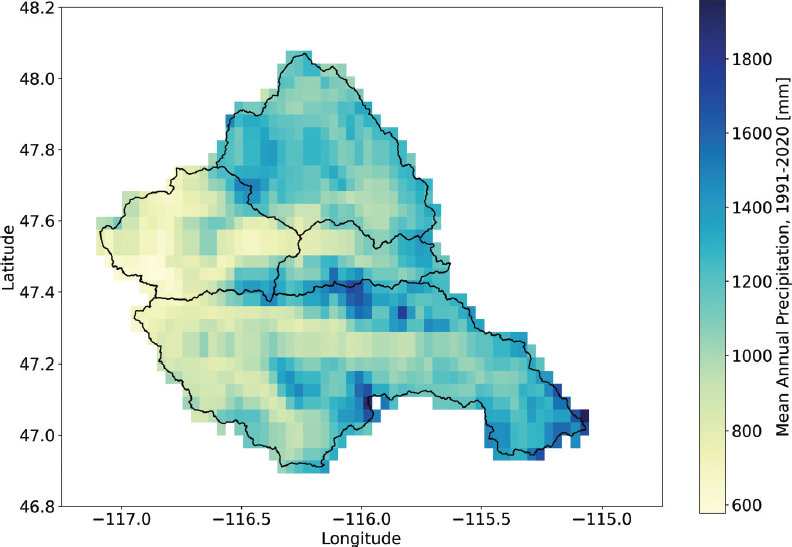
precipitation within the watershed, such that at lower elevations within the watershed (i.e., in the vicinity of the Lake) mean annual precipitation is as low as 600 mm/yr (see Figure 1-5). Conversely, at the highest elevation locations within the Lake’s watershed, mean annual precipitation for the 1991–2020 period exceeds 1,800 mm/yr.
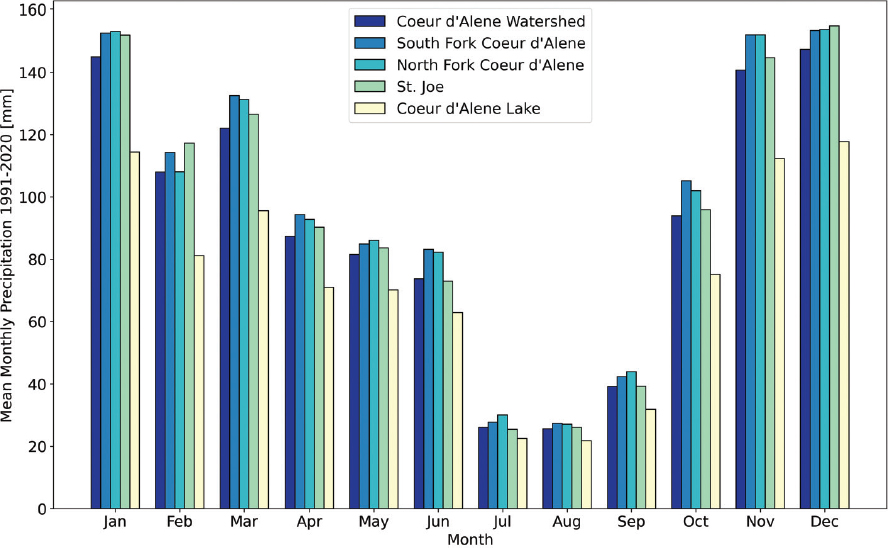
Mean annual precipitation varies only slightly between the St. Joe River (1,129 mm/yr), the North Forks of the CDA River (1,162 mm/yr), and South Fork of the CDA River (1,169 mm/yr) watersheds (Figure 1-6). The collection of small catchments that drain directly to CDA Lake (white bars in Figure 1-6) are associated with a significantly lower mean annual precipitation (876 mm/yr), owing primarily to a lower distribution of elevations than any of the tributaries.
Precipitation timing throughout the watershed varies significantly throughout the year (Maupin and Weakland, 2009; Zinsser, 2018). Based on analysis of the 30-year period between 1991 and 2020, the months of November through January are typically associated with the highest precipitation throughout the year, with the watershed receiving on average more than 140 mm/month of precipitation in these months. Indeed, approximately 70 percent of the yearly precipitation occurs between October and April, with about half falling as snow (Maupin and Weakland, 2009; Zinsser, 2018). Also during the winter, heavy precipitation events associated with storms that come in from the Pacific Ocean can result in rain-on-snow events (Woods and Beckwith, 2008), inducing snow melt and higher discharge in local rivers and streams. Precipitation is lowest in the summer months of July and August, with monthly average precipitation values of less than 40 mm/month in each of these months during the 30-year period from 1991 to 2020. As shown in Figure 1-6, the variability in long-term average monthly precipitation between subwatersheds is smaller than the seasonal variability.
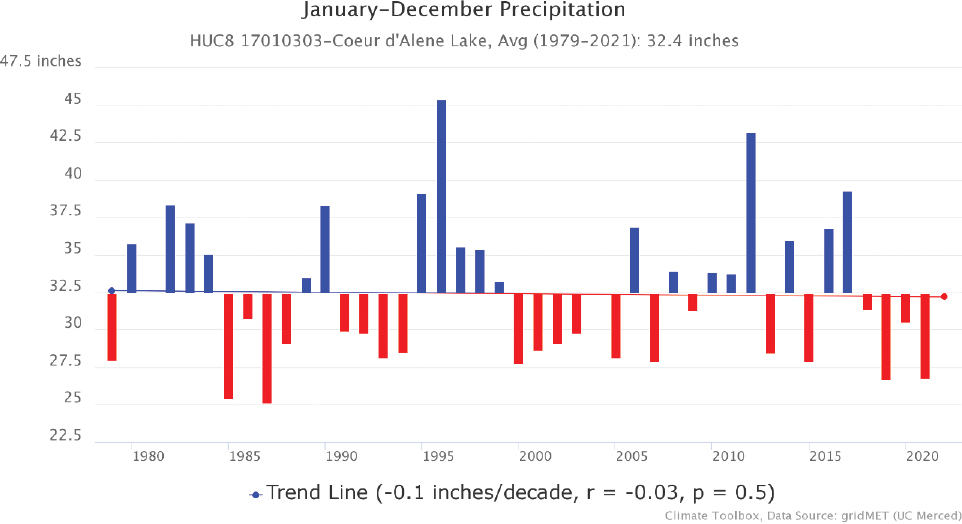
The annual volume of precipitation within the CDA Lake watershed exhibits significant interannual variability. Over the 30-year period between 1991 and 2020, the annual total precipitation has varied from a low of 824 mm in 2019 to as high as 1,505 mm in 1996 within the watershed, with the interannual variability in annual precipitation volume being consistent in timing across the subwatersheds (data not shown). Furthermore, there are no strong trends in the total amount of precipitation over the past 40 years (Figure 1-7).
Temperature
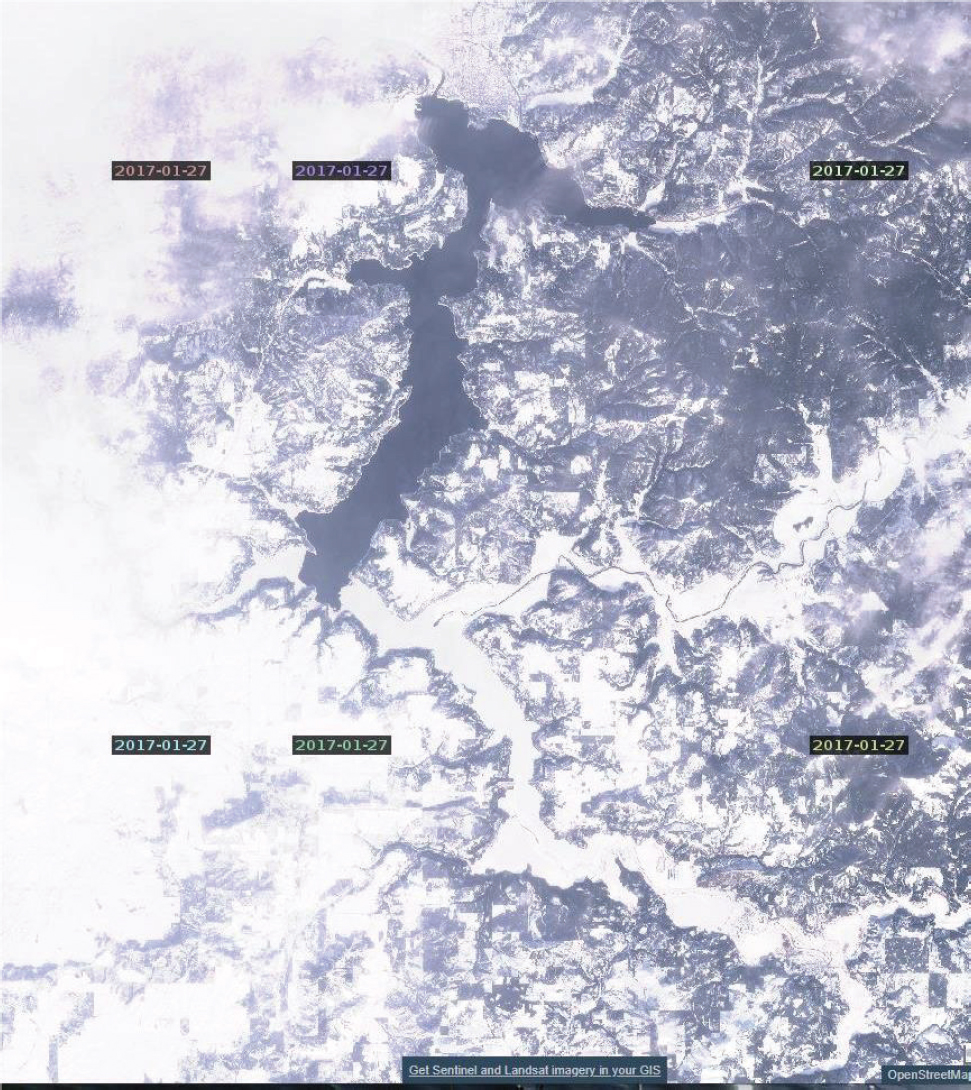
In the CDA region, average summer temperatures are typically around 60°F (15°C), with temperatures as much as 30°F warmer during the day compared to night. The warmest averages occur in July and can approach 70°F (21°C) (Maupin and Weakland, 2009). Monthly wintertime temperatures are around 29°F (−2°C), with less variability between day and night conditions. The coldest month is typically January. Although temperatures are often below freezing in the winter, the Lake typically only freezes at the shallower southern end (see Figure 1-8).
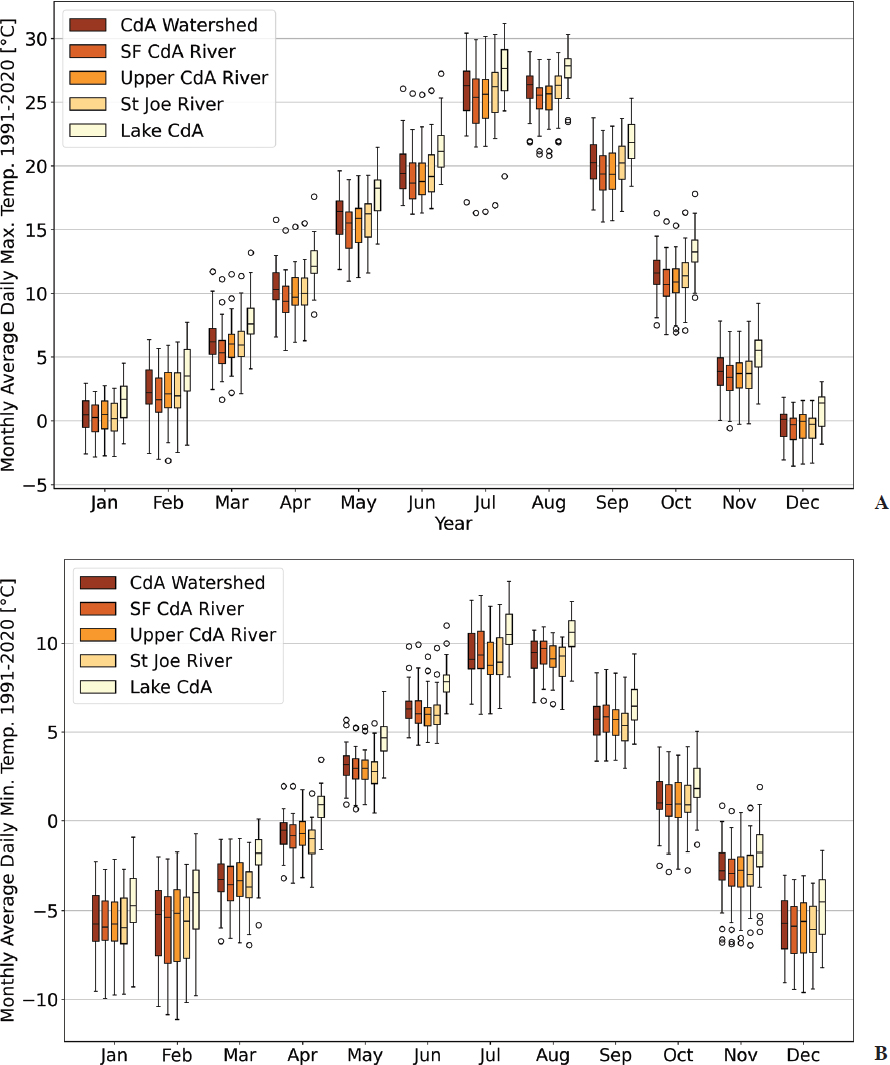
As with precipitation, the CDA watershed is also associated with large seasonal variations in temperature (Figure 1-9). The watershed-average daily maximum temperature ranges from slightly less than 32°F (0°C) in January to approximately 77°F (25°C) in July and August. Conversely the watershed-average daily minimum temperature ranges from slightly less than 23°F (−5°C) in January to approximately 48°F (9°C) in July and August.
Monthly average temperatures at the watershed scale can also vary significantly from year to year. From 1991 to 2020, the range of monthly average daily maximum temperatures varied by up to 5°C in December and
January and up to approximately 8°C in July. Monthly average daily minimum temperature, by contrast, exhibits the greatest variability in the winter months of December through February and the least variability in the spring months of April through June. The large elevation gradient within the CDA watershed gives rise to significant spatial heterogeneity in temperatures in all seasons.
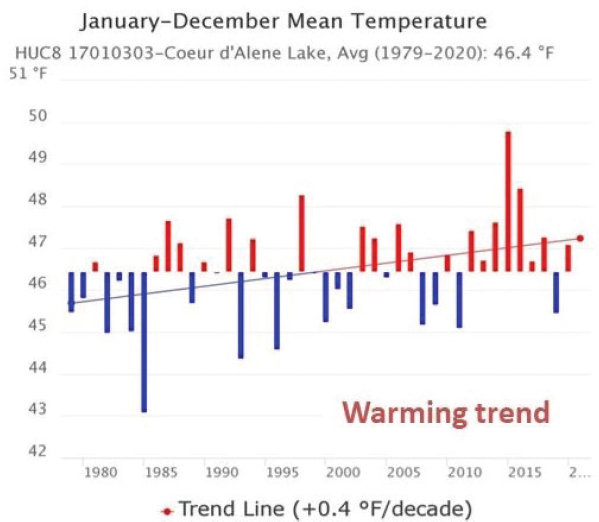
Figure 1-10 shows the trend in air temperature for the subwatershed around CDA Lake from 1979 to 2020, showing an average increase of 0.4°F per decade during that period. Although the warming trend is consistent with the climate warming in the western United States and within the broader region, a degree of caution should be exercised when interpreting the magnitude of this trend. Because the PRISM data underlying Figure 1-10 are based on geostatistical interpolations of available surface climate observations and because the density of observing sites and the length of records at those sites varies through time, there is some degree of uncertainty in the ability to accurately compute trends from the data.
Rain versus Snow
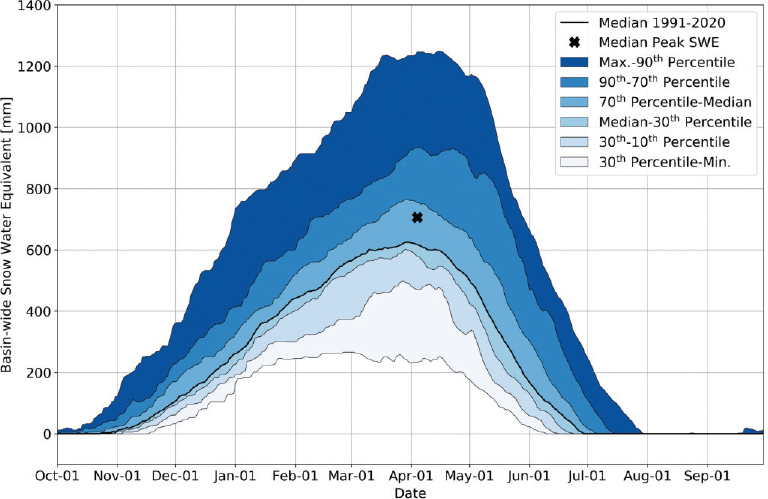
The observed seasonal patterns in precipitation and temperature within the CDA Lake watershed result in the bulk of precipitation delivered to the watershed arriving as snow. The U.S. Department of Agriculture (USDA) Natural Resources Conservation Service (NRCS) monitors snowpack conditions in the CDA watershed through a network of Snow Telemetry (SNOTEL) automated measurement stations and manual snow course measurement sites. Through this network of sites, the NRCS develops a basin scale analysis of snow water storage estimates for the Spokane River watershed, for which the CDA River watershed comprises the primary tributary. Based on the 30-year period between 1991 and 2020, the NRCS estimates that the median peak snow water equivalent (SWE) in the Spokane River Watershed is approximately 700 mm and the median date of maximum SWE occurs around April 1 (see Figure 1-11). In general, the snowpack builds from late November to as late as the beginning of June. There is, however, significant interannual variability in the magnitude and timing of peak SWE conditions. Over the 30-year period ending in 2020, peak SWE in the Spokane River watershed has been as low as approximately 250 mm and occurred as early as March 1. At the other extreme, peak SWE has exceeded 1,200 mm and the date of maximum SWE has been as late as May 3.
Over the 1983–2021 period of record for which Spokane River SWE estimates are available, there has been a decrease in the peak SWE within the Spokane River System of approximately 36 mm/decade (see Figure 1-12). Although the observed trend fails a traditional Mann-Kendall test for significance, it was found to be statistically significant when tested via a non-parametric Mann-Kendall test modified for effective sample size (p < 0.001; Yue and Wang, 2004). Conversely, there was no significant trend in the date on which the peak SWE storage within the
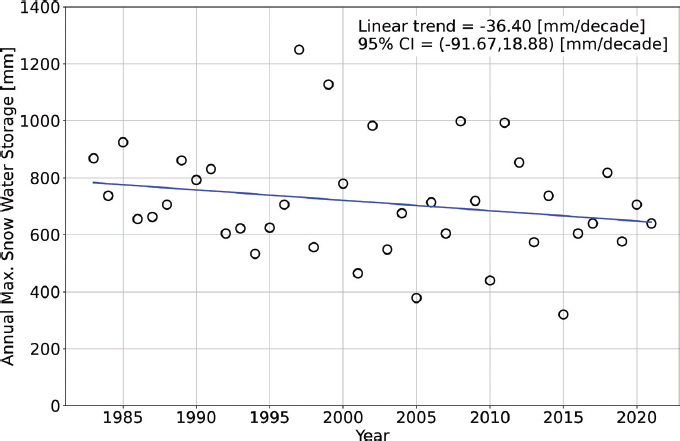
Spokane River occurred over the period of record (not shown). The trend of decreasing peak maximum SWE in the Spokane River basin is broadly consistent with other declines in SWE metrics observed in the broader western United States (e.g., Mote et al., 2018; Hamlet et al., 2005).
Hydrology and System Hydraulics
CDA Lake is a 31,875-acre (129-km2) lake in northern Idaho that drains the CDA River, St. Joe River, and other smaller tributaries around the lake’s shoreline. When CDA Lake is full, it holds 2.3 million acre-feet of water (2.79 km3) (Woods and Beckwith, 2008). The north-south trending Lake is roughly 25 miles (35 km) long and its width ranges from about 1 to 3 miles (1.6–4.8 km). The Lake’s shoreline is approximately 135 miles (217 km) long (Horowitz et al., 1993a; Maupin and Weakland, 2009). The maximum depth of the Lake is 210 feet (64 m) (in the central pool), with a mean depth of 72 feet (22 m).
More than 94 percent of the water that flows into CDA Lake comes from the CDA and St. Joe Rivers, which enter along the eastern and southeastern shorelines, respectively. The St. Joe River has an average annual discharge slightly higher than that of the CDA River (2.45 billion m3/yr compared to 2.28 billion m3/yr). Because it drains the part of the basin containing the major mining operations of the last century, the CDA River and its floodplain are heavily contaminated with metals that represent a continuing source of metals contamination to CDA Lake. In comparison to the CDA watershed, the St. Joe watershed has been used primarily by the logging industry, has supported no major mining activities, and has been reported to be relatively uncontaminated with trace elements (Mink et al., 1971; Rabe and Flaherty, 1974; Bender, 1991). Smaller prominent tributaries to CDA Lake include Wolf Lodge Creek, Carlin Creek, Plummer Creek, and Fighting Creek (Maupin and Weakland, 2009). After flowing predominantly from south to north, water in CDA Lake discharges to the Spokane River in the northernmost part of the Lake, near the city of Coeur d’Alene. A small amount of Lake water also recharges the Spokane Valley–Rathdrum Prairie (SVRP) aquifer (discussed below).
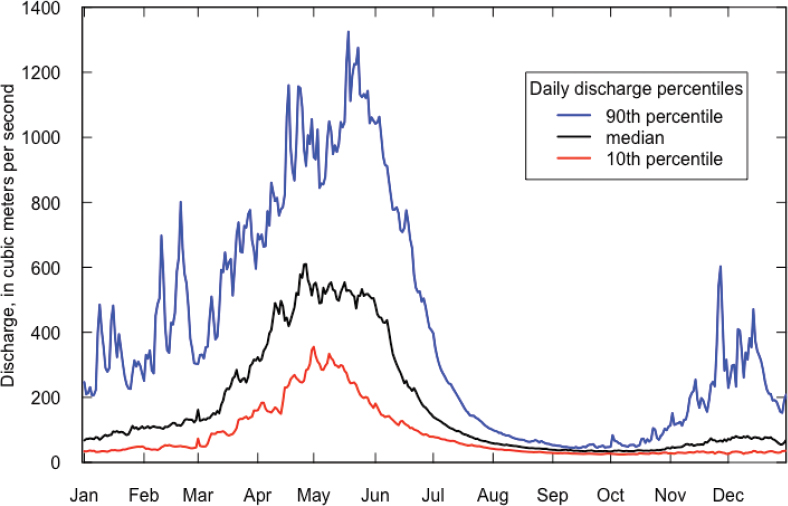
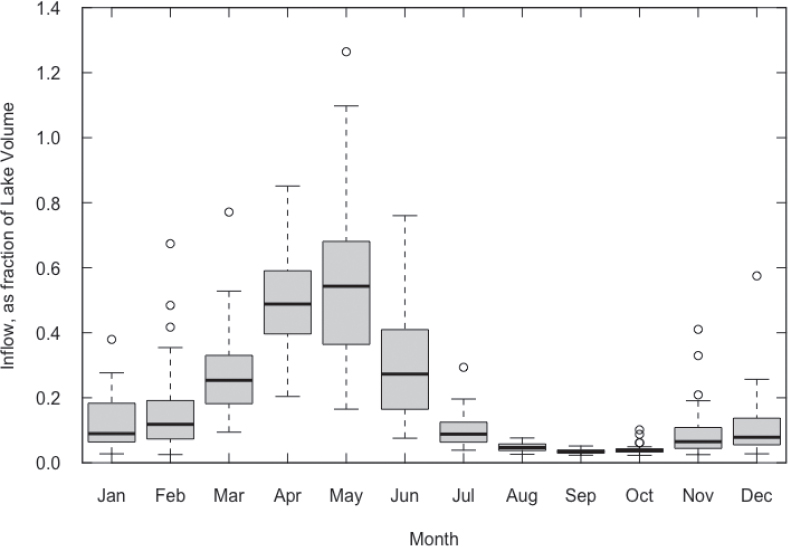
Because the bulk of the precipitation that is delivered to the watershed arrives as snow, the hydrology of the lake’s major contributing watersheds is characterized by a snowmelt-dominated regime and hence varies significantly with season. The rate and timing of snow accumulation, retention, and release is directly reflected in the hydrographs of the rivers that contribute to CDA Lake (Figure 1-13), which show that flow is largely a spring phenomenon, followed by dry summers and falls. Indeed, it is not uncommon for the inflows in April and May to each be roughly half of the entire volume of the Lake (Figure 1-14). Conversely, in the drier months (August, September, and October) the monthly inflows are typically less than 5 percent of the volume of the Lake.
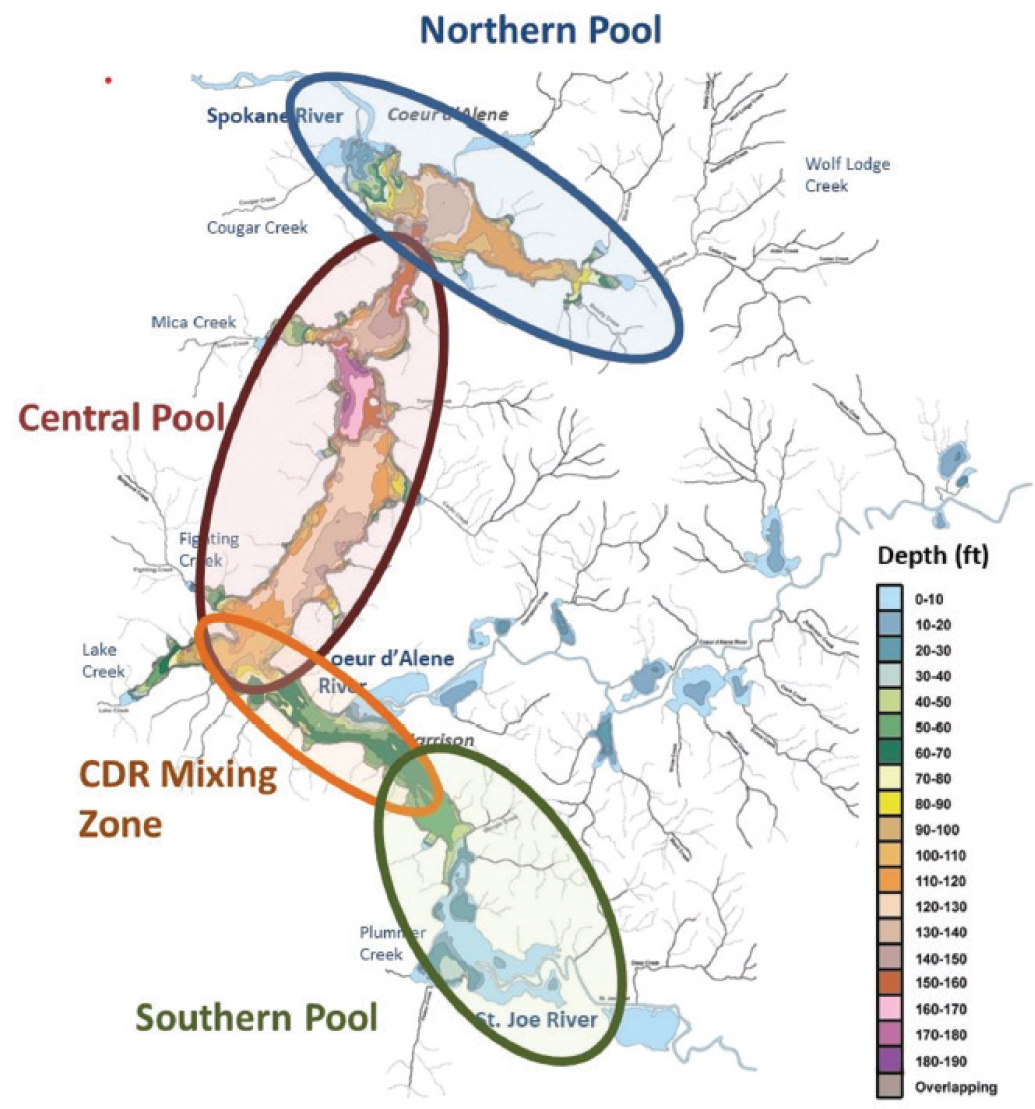
Based on CDA Lake bathymetry (see Figure 1-15), there are roughly four “pool areas” in the Lake, each characterized by relatively deep areas. As a result, these pools are likely to be more depositional, where sediments settle out. In addition, tributary inflow loads from smaller tributaries (i.e., not the CDA or St. Joe rivers) tend to deposit either in the immediate bay areas and the confluence of the tributary with the Lake or in these pool areas. In the case of the CDA River, sediment sampling indicates that fine sediments are pervasive throughout the Lake, with lower loads in the small embayment areas than along the axis of the Lake.
The four main pool areas of CDA Lake, shown in Figure 1-15, are characterized by deep water, exceeding 20–60 m depending on the location. The main pool areas of the Lake experience a range of flows dictated by the CDA and St. Joe Rivers, with water moving south to north through the Lake and past the Post Falls dam, especially during high discharge.2 The main body of the Lake is characterized by the primary long-term monitoring locations C1 through C5 (shown in Figure 2-1 and discussed in greater detail in Chapter 2). The southernmost long-term monitoring site, C6, near Chatcolet Lake, is somewhat of an outlier in that it is more characteristic of local conditions rather than the main body of the larger Lake. Chatcolet Lake is moderately deep, at roughly 10 m, and is separated from the main Lake by shallow vegetated sills 1–2 m in depth, which restricts water exchange between this basin and the main Lake. C6 reflects influence from the St. Joe River and its watershed, which was not as affected by mining. Hence, sediments in Chatcolet Lake are much less contaminated by legacy metals compared to the main body of CDA Lake.
___________________
2 Hydrodynamics become more complex as discharge recedes (see Chapter 4).
Several lateral lakes are adjacent to the CDA River upstream of CDA Lake (see Figure 1-3). These lakes have been monitored irregularly over the past 30 years as part of special studies, but they are not part of the ongoing long-term monitoring programs like C1 through C6. The lateral lakes have much smaller drainage areas contributing flow to them, they are shallow and warmer than the main Lake, and in flood conditions they may be inundated by flood water from the CDA River.
CDA Lake’s mean retention (or residence) time is 0.42 years, calculated based on the Lake volume and the mean discharge presented in Chapter 3 of 209 m3/s. Lakes generally span a range of residence times from months
to decades, depending on the volume of the lake and its watershed, so CDA Lake is at the lower end of the range. There is significant interannual variability in the mean residence time of CDA Lake. For years of high inflow to the Lake (such as 1996), the mean residence time is about 0.25 years. In years with the lowest inflows, the mean residence time can be as high as 0.9 years. Thus, even in the driest years that have been observed, enough water flows into the Lake to replace its volume each year.
Although broadly speaking CDA Lake has about a five-month mean retention time, the hydraulics of the Lake vary considerably throughout the year and by location because of the regulation of Lake levels by the Post Falls Dam, which backs up water into the Lake and further upstream on the CDA River during the summer. Seasonally, average hydraulic residence times vary from 90 days in the February–April period to about 1,100 days in the summer (Cooper, 2021b). During the winter, significant inflows pass through the Lake, bringing sediments laden with metals and other materials. A large proportion of these sediments settle out in the Lake once inflows enter the Lake and flow velocities decrease. In early summer as river inflows decrease, Post Falls Dam operations raise the water level (and volume) in the Lake, increasing the retention time significantly and allowing sediments that entered the Lake to spread out and settle to the bottom. These late spring and summer hydraulic conditions along with warmer temperatures lead to thermal stratification, during which the Lake develops three distinct layers of water: the epilimnion or the top warm layer, the thermocline or middle layer where a temperature gradient is observed, and the colder hypolimnion that extends to the Lake floor. Thermal stratification is caused by the differing density of water of different temperatures. As discussed in detail in Chapter 4, there is ample evidence of thermal stratification in CDA Lake, along with decreases in dissolved oxygen in the hypolimnion at certain locations. Due to the low flows, increased retention time, and increased volume characteristic of CDA Lake in the summer, in-lake physical (i.e., sedimentation), chemical, and biological processes dominate Lake dynamics during this season. Stratification lasts until late summer or early fall, when dam operations allow outflows to increase and disturb the stratification.
Post Falls Dam
Located downstream of CDA Lake on the Spokane River, the Post Falls Dam was constructed in the 1890s to divert the Spokane River’s flow in order to provide power to a saw mill at the same location.3 Following the destruction of the sawmill in a fire in 1902, Washington Water Power purchased the site and developed a hydroelectric facility that would provide power to mines nearly 100 miles away, via the longest high-voltage transmission line in the world. The dam is now operated by Avista Utilities, employing six turbine-generating units that are a source of electricity for mines, mills, businesses, factories, railways and cities in northern Idaho and eastern Washington.
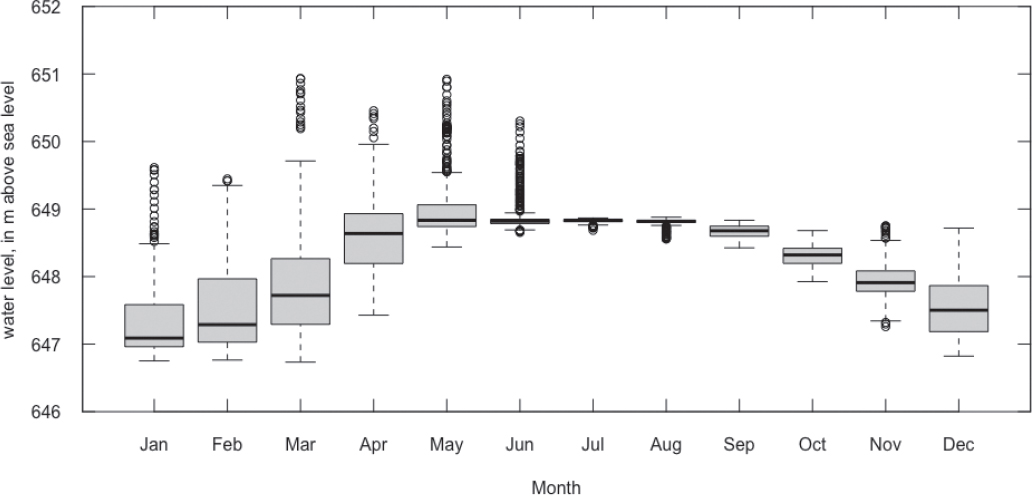
To allow for increased recreational opportunities on CDA Lake, the Post Falls Dam is operated to hold the Lake at a high elevation during the summer months. According to CDA Tribe and Avista (2017), the dam is used to control CDA Lake elevation during the part of the hydrograph when flows are decreasing, typically in June, and then it maintains the Lake level at the summer full pool elevation of 2,128 ft (648.6 m) until the first Tuesday following Labor Day (see Figure 1-16). Following Labor Day, Avista draws the lake down approximately one foot in September, then 1.5 ft per month in October, November, and December until the Lake is at approximately 2,122.5 ft. Once the Lake reaches 2,122.5 ft (646.9 m), which is typically by the end of December, the natural channel restriction at the outlet of the Lake controls the lake’s elevation.
The effects of the Post Falls Dam in summer extend well beyond the Lake into the watershed. In the lower reaches of both the CDA and St. Joe Rivers, elevated Lake levels lead to the creation of large, shallow open water areas that increase habitat for aquatic macrophyte growth and alter the natural levees, lateral lakes, and wetlands ecosystems in the lower reaches of both rivers. Indeed, the shallow southern lakes (e.g., Benewah, Chatcolet, Hidden, and Round Lakes—see Figure 1-3) used to be mostly emergent wetlands before the Post Falls Dam was constructed. During the summer, the dam decreases the gradient of the CDA River to 0.19 m/km such that backwater and substantial quantities of sediment are deposited in the main channel and along the banks and
___________________
floodplain (Bender, 1991). During high flow (e.g., spring snowmelt and runoff), these sediments can be resuspended, transported, and redeposited both in the river and in the Lake (Bender, 1991).
Spokane Valley-Rathdrum Prairie Aquifer
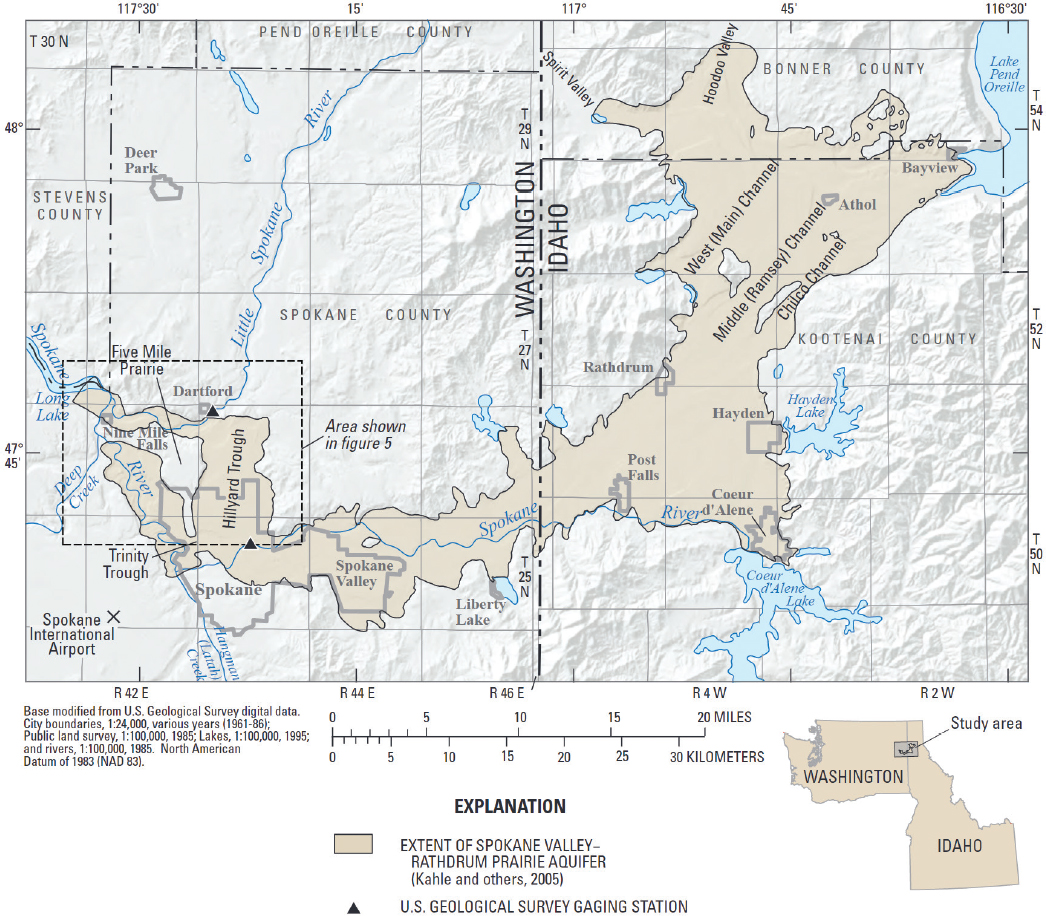
The Upper Spokane River watershed overlies the SVRP aquifer, discovered in 1895 (MacInnis et al., 2009). The aquifer underlies about 370 mi2 of land, trending northeast to southwest from Bonner County, Idaho, near Lake Pend Oreille to CDA Lake in Kootenai County before extending west into Spokane County, Washington, until it ends near Nine Mile Falls, northwest of Spokane (Boese et al., 2015; Kahle et al., 2005) (Figure 1-17). The aquifer holds about 10 trillion gallons (3.78 × 10¹⁰ m3) of water and is the sole source of drinking water to more than 500,000 residents in Kootenai County, Idaho, and Spokane County, Washington, making it one of the most valuable natural resources in the region (Kahle et al., 2005).
The sediments that comprise most of the SVRP aquifer are highly permeable, allowing groundwater to flow as fast as ~50 feet per day (15.2 m per day) in some portions (Boese et al., 2015). This rapid flow rate combined with the SVRP aquifer’s large storage capacity, make it one of the fastest flowing and most productive aquifers in the country (MacInnis et al., 2009). It is also an unconfined aquifer, meaning it has a direct connection to surface water and is recharged by water from local lakes including CDA Lake, streams, rivers, and precipitation (Kahle and Bartolino, 2007; MacInnis et al., 2009). As a result, the SVRP aquifer is highly susceptible to contamination associated with human activities (e.g., urban runoff, septic systems, industrial discharge, mining waste, fertilizer and pesticide use) (MacInnis et al., 2009). In 1978, the SVRP aquifer became the second groundwater reservoir in the nation to be designated a “Sole Source Aquifer” (i.e., sole source of drinking water) by the EPA (Kahle and Bartolino, 2007), a designation that heightened public awareness of this critical resource and prompted resource agencies to protect the aquifer by establishing environmental management practices, such as septic tank removal and stormwater treatment.
The daily water budget for the SVRP aquifer is approximately 1 billion gallons. The Spokane River comprises 43 percent of recharge to the aquifer with minor inflows from irrigation water and septic systems. Recharge from lakes accounts for 28 percent of the inflow, with CDA Lake contributing a moderate amount to that value (Figure 1-18).
Land Uses in the CDA Watershed
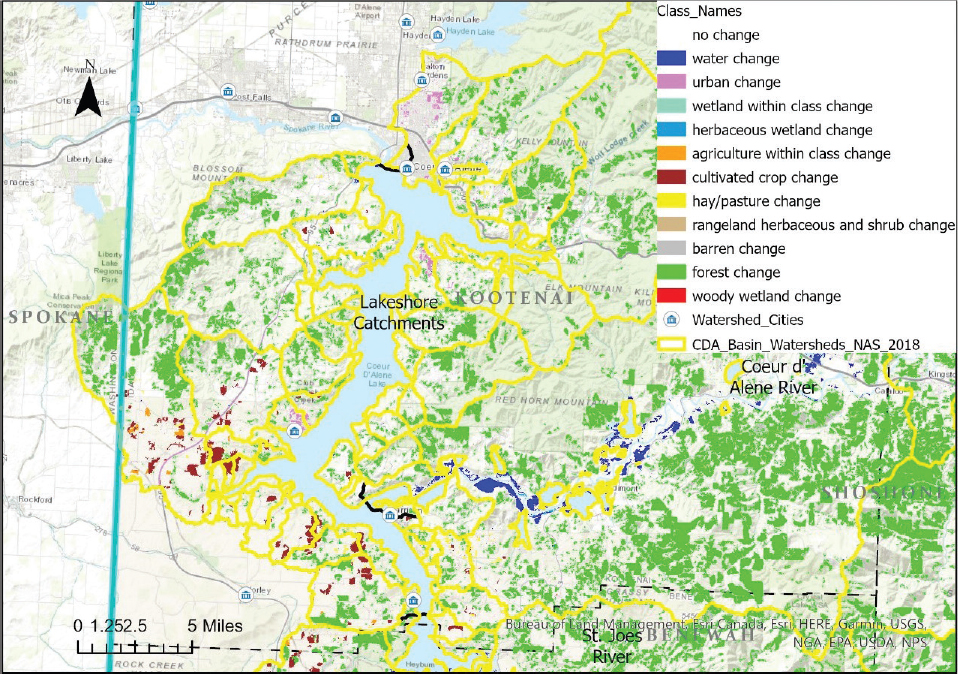
Land use trends in the CDA watershed, such as increased development, are expected to affect sediment and nutrient inputs to CDA Lake. The three primary drainage areas in the watershed (CDA River basin, St. Joe River basin, and the nearshore catchments) vary with respect to geologic, historic, and land-use features and the extent to which they act as sources of contaminants to CDA Lake. The 2001 and 2019 land cover maps for these three areas are shown in Figures 1-19 and 1-20, respectively.
Table 1-1 shows similar land cover data for the CDA basin, but in percentages, with 30-m resolution data from the National Land Cover Database. The land cover categories can be grouped into eight main categories and additional subcategories (see Table 1-2). The year 2001 was selected by the committee as the baseline for evaluating land use trends in the CDA basin because the classification system used between 2001 and 2019 was unchanged, and land use data are available from 2001 to 2019 that facilitated using the Land Cover Change Index. Comparison of the 2001 and 2019 land cover maps shows relatively few changes in developed areas and
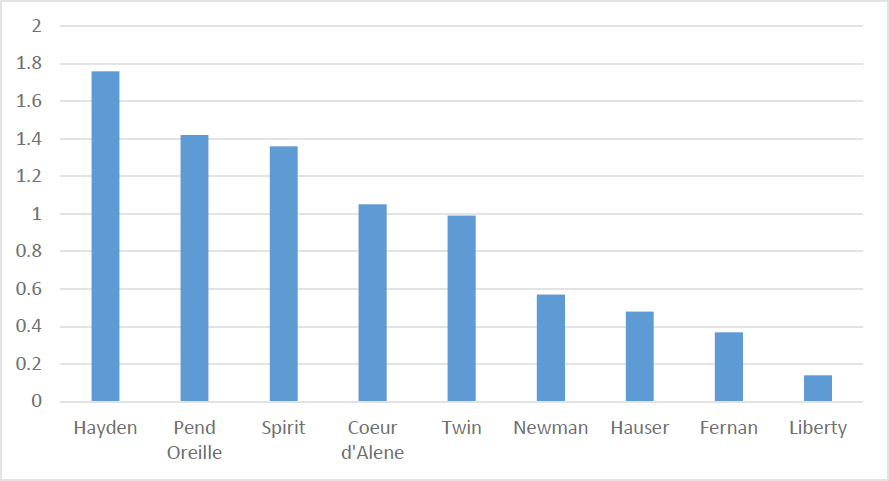
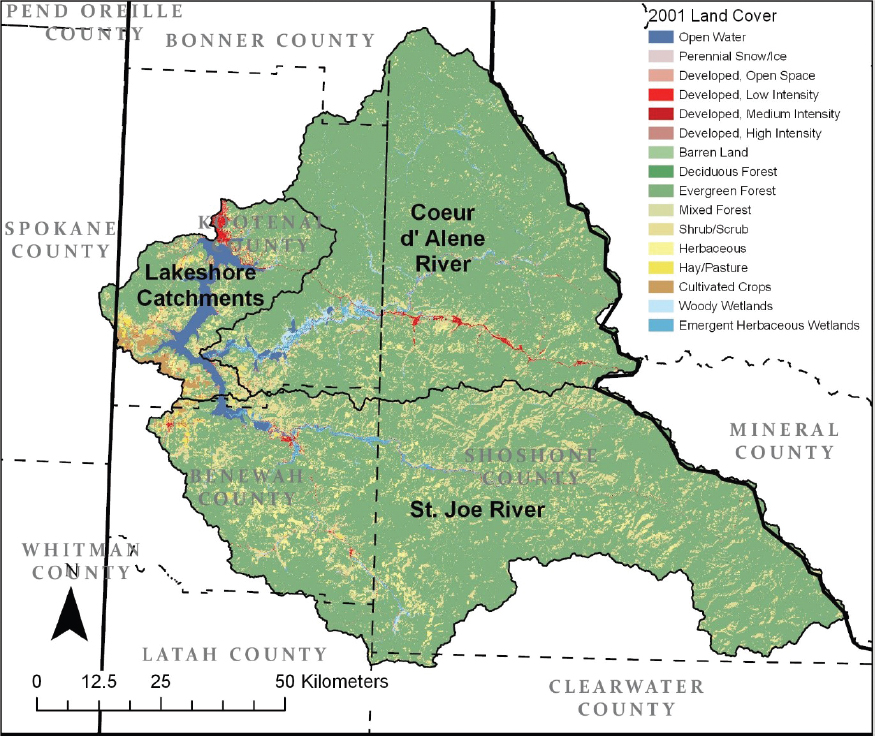
TABLE 1-1 Comparison of CDA Basin Land Use Category Percentages, 2001 and 2019
| Main Category | 2001 Percentage of Land Cover | 2019 Percentage of Land Cover | Percentage Change in Land Cover (2019–2001) |
|---|---|---|---|
| Water | 1.73% | 1.60% | −0.13% |
| Developed | 1.33% | 2.17% | 0.84% |
| Barren | 0.19% | 0.41% | 0.23% |
| Forest | 79.09% | 74.27% | −4.82% |
| Shrubland | 12.79% | 14.58% | 1.79% |
| Herbaceous | 2.46% | 3.07% | 0.61% |
| Planted/Cultivated | 0.29% | 0.55% | 0.25% |
| Wetlands | 1.56% | 1.24% | −0.32% |
SOURCE: National Land Cover Database; https://www.usgs.gov/centers/eros/science/national-land-cover-database.
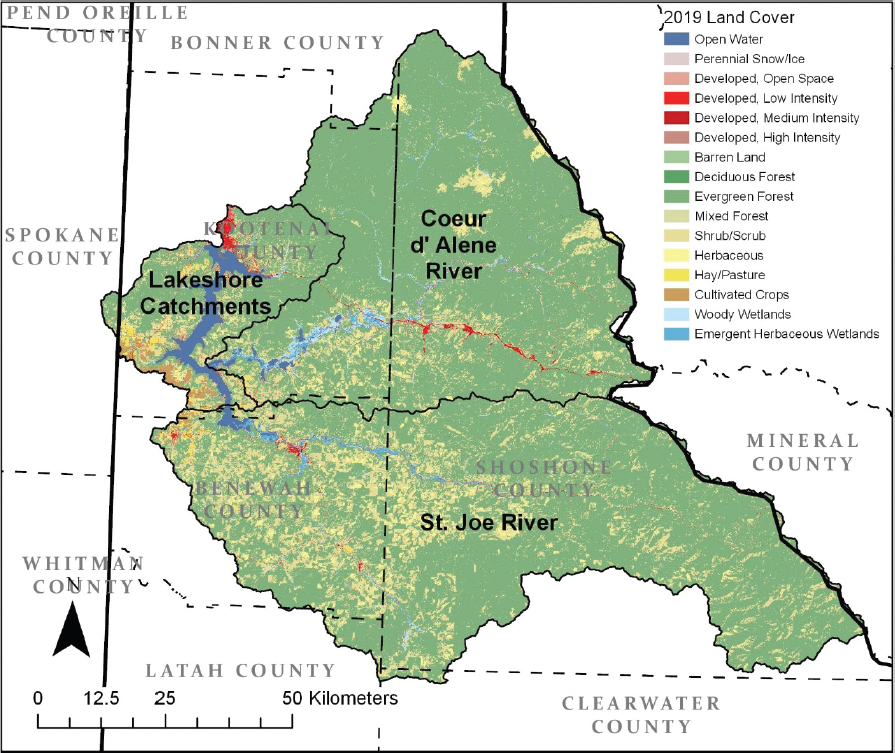
TABLE 1-2 Land Cover Categories Are Based on the Modified Anderson Level II Classification System
| Main Category | Sub Class Number | Sub Category |
|---|---|---|
| Water | 11 | Open Water |
| Developed | 21 | Developed Open Space |
| 22 | Developed Low Intensity | |
| 23 | Developed Medium Intensity | |
| 24 | Developed High Intensity | |
| Barren | 31 | Barren Land |
| Forest | 41 | Deciduous Forest |
| 42 | Evergreen Forest | |
| 43 | Mixed Forest | |
| Shrubland | 52 | Shrub/Scrub |
| Herbaceous | 71 | Grassland/Herbaceous |
| Planted/Cultivated | 81 | Pasture/Hay |
| 82 | Cultivated Crops | |
| Wetlands | 90 | Woody Wetlands |
| 95 | Emergent Herbaceous Wetlands |
SOURCE: National Land Cover Database; https://www.mrlc.gov/data/legends/national-land-cover-database-class-legend-and-description.
herbaceous and planted/cultivated land cover, and yet significant changes in forested land and shrubland. As shown in Table 1-1, the percentage of land that was forested land decreased by nearly 5 percent over the 18-year time period whereas the percentage of shrubland showed the largest increase (1.79 percent). Developed land increased by less than one percent over the 18-year time period.
A transition in land use to more developed land is evident within the lakeshore catchments, as shown in Figure 1-21 (note the pink-colored pixels). Because agricultural and residential/urban lands can have significantly higher phosphorus loading than undeveloped land (Tong and Chen, 2002), there is potential for increased nutrient loadings due to changing land use and population growth. Changes in land surface permeability associated with deforestation, landscaping, road building, and development can also lead to reduced groundwater infiltration, floodplain alteration, flooding, run-off, and nutrient loading during run-off (Rogger et al., 2017; Hogan and Walbridge, 2007).
Population Growth
A growing population in the watershed presents water quality risks for CDA Lake due to potential increases in both point and nonpoint source pollutants of anthropogenic origin. Both stormwater and wastewater inputs of contamination to the Lake may increase as population grows unless appropriate treatment and management are put in place. The LMP (IDEQ and CDA Tribe, 2009) noted about a 20 percent increase in population between 2000 and 2006 in both the city of Coeur d’Alene and Kootenai County, and these trends seem to be continuing within the cities of Coeur d’Alene, Hayden, and Post Falls, and in numerous smaller communities along the lakeshore. In September 2021, Coeur d’Alene was identified as the fifth fastest growing small metro area in the United States, with a 14.6 percent increase in population between 2015 and 2020.4 Recent analyses have also reported that over 75 percent of the population growth in Kootenai County was due to people who migrated to the area.5 The statistics also show that the percentage increase in the over-65 demographic is more than double the percentage increase in the overall population since 2001.
___________________
4 https://lacrossetribune.com/lifestyles/the-15-fastest-growing-metropolitan-areas-in-the-us/collection_b1762b54-e25f-540a-b873-8150c4c50dbb.html#19
5 https://www.krem.com/article/news/local/what-does-north-idaho-growth-mean-for-kootenai-county/293-ffafd844-e778-4839-8087-afdefffbaf45
One of the issues identified within the LMP, the more recent Total Phosphorus Nutrient Inventory (IDEQ and CDA Tribe, 2020), and the Kootenai County Land Use Comprehensive Plan (Kootenai County, 2020) is the uncertain impact of rapid growth and urbanization of nearshore regions of CDA Lake. The Kootenai County Land Use documents reported an estimated population increase from 132,000 in 2006 to 174,673 in 2021, which corresponds to a 2.64 percent annual growth rate6 (and is consistent with the previous estimate from the LMP). The Kootenai County Comprehensive Plan (Kootenai County, 2020) assumed growth over the next 10 years at approximately 2 percent per year, with estimates of the Kootenai County’s population doubling in 35 years. The 2021 annual growth rates for the other counties in the CDA basin are much smaller (see Table 1-3). These values have been relatively consistent for the past several years.
The committee conducted its own analysis of population growth in the CDA basin using ArcGIS and 2021 Census data. The average annual population growth from 1990 to 2010 was 1.35 percent for the entire CDA Lake watershed, 0.96 percent for the St. Joe River basin, and 2.43 percent for the lakeshore watersheds (see first two columns of Table 1-4). In contrast, the CDA River watershed saw a population decline of 0.7 percent during the 1990–2010 period. More recent data show that population in each watershed has increased since 2010, with the greatest percent increase within the lakeshore watersheds, as indicated in the final column of Table 1-4.
The significant differences between the county and watershed populations are due to the presence of populated cities that fall outside of the watershed boundaries. For example, as shown in Figure 1-22, it is evident that Post Falls,
___________________
6 https://worldpopulationreview.com/us-counties/id/kootenai-county-population
TABLE 1-3 2021 Population Growth in Counties That Include Parts of the CDA Watershed
| County | Population | Growth (number) | Percent Annual Growth |
|---|---|---|---|
| Kootenai County | 174,673 | 4,488 | 2.57 |
| Benewah County | 9,458 | 80 | 0.85 |
| Latah County | 40,666 | 279 | 0.69 |
| Shoshone County | 13,066 | 92 | 0.704 |
SOURCE: https://worldpopulationreview.com/us-counties/id.
TABLE 1-4 Watershed Population Data Comparison among Watersheds
| Watershed | 1990 | 2010 | 2021 | Percent Change from 2010 to 2021 |
|---|---|---|---|---|
| St. Joe River Basin | 6,956 | 8,294 | 9,538 | 15.00 |
| Coeur d’Alene River Basin | 13,804 | 13,708 | 14,600 | 6.51 |
| Lakeshore Watersheds | 20,032 | 29,781 | 35,599 | 19.54 |
| Coeur d’Alene Lake Watershed | 40,792 | 51,783 | 59,737 | 15.36 |
SOURCE: 1990 and 2010 data are from Wise (2021); 2021 data are from the Census using ESRI methodology. https://doc.arcgis.com/en/esri-demographics/reference/data-allocation-method.htm.
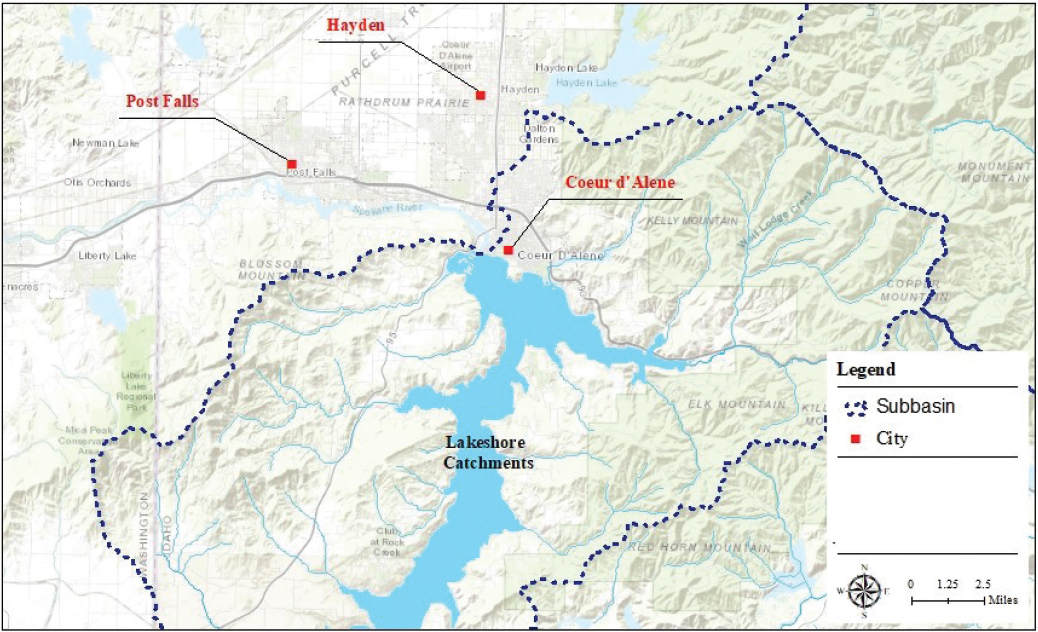
Hayden, and large portions of the city of Coeur d’Alene fall outside of the watershed. These cities are the three largest cities in the county, with 2021 populations of 30,160, 7,360 and 47,840, respectively. The data suggest that there is significant growth occurring in areas near the Lake, but these areas do not necessarily lie within the watershed boundary. Centralized wastewater systems servicing those three cities discharge outside of the CDA basin.
Between 2011 and 2019, land use changes within the entire CDA watershed have been modest, with the greatest change associated with deforestation (less than a 5 percent change in forest land area between 2001 and 2019). Population growth watershed-wide has increased by approximately 15 percent since 2010, with the most substantial urbanization and population growth occurring in the lakeshore watersheds within Kootenai County. Continued development within these areas may have some impact on land use and could lead to increases in total solids and nutrient loadings within nearshore areas, particularly for residences relying on septic systems (see Chapter 3).
MINING HISTORY AND THE SUPERFUND SITE
Over the past 150 years, CDA Lake has received a massive influx of heavy metals that emanated from mineral extraction in the upstream watershed, predominantly within the Coeur d’Alene mining district known as the Silver Valley (Figure 1-23). Mining operations began in the CDA mining district in the mid-1880s along the South Fork of the CDA River and its major tributaries. More than 100 mines and ore processing units within the region produced and processed about 130 million MT of ore containing silver, lead, zinc, and other metals during the first century of operation (Long, 1998b). Total production records highlight the magnitude of operations within the district, which has ranked among the top 1 percent of world producers for silver and lead and among the top 10 percent for zinc (Long, 1998a,b). The Bunker Hill Mine and Smelting Complex, located in Kellogg, Idaho, was the largest mining and ore processing company in the region and the largest smelter in the world at the time it was built.
Over the past three decades, detailed descriptions of the history of mining operations within the CDA region have been published (e.g., Woods and Beckwith, 1997; NRC, 2005). Regarding the CDA watershed between 1883 and 1888, Woods and Beckwith (1997) say, “Perhaps nowhere in the history of Euro-American settlement of western North America was an area so rapidly and drastically transformed.” The focus of this section is to summarize aspects of the mining activities that have had a significant impact on water quality.
History of Mining Contamination
Previous reports describing the ore deposits within the district provide an understanding of the range of contaminants released from the site (Balistrieri et al., 2002). The host rocks are primarily quartzite and argillite
with carbonate bearing rocks interbedded. Quartz and siderite veins contain stratigraphically controlled Pb-Zn-Ag ore shoots. Veins rich in lead and zinc are comprised of argentiferous galena (PbS) and sphalerite (ZnS), while veins rich in silver contain argentiferous tetrahedrite [(Cu, Ag)10(Fe, Zn)2(As, Sb)4S13] with minor amounts of galena and sphalerite. In addition to minerals containing lead, copper, zinc, iron, silver, and arsenic, the veins contain pyrite (FeS2), chalcopyrite (CuFeS2), and minor amounts of arsenopyrite (FeAsS) and pyrrhotite (Fe(1-x)S).
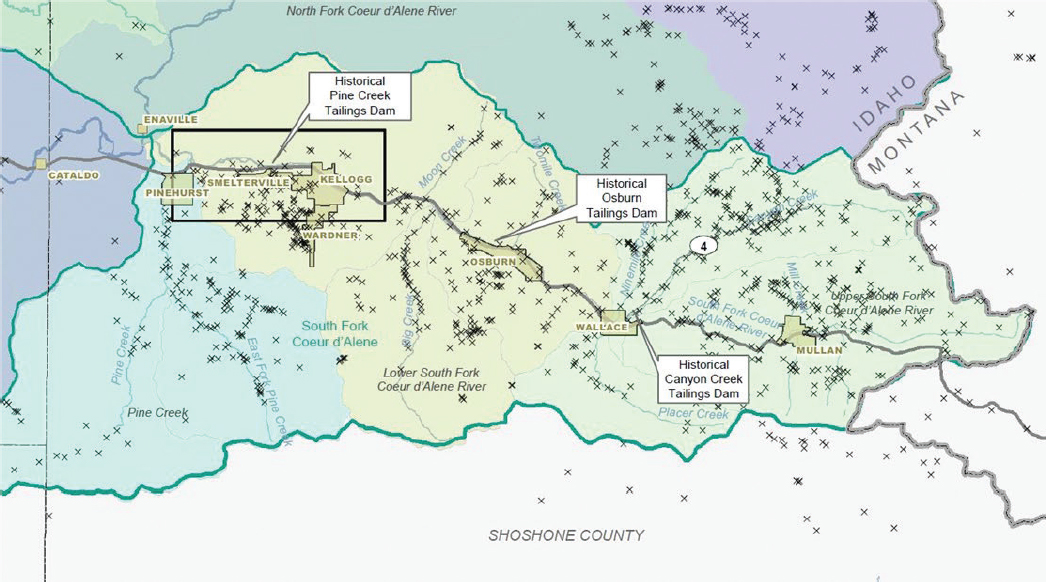
Mining and milling operations conducted over time led to dispersal of more than 100 million tons of contaminated materials spread over thousands of acres (EPA, 2015; Figure 1-24). The principal sources of the most severe metals contamination were air emissions from smelter operations and the tailings resulting from beneficiation (concentration) of the ore. The latter were released without containment directly into the South Fork of the Coeur d’Alene River and its tributaries. Flood events spread particulate contamination across the CDA River basin. At the same time, increased clogging of channels with tailings from mining activities raised stream levels to the point that annual overbank flooding drove flood waters to higher levels, eventually altering stream channels (NRC, 2005).
Increased population growth associated with the success of the mining industry also contributed to spreading contamination across the basin while altering the region’s hydrology. Deforestation from both mining activities and development and road building increased runoff and promoted more rapid movement of contaminants. These impacts did not go unnoticed by residents and settlers in the area. Early attempts to satisfy farmers who complained that tailings were poisoning crops, livestock, dogs, and chickens led to placement of small wooden impounding dams (e.g., Canyon, Osburn, and Pine Creeks shown in Figure 1-24). However, the structures routinely failed, especially during floods. High-flow events deposited contaminated tailings as lenses of tailings or as tailing/sediment mixtures in the bed, banks, floodplains, and lateral lakes of the CDA River basin and in CDA Lake (EPA, 2015).
In response to concerns associated with the lack of fish, macroinvertebrates and planktonic organisms along the 50-mile long South Fork of the CDA River, a floating suction dredge was operated every summer starting in 1931 for 45 years on Mission Flats near Cataldo. The dredged material was allowed to settle in a series of impoundments and the supernatant was returned to the river. The discharge of tailings directly to the South Fork of the
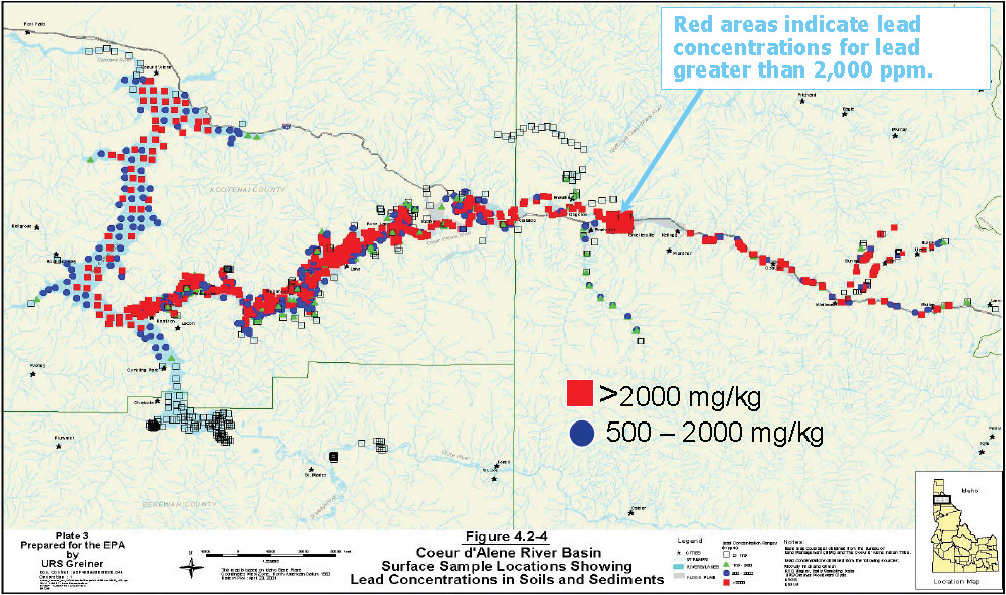
CDA River and its tributaries continued until tailings impoundments were installed per 1968 regulations. Overall estimates by Long (1998b) indicate that 56 million MT of mill tailings were discharged, including 2,200 MT of silver, 800,000 MT of lead, and 650,000 MT of zinc. Substantial deposits remain in the river system and continue to be transported downstream. Figure 1-25 shows the profoundly high lead concentrations along the CDA River and within the Lake as of 2001.
The Central Impoundment Area (CIA) was built at the Bunker Hill Complex in the 1920s. This impoundment, as well as others, was an attempt to contain the tailings from the mining activities. The CIA was built on mine waste rock and other materials and enclosed in a ring dike structure (EPA, 1992). It served as an unlined repository for flotation tailings from the Bunker Hill ore concentration mills. Over time, its size increased to 200 acres, and it was divided into three major cells: the east cell for mine wastes and tailings, a gypsum pond, and a slag pile. It also handled acid mine drainage from the Bunker Hill Mine.
Air emissions from ore processing facilities in Kellogg (operated between 1917 and 1981) and Smelterville also provided significant dispersal of contaminants including lead, zinc and sulfur dioxide. Between 1886 and 1917, smelting operations were conducted offsite, but in 1917 the first blast furnace began producing lead, cadmium, and silver and alloys of these metals. Expansion and modification of the smelter continued, reaching a capacity of more than 300 tons of metallic lead per day at the time of its closure (EPA, 1992). Prior to the fall of 1973, typical releases of particulates from the air pollution control system ranged from 10 to 20 tons per month. After fire damaged the air control system baghouse in September 1973, continued metal production led to releases of 160 tons per month of particulate emissions containing 50 to 70 percent lead (TerraGraphics, 1990). These emissions contaminated nearby areas, led to high blood lead levels in residents, and contributed to denuding of surrounding hillsides. Smelter operations ceased in 1981.
Prior to 1928, the Bunker Hill Complex operations focused on lead, cadmium, and silver. In 1928, an electrolytic zinc plant was put into operation; sulfuric acid plants were added in 1954, 1966, and 1970; and a phosphoric acid plant and fertilizer plant were added in 1960 and 1965, respectively. These operations continued until 1981. Limited mining and milling operation took place from 1983 until 1986 and from 1988 until 1991.
The Superfund Remedy
The widespread contamination generated by the mining activities within the Silver Valley and the documented evidence of human health impacts and ecological damage led to the region’s labeling in 1983 as one of the largest and most complex hazardous waste sites in the United States. That year the Bunker Hill Mining & Metallurgical Complex was designated as a Superfund site based on the high blood lead levels in children and contamination of the local environment by lead, arsenic, cadmium, and zinc. As part of the Superfund process, EPA studied an area that spans 1,500 mi2 (3,884 km2) and 166 river miles (266 km) of northern Idaho and eastern Washington and includes the CDA River, associated tributaries, CDA Lake, and the Spokane River that drains from CDA Lake (Figure 1-26). The final project operating units for remediation efforts include only portions of this study area, as described in greater detail in Chapter 3.
During the remedial investigation, EPA concluded that ambient water quality criteria were exceeded throughout the basin, both Ninemile and Canyon Creeks were devoid of fish and other aquatic life, and habitat fragmentation and destruction was widespread. The most significant contamination was associated with the Box (Figure 1-26)—a rectangle 3 miles (4.8 km) wide and 7 miles (11.2 km) long, from Kellogg on the eastern end to Pinehurst on the western end, that had seen the most intense mining activity. Because mine tailings had been deposited in downstream beds, banks, and floodplains, and because acid mine drainage had discharged to surface waters including the South Fork of the CDA River for over a century, the contamination extended from the eastern end of the watershed, through the entire upper basin along the South Fork, into the lower basin of the CDA River, into CDA Lake, and deposited as far as the Spokane River. To this day, flooding continues to redistribute contaminants across the region and groundwater contamination is widespread.
The long-term remedy for the Superfund site is described in detail in Chapter 3 of this report and in many other reports (e.g., EPA, 2021). Since 1992, the remedial actions in the CDA watershed have attempted
to break exposure pathways for humans and ecological receptors, control source areas, or both. Actions include demolishing mining facilities and waste pits, building treatment plants for mine wastes and contaminated source waters, removing lead-contaminated soil in residential and commercial areas, installing protective barriers (capping), revegetating denuded landscapes and restoring other critical habitats, and remediating and reconstructing floodplains and streams. A 2012 amendment to the remedy extended the activities to consolidation and isolation of sources at upper basin mine and mill sites, construction and maintenance of waste repositories, remediation of road surfaces, protection of remedies from erosion and recontamination, upgrades to the Central Treatment Plant, construction of a groundwater collection system within the Box, and groundwater remediation in Ninemile and Canyon Creek watersheds.
Monitoring of physical, chemical, and biological parameters, including human blood lead levels, has been conducted throughout to determine the effectiveness of the various actions. The 30-year interim remedial plan includes benchmarks for both human health exposure to contaminated soils and ecological protection. However, the remedy is not expected to achieve ambient water quality criteria under the Clean Water Act at all locations, nor is it expected to achieve the applicable and relevant or appropriate requirements for groundwater (i.e., drinking water standards) under the Safe Drinking Water Act at all locations (EPA Region 10, 2012).
Coeur d’Alene Lake Management Plan
CDA Lake was omitted from the Superfund remedy for both technical and sociopolitical reasons. Rather, EPA deferred selecting remedial actions for the Lake, pending implementation of a Lake Management Plan (LMP) along with ongoing evaluation of the effect that current cleanup work in the lower basin, the Box, and the upper basin will have on water quality in CDA Lake (EPA, 2020). Finalized in 2009, the LMP was developed by the State of Idaho and the CDA Tribe with the goal of protecting and improving water quality by limiting basin-wide nutrient inputs that impair water quality or impact metal ion solubility (IDEQ and CDA Tribe, 2009). A low nutrient, high hypolimnetic dissolved oxygen condition was thought to be the optimal state for immobilization and net burial of residual metals in the Lake sediments and necessary to prevent harmful algal blooms.
The primary responsibilities outlined in the LMP for the CDA Tribe and IDEQ were to develop partnerships with community groups, businesses, and other governmental agencies; coordinate the different authorities involved in management of the basin; and seek funds for implementing activities to achieve the goals of the LMP. A core component of the LMP that was recently completed is the development of a basin-wide nutrient inventory (finalized for phosphorus; IDEQ and the CDA Tribe, 2020; reviewed in Chapter 3). Also within the LMP are activities meant to reduce nutrient loading to CDA Lake, as described in a nutrient management action plan.
Progress made on implementing the LMP is reported on annually by the Basin Environmental Improvement Project Commission (BEIPC), a group of representatives from the State of Idaho, the three Idaho counties in the basin, the CDA Tribe, the State of Washington, and the United States. BEIPC is broadly responsible for coordinating environmental cleanup to address heavy metal contamination, natural resource restoration, and water quality in the CDA basin, including the Superfund remedy. In its most recent annual report (2020), the BEIPC listed the major programs with the LMP as (1) the Science Core Program which covers routine lake monitoring by the CDA Tribe and IDEQ staff; (2) the Education and Outreach Core Program; and (3) the Nutrient Inventory and Nutrient Reduction Core Program. The 2020 annual report is available on the IDEQ’s lake management web page.7 There is no regular comprehensive accounting of specific actions taken to reduce nutrient loadings to CDA Lake done under the auspices of the LMP (personal communication, Jamie Brunner, IDEQ, January 2022).
As of the summer of 2018, the CDA Tribe determined that the LMP was inadequate, in itself, as an effective tool to protect water quality in the Lake. The CDA Tribe withdrew their support as a signatory government to the LMP in 2019. In 2020, the State of Idaho, Kootenai County and EPA sponsored the contract with the National Academies to conduct a neutral third-party review of the Lake data—an action that the CDA Tribe supported.
___________________
7 http://www.basincommission.com/wp-content/uploads/2021/03/2020-Draft-Annual-Report.pdf
FEDERAL, REGIONAL, AND LOCAL AUTHORITY AND OVERSIGHT
The administrative structure for management of water quality in CDA Lake and its basin is complex, involving federal, state and tribal jurisdictional and authoritative bodies, especially EPA Region 10, IDEQ, and the Lake Management Department of the CDA Tribe. These three organizations are primarily responsible, respectively, for operating the Superfund site remedy; assessing compliance with water quality standards and identifying water quality limited waterbodies; and maintaining authority over most water quality issues within tribal boundaries. Additional oversight and support for water quality management come from the U.S. Army Corps of Engineers (ACOE) and USDA; Washington Department of Ecology; Panhandle Health District 1; Idaho’s Soil Conservation Commission, Transportation Department, Department of Water Resources (IDWR), and Department of Lands (IDL); and city and county agencies within the basin. These entities, along with the CDA Tribe and IDEQ, are responsible for overseeing wastewater treatment operations and discharges, stormwater management, construction site erosion control, and water-related activities such as dredging, excavation and fill, streambed alterations, nuisance organisms, water levels and outflow rates, and land use activities (IDEQ and CDA Tribe, 2009). County governments in the basin use their authority under state law to promulgate zoning ordinances that regulate private land uses that can affect water quality conditions in the Lake. Federal and state resource agencies also exercise authorities over upland activities that may influence water quality conditions in tributary waters and the Lake.
Federal Authority
EPA’s direct involvement in the region has been heavily weighted toward Comprehensive Environmental Response, Compensation, and Liability Act of 1980 (CERCLA) implementation and enforcement at the Bunker Hill Superfund site. In addition to this large role, EPA reviews and approves water quality standards that have been established by the State of Idaho and Tribes under the 1972 federal Clean Water Act (CWA). Idaho water quality standards are reviewed every three years.
Until 2018, EPA also was the agency responsible for administering the National Pollutant Discharge Elimination System permits for facilities across state and tribal waters. Authority was passed to Idaho for municipal and pretreatment permits on July 1, 2018; industrial permits on July 1, 2019; general permits on July 2, 2020; and federal facilities, stormwater, and biosolids permits on July 1, 2021.8 An Idaho Pollution Discharge Elimination System permit authorizes point source pollutant discharges into Idaho waters of the United States, except on tribal land.
State Authority
Although IDEQ is the designated agency responsible for implementing state water quality standards to restore and maintain designated beneficial uses of streams, lakes, and other surface waters (Idaho Code §39-3601), the Coeur d’Alene Regional Office of IDEQ has local responsibility for the five-county Panhandle Area that includes the basin. This IDEQ office also receives and responds to water quality complaints and issues water quality certifications for federal permits under Section 401 of the CWA, reviews permits under the Idaho Joint Application for Permits (which includes those from IDL, IDWR, and ACOE), reviews engineering plans and specifications for water and wastewater systems, issues permits for wastewater reuse, and performs analyses and administers rules for groundwater. As part of its authority under the CWA, IDEQ establishes the total maximum daily load (TMDL) of a contaminant that can be discharged into a waterbody or segment for the sub-basins, identifies impairments within water segments or lakes, and lists those segments on a 303(d) list of impaired or threatened waters. IDEQ prepares integrated reports of current conditions of all state waters [per 305(b) requirements], including an assessment of status and trends of publicly owned lakes and listing of those waters that are impaired (not supporting their intended use) and need a TMDL. The most recent report, Idaho’s 2018/2020 Integrated Report (IDEQ, 2020b), is also presented as an Integrated Report StoryMap.9
___________________
8 https://www.deq.idaho.gov/water-quality/wastewater/permit-options/
9 https://storymaps.arcgis.com/stories/740e317eebc546d0b3ebbed5419aba79
Coeur d’Alene Tribal Authority
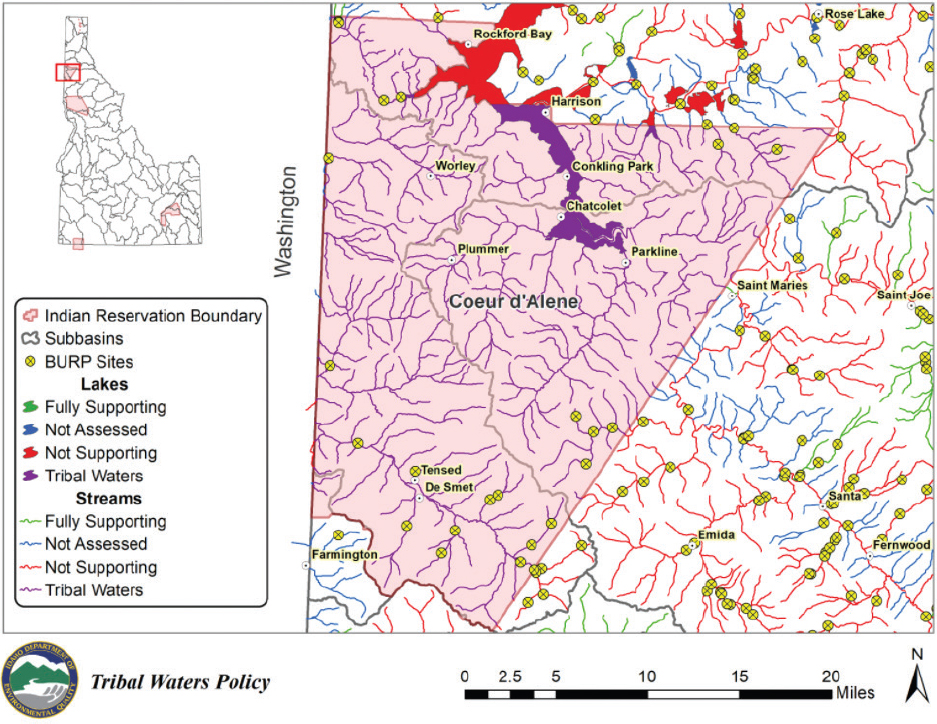
The CDA Tribe has authority for setting water quality standards and enhancing and protecting water quality within their reservation. It has established a Lake Management Department to implement parts of the federal CWA and manage recreation, water resources, and hazardous wastes. As such, the Tribe also receives and responds to water quality complaints and issues water quality certifications for federal permits, reviews permits under the Idaho Joint Application for Permits, develops and enforces encroachment standards, regulates dredge and fill activities, performs groundwater analyses and characterization, and implements wellhead protection activities. Figure 1-27 provides a map showing the tribal waters in and surrounding CDA Lake.
Other Authorities Including Land Use Authorities
Water quality within CDA Lake is under the purview of a number of additional agencies and commissions beyond those already discussed. The IDL manages Idaho’s public trust lands and the lands beneath Idaho’s navigable waterways, including riverbeds and the beds and banks of Idaho’s navigable lakes.10 The IDL regulates encroachments (e.g., docks, marinas, shoreline stabilization) on navigable lakes in order to balance the protection of property, navigation, fish and wildlife habitat, aquatic life, recreation, aesthetic beauty and water quality with navigational or economic necessities (Idaho Code §58-1301).
___________________
Shoshone, Kootenai, Benewah, and Latah Counties and their respective cities have enacted ordinances to manage upland development and other land use activities in the basin. Kootenai County’s (2020) Comprehensive Plan outlines goals, policies and objectives in light of projected future population growth and land use, but it is not enforceable land use regulation. Nonetheless, the Comprehensive Plan recognizes a shoreline designation that “includes lands within 500 feet of bodies of water . . . directly adjacent to shorelines and lands where a portion of the parcel is within the 500-foot boundary.” Recognizing that development demand in these areas is high, the purpose of this designation is to guard against water quality degradation by managing erosion and surface water runoff, reducing impervious surfaces in developments, and implementing setbacks from shorelines and surface water corridors. The 2016 ordinances11 provide detailed information about high water mark elevations, prohibited activities such as application of fertilizer or storage of chemicals, permitted activities including infrastructure development, site improvement, vegetation modification and erosion control; and development exceptions.
CURRENT WATER QUALITY CONDITIONS
The current water quality conditions in CDA Lake demonstrate the legacy of more than 100 years of mining in the watershed. Table 1-5 shows the water quality standards laid out by both the State of Idaho and the CDA Tribe, depending on the location in the Lake. In addition, the table lists the LMP water quality triggers for key metals and nutrients (total phosphorus, dissolved oxygen, chlorophyll a, lead, zinc, and cadmium), which in some cases default to the state and tribal water quality standards, but in other cases are slightly different.
Because the toxicity of metals to humans and ecological receptors is discussed in greater detail in Chapter 9, and the current concentrations of metals and nutrients are evaluated in great depth in Chapter 4, only cursory remarks are made here, to highlight the extent of the metals contamination in CDA Lake. CDA Lake is in violation of Idaho’s water quality standards for some of the metals of concern in the northern half of the Lake, with zinc concentrations routinely well over the water quality standard of 36 μg/L and cadmium concentrations hovering around the standard of 0.25 μg/L. The CDA Tribe’s water quality standards for these same metals are being violated at the more southern C5 location, but not at the southernmost monitoring location, C6. The Lake is also in violation of water quality standards for mercury, based on fish tissue concentrations. The IDEQ 2018–2020 Integrated Report (IDEQ, 2020b) and the most recent LMP status update on water quality (IDEQ, 2020a) report current metals concentrations and violations of standards in the northern half of the Lake. As would be expected given its drainage area, violations of metals standards are also evident along the extent of the CDA River.
Despite these violations, there are no current enforceable requirements to return metals concentrations to levels that meet water quality standards in CDA Lake (via the creation of a TMDL under the CWA). In 2000, EPA and Idaho established a metals TMDL for CDA Lake, but the TMDL was challenged in the Idaho Supreme Court and vacated for failure to follow state rulemaking provisions.12 Nonetheless, there are TMDLs in place for certain metals (particularly mercury) in some segments of the CDA River (see Idaho’s 2018/2020 Integrated Report—IDEQ, 2020b). The addition of mercury impairment for the CDA River segments in 2019 resulted from fish tissue samples that exceeded the water quality criterion (0.3 mg Hg/kg fresh weight tissue) for designated uses of primary contact recreation, cold water aquatic life, and salmonid spawning (Essig, 2010). The priorities for developing TMDLs in the CDA basin (as reflected in Idaho’s 2018/2020 Integrated Report) range from low to high, with the South Fork of the CDA River and the Spokane River being the highest priority for the IDEQ.
Although there have been concerns expressed among IDEQ, the CDA Tribe, and stakeholders with respect to nutrient loading, CDA Lake is not currently listed as impaired for nutrients.
Dissolved Metal Concentrations in CDA Lake Compared to Other Lakes
Although annual mean concentrations of dissolved zinc, cadmium, lead, and arsenic have continued to exceed water quality standards in at least some locations in CDA Lake in recent years (IDEQ, 2020a), the reports on these
___________________
11 https://www.kcgov.us/DocumentCenter/View/1506/Ordinance-493-Land-Use-Development-Code-Amended-PDF
12 https://www.idl.idaho.gov/wp-content/uploads/sites/116/2020/10/ASARCO-v-State-of-Idaho-69P3d139_2003.pdf
TABLE 1-5 Water Quality Standards (WQS) and LMP Triggers for Contaminants of Concern in CDA Lake
| C1 | C4 | C5 | C6 | |||||
|---|---|---|---|---|---|---|---|---|
| Idaho WQS | LMP Trigger | Idaho WQS | LMP Trigger | CDA Tribe Standard | LMP Trigger | CDA Tribe Standard | LMP Trigger | |
| Total P | narrative | 8 μg/L | narrative | 8 μg/L | narrative | 8 μg/L | narrative | 9 μg/L |
| DO | Hypolimnion exempt | min < 6 mg/L | Hypolimnion exempt | min < 6 mg/L | min > 8 mg/L | min < 8 mg/L | min > 6 mg/L | Exceedance of WQS |
| chl a | narrative | 3 μg/L annual geo mean; 5 μg/L max | narrative | 3 μg/L annual geo mean; 5 μg/L max | narrative | 3 μg/L annual geo mean; 5 μg/L max | narrative | 3 μg/L annual geo mean; 5 μg/L max |
| Pb | 0.54 μg/L | Already exceeds WQS | 0.54 μg/L | Already exceeds WQS | 0.39–0.56 μg/L | Already exceeds WQS | 0.45–0.55 μg/L | Exceedance of WQS |
| Zn | 36 μg/L | Already exceeds WQS | 36 μg/L | Already exceeds WQS | 26–37 μg/L | Already exceeds WQS | 26–37 μg/L | Exceedance of WQS |
| Cd | 0.25 μg/L | Already exceeds WQS | 0.25 μg/L | Already exceeds WQS | 0.19–0.26 μg/L | Already exceeds WQS | 0.2–0.27 μg/L | Exceedance of WQS |
Notes: C1 through C6 denote Lake locations; see Chapter 2. P = phosphorus, DO = dissolved oxygen, chl a = chlorophyll a, Pb = lead, Zn = zinc, and Cd = cadmium.
SOURCES: C1 and C4 values from IDEQ (2020a); C5 and C6 values from IDEQ and CDA Tribe (2017).
data have not established a context for these concentrations relative to other lakes. Surveys of dissolved metal concentrations in the waters of lakes comparable in size to CDA Lake are not especially common (Luoma and Rainbow, 2008). Nonetheless, there are enough data available to clearly illustrate that dissolved concentrations of zinc, cadmium, and lead in CDA Lake are more than an order of magnitude higher than those measured in other large lakes, many with urbanized or industrialized watersheds (Table 1-6). The water column concentrations of lead and especially zinc and cadmium in CDA Lake are unusually high for such a large lake. This comparison illustrates the challenges of bringing metal enrichment in CDA Lake to a level commensurate with other lakes surrounded by human development and industry, and it is also useful for better understanding the potential for impacts on ecological and human health.
In CDA Lake, the annual mean or median dissolved lead concentration never exceeds 1 μg/L and only exceeds the target of 0.54 μg/L occasionally (IDEQ, 2020a). Nevertheless, it is important to recognize that dissolved concentrations of lead are typically extremely low in lake waters because of the high affinity of lead for particulate material. For example, Coale and Flegal (1989), using ultra-clean methodologies, found that dissolved lead concentrations across Lake Erie and Lake Ontario varied from 0.002 to 0.058 μg/L in the mid-1980s, with the highest concentrations near the urban developments and industrial activities on the shoreline. They showed that a primary source of that lead was atmospheric input originating from leaded gasoline. Use of leaded gasoline contributed to a global elevation of lead concentrations in large lakes and oceans throughout the 1980s. Industrial emissions of lead have declined since the 1980s, lead is no longer added to gasoline, and overall lead concentrations have declined in many environments (Luoma and Rainbow, 2008). Yet, present-day annual mean dissolved lead concentrations at the C4 monitoring location within CDA Lake would have to decline to less than 10 percent of the 2017–2019 concentrations to even reach the levels typical of shallow waters in the Great Lakes during the 1980s.
Annual mean or median dissolved cadmium and especially zinc concentrations within CDA Lake exceed the LMP targets more frequently than did dissolved lead (IDEQ and CDA Tribe, 2020). In the largest lakes listed in Table 1-6 other than CDA Lake, dissolved zinc concentrations do not exceed 1 μg/L. Higher concentrations were observed in the somewhat smaller lakes listed in Table 1-6 (i.e., Lake Greifen and a study of 28 lakes in Quebec
TABLE 1-6 Range of Dissolved Arsenic (As), Cadmium (Cd), Zinc (Zn), and Lead (Pb) Concentrations in Selected Large Lakes
| Selected Lakes | As μg/L | Cd μg/L | Zn μg/L | Pb μg/L | Source |
|---|---|---|---|---|---|
| Great Lakes | 0.002–0.0045 | 0.087–0.280 | 0.003–0.011 | Nriagu et al., 1995 | |
| “Baseline” lakes | 0.3–1.9 | Smedley and Kinniburgh, 2002 | |||
| Lake Tahoe | 1.12 | 0.0032–0.008 | 0.0005–0.0052 | Anderson and Bruland, 1991; Romero et al., 2013; Chien et al., 2019 | |
| Lake Erie, Ontario | 0.52 | 0.002–0.011 | 0.005–0.11 | 0.002–0.058 | Anderson and Bruland, 1991; Coale and Flegal, 1989 |
| Lake Sammamish WA | 0.0008–0.005 | 0.12–0.60 | Balistrieri et al., 1992 | ||
| Lake Greifen* | 0.65–2.6 | Xue et al., 1995 | |||
| 28 Quebec & Ontario lakes | 0.13–0.97; 2.0–2.7 | Tessier et al., 1989 | |||
| Coeur d’Alene Lake | |||||
| C1: 2017–2020* | 0.25–0.45 | 0.10–0.27 | 25–70 | < 0.05–3.0 | IDEQ, 2020a |
| C4: 2017–2020* | 0.28–0.55 | 0.12–0.46 | 27–76 | 0.2–64 | IDEQ, 2020a |
| C5: 2017–2020* | < 0.2–0.57 | < 0.05–0.15 | < 5–90 | 0.07–0.9 | CDA Tribe data |
* Range includes surface and bottom waters.
and Ontario, Canada, that include mine-influenced lakes with pH > 6.0). Lake Greifen is a eutrophic lake affected by sewage inputs, and many of the Canadian lakes are mine-influenced. The maximum zinc concentrations in the smaller contaminated lakes is 2.7 μg/L (5 of the 28 high pH lakes had [Zn] > 1 μg/L). The point to be made is that the annual mean and the maximum concentrations of zinc in CDA Lake far exceed concentrations typical of even enriched high-pH lakes. Dissolved zinc concentrations would have to decline to about 1 percent of annual mean or median zinc concentrations at the C4 monitoring location of CDA Lake to approach concentrations in a typical larger lake.
On the other hand, arsenic concentrations at C4 only occasionally exceed values typically seen in larger lakes and are far lower than extreme concentrations observed in alkaline lakes or systems where sediments regularly become anoxic (Smedley and Kinniburgh, 2002).
NATIONAL ACADEMIES STUDY
Despite the diminution of mining and the implementation of the Bunker Hill Superfund remedy, CDA Lake does not meet water quality standards for metals throughout the Lake and during all seasons. Exposure of humans as well as fish and wildlife in the region to unsafe levels of metals is still a concern in parts of the Lake and the CDA watershed, and the Superfund remedy is ongoing. Other uses of the Lake (for recreation and tourism) have continued to thrive despite the massive metals loading to the Lake over the past 100 years.
In the past 15 years, some stakeholders have become concerned about development along the lake shorelines, land use changes within the larger basin, and other dynamics that might pose a potential new threat in the form of increased loading of nutrients (i.e., phosphorus and nitrogen) that could lead to the release of metals bound to lake sediments. Indeed, the premise of the LMP is that an increase in phosphorus loading to the Lake, combined with decreases in zinc loading due to Superfund remedial actions, could pose new problems to CDA Lake if these changes lead to increased growth of algae in the Lake, associated production of algal toxins, and depression of oxygen levels (IDEQ and CDA Tribe, 2009). The hypothesis of concern is that a decrease in oxygen levels in Lake sediments could promote the release of metals from the Lake sediments into the Lake water column, potentially leading to even worse water quality (IDEQ and CDA Tribe, 2009).
These issues are complicated by the fact that funds for the Superfund remedy cannot currently be spent to study or remediate CDA Lake. Rather, the State of Idaho and the CDA Tribe are implementing the LMP outside of the Superfund process, primarily to manage nutrient loads entering the basin in an effort to maintain adequate oxygen levels in the Lake. Thirteen years since the writing of the LMP, reports such as IDEQ (2020a) express concern about water quality conditions in the Lake. Hence, IDEQ, EPA, and Kootenai County requested the involvement of the National Academies to analyze available data and information about CDA Lake water quality and provide insights about future conditions in the Lake.
In late 2020, the National Academies assembled a committee to review historical and recent water quality data, and available modeling efforts, stemming from the 2009 LMP and other available information, with the goal of determining what near-future water quality conditions in the Lake might be. More specifically, the committee was asked to do the following:
- Evaluate current water quality in the Lake, lower rivers, and lateral lakes with a focus on observed trends in nutrient loading and metals concentrations (Chapters 3 through 6), while also considering how changes in temperature or precipitation could affect those trends (Chapter 10).
- Consider the impacts of current summertime anoxia on the fate of the metals and nutrients (Chapters 5 and 6).
- Consider whether reduced levels of zinc entering the Lake as a result of the upgrade to the Central Treatment Plant and other upstream activities are removing an important control on algal growth (Chapters 5 and 9).
- Discuss whether metals currently found in Lake sediments will be released into the Lake if current trends continue (Chapters 7 and 10). If sufficient data are not available to result in a high level of confidence in its conclusions, the National Academies will identify the additional data that are required to achieve an appropriate level of confidence (Chapter 8).
- Discuss the relevance of metals release in the Lake to human and ecological health (Chapter 9).
The committee met six times over a 15-month period. Given the ongoing COVID-19 pandemic, these meetings were held entirely in a virtual format, with the exception of the final closed-session meeting. Nonetheless, the committee benefited from ongoing dialogues with a large stakeholder group, including the IDEQ, the CDA Tribe, EPA, USGS, county representatives, researchers from the University of Idaho, and other parties.
Organization of Report
This report begins with two introductory chapters that provide context for understanding the future of water quality in CDA Lake. Chapter 1 has already introduced the Lake and the region, including its climate, hydrology, current water quality, population, land use, and regulatory environment. Chapter 2 discusses the physical, chemical, and biological monitoring of the Lake, including a discussion of the data sets used by the committee to elucidate water quality trends and how monitoring could be improved in the future.
Chapter 3 discusses inputs of water, metals, and nutrients to CDA Lake from the watershed, including the committee’s analysis of trends in contaminant concentrations and loading over time. Similarly, Chapters 4, 5, and 6 evaluate the water quality of the Lake itself, including the committee’s analyses of trends over time in hydrodynamics (Chapter 4), dissolved oxygen and nutrients (Chapter 5), and metals (Chapter 6). Chapter 7 discusses processes occurring in the Lake sediments that could lead to release of metals from the sediments into the water column, including analyses of bottom water data and limited sediment core data for dissolved oxygen, nutrients, and metals.
With the benefit of the completed data analyses, Chapter 8 returns to the subject of Chapter 2 by making recommendations for improving the water quality monitoring in CDA Lake. Chapter 9 reviews the human health and ecological risks posed by metals in CDA Lake. Finally, Chapter 10 discusses the role of climate change and how it may alter the trends observed in Chapters 3 through 7. Each chapter ends with conclusions and (when appropriate) recommendations that synthesize more technical and specific statements in the body of each chapter. The most important conclusions and recommendations from Chapters 3 through 10 are compiled in the report summary.
REFERENCES
Anderson, L. C., and K. W. Bruland. 1991. Biogeochemistry of arsenic in natural waters: the importance of methylated species. Environ. Sci. Technol. 25(3):420–427.
Balistrieri, L. S., J. W. Murray, and B. Paul. 1992. The biogeochemical cycling of trace metals in the water column of Lake Sammamish, Washington: Response to seasonally anoxic conditions. Limnol. Oceanogr. 37(3):529–548.
Balistrieri, L., S. Box, A. Bookstrom, R. Hooper, and J. Mahoney. 2002. Impacts of Historical Mining in the Coeur d’Alene River Basin. Chapter 6 In: Pathways of Metal Transfer from Mineralized Sources to Bioreceptors: A Synthesis of the Mineral Resources Program’s Past Environmental Studies in the Western United States and Future Research Directions. USGS Bulletin 2191. L. S. Balistrieri and L. L. Stillings, eds.
Bender, S. F. 1991. Investigation of the chemical composition and distribution of mining wastes in Killarney Lake, Coeur d’Alene area, northern Idaho. Doctoral dissertation, University of Idaho.
Boese, R., G. Stevens, A. Hess, J. Jenkins, R. Barlow, A. Clary, J. Covert, J. Ekins, M. Galante, T. Hanson, L. Laumatia, M. LaScuola, R. Lindsay, S. Phillips, and L. Schmidt. 2015. The Spokane Valley-Rathdrum Prairie Aquifer Atlas, 2015 Update. City of Spokane.
Bookstrom, A. A., S. E. Box, J. K. Campbell, K. I. Foster, and B. L. Jackson. 2001. Lead-rich sediments, Coeur d’Alene River Valley, Idaho: area, volume, tonnage, and lead content. U.S. Geological Survey Open-File Report, 01-140.
Chien, C. T., B. Allen, N. T. Dimova, J. Yang, J. Reuter, G. Schladow, and A. Paytan. 2019. Evaluation of atmospheric dry deposition as a source of nutrients and trace metals to Lake Tahoe. Chemical Geology 511:178–189.
Chess, D. 2021. Water Quality Data Summary. Presentation to the NASEM Committee. February 26, 2021.
Coale, K. H., and A. R. Flegal. 1989. Copper, zinc, cadmium and lead in surface waters of Lakes Erie and Ontario. Science of the Total Environment 87:297–304.
Cooper, C. 2021a. Coeur d’Alene Lake Management Plan Water Quality Data and Trends. Presentation to the NASEM Committee. February 26, 2021.
Cooper, C. 2021b. Conceptual Model of CDA Lake. Presentation to the NASEM Committee. February 26, 2021.
Coeur d’Alene Tribe and Avista Corporation. 2017. Coeur d’Alene Reservation Five-Year Synthesis 2011–2015 Monitoring Data 4(E) Condition No. 5 Spokane River Hydroelectric Project FERC Project No. 2545. February 2017.
Daly, C., M. Halbleib, J. I. Smith, W. P. Gibson, M. K. Doggett, G. H. Taylor, J. Curtis, and P. P. Pasteris. 2008. Physiographically sensitive mapping of climatological temperature and precipitation across the conterminous United States. International Journal of Climatology: a Journal of the Royal Meteorological Society 28(15):2031–2064.
Daly, C., J. I. Smith, and K. V. Olson. 2015. Mapping atmospheric moisture climatologies across the conterminous United States. PloS One 10(10):e0141140.
EPA (U.S. Environmental Protection Agency). 1992. Superfund Record of Decision: Bunker Hill Mining & Metallurgical Complex. EPA ID: IDD048340921 OU 02 Smelterville, ID, September 1992. https://semspub.epa.gov/work/HQ/188517.pdf.
EPA Region 10. 2012. Interim Record of Decision (ROD) Amendment, Upper Basin of the Coeur d’Alene River, Bunker Hill Mining and Metallurgical Complex Superfund Site. https://semspub.epa.gov/work/10/664107.pdf.
EPA. 2015. Bunker Hill Mining and Metallurgical Complex, Idaho, Superfund Case Study (EPA 542-F-15-001; p. 11). https://www.epa.gov/sites/production/files/2018-03/documents/bunker_hill_eco_case_study_final_feb2015.pdf.
EPA. 2020. Optimization Review Report Remedial Process Optimization Study Lake Coeur d’Alene Bunker Hill Mining and Metallurgical Site Operable Unit 03 Coeur d’Alene, Kootenai County, Idaho.
EPA. 2021. Fifth Five-Year Review Report for the Bunker Hill Mining and Metallurgical Complex Superfund Facility (Bunker Hill Superfund Site) Shoshone, Kootenai, and Benewah Counties in Idaho Spokane County in Washington.
Essig, D. A. 2010. Arsenic, Mercury, and Selenium in Fish Tissue and Water from Idaho’s Major Rivers: A Statewide Assessment. Idaho DEQ, March 2010. https://www2.deq.idaho.gov/admin/LEIA/api/document/download/15208.
Hamlet, A. F., P. W. Mote, M. P. Clark, and D. P. Lettenmaier. 2005. Effects of temperature and precipitation variability on snowpack trends in the western United States. Journal of Climate 18(21):4545–4561.
Hardy, M. 2021. Census confirmation: Our county is booming. CDA/Post Falls Press. August 21, 2021. https://cdapress.com/news/2021/aug/22/unsurprising-growth.
Hogan, D. M., and M. R. Walbridge. 2007. Best management practices for nutrient and sediment retention in urban stormwater runoff. Journal of Environmental Quality 36(2):386–395.
Horowitz, A. J., K. A. Elrick, and R. B. Cook. 1992. Effect of mining-related activities on the sediment-trace element geochemistry of Lake Coeur d’Alene, Idaho, USA. Part 1, Surface sediments. U.S. Geological Survey Open-File Report 92-109.
Horowitz, A. J., K. A. Elrick, and R. B. Cook. 1993a. Effect of mining and related activities on the sediment trace element geochemistry of Lake Coeur d’Alene, Idaho, USA. Part I: surface sediments. Hydrol. Process. 7:403–423.
Horowitz, A. J., K. A. Elrick, J. A. Robbins, and R. B. Cook. 1993b. The effect of mining and related activities on the sediment-trace element geochemistry of Lake Coeur d’Alene, Idaho. Part II, Subsurface sediments. U.S. Geological Survey Open-File Report 93-656.
Horowitz, A. J., K. A. Elrick, J. A. Robbins, and R. B. Cook. 1995. A summary of the effects of mining and related activities on the sediment-trace element geochemistry of Lake Coeur d’Alene, Idaho, USA. J. Geochem. Explor. 52(1–2):135–144.
IDEQ and Coeur d’Alene Tribe. 2009. Coeur d’Alene Lake Management Plan. State of Idaho Department of Environmental Quality.
IDEQ and Coeur d’Alene Tribe. 2017. Coeur d’Alene Lake Management Plan: Coeur d’Alene Lake Status Update, 2015.
IDEQ and CDA Tribe. 2020. Coeur d’Alene Lake Management Program: Total Phosphorus Nutrient Inventory, 2004–2013.
IDEQ. 2020a. Coeur d’Alene Lake Management Plan: Coeur d’Alene Lake Status Update, 2015–2018. May 2020.
IDEQ. 2020b. Idaho’s 2018/2020 Integrated Report, Final. October 2020.
Kahle, S. C., and J. R. Bartolino. 2007. Hydrogeologic Framework and Ground-Water Budget of the Spokane Valley-Rathdrum Prairie Aquifer, Spokane County, Washington, and Bonner and Kootenai Counties, Idaho. U.S. Geological Survey Scientific Investigations Report 2007–5041.
Kahle, S. C., R. R. Caldwell, and J. R. Bartolino. 2005. Compilation of geologic, hydrologic, and ground-water flow modeling information for the Spokane Valley-Rathdrum Prairie Aquifer, Spokane County, Washington, and Bonner and Kootenai Counties, Idaho. U.S. Geological Survey Scientific Investigations Report 2005-5227.
Kmusser. 2008. Map of the Spokane River watershed—Western United States. https://commons.wikimedia.org/wiki/File:Spokanerivermap.png.
Kootenai County. 2020. Kootenai County Comprehensive Plan Update. February 2020. https://www.kcgov.us/DocumentCenter/View/13543/2020-Comp-Plan-Update.
Kuwabara, J. S., B. R. Topping, P. F. Woods, J. L. Carter, and S. W. Hager. 2006. Interactive effects of dissolved zinc and orthophosphate on phytoplankton from Coeur d’Alene Lake, Idaho. USGS Scientific Investigations Report 2006-5091. http://pubs.usgs.gov/sir/2006/5091.
Kuwabara, J. S., Topping, B. R., Woods, P. F., and J. L. Carter. 2007. Free zinc ion and dissolved orthophosphate effects on phytoplankton from Coeur d’Alene Lake, Idaho. Environ. Sci. Technol. 41(8):2811–2817. https://doi.org/10.1021/es062923l.
Langman, J. B., J. D. Ali, A. W. Child, F. M. Wilhelm, and J. G. Moberly. 2020. Sulfur species, bonding environment, and metal mobilization in mining-impacted lake sediments: column experiments replicating seasonal anoxia and deposition of algal detritus. Minerals 10(10):849.
Liao, F. H., F. M. Wilhelm, and M. Solomon. 2016. The effects of ambient water quality and Eurasian watermilfoil on lakefront property values in the Coeur d’Alene area of northern Idaho, USA. Sustainability 8(1):44. https://doi.org/10.3390/su8010044.
Long, K. R. 1998a. Grade and tonnage models for Coeur d’Alene type polymetallic veins. U.S. Geological Survey Open-File Report 98-583. https://doi.org/10.3133/ofr98583.
Long, K. R. 1998b. Production and disposal of mill tailings in the Coeur d’Alene mining region, Shoshone County, Idaho; Preliminary Estimates. U.S. Geological Survey Open-File Report 98-595. https://doi.org/10.3133/ofr98595.
Luoma, S. N., and P. S. Rainbow. 2008. Metal Contamination in Aquatic Environments: Science and Lateral Management. Cambridge: Cambridge University Press.
MacInnis, J. D., Jr., B. B. Lackaff, R. M. Boese, G. Stevens, S. King, and R. C. Lindsay. 2009. The Spokane Valley-Rathdrum Prairie Aquifer Atlas 2009 Update. City of Spokane.
Maupin, M. A., and R. J. Weakland. 2009. Water Budgets for Coeur d’Alene Lake, Idaho, Water Years 2000–2005. USGS Scientific Investigations Report 2009-5184. U.S. Geological Survey and Idaho Department of Water Resources.
Mink, L. L., R. E. Williams, and A. T. Wallace. 1971. Effect of industrial and domestic effluents on the water quality of the Coeur d’Alene River basin. Idaho Bureau of Mines and Geology Pamphlet 149, 30 p.
Moreen, E. 2021. Bunker Hill Mining and Metallurgical Complex Superfund Site Overview. Presentation to NASEM Committee. February 24, 2021.
Mote, P. W., S. Li, S., D. P. Lettenmaier, M. Xiao and R. Engel. 2018. Dramatic declines in snowpack in the western U.S. npj Clim Atmos Sci 1:2. https://doi.org/10.1038/s41612-018-0012-1.
National Research Council (NRC). 2005. Superfund and Mining Megasites: Lessons from the Coeur d’Alene River Basin. Washington, DC: National Academies Press. https://doi.org/10.17226/11359.
NCAI Partnership for Tribal Governance. 2016. Workforce Development: Building the Human Capacity to Rebuild Tribal Nations: Coeur d’Alene Tribe. National Congress of American Indians. https://www.ncai.org/PTG_Innovation_Spotlight_-_Coeur_dAlene_Workforce_Development_FINAL.pdf.
Nriagu, J. O., G. Lawson, H. K. T. Wong, and V. Cheam. 1995. Dissolved trace metals in Lakes Superior, Erie, and Ontario. Environ. Sci. Technol. 30(1):178–187.
Rabe, F. W., and D. C. Flaherty. 1974. The river of green and gold. Idaho Research Foundation. Inc., Natural Resources Series, (4). Moscow, ID, 98 pp.
Rogger, M., M. Agnoletti, A. Alaoui, J. C. Bathurst, G. Bodner, M. Borga, V. Chaplot, F. Gallart, G. Glatzel, J. Hall, J. Holden, L. Holko, R. Horn, A. Kiss, S. Kohnová, G. Leitinger, B. Lennartz, J. Parajka, R. Perdigão, S. Peth, L. Plavcová, J. N. Quinton, M. Robinson, J. L. Salinas, A. Santoro, J. Szolgay, S. Tron, J. J. H. van den Akker, A. Viglione, and G. Blöschl. 2017. Land use change impacts on floods at the catchment scale: Challenges and opportunities for future research. Water Resources Research 53(7):5209–5219.
Romero, I. C., N. J. Klein, S. A. Sanudo-Wilhelmy, and D. G. Capone. 2013. Potential trace metal co-limitation controls on N2 fixation and NO3− uptake in lakes with varying trophic status. Frontiers in Microbiology 4(54). https://doi.org/10.3389/fmicb.2013.00054.
Smedley, P. L., and D. G. Kinniburgh. 2002. A review of the source, behaviour and distribution of arsenic in natural waters. Applied Geochemistry 17(5):517–568.
TerraGraphics. 1990. Risk assessment data evaluation report (RADER) for the populated areas of the Bunker Hill Superfund site. Moscow, ID: Prepared for Region 10 EPA, Superfund Section, 1990.
Tessier, A., R. Carignan, B. DuBreuil, and F. Rapin. 1989. Partitioning of zinc between the water column and the oxic sediments in lakes. Geochimica et Cosmochimica ACTA 53:1511–1522.
Tong, S. T., and W. Chen. 2002. Modeling the relationship between land use and surface water quality. Journal of Environmental Management 66(4):377–393.
U.S. Geological Survey (USGS). 1981. River Basins of the United States: The Columbia. U.S. Geological Survey. https://doi.org/10.3133/70039373.
URS Greiner, Inc., and CH2M Hill. 2001. Final (Revision 2) Remedial Investigation Report, Remedial Investigation Report for the Coeur d’Alene Basin Remedial Investigation/Feasibility Study, Vol. 1. Part 1. Setting and Methodology. URSG DCN 4162500.6659.05a. Prepared for U.S. Environmental Protection Agency, Region 10, Seattle, WA, by URS Greiner, Inc., Seattle, WA, and CH2M Hill, Bellevue, WA. September 2001.
Wall Street Journal. April 2021. Why Is Coeur d’Alene America’s Hottest Housing Market?
Wise, D. 2021. Landscape Changes and Phosphorus Delivery to Coeur d’Alene Lake. Presentation to the NAQSEM Committee. May 4, 2021.
Woods, M. S., and M. A. Beckwith. 2008. Coeur d’Alene Lake, Idaho: Insights gained from limnological studies of 1991–92 and 2004–06. USGS Scientific Investigations Report 2008-5168. U.S. Geological Survey.
Woods, P. F., and M. A. Beckwith. 1997. Nutrient and trace-element enrichment of Coeur d’Alene Lake, Idaho. USGS Water Supply Paper 2485. https://doi.org/10.3133/wsp2485.
Xue, H. B., D. Kistler, and L. Sigg. 1995. Competition of copper and zinc for strong ligands in a eutrophic lake. Limnol. Oceanogr. 40(6):1142–1152.
Yue, S., and C. Wang. 2004. The Mann-Kendall test modified by effective sample size to detect trend in serially correlated hydrological series. Water Resources Management 18:201–218. https://doi.org/10.1023/B:WARM.0000043140.61082.60.
Zinsser, L. M. 2018. Coeur d’Alene Basin Environmental Monitoring Program, surface water, northern Idaho—Annual data summary, water year 2017. USGS Open-File Report 2018-1113. U.S. Geological Survey.


