
10
Future Water Quality Considerations
In Chapters 3 through 7, the committee evaluated past and current water quality in the Coeur d’Alene (CDA) basin and CDA Lake and its sediments, with a focus on observed trends in discharge, and nutrient and metal loading and concentrations. Some changes in climate are already apparent in the CDA region, and more are expected as the 21st century progresses, some of which may alter the trends observed by the committee. This final chapter reviews the recent climate history of the CDA region as well as climate projections that have been made through 2100. It then considers how future changes in climate, population, and land use could affect the trends noted in Chapters 3 through 7. Finally, the committee extends recent trends in metals concentration into the future to determine how much time will be needed before metals concentrations in CDA Lake fall below certain ecological thresholds.
CLIMATE CHANGE
Climate (temperature and precipitation) influences the water quality of CDA Lake through its effects on the magnitude, frequency, and timing of inflows to the Lake system. The climate interacts with the topography, geology, and land cover of the CDA watershed in complex and nonlinear ways to give rise to the hydrologic regimes that characterize the inflows to the Lake. In addition, a changing climate affects lake water temperature and consequently stratification, and it could change the frequency and intensity of forest fires in the region, with substantial impacts on lake water quality.
The first three sections below focus on (1) the magnitude of air temperature warming, (2) the amount and timing of precipitation delivered to the watershed, and (3) the extent to which climate warming will shift the delivery of precipitation from snow to rain. For these three climate factors, the historical patterns of the past several decades are examined below, followed by descriptions of projected changes in hydroclimate that will influence inflows to and conditions in the Lake into the future.
The committee originally sought climate projections for the interior Pacific Northwest from the University of Washington’s Climate Impacts Group (Mauger, 2021). That information was then supplemented with more recent projections compiled by the committee using data from the University of Idaho’s Northwest Knowledge Network data repository,1 specifically for a rectangular region from −117.5°W to −114.5°W longitude and 46.5°N to 48.5°N latitude—an area that encompasses the entirety of the CDA watershed. The projections of temperature and precipitation are from the Multivariate Adaptive Constructed Analogs (MACA) V2 downscaled climate change
___________________
dataset (Abatzoglou and Brown, 2012). The MACA V2 dataset is an ensemble of statistically downscaled outputs from 20 global climate and Earth system models that has been bias-corrected to historical observations of climate to a spatial resolution of approximately 4 km. The downscaled climate data are available for two of the Intergovernmental Panel on Climate Change (IPCC) Representative Concentration Pathway (RCP) scenarios, RCP4.5 and RCP8.5, and both scenarios are shown below. The RCP4.5 and RCP8.5 scenarios correspond to an additional 4.5 and 8.5 W/m2, respectively, of anthropogenic radiative forcing by the end of the 21st century (Taylor et al., 2012).
The climatology of precipitation and temperature over the region of interest was examined at two future time horizons, 2040–2060 and 2080–2099, and compared with historical precipitation and temperature patterns from the period 1985–2005. Specifically, the seasonal cycle of monthly average daytime maximum and minimum temperatures and monthly average precipitation volume, both averaged over the entire spatial region, were computed. Variability across all 20 climate model predictions was examined by computing the standard deviation of monthly average daily maximum temperature, daily average precipitation, and precipitation volume across the climate models.
Air Temperature
Unlike many other regions of the western United States, the CDA basin has experienced relatively mild warming in the recent past. As shown in Figure 1-10, air temperature in the CDA basin has been increasing over the past 40 years by about 0.4°F (0.22°C) per decade (UC Merced Climate Toolbox2). Zhang et al. (2018) similarly noted a slow warming trend in the region; from 1913 to 2015, the annual winter and spring (November–May) air temperature for the upper Spokane basin (of which CDA Lake is a part) averaged 3.5 ± 1.1°C and showed a marginally significant but weak (r2 = 0.04) warming trend of 0.07 ± 0.03°C per decade.
Projections
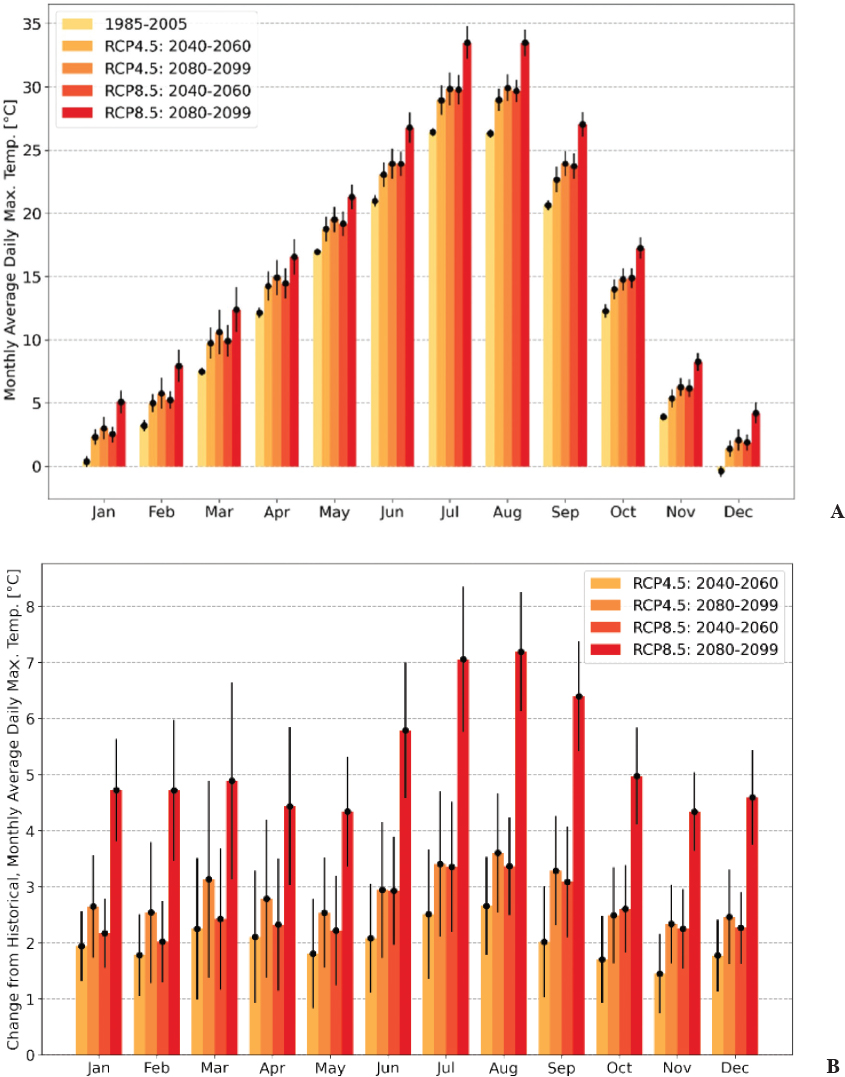
The degree of projected warming in the CDA region varies significantly based on the associated emissions scenario examined. As shown in Figure 10-1A, during the 1985–2005 historical period, average daily maximum temperature is lowest in December, at just less than 0°C, and is greatest in July and August, at approximately 26°C. The RCP4.5 scenario suggests that during the 2040–2060 period, monthly average daily maximum temperature in December will be approximately 1.5°C, while the RCP8.5 scenario suggests that December average daily maximum temperatures in the region will be closer to 2°C. The dataset suggests that averaged over the region, summertime monthly average daily maximum temperatures in July and August will be close to 28°C in the RCP4.5 scenario and nearly 30°C in the RCP8.5 scenario.
As expected, these increases in air temperature are more profound for 2080–2099. Model projections suggest that December monthly average daily maximum temperatures would be slightly more than 2°C in the RCP4.5 scenario and slightly less than 5°C in the RCP8.5 scenario. Meanwhile, in the peak summer months of July and August, monthly average daily maximum temperatures would be approximately 30°C under the RCP4.5 scenario, and closer to 34°C under the RCP8.5 scenario.
The projections were investigated to see whether warming is uniformly distributed throughout the course of the year or whether there are temporal patterns in projected warming. For example, warming that is preferentially distributed in the winter might lead to more rapid loss of snow water storage during the winter, while preferential warming in the summer period might be important for lake thermodynamic processes and heat exchange at the Lake–atmosphere interface. During the 2040–2060 period, warming in monthly average daily maximum temperature ranges from approximately 1.5 to 2.8°C in the RCP4.5 scenario, with May having the smallest warming in monthly average daily maximum temperatures and January having the largest warming. During this same period, the RCP8.5 model projections suggests that warming in monthly average daily maximum temperature will range from 2 to 3°C (Figure 10-1B).
Shown in Figures 10-1C and D, average daily minimum temperatures are also of interest to the future of water quality in the Lake, particularly because winter and spring nighttime low temperatures influence the degree
___________________
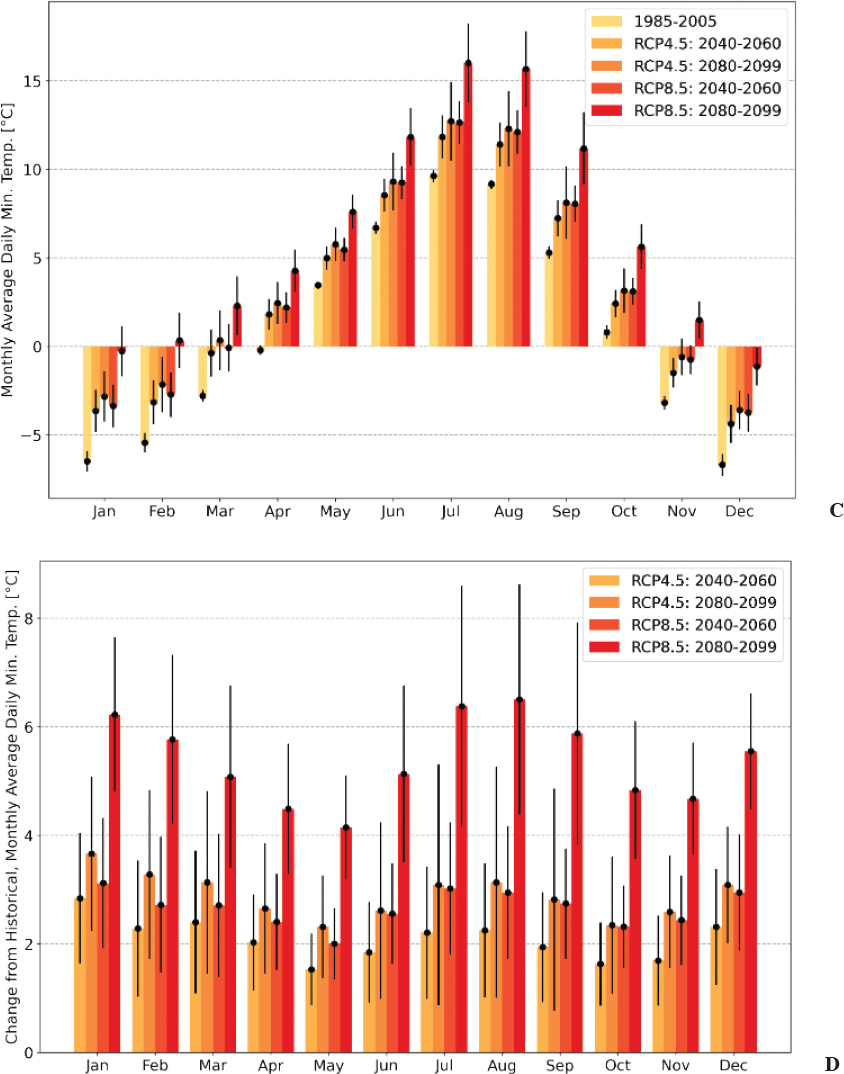
and extent of refreezing of snowpacks and can affect the occurrence of disturbances such as mountain pine beetle outbreaks (Preisler et al., 2012). Historical (1985–2005) monthly average daily minimum temperatures are lowest in December and January and, across the region, average approximately −7°C, while this value is highest in July, at slightly less than 10°C. For the 2040–2060 period, model projections suggest that the monthly average daily minimum temperature in December would be approximately −4°C in the RCP4.5 scenario and slightly warmer yet in the RCP8.5 scenario. July monthly average daily minimum temperatures, meanwhile, are projected to be approximately 12 and 13°C in the RCP4.5 and RCP8.5 scenarios, respectively. By the 2080–2099 horizon,
December monthly average daily minimum temperatures are projected to be approximately −3°C (RCP4.5) and −1°C (RCP8.5). The July monthly average daily minimum temperatures are projected to be approximately 12.5°C (RCP4.5) and 16°C (RCP8.5). These projected changes in average daily minimum and maximum temperatures in the region, particularly those associated with the RCP8.5 scenario, at century’s end would be consistent with a “low- to no-snow future” that is of broader concern and study across the western United States (Siirila-Woodburn et al., 2021).
Precipitation
Unlike air temperature, annual precipitation within the CDA Lake watershed, although highly variable, has shown no trends in the past 40 years (see Figure 1-7).
Projections
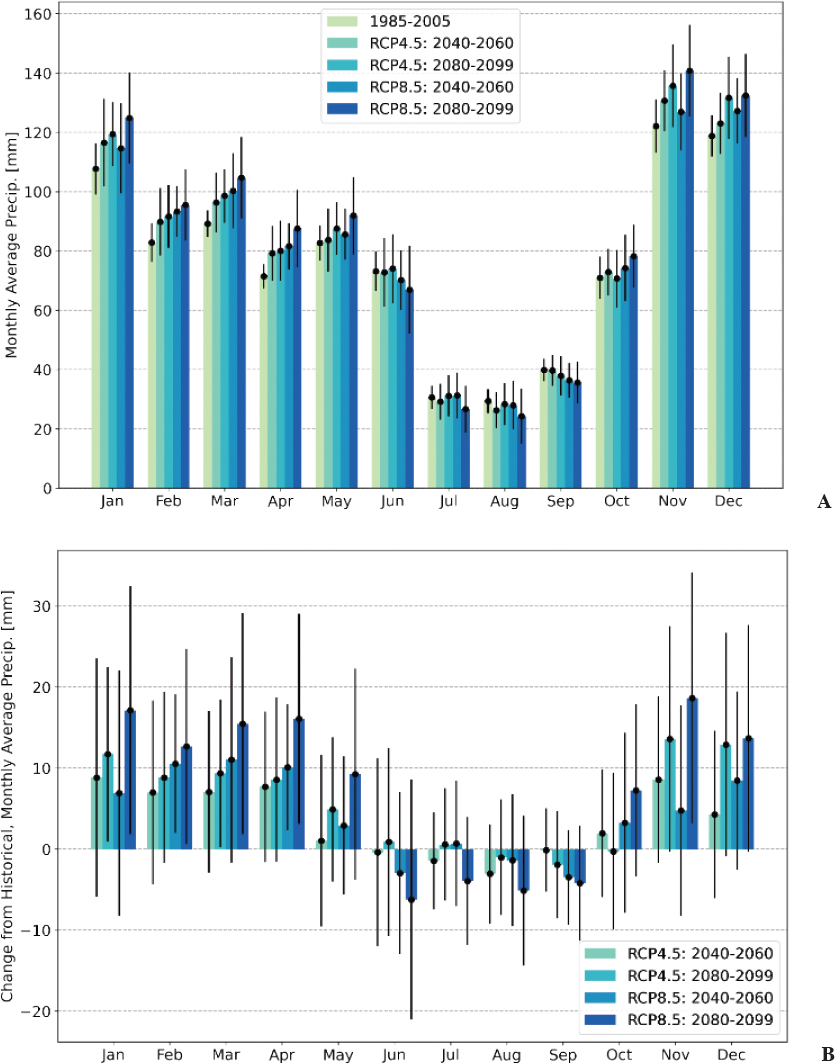
As shown in Figure 10-2, projected changes in precipitation in the region are relatively small compared with projected changes in temperature. There is, moreover, a greater degree of variability across climate model projections. In terms of mean annual precipitation, projections suggest a small increase in total precipitation throughout the year for both the RCP4.5 and RCP8.5 scenarios and for the 2040–2060 and 2080–2099 periods. The largest change in these projections is an increase of approximately 10 percent in mean annual precipitation by the end of the 21st century. Changes in precipitation are not uniformly distributed across the year, with increases in precipitation being largest in the winter and spring months (November–April) and smallest in the summer. It should be underscored that when variability across climate models is plotted on top of the average projected change in mean monthly precipitation, almost all scenarios and time periods span zero change. This indicates disagreement in both the magnitude and direction of precipitation change among the ensemble of models considered. This analysis, however, primarily reports on projected changes in seasonal precipitation climatology.
The class of climate models underlying the MACA V2 dataset is known to exhibit large uncertainties in simulated extreme precipitation (Kharin et al., 2013), which may be of most relevance to future hydrological conditions in the CDA region because such events will drive the mobilization of contaminants stored in riverbeds, riverbanks, and floodplains. Therefore, more focused attention to which regional climate change conditions could give rise to more extreme events using, for instance, climate storyline techniques (e.g., Shepherd et al., 2018) may provide information that is more actionable for managers and planners. Work by Warner et al. (2015) suggests that those events with a daily precipitation in the top 1 percent of historical daily precipitation volumes are likely to become 5–34 percent more intense by the 2080s in the Pacific Northwest region.
The temperature and precipitation projections discussed above for the CDA region are not as dramatic as for the rest of the Pacific Northwest (Mauger, 2021). Indeed, there is not yet evidence that the megadrought currently affecting the West (Williams et al., 2022a) is affecting Idaho, and it is not reflected in the precipitation record for the CDA watershed. There is, however, considerable uncertainty about whether the megadrought will expand northward into the north central region of Idaho.
Rain versus Snow
As discussed in Chapter 1, historically the bulk of the precipitation to the CDA region has arrived as snow, which has exerted a fundamental control on the hydrologic regimes of the tributaries to CDA Lake. As might be expected given the increase in air temperature, in the past 40 years, the CDA region has experienced a trend of less and less water being stored as snow (Figure 1-12).
Projections
An important aspect of changes in temperature regimes within the watershed is the degree to which increases in temperature drive shifts in precipitation phase from snow to rain. Of particular interest in the context of climate
change are future potential shifts in the elevation of the rain–snow transition. In a set of modeling experiments, downscaled outputs from the third Coupled Model Intercomparison Project (CMIP3) were used as input to the Variable Infiltration Capacity model, version 4.0.7. Using a temperature threshold approach to partition precipitation into rain versus snow, the model simulates the response of the processes of snow accumulation, retention, and release. Examining model projections for a moderate global greenhouse gas emissions scenario, the model suggests that, depending on the climate model used as input, peak snow water equivalent in the Pacific Northwest could decrease by 27–79 percent by the 2040s, with an average of a 51 percent reduction in snow water equivalent across all models. By the 2080s, the modeling experiments suggest that snow water equivalent could decrease by 44–96 percent depending on the specific climate model inputs to the Variable Infiltration Capacity model, with an average of a 73 percent reduction in peak snow water equivalent. These potential reductions in the amount of water stored in the snowpack have potentially profound implications for runoff hydrographs, as discussed in the following section.
Streamflow
The climatic drivers of precipitation and temperature lead to the hydrologic response within the CDA Lake basin of streamflow. Historical streamflow data in the CDA region are available from many U.S. Geological Survey (USGS) stream gages, some dating back 100 years. These data were analyzed by the committee to understand both the trends in mean events and in extreme events. Figure 3-6 in Chapter 3 showed that streamflow entering CDA Lake over the past three and a half decades has been remarkably free of trends. This is true for average annual flow rates, for annual low flows, and for annual high flows. In addition, there does not appear to be a shift in the timing of runoff over the past 35 years. All these findings stand in sharp contrast with other parts of the western United States, which have generally seen substantial declines in streamflow and a shift of the center-of-mass of annual runoff to earlier in the year (see, e.g., Dudley et al., 2017; Huang et al., 2022).
Box 10-1 considers whether high-flow events in the CDA basin will get larger or smaller in the future. The upshot is that the future pattern of high flows from the CDA River (and hence the flux of lead and phosphorus, and to a lesser extent cadmium and zinc) entering the Lake is highly uncertain both in magnitude and direction.
Projections
The MACA V2 downscaled climate change dataset does not support predictions of hydrologic trends like streamflow. However, model-based studies performed for the larger Pacific Northwest region by the Climate Impacts Group using downscaled outputs of the CMIP3 suite of climate models have yielded streamflow hydrographs from the Variable Infiltration Capacity model. These simulations were presented to the committee in early 2021 (Mauger, 2021) and are summarized below. Box 10-2 describes how these projections could be updated to become more specific to the CDA region and to use a larger suite of hydrologic models.
The projected hydrographs (Mauger, 2021) suggested the following about the occurrence of extreme flows and the timing of flows in the Pacific Northwest. First, the model projections for low flows as measured by the minimum average annual streamflow that can be expected to occur for a seven-day period once every ten years (7Q10) are that 7Q10 would decrease by about 1 percent by the 2040s and 2 percent by the 2080s. However, across all model simulations, future changes in 7Q10 varied from −5 percent to +2 percent by the 2040s and −6 percent to +2 percent by the 2080s, indicating uncertainty in the simulations in terms of the potential direction of change. Peak flows, as measured by the 100-year return interval event (Q100), were projected to increase by approximately 39 percent in the 2040s and 61 percent in the 2080s. But again, the modeling scenarios exhibit large ranges of variability in the change of Q100, with all of the model simulations suggesting a range of change to Q100 of −6 percent to +98 percent by the 2040s and +33 percent to 146 percent in the 2080s. While these projections are consistent with the unremarkable historical record for all CDA Lake
inflows shown in Figure 3-6, the important message is that large increases in flood flows during this century are possible but that there is a high degree of uncertainty. If these changes do take place, they would have negative implications for water quality in the Lake (related to lead and phosphorus inputs). This heightens the importance of taking remedial measures in the lower basin that will limit the mobilization of sediments high in lead and/or phosphorus that have been deposited on the floodplain and channel of the lower CDA River.
A far more consistent result was seen for trends in the center of timing in the streamflow hydrographs, as projected by the Climate Impacts Group (Mauger, 2021). The center of timing coincides with the day of the water year associated with 50 percent of the annual volume of streamflow being exceeded. In the Pacific Northwest, the historic center of timing of the annual hydrograph occurred on approximately April 15 in the 1980s. By the 2040s, the Climate Impact Group projects that the center of timing would occur earlier, with dates ranging from March 4 to March 31, with an average date of occurrence of March 18. By the 2080s, the center of the hydrograph would occur between February 10 and March 13, with an average across all of the climate models considered of March 3. This earlier occurrence of the center of the runoff hydrograph is consistent with both a number of other modeling studies in the region and more broadly the western United States,
and it is consistent with warmer winters leading to increases in the fraction of precipitation occurring as rain rather than snow. It is also consistent with the model-based suggestions of large reduction in the peak snow water equivalent in the Pacific Northwest region during the same periods of time. The historical record of the half-volume date shown in Figure 3-6D does not show any particularly large shift in hydrograph timing. This suggests that streamflow timing shifts documented in other parts of the western United States may not apply as readily to the CDA watershed.
Aquatic Thermal Regimes
One of the major impacts of climate change on CDA Lake could be increases in lake temperature that would have a variety of biological, chemical, physical, and social effects both in the Lake and in the basin. Increased lake temperatures suggest that the duration of lake stratification will lengthen, which could promote longer periods of net oxygen consumption in bottom waters affecting both oxygen levels and pH at the Lake bottom and in underlying sediments (see Chapter 5).
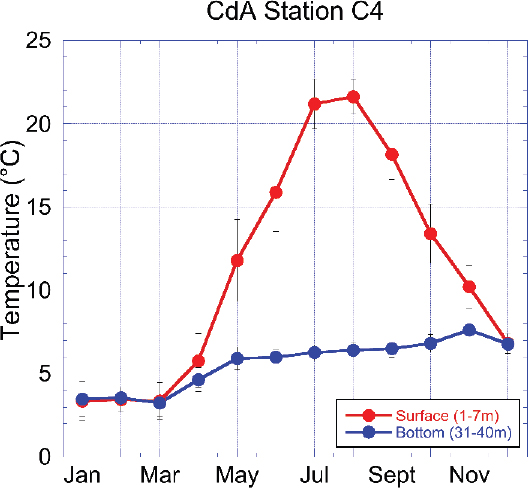
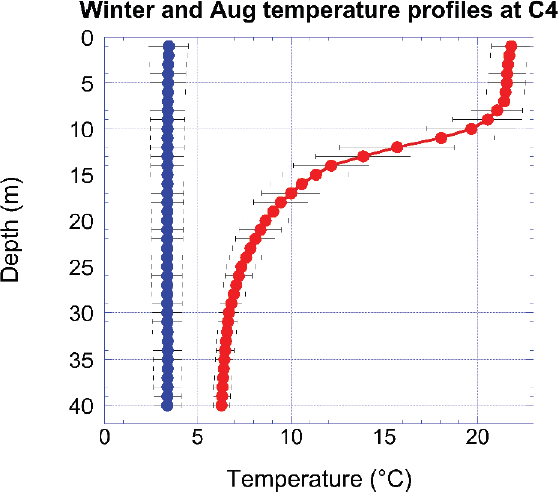
The committee investigated trends in lake water temperature specifically for the upper layer of the Lake (epilimnion) during the times of years (summer) when temperatures are highest and the impacts of increasing temperature would likely be most acute. Using the same dataset and methodology as for the dissolved oxygen trend analysis in Chapter 5, the committee analyzed the profile data collected at station C4 to characterize the mean monthly temperatures. The monthly average surface water (1–7 m) and bottom water (31–40 m) temperatures show that CDA Lake at this station is usually isothermal from December to March (Figure 10-3). After March, the surface temperatures rapidly warm from an average of 3.4 ± 1.1 °C to an average of 21.6 ± 1.0 °C in August, with rapid surface cooling in the fall. The bottom temperatures gradually increase from an average of 3.3 ± 0.8 °C in March to an average of 7.6 ± 0.8 °C in November, then cool again when the Lake becomes isothermal in December (Figure 10-3). The winter temperatures averaged 3.4 ± 0.8 °C throughout the water column (see Figure 10-4). During August, the epilimnion was nearly uniform in the upper 7 m, with the metalimnion extending from about 10 to 18 m depth, and then fairly uniform temperatures ranging from 8.6 to 6.3°C below 20 m depth. The complete dataset is shown in Table 10-1.
Trends in water temperature near the surface (1–7 m in depth) were evaluated from the set of monthly mean temperatures in Table 10-1. The Seasonal Kendall test was used to evaluate the trends in individual months and the overall trends. Because the months of January and February had so few values, the analysis was confined to March–December. Figure 10-5 shows the magnitude of the trend slope over the 30-year period 1991–2020. Note that for all ten months (except May), the estimated slopes were positive (i.e., warming). The significance of the individual monthly trends is indicated with an asterisk. The only trend that was significant was August (p = 0.003); none of the other months had p < 0.1. The overall Seasonal Kendall test for the ten months considered had an upward trend across all months of 0.035°C/yr (or an increase of 1.1 degrees over the full record). The significance level for the test was p = 0.006. Thus, it is clear that surface water temperatures have been increasing at station C4. It is reasonable to assume that this is related to the general trend toward rising air temperatures, and this can be expected to increase in the future based on the expected increase in global greenhouse gas forcing of the climate.
An identical analysis was conducted on the 1991–2020 monthly averages for temperature at 31–40 m at C4. The result was a very slight decrease in temperature over time, which was not significantly different from zero. The individual months had a mixture of downward and upward trends, but none of the individual months had trends that were significantly different from zero. From this, one can conclude that at least up to the present time, the water temperatures in the hypolimnion of C5 have not changed in any systematic pattern. These temperatures at depth are important controls on processes of benthic exchange (of metals or nutrients) between the lake bed and the water column. It may be the case that these temperatures will rise in the future, but this change has not happened yet.
There are multiple potential impacts of overall trends of lake warming. First, increased temperature leads to increased rates of biological metabolism, both primary production and respiration, making it difficult to predict impacts on overall ecosystem metabolism (e.g., heterotrophy versus autotrophy). Warmer temperatures in surface waters will likely increase the strength and duration of thermal stratification, further raising risks of hypolimnetic oxygen depletion. These changes in temperature will also alter the behavior of river plumes as they enter the Lake.
TABLE 10-1 Mean Monthly Surface Water Temperatures (1–7 m) for C4 for the Months and Years When Temperature Profiles Were Collected
| C4 | Jan | Feb | Mar | Apr | May | Jun | Jul | Aug | Sept | Oct | Nov | Dec |
|---|---|---|---|---|---|---|---|---|---|---|---|---|
| 1991 | 2.1 | 2.4 | 4.6 | 9.2 | 14.2 | 19.7 | 21.9 | 18.9 | 16.0 | 9.3 | 6.2 | |
| 1992 | 4.5 | 5.6 | 8.6 | 13.7 | 20.5 | 21.3 | 20.3 | 16.1 | 14.2 | 10.6 | 6.4 | |
| 1993 | ||||||||||||
| 1994 | ||||||||||||
| 1995 | 19.0 | 19.2 | 11.1 | |||||||||
| 1996 | 14.1 | 22.2 | 20.9 | 17.2 | 12.0 | |||||||
| 1997 | 18.9 | 20.9 | 17.9 | 12.6 | ||||||||
| 1998 | 21.8 | 23.7 | 21.0 | 16.4 | ||||||||
| 1999 | 20.2 | 21.0 | 17.7 | 12.4 | ||||||||
| 2000 | 21.7 | 21.2 | 15.1 | 12.2 | ||||||||
| 2001 | 21.0 | 21.4 | 17.9 | 11.4 | ||||||||
| 2002 | 20.3 | 17.3 | 10.4 | |||||||||
| 2003 | 14.1 | 6.7 | ||||||||||
| 2004 | 3.2 | 9.4 | 12.6 | 16.0 | 22.4 | 22.4 | 13.9 | 7.7 | ||||
| 2005 | 3.6 | 4.5 | 13.3 | 14.8 | 21.4 | 19.9 | 15.2 | 5.8 | ||||
| 2006 | 3.4 | 2.5 | 8.4 | 16.0 | 22.0 | 21.7 | ||||||
| 2007 | 15.2 | 23.6 | 20.5 | 18.4 | 12.8 | 6.9 | ||||||
| 2008 | 2.7 | 4.7 | 9.9 | 13.1 | 20.1 | 21.5 | 11.8 | |||||
| 2009 | 4.8 | 14.0 | 17.2 | 22.1 | 13.4 | |||||||
| 2010 | 4.5 | 5.3 | 7.6 | 13.1 | 20.4 | 21.8 | 16.5 | 7.1 | ||||
| 2011 | 2.7 | 3.4 | 7.1 | 14.6 | 17.5 | 21.4 | 17.5 | 7.7 | ||||
| 2012 | 3.1 | 4.1 | 8.5 | 12.9 | 19.3 | 22.5 | 18.0 | 14.0 | 10.9 | |||
| 2013 | 5.7 | 14.2 | 16.9 | 22.8 | 22.9 | 15.8 | 7.4 | |||||
| 2014 | 2.3 | 6.6 | 13.7 | 16.6 | 22.4 | 21.7 | 17.8 | 7.2 | ||||
| 2015 | 4.7 | 5.2 | 13.5 | 20.8 | 23.3 | 21.7 | 17.0 | 14.0 | 11.5 | |||
| 2016 | 6.5 | 13.0 | 16.2 | 20.5 | 22.1 | 18.1 | 13.5 | 11.0 | ||||
| 2017 | 2.7 | 6.2 | 13.3 | 16.2 | 22.4 | 22.6 | 20.8 | 12.2 | 7.3 | |||
| 2018 | 3.5 | 3.3 | 5.6 | 13.7 | 15.0 | 22.1 | 22.8 | 19.0 | 12.6 | 10.4 | ||
| 2019 | 2.9 | 7.4 | 12.2 | 19.6 | 21.2 | 22.3 | 19.7 | 12.4 | 6.5 | |||
| 2020 | 3.5 | 5.1 | 11.8 | 13.1 | 19.0 | 21.7 | ||||||
| Monthly mean | 3.4 | 3.5 | 3.4 | 5.8 | 11.8 | 15.9 | 21.2 | 21.6 | 18.2 | 13.4 | 10.2 | 6.8 |
| monthly SD | 1.2 | 0.7 | 1.1 | 1.6 | 2.5 | 2.4 | 1.5 | 1.0 | 1.5 | 1.8 | 1.3 | 0.6 |
NOTE: Red shading denotes higher temperatures, while blue shading denotes lower temperatures.
SOURCE: Data courtesy of IDEQ.
Finally, warmer temperatures potentially favor growth of undesirable cyanobacteria, as these taxa have higher thermal optima than more desirable taxa, such as diatoms. In terms of the physical impacts of lake warming, lake surface energetics are relatively well understood, and quantitative estimates of lake warming and stratification could be made for a range of future climates. Used in conjunction with the three-dimensional model of CDA Lake (Chapter 4) one could differentiate the impacts of lake warming on the pelagic and littoral parts of the lake as well as answer more difficult questions about future ecological and biogeochemical conditions.

Potential for Increased Forest Fires and Impacts on Lake Water Quality
As with many of the effects of climate change already discussed in this chapter, there is the potential for forest fires to become more frequent and problematic in the near future, mainly due to drier conditions in the West. Abatzoglou and Williams (2016) argue that the biggest fires occur in the driest conditions, and climate change is causing drier conditions. They showed that human-caused climate change contributed to an additional 4.2 million ha of forest fire area across the western United States during 1984–2015, nearly doubling the forest fire area expected in its absence. The committee asked Erin Brooks from the University of Idaho to opine on the potential for an increase in forest fires in the CDA region that might affect water quality in CDA Lake, summarized below (Brooks, 2021).
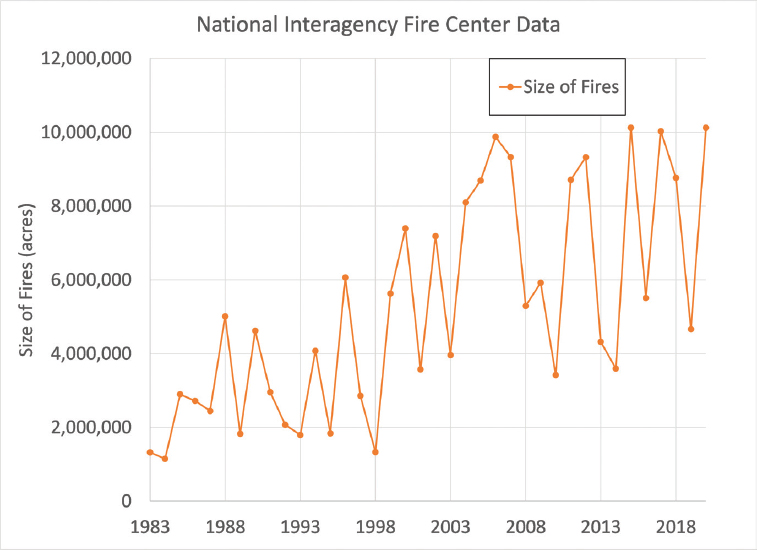
Across the United States, successful efforts to put out fires quickly after the 1930s led to a decline in the size of fires until the early 1980s, after which the average numbers of acres burned has steadily increased (shown in Figure 10-6).
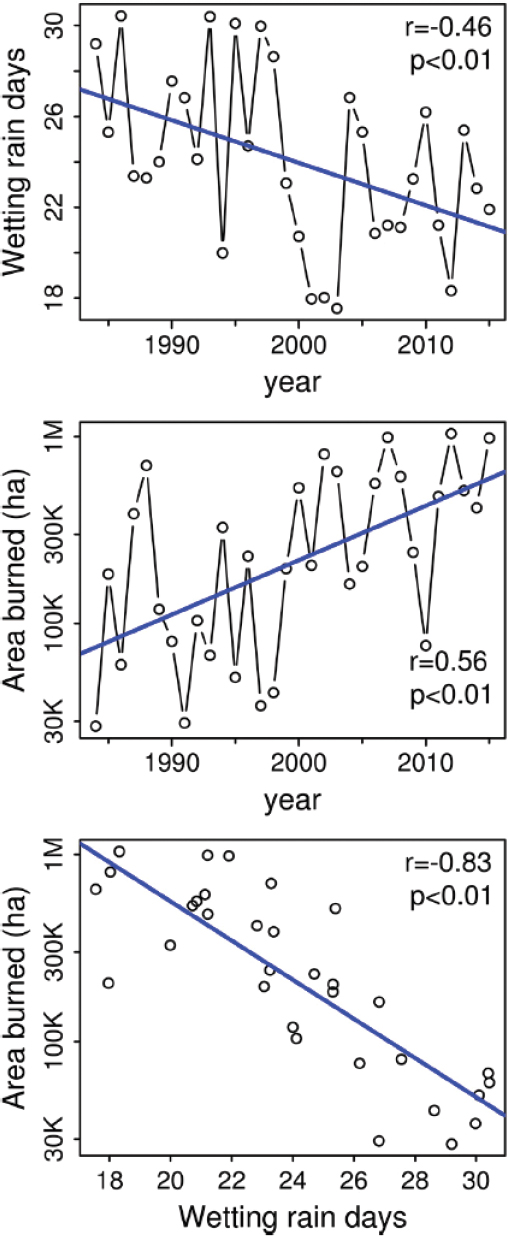
Holden et al. (2018) found that declines in summer precipitation and wetting rain days (days with precipitation ≥ 2.54 mm) are likely the primary driver of increases in wildfire area burned since 1984. Figure 10-7 shows that wetting rain days have declined, and hectares burned have increased, from 1984 to 2015, such that there is a significant correlation between these two factors over the period of investigation (r = −0.83). Their findings are consistent with future climate projections, which predict further decreases in summer precipitation (e.g., Figure 10-2) and longer dry periods between rain events across much of the West.
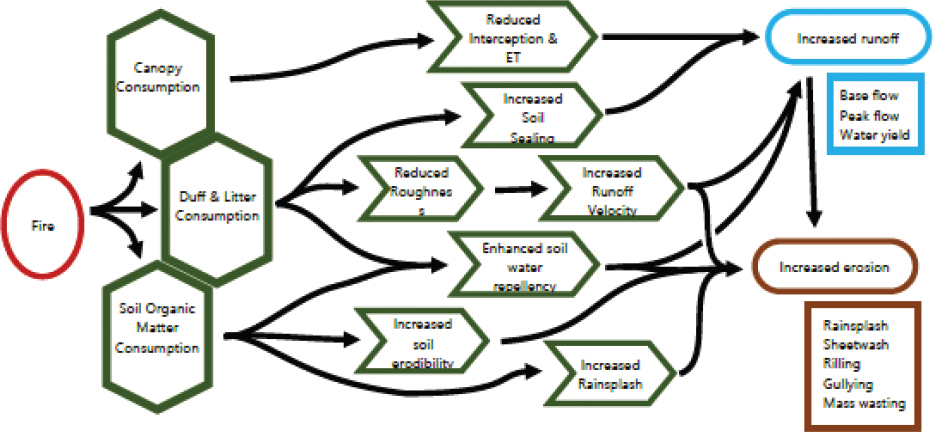
The consequences of wildfires relevant for nearby water quality are many and inherently complex, as shown schematically in Figure 10-8. First, because fires consume the canopy, duff and litter layer, and soil organic matter, the infiltration rate of burned soils decreases dramatically after a fire. This decrease in infiltration means that a greater percentage of rainfall hitting the land runs off, which increases flooding, debris flows, and sediment transport (including transport of sediment-bound lead and phosphorus). This is enhanced by the fire-induced absence
of surface roughness that might have served to slow flood flows. Furthermore, the absence of the canopy and litter layer means more soil is available to be eroded during precipitation events. Depending on the composition of the soil, there can be enhanced transport of contaminants to nearby waterways—a particular concern if there are high levels of phosphorus or lead adsorbed to soil particles. Given the known high metals content of soils and sediment in the CDA region, particularly in the lower basin (see Chapter 3), any increases in erodibility of the soil caused by fire could have substantial negative impacts on the loading of metals to CDA Lake.
There are other effects of fires on soil chemistry that could be a concern for water quality in nearby waterbodies. These include a potential increase in loading of dissolved phosphorus because of the burning of organic matter, increases in loading of total zinc, and increases in pH (Rust et al., 2018, 2019). According to Brooks (2021), soils in the CDA basin are andisols that present a risk of phosphorus transfer into runoff after fires. Andisols are moderately acidic soils having a high percentage of volcanic glass and allophanic properties and are characterized by high Al/Fe and high phosphorus retention. If soil pH increases following fires into a pH range of 6–7, this can lead to greater plant available phosphorus and risk of dissolved phosphorus in runoff. Brooks (2021) has found that total phosphorus in the CDA watershed is high in forested areas (although bioavailable phosphorus is higher in agricultural areas) and that there are soil phosphorus hot spots within the CDA basin (including enriched deposition environments/toe-slopes). Brooks (2021) showed results from Lake Tahoe following a forest fire, where he demonstrated a close correlation between soils with higher phosphorus and higher phosphorous export, though export was also related to precipitation, so there are other complicating factors. Finally, there is also the potential for increases in nitrogen in runoff following severe burns for many years (Rhoades et al., 2019).
There are fewer potential impacts of forest fire on drinking water in the CDA region, given that CDA River and Lake are not primary sources of drinking water for the region’s population. The impacts of forest fire on aquatic habitats are unknown.
Brooks (2021) suggested that some of the water quality impacts of forest fires could be mitigated by practicing prescribed low-intensity burns to reduce fuel loads and reduce the risk of water-extractable phosphorus transport,
if this can be done without increasing sediment transport. Because total phosphorus volatilizes at a higher temperature than carbon, such low-intensity burning should reduce organic matter while allowing phosphorus to stay in the soil. Other mitigation options in areas most likely to burn include making plans to respond to a fire quickly and protecting the ground surface with wood mulch.
The CDA region is just west of an area of Idaho and Montana that suffered more than 3 million acres burned by forest fire in 1910. Dubbed the Great 1910 Fire, the conflagration decimated the town of Wallace and other areas. Since that event, however, there have been fewer major fires in northern Idaho, especially when compared to other places in the arid parts of the Pacific Northwest. Figure 10-9 shows a map of the Pacific Northwest and fires by decade for the past 100 years, illustrating this dearth of fire activity in the CDA watershed.
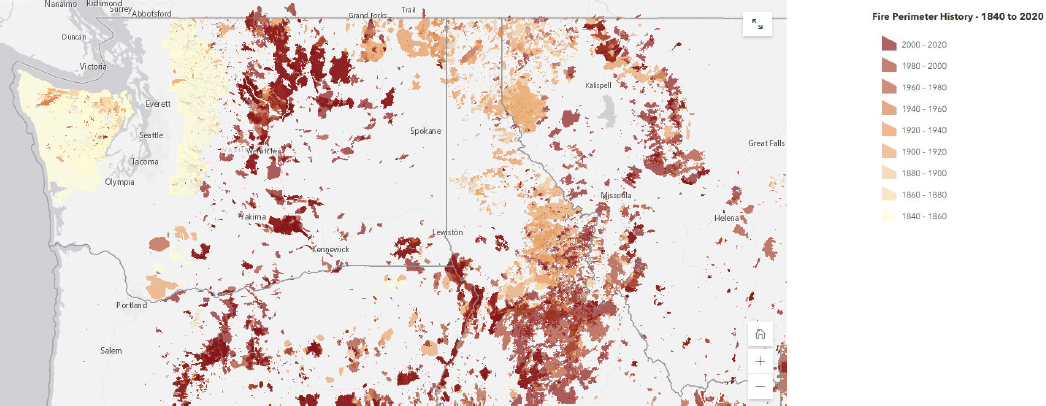
Despite the lack of recent fires, Brooks (2021) argued that future wildfires should be seen as a serious risk that may increase phosphorus loading to CDA Lake, given how wildfires affect soil erosion and runoff during subsequent high-flow events. This is particularly true for fires that cover a large fraction of the lower basin’s floodplain, which has unmitigated, contaminated soils. While the region has been lucky to date, climate trends for increasing air temperature in the greater Pacific Northwest region suggest that large wildfires will become more frequent.
Land Cover and Population Changes
Land cover within the CDA basin is dominated by forested land and shrubland with a small mix of agriculture, barren land, small waterbodies, wetlands, and urban development. As mentioned in Chapter 3, compared to years prior to 1992, there has been a substantial reduction in the extent of barren land in the upper basin in the past 30 years, due to remedial activities and the associated stabilization of soils. Analysis of land use trends since 2001 show relatively few changes across the CDA basin, lakeshore catchments, and St. Joe River watersheds. The percentage of forested land has decreased by less than 5 percent and the percentage of shrubland has increased by less than 2 percent (see Table 1-1). Percentage changes in developed, herbaceous, planted/cultivated, water, wetlands, and barren land cover classes have changed less than 1 percent over the 18-year time period of the committee’s analysis (Table 1-1). A transition in land use to more developed land is evident within the lakeshore area, and this trend is consistent with the increased population growth in this area. For example, Kootenai County has experienced annual population growth rates between 2.4 and 2.8 percent since 2016. While the land use changes across basins are unlikely to impact nutrient and metal loads to CDA Lake, increased development within lakeshore areas could lead to local increases in solids and nutrient loads that are associated with the loss of impervious land cover and increased wastewater discharges. These potential impacts could be mitigated through low-impact development strategies and nutrient control using advanced wastewater treatment processes.
WILL CLIMATE CHANGE, POPULATION GROWTH, AND LAND USE REVERSE WATER QUALITY TRENDS IN CDA LAKE?
The committee’s statement of task asked whether changes in temperature and precipitation could affect the observed trends in nutrient loading and metals concentration in CDA Lake and the rivers. Hence, the committee considered how the changes in climate discussed above, along with changes in land use and population growth, might impact the trends summarized in the concluding sections of Chapters 3 to 7. The five major effects considered relevant to the future of water quality in CDA Lake, shown schematically in Figure 10-10 as gray boxes, are (1) increased frequency and magnitude of large runoff events, (2) a forward shift in the timing of flow to the Lake, (3) warming of Lake water, (4) increased frequency and size of fires, and (5) increased lakeshore populations. (Note that these effects are directly related to, but more specific than, the precipitation and warming trends discussed at the beginning of this chapter.) Each of these five effects has the potential to reverse the observed favorable trends in metals and nutrient loading to CDA Lake (Chapter 3); timing of river flow (Chapter 4); and dissolved oxygen, nutrient, and metals concentrations in CDA Lake (Chapters 5 and 6). Thus, they may increase the risk of metals release from sediments, as described in Chapter 7.
Five Climate Changes Examined
The first effect of climate change examined is an increased frequency of large runoff events (Gray Box 1 in Figure 10-10) that would mobilize channel bed and floodplain nutrient pools, especially phosphorus, that have become increasingly stabilized as a result of watershed remediation, leading to increased nutrient loading. This could subsequently lead to increased nutrient levels in the Lake, higher phytoplankton biomass and production, and stronger hypolimnetic oxygen depletion as nutrient-stimulated production reaches bottom waters for decomposition (Arrows 1–4, 15, 16 in Figure 10-10). The previous section on climate change highlights the uncertainty about the possibility of large runoff events increasing in magnitude and frequency in the CDA region. This uncertainty stems partly from the concomitant likely shift from snow to rain as the predominant type of precipitation
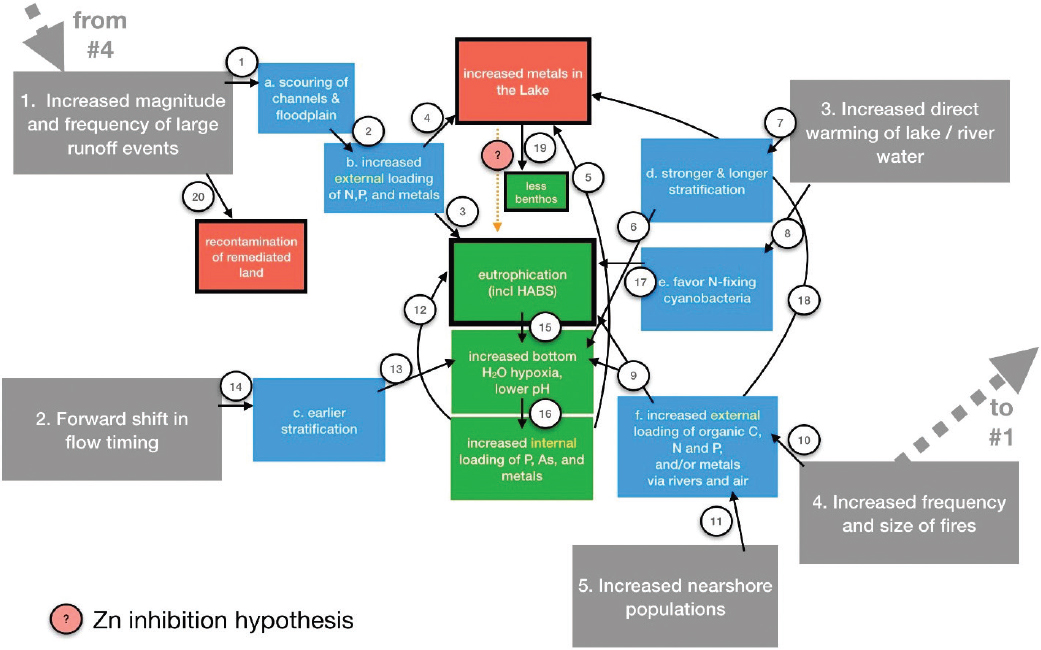
and the recently observed decline in large events over the past 20 years (see Box 10-1 for a fuller explanation). Nonetheless, to be conservative, the committee examines the slowing or reversal of several water quality trends that could occur if hydrologic events become larger or more frequent in the future.
A second effect of climate change is the forward shift in flow timing (Gray Box 2), in which a greater percentage of flow from the watershed to the Lake occurs in winter and early spring than is occurring now. Although this has yet to be documented in the CDA basin (see Figure 3-6D), the projections from the Climate Impacts Group described above point to this occurring soon in the Pacific Northwest. If the center of flow timing moves earlier in the year, the St. Joe River3 hydrograph may fall below the 1,000 cfs (28 m3/s) discharge threshold at which the Lake stratifies to earlier in the year (Arrows 14 and 13), lengthening the period of stratification. This would then lengthen the period during which oxygen and pH could be drawn down in Lake bottom waters, with anoxia promoting mobilization of phosphorus and redox-sensitive metals in the Lake sediments and low pH promoting zinc release (Arrows 15, 16). Up to the present time, St. Joe River discharge data do not indicate that the date at which discharge falls below 28 m3/s has shifted to earlier in the year than it was in the past.
The third climate effect considered is increased Lake temperatures (Gray Box 3). This trend, which has already been documented at C4 and is more pronounced during summer (Figure 10-5), will strengthen and lengthen
___________________
3 This threshold could only be derived for the St. Joe River due to lack of continuous time series data on the CDA River (see Chapter 4). However, the threshold effect applies to both rivers, and one would expect future climate change to impact flow in both rivers in similar ways.
thermal stratification, which may further contribute to hypolimnetic oxygen depletion and likely lowering of pH (Arrows 7 and 6). There is no evidence to date of accelerating hypolimnetic oxygen depletion as a result of higher surface water temperatures, but the window of available data is narrow. Higher surface water temperatures may also favor increased microbial metabolism and the development of nitrogen-fixing cyanobacteria, contributing an additional source of nitrogen to the system (Arrows 8 and 17) (Breitbarth et al., 2006; Robarts and Zohary, 1987; Brauer et al., 2013).
The fourth climate effect that could impact CDA Lake water quality is an increased frequency and size of forest fires (Gray Box 4). Fires will mobilize sediments, metals, and nutrients, both in runoff from burned watersheds and in atmospheric transport, that could increase their loading to CDA Lake (Arrow 10; Hauer and Spencer, 1998; Spencer et al., 2003). At least over the medium term, these effects could then stimulate eutrophication and oxygen depletion (Arrow 9; McCullough et al., 2019). However, increased prevalence of smoke from regional fires may lower incident light intensity, potentially ameliorating the effects of nutrients, at least temporarily. Fire also has the potential to affect the observed trend in land use from barren to revegetated land that has accompanied the Superfund remedy. It is noted that fires can also alter hydrologic regimes and increase the risk of extreme flood events (Williams et al., 2022b) (dashed Gray Arrow from Gray Box 4 to Gray Box 1).
Finally, although not directly a result of changes in temperature and precipitation, expanding human populations and the associated increase in urban land use could slow or reverse the observed trends in water quality, particularly nutrients (Gray Box 5). This might occur because of increased inputs of nitrogen and bioavailable phosphorus from septic system leakage, localized fertilizer use, and other activities (Arrows 9 and 11).
Effects of Climate Change on Water Quality Trends
Table 10-2 summarizes how trends noted in Chapters 3 through 7 might be altered under the five climate effects discussed above. The subsequent sections elaborate on the entries in Table 10-2. Note that only those conclusions from Chapters 3 to 7 that reveal a trend (or lack thereof) are considered in Table 10-2 and the text below.
Trends in Sediment, Metals, and Phosphorus Loading to CDA Lake
The downward trends in lead inputs to CDA Lake over the past decade (Figure 3-11) are related to the readjustment of the river channel and floodplain in the lower basin. The historic mining activities and the early phases of remediation resulted in a very large influx of sediment to the upper portion of the lower CDA River, far more than what the river was able to transport downstream. However, it appears that the river channel is readjusting to this change in sediment inputs causing decreases in the transport of sediment (and attached lead) over the past decade.
Climate change over the coming decades could modify the situation based on what may happen to the magnitude and frequency of high-discharge events and based on the potential for more fires. As discussed in Box 10-1, there is a great deal of uncertainty not only in the magnitude of future changes in high flows, but even in the direction of these changes. High discharges, above about 200 m3/s, are the primary drivers of sediment transport and hence lead transport. If the change in climate increases the frequency of these discharge conditions (currently about 36 days per year on average) and their magnitudes, they will be able to erode and transport more lead to the Lake (the transport increases with rate of discharge raised to the 4.3 power). Similarly, if winter storms that would have been snow events under past colder climate conditions become rain events in the future, there would also be an increase in the magnitude and frequency of high-discharge events. The result of both these discharge scenarios would be greater mobilization of sediment and sediment-associated contaminants like lead and phosphorus, potentially slowing or reversing the downward trends in the loading of these compounds (see rows 3.4, 3.5, and 3.7).
In contrast, if such events resulted in increased erosion and sediment transport across parts of the North and South Fork CDA watersheds not enriched in lead,4 this could have the effect of increasing the proportion of
___________________
4 The scale of contamination from the lead smelter across the landscape can be extensive (Moore and Luoma, 1990) but is unstudied in the CDA basin. Lead is vaporized and emitted as fine particulate from smelter stacks, extending the area that can be affected by fallout; but the availability for mobilization of such contamination can also decline over time as vegetation increases and matures.
TABLE 10-2 How Climate Change Will Impact Water Quality Trends Noted in Chapters 3 Through 7
| CLIMATE CHANGES AND OTHER IMPACTS OF CONCERN TO WATER QUALITY (GRAY BOXES) | |||||
|---|---|---|---|---|---|
| Conclusions from Chapters 3–7 |
|
|
|
|
|
| 3.1 Land cover has changed from barren to revegetated | No effect | No effect | No effect | Could burn revegetated areas | No effect |
| 3.4 Loading of Pb has decreased | Could slow or reverse trend by mobilizing sediment and associated Pb | No effect | No effect | Could increase delivery of Pb-enriched sediments | No effect |
| 3.5 Loading of sediment has decreased | Could slow or reverse trend by mobilizing sediment across the CDA basin | No effect | No effect | Could increase delivery of sediments | No effect |
| 3.6 Loading of Cd has decreased | Could slow or reverse trend by mobilizing sediment and associated metals but less effect than for Pb/P | No effect | No effect | Could increase delivery of Cd-enriched sediments | No effect |
| 3.6 Loading of Zn has decreased | Could slow or reverse trend by mobilizing sediment and associated metals but less effect than for Pb/P | No effect | No effect | Could increase delivery of Zn-enriched sediments | No effect |
| 3.7 Loading of P has decreased | Could slow or reverse trend by mobilizing sediment and associated P | No effect | No effect | Could increase delivery of sediments and P | Could increase bioavailable P loading near the Lake |
| 4.2 The date when St. Joe R discharge falls below 28 m3/s (1,000 cfs) comes earlier in the year | No effect | Threshold reached sooner | Enhanced | No effect | No effect |
| 5.1 No observed trend in dissolved oxygen (DO) | No effect | May create a trend towards lower DO due to longer stratification period | May create a trend toward lower DO | May create a trend toward lower DO | May create a trend toward lower DO |
| 5.2 [Total P] has declined over past 10 years | Trend could slow or reverse and [total P] could increase | Trend could slow or reverse and [total P] could increase | Trend could slow or reverse and [total P] could increase | Trend could slow or reverse and [total P] could increase | Trend could slow or reverse and [total P] could increase |
| 5.3 Trends in [total N] variable, depending on lake location | [Total N] could increase | [Total N] could increase | [Total N] could increase | [Total N] could increase | [Total N] could increase |
| 6.1 and 6.2 Downward trends in [dissolved Zn] | Trend could slow or reverse and [dissolved Zn] could increase but less effect than for Pb | Trend could slow or reverse and [dissolved Zn] could increase | Trend could slow or reverse and [dissolved Zn] could increase | Trend could slow or reverse and [dissolved Zn] could increase | No effect |
| 6.3 Downward trend in [dissolved Cd] at C1 and C4 | Trend could slow or reverse and [dissolved Cd] could increase but less effect than for Pb | Trend could slow or reverse and [dissolved Cd] could increase | Trend could slow or reverse and [dissolved Cd] could increase | Trend could slow or reverse and [dissolved Cd] could increase | No effect |
| 6.5 [Total Pb] in the Lake has declined over the past 8–10 years | Trend could slow or reverse and [total Pb] could increase | No effect | No effect | Trend could slow or reverse and [total Pb] could increase | No effect |
| 7.3 Risk that enhanced anoxia will release arsenic | No effect | Will increase/enhance risk of As release | Increase risk: Increased DO utilization leads to increased biomass/organic carbon, which favors enhanced anoxia; lower DO leads to greater anoxia; N and P increase at sediment–water interface |
Same as column 3 for a warmer lake | Same as column 3 for a warmer lake |
| 7.4 Risk that enhanced anoxia will release P, which through feedback loop could release more arsenic | No effect | Will increase/enhance P release | Increase risk: Increased DO utilization leads to increased biomass/organic carbon, which favors enhanced anoxia; lower DO leads to greater anoxia; N and P increase at sediment–water interface |
Same as column 3 for a warmer lake | Same as column 3 for a warmer lake |
| 7.5 Risk that decrease in pH will drive Zn release | No effect | Potential for increase in period over which pH can decline resulting in Zn release |
Unclear effect on risk: N-fixing cyanobacteria could lower pH at the sediment–water interface
|
Same as column 3 for a warmer lake | Same as column 3 for a warmer lake |
relatively “clean” sediment compared to the lead-enriched sediment moving through the lower basin and into the Lake. Currently, inputs to the Lake from the watershed are primarily from the lower basin, much of which is high in metals and is unremediated. NRC (2005) showed that the expected dilution of pollutant loads from the North Fork did not result in decreases in lead concentrations or fluxes downstream because of recontamination in the lower basin from bed and bank sediments. Similarly, there is evidence from the Clark Fork that downstream from areas where bed contamination was removed and banks were stabilized, sediments are quickly recontaminated from unstabilized banks (Hornberger et al., 2009). How much runoff comes from uncontaminated versus unremediated areas and how much the lower basin recontaminates the CDA River need to be better understood to make predictions with greater certainty.
A third possibility, discussed in Box 10-1 but not considered in Table 10-2, is that very high discharge events may become smaller and less frequent in the future because the potential for high runoff from rain-on-snow events would diminish. This would result in a decrease in flux of sediment and lead entering the Lake (the opposite of the impacts suggested in column 1 and rows 3.4 and 3.5 in Table 10-2).
Because phosphorus delivery to the Lake is also driven by high-flow events, many of the potential outcomes for phosphorus are similar to those mentioned for lead. The exception is that if high-flow conditions become more common, the sediment delivered to the lower CDA River could become more enriched in phosphorus, even if its lead load decreased, because sources of phosphorus are ubiquitous on the landscape while the source area for lead is restricted to soils contaminated by mineral extraction activities. In the case of cadmium and zinc (column 1, the two rows labeled 3.6, in Table 10-2), the influence of increased magnitude and frequency of high-discharge events would be more limited than for lead or phosphorus. Most of the cadmium and zinc transport from the lower CDA watershed is in the dissolved form and the variations in the concentrations due to changes in discharge are smaller than for lead.
As discussed above, fire is expected to mobilize sediments and sediment-associated contaminants such as metals and nutrients, both in runoff from burned watersheds and in atmospheric transport, that could increase their loading to CDA Lake. However, the effects will differ in magnitude among regions of the watershed. For example, fire in the lower basin of the CDA River or around operable unit (OU)-1 or OU-2 might affect metals loadings, but that would not be a concern for fire in the St. Joe basin.
Trends in Dissolved Oxygen, Phosphorus, and Nitrogen Concentration within the Lake
Chapter 5 describes the recent ongoing decline in Lake total phosphorus concentrations (Table 5-6) that have accompanied decreases in phosphorus loading to CDA Lake. Likewise, dissolved oxygen conditions in the Lake are also showing signs of improvement over time (Table 5-5), while trends for total nitrogen concentration are less obvious (Table 5-7).
As depicted in Figure 10-10, a number of projected changes in climate conditions and human activity potentially put the favorable trends for dissolved oxygen and phosphorus in jeopardy. For example, increased pressures from nearshore development (Gray Box 5) threaten to increase phosphorus loading to, and concentration in, the Lake, which may drive eutrophication and hypoxia (Arrows 11 to 9 in Figure 10-10). This may then lead to possible feedback loops that could promote nutrient release from the sediments. If climate change moves the timing of peak flow to earlier in the year (Gray Box 2), the Lake may stratify earlier (Arrow 14), allowing more time for oxygen depletion to occur in the hypolimnion (Arrow 13), promoting hypoxia and subsequent nutrient release from the sediments. The same results would be likely with warmer Lake temperatures (Gray Box 3). If the frequency, magnitude, and intensity of fires increase (Gray Box 4), the same processes could be put in motion (higher nutrient loading, hypoxia and lowering of pH in Lake bottom waters, eutrophication), eventually leading to further release of nutrients from the sediments.
Trends in Metals Concentrations within the Lake
As for dissolved oxygen and nutrients, the five types of climate change considered in Figure 10-10 could also slow or reverse the favorable trends in metals concentrations observed in the Lake. First, any climate effects that increase external loads of zinc, lead, arsenic, and cadmium to the Lake (such as more frequent high-flow runoff
events and fires) will slow the rate of decline in metals concentrations in the Lake. In the case of cadmium and zinc (column 1, rows 6.1, 6.2, and 6.3 of Table 10-2), the influence of these high-discharge events, if they occur, would be much more limited than for lead and phosphorus, because zinc and cadmium are more likely to travel in dissolved form. Finally, such extreme runoff events have the potential to increase the rate at which remediated lands, particularly in the floodplains of the lower basin, are recontaminated by metals, leading to greater exposure to lead (Arrow 20).
Increased frequency of fire could increase loading of lead, zinc, and arsenic from smelter-contaminated soils or once flooded soils (Arrow 10), but this effect would probably be small compared to increases in metals loading brought about by changes in hydrology subsequent to fire (Gray Arrow).
A forward shift in the timing of flow and a warmer lake, as well as population growth in lakeshore areas, can eventually lead to eutrophication and a lowering of dissolved oxygen and pH in the lake bottom waters, which could enhance internal loading of dissolved zinc and cadmium (but not lead, owing to its higher affinity for iron mineral phases and particulate organic matter). The effect could be to slow the observed decline in zinc and cadmium concentrations in the water column.
Most of the effects above will differ in magnitude by Lake location. For example, internal loading of zinc and cadmium is more important in the southern Lake than in the northern Lake, slowing the response times of the southern Lake to reduced inputs. Thus, climate changes that enhance internal loading (e.g., anoxia, reduced pH) in the southern Lake may further slow its response to other climate changes that alter external loading.
Trends in Lake Sediment Processes
Of the impacts of climate change identified in Table 10-2, increased runoff was considered too indirect to affect biogeochemical processes in the sediments because of the separation between inputs and sediment processes and because the composition of runoff water is likely to be unchanged from current conditions.
Climate changes that directly or indirectly lead to reduced dissolved oxygen concentrations in bottom waters could eventually increase porewater concentrations of arsenic and phosphorus. This includes both a forward shift in the timing of flow and warming of Lake temperatures. That is, longer periods of stratification, increased heterotrophic microbial activity, and increased nitrogen-fixing cyanobacteria within the Lake all favor increased anoxia. As organic matter, nitrogen, and phosphorus settle to the bottom of the Lake, the potential for anoxia increases at the sediment–water interface, and decreased mixing in the Lake can provide longer periods of anoxia. The presence of anoxic conditions can lead to reductive dissolution of iron hydroxides and reduction of highly sorptive As(V) to weakly sorptive As(III), both of which may lead to release of sorbed arsenic and phosphorus. Similarly, longer periods of stratification will lengthen the time that pH may be lowered, promoting release of zinc and cadmium from the sediments. As mentioned in Chapter 5, there is little evidence of anoxia, and no evidence of trends, in the main body of the Lake. However, reduced dissolved oxygen in C5 bottom waters and minor release of arsenic from C5 sediments has been observed, as well as reduced pH and concomitant elevated zinc in some bottom waters.
Increased organic matter and nutrient inputs from fires and/or increased nearshore populations will have similar effects to warming of lake water, because these changes can lead to eutrophication, anoxia, and subsequent arsenic and phosphorus release.
For zinc (and cadmium) in the sediments, the effect of the last three changes in Table 10-2 are uncertain because it is unclear if pH would go up or down during anoxia. That is, the presence of nitrogen-fixing cyanobacteria could lower pH at the sediment–water interface if ammonia is converted to nitrate or if the pH is greater than 6.3 and denitrification (nitrate to nitrogen) occurs. However, reductive dissolution of iron oxides under anoxic conditions could increase pH and offset nitrification/denitrification impacts.
FUTURE WATER QUALITY SCENARIOS
The final section of this chapter is meant to provide a sense of the time necessary to reach different stages of recovery in CDA Lake. This simplistic exercise assumes that trends in water quality observed over the past 10–30 years will continue into the future. It extrapolates how long it will take for metals concentrations to go below thresholds of ecological significance in CDA Lake.
Although mass loading is the metric necessary to identify major sources of metal, to quantify the magnitude of the contribution from each source relative to one another, and to characterize changes over time in each source as management practices are implemented (Luoma and Rainbow, 2008; see Chapter 3), it is not necessarily the best metric to consider the future of lake water quality experienced by organisms. Rather, mixing of high metal loads from the CDA River with lake water, lake sediments, and biologically generated particulate material will determine the concentration of metals in the water, suspended particulates, and sediments of CDA Lake. Exchange of metals between sediments and water are driven by concentrations, and organisms respond to metal concentrations in water and particulate material rather than loads (Luoma and Rainbow, 2008). Hence, the following section focuses on when the Lake will achieve certain concentrations of metals, if past trends are extrapolated forward.
The following analysis is constructed around a scenario that assumes that the declines in metals concentration observed in the recent past will continue and follow an exponential decay, with a rate calculated on smoothed results covering the years 2011–2020. An exponential decay provides a reasonable first approximation of what can be expected in the future and is likely to generate better estimates than a linear decay. Fitting the decline in concentrations in the Lake to an exponential decay curve assumes that the decline in the rate of input will be a consistent function of the amount of contaminated material remaining. The committee recognizes that extrapolating trends from the past decade is uncertain. However, the calculations provide a perspective on the rate of change possible in the Lake and a baseline to evaluate data against future monitoring observations.
One can express the exponential decay model as follows:
Ct+k = Ct · e−r·k
where:
Ct is the concentration in year t
Ct+k is the concentration in year t+k
r is the decay constant
For example, if the concentration of a metal in some starting year (say 2020) was 10 μg/L and the decay constant was 0.05, then the exponential decay model would predict a concentration of 9.51 μg/L for the year 2021, a value of 6.06 μg/L for the year 2030, and a value of 0.82 μg/L for the year 2070. In an exponential decay model, the concentration would asymptotically approach a value of zero, and the changes over time can be expressed as some constant percentage change between years. For example, if r = 0.05, the percent change from any one year to the next would be a decline of 4.88 percent per year [computed as P = 100 · (e−r − 1)].
The logic of assuming an exponential decay over time, versus a linear decline, is that a linear decline would project values of concentration at some time in the future going negative, which is impossible. The exponential decay model is a common approach to describing the rates of chemical reactions (known as “first-order reactions”) in which the rate of the process is proportional to the remaining amount of the chemical being evaluated. It provides a first approximation for processes that involve the mobilization of some contaminant in the environment, which, in the case of the CDA watershed and Lake system, could be either driven by chemical reactions or by transport of contaminated sediment particles.
Rates of change estimated over a decadal period were used to limit the extent of individual year-to-year changes influencing the estimate of the decay constant. Changes between any two specific years are likely to be highly influenced by the random variations driven by the specific hydrologic conditions of those specific years. Thus, the committee used linear regression of the logarithm of annual concentration values as a function of year as the means of obtaining a decay constant. Graphical evaluation of the metals data showed that they commonly conformed well to this exponential decay model over the past decade, although looking back over two to three decades does show some changes in the decay constant at earlier times in the history of the remediation process.
As present-day regional background concentrations, the committee used the concentration data for the St. Joe River at Ramsdell and the North Fork of the CDA River at Enaville. Neither of these locations had Superfund activity upstream of them and both have a small amount of historical mining and likely atmospheric inputs of metals from smelting activities, but nothing that compares to the South Fork of the CDA River.
Year When Metals Concentrations in CDA Lake Will Reach Thresholds of Ecological Significance
To determine how long will it take for values of metals concentration to fall below a specified target, assuming that current trends continue, the committee conducted four analyses for each lake site. These four analyses considered surface water data (< 20 meters); deep water data (> 20 meters); and data from two seasons: “Spring,” which consists of data from March, April, and May, and “Summer,” which consists of data from July, August, and September. These analyses only used data from the calendar years 2011–2020, such that everything here is based on the trend from the last ten years of the record.
The statistical method used is called “censored regression” or “survival analysis,” which is appropriate when some of the data are reported as a “less than” value. This method is a more appropriate method than using values such as half the reporting limit for the censored data point. The code that was used is the cencorreg function in the R package NADA2 (see Helsel, 2011, for details). When none of the observations are censored, this method gives results that are identical to the results one would get from linear regression.
The method fits a linear regression to the logarithms of the concentration as a function of year. That fitted line is equivalent to an exponential decay over time, when expressed in terms of the actual concentration values, and it is used to make an estimate of the year in which the median concentration would fall below a specified target. In some cases, the regression line is below the target line and the result is reported as “below.” If the estimated line is above the target, then the year in which the median estimate will go below the target is reported.
The analyses were run for sites C1, C4, and C5 for dissolved lead, zinc, and cadmium. At C6, it was possible to do the analysis for dissolved lead only because the zinc and cadmium data had so many non-detects that the analysis was essentially meaningless.
Table 10-3 shows the analysis for dissolved lead using the Lake Management Plan (LMP) target of 0.54 μg/L, Table 10-4 shows the analysis for dissolved zinc using the LMP target of 36 μg/L, Table 10-5 shows the analysis for dissolved zinc using the target of 15 μg/L (a potential threshold for ecological effects), Table 10-6 shows the analysis for dissolved zinc using the target of 5 μg/L (the concentration of dissolved zinc in the St. Joe River is always less than 5), and Table 10-7 shows the analysis for dissolved cadmium using the LMP target of 0.25 μg/L.
To summarize, dissolved lead and cadmium concentrations in the Lake are mostly already below the LMP targets at the Lake sites (with the exception of lead at C4, where levels should fall below the threshold very soon if trends continue). Zinc concentrations are approaching the LMP target in surface waters (see Chapter 6 for monthly details), but are above potential ecological thresholds. Zinc concentrations in bottom waters at C1 and C4 remain above LMP targets, and it will take many decades for concentrations to fall below the various thresholds. For deeper water at C5, the zinc concentrations are not following the pattern of decrease that is seen at the other sites. Trend slopes in the deeper water at C5 are not statistically significant and are generally higher than any of these thresholds. Here, the concentrations appear to be responding to internal cycling processes rather than responding to the on-going downward trends driven by the downward trends in the external loading to the Lake. The bottom water
TABLE 10-3 The Year in Which Dissolved Lead Concentrations Will Fall Below a Target of 0.54 μg/L, Assuming the Trend from the Past Ten Years Continues
| Site | Surface Water | Deep Water | ||
|---|---|---|---|---|
| Spring | Summer | Spring | Summer | |
| C1 | ||||
| C4 | 2023 | 2025 | ||
| C5 | ||||
| C6 | ||||
NOTES: A dark blue entry indicates that the median curve lies below the critical value in 2020, and the curve is declining over time. A number indicates that the median curve is declining over time, and the number represents the year in which this curve would fall below the critical value. A light blue entry indicates that the curve is, as of 2020, below the critical value and is either rising over time or falling at a rate of < 1 percent per year.
TABLE 10-4 The Year in Which Dissolved Zinc Concentrations Will Fall Below a Target of 36 μg/L, Assuming the Trend from the Past Ten Years Continues
| Site | Surface Water | Deep Water | ||
|---|---|---|---|---|
| Spring | Summer | Spring | Summer | |
| C1 | 2025 | 2030 | 2035 | |
| C4 | 2025 | 2030 | 2040 | |
| C5 | ||||
NOTES: A dark blue entry indicates that the median curve lies below the critical value in 2020, and the curve is declining over time. A number indicates that the median curve is declining over time, and the number represents the year in which this curve would fall below the critical value. A light blue entry indicates that the curve is, as of 2020, below the critical value and is either rising over time or falling at a rate of < 1 percent per year. A red entry indicates that the curve is, as of 2020, above the critical value and is either rising over time or falling at a rate of < 1 percent per year.
TABLE 10-5 The Year in Which Dissolved Zinc Concentrations Will Fall Below a Target of 15 μg/L, Assuming the Trend from the Past Ten Years Continues
| Site | Surface Water | Deep Water | ||
|---|---|---|---|---|
| Spring | Summer | Spring | Summer | |
| C1 | 2050 | 2050 | 2062 | 2069 |
| C4 | 2047 | 2042 | 2053 | 2079 |
| C5 | 2025 | |||
NOTES: A dark blue entry indicates that the median curve lies below the critical value in 2020, and the curve is declining over time. A number indicates that the median curve is declining over time, and the number represents the year in which this curve would fall below the critical value. A light blue entry indicates that the curve is, as of 2020, below the critical value and is either rising over time or falling at a rate of < 1 percent per year. A red entry indicates that the curve is, as of 2020, above the critical value and is either rising over time or falling at a rate of < 1 percent per year.
TABLE 10-6 The Year in Which Dissolved Zinc Concentrations Will Fall Below a Target of 5 μg/L, Assuming the Trend from the Past Ten Years Continues
| Site | Surface Water | Deep Water | ||
|---|---|---|---|---|
| Spring | Summer | Spring | Summer | |
| C1 | 2080 | 2088 | 2102 | 2112 |
| C4 | 2075 | 2069 | 2082 | 2129 |
| C5 | 2045 | |||
NOTES: A dark blue entry indicates that the median curve lies below the critical value in 2020, and the curve is declining over time. A number indicates that the median curve is declining over time, and the number represents the year in which this curve would fall below the critical value. A light blue entry indicates that the curve is, as of 2020, below the critical value and is either rising over time or falling at a rate of < 1 percent per year. A red entry indicates that the curve is, as of 2020, above the critical value and is either rising over time or falling at a rate of < 1 percent per year.
TABLE 10-7 The Year in Which Dissolved Cadmium Concentrations Will Fall Below a Target of 0.25 μg/L, Assuming the Trend from the Past Ten Years Continues
| Site | Surface Water | Deep Water | ||
|---|---|---|---|---|
| Spring | Summer | Spring | Summer | |
| C1 | ||||
| C4 | ||||
| C5 | ||||
Notes: A dark blue entry indicates that the median curve lies below the critical value in 2020 and the curve is declining over time. A number indicates that the median curve is declining over time and the number represents the year in which this curve would fall below the critical value. A light blue entry indicates that the curve is, as of 2020, below the critical value and is either rising over time or falling at a rate of < 1 percent per year.
observations at C5 make it clear that time to recovery in this system will be longest where internal processes are substantial. If benthic flux becomes more important in bottom waters of the northern lake as river inputs decline, one might expect the trend of decline at C1 and C4 to slow.
Year When Metals Concentrations Going into and out of CDA Lake Will Reach Thresholds of Ecological Significance
This analysis was similar to the one above, except that the committee looked at trends in flow-normalized concentrations of the metals at two river locations: the CDA River near Harrison and the Spokane River at the outlet of CDA Lake. The seasons are the same as defined in the exercise on the ten-year trends in lake concentrations. The fitted Weighted Regressions on Time, Discharge, and Season (WRTDS) model introduced in Chapter 3 was used to make these computations.
Dissolved Lead, Spokane River below Lake Outlet
For the spring season, the flow-normalized mean concentration in 2020 is 0.71 μg/L, and the ten-year trend is effectively zero. For the summer season, the flow-normalized mean concentration in 2020 is 0.27 μg/L, and the ten-year trend is slight upward, at +1.8 percent per year, which is not statistically significant. Critical dissolved lead concentrations in CDA Lake are 0.54 μg/L. Thus, lead releases from CDA Lake into the Spokane River are not declining, and could even be slightly increasing.
Dissolved Lead, CDA River near Harrison
For the spring season, the flow-normalized mean concentration in 2020 is 6.14 μg/L, and the ten-year trend is −4 percent per year and highly significant downward. The dissolved lead concentration would fall below the 0.54 μg/L threshold by 2082. For the summer season, the flow-normalized mean concentration in 2020 is 2.35 μg/L, and the ten-year trend is −3.7 percent per year and highly significant downward. The dissolved lead concentration would fall below the 0.54 μg/L threshold by 2061.
Dissolved Cadmium, Spokane River below Lake Outlet
For the spring season, the flow-normalized mean concentration in 2020 is 0.161 μg/L, which is already below the target of 0.25 μg/L. The ten-year trend is −2.2 percent per year and highly significant downward. For the summer season, the flow-normalized mean concentration in 2020 is 0.094 μg/L, which is already below the target of 0.25 μg/L, and the ten-year trend is −1.6 percent per year and highly significant downward.
Dissolved Cadmium, CDA River near Harrison
For the spring season, the flow-normalized mean concentration in 2020 is 0.65 μg/L, and the ten-year trend is −1.6 percent per year, which is a significant downward trend. The concentration would fall below the 0.25 μg/L LMP target in 2080. For the summer season, the flow-normalized mean concentration in 2020 is 0.69 μg/L, and the ten-year trend is −3.6 percent per year and highly significant downward. The dissolved cadmium concentration would fall below the 0.25 μg/L target in 2048. These values suggest that some trapping of cadmium in CDA Lake during the summer continues.
Dissolved Zinc, Spokane River below Lake Outlet
For the spring season, the flow-normalized mean concentration in 2020 is 39.3 μg/L, and the ten-year trend is −2.9 percent per year, a highly significant downward trend. The dissolved zinc concentration would fall below the 36 μg/L LMP target in 2024, it would cross 15 μg/L in 2054, and it would cross 5 μg/L in 2092. For the summer
season, the flow-normalized mean concentration in 2020 is 20.6 μg/L and the ten-year trend is −3.1 percent per year, which is a highly significant downward trend. The concentration has already crossed below the 36 μg/L threshold, it would cross 15 μg/L in 2032, and it would cross below 5 μg/L in 2066.
Dissolved Zinc, CDA River near Harrison
For the spring season, the flow-normalized mean concentration in 2020 is 98 μg/L, and the ten-year trend is −3.2 percent per year, which is a highly significant downward trend. The concentration would cross below 36 μg/L in 2052, below 15 μg/L in 2079, and below 5 μg/L in 2113. For the summer season, the flow-normalized mean concentration in 2020 is 126 μg/L, and the ten-year trend is −3.6 percent per year, which is a highly significant downward trend. The concentration would cross below 36 μg/L in 2055, below 15 μg/L in 2080, and below 5 μg/L in 2110. Like cadmium, inputs of zinc are declining slightly faster than outputs, suggesting that some dissolved zinc continues to be retained by the Lake.
***
One can compare the results for dissolved metals in the Lake versus in the river inputs and outputs. For dissolved lead, the analysis for the Lake and for the Spokane River below the Lake indicate that dissolved lead levels have reached levels that represent a near steady-state condition and are no longer responding to the downward trend in the inputs. That steady-state condition does still show a seasonal signal, being above the 0.54 μg/L LMP target in the spring and below it in the summer.
For dissolved zinc, the analysis of the Lake results shows declines (except at C5, in the spring season at depth), and the time at which it crosses the LMP target (36 μg/L) is only a few years into the future, which applies to the Spokane River below the Lake outlet. For the inflow near Harrison, the trends are also rather steeply downward, but the levels are higher and thus the number of years before concentrations fall below the LMP target is a few decades later than the Lake or output values. Overall, the results suggest that the Lake and its outflow continue to be responding favorably to the Superfund remedy. The exception is the spring season at depth at C5, where internal loadings may play an important role rather than responses to inputs from the CDA River.
For dissolved cadmium, all of the results (Lake sites, inputs, and outputs) show an ongoing decline and levels are generally all below the 0.25 μg/L LMP target. The values seen in all of these datasets show an ongoing decline driven by the Superfund remedy and no sign of reaching some new steady-state level.
Alternative In-Lake Zinc Concentration Analysis
Another analysis was conducted by the committee, similar to the above in-lake analysis of metals concentrations that assumed the data followed an exponential decay (called the “exponential analysis”). This second analysis, called the “decadal analysis,” was conducted for zinc only. The differences between monthly mean concentrations of zinc in the earliest data (2004–2008) and more recent data (2015–2020) were compared to assess the response of the Lake. Table 10-8 shows the proportional decline of zinc per decade in the photic zone and bottom waters of C4 nearest the source of zinc input, C1, and C5. For each site, the “decadal analysis” was done for means of March–April data and means of August–September data. Averaging across all locations, dissolved zinc concentrations in March–April declined 23 ± 7 percent per decade between the two time periods and concentrations in August–September declined 16 ± 4 percent per decade (−2.3 and −1.6 percent per year, respectively).
The “exponential analysis” (Tables 10-3 through 10-7) predicts a faster decline in zinc concentrations than the “decadal analysis” (Table 10-8), although both analyses suggest that zinc concentrations in the Lake are declining 1–3 percent per year in spring and summer and for surface and bottom waters. This range probably illustrates the limits of resolution of any extrapolation from the past using small datasets. Both approaches also show that at some locations and seasons LMP targets have been reached or can be reached within a decade or two, except the bottom waters at C5, which reflects the influences of hydrodynamics and internal recycling at this location.
TABLE 10-8 Proportional Decline in Monthly Geometric Mean Dissolved Zinc Concentrations in the Water Column (Photic and Bottom Waters) of C1, C4 and C5 Comparing the Periods of 2004–2008 and 2015–2020; and Years to Reach Three Benchmarks if This Rate of Decline Continued
| Location | % decline/yeara | Yrs to reach 36 μg/L | Yrs to reach 15 μg/L | Yrs to reach 5 μg/L |
|---|---|---|---|---|
| Photic Zone—March–April | ||||
| C4 | 2.4% | 20 | 42 | 99 |
| C1 | 1.9% | 22 | 65 | 110 |
| Bottom—March–April | ||||
| C4 | 3.3% | 14 | 33 | 60 |
| C1 | 1.9% | 15 | 66 | 110 |
| Photic Zone—August | ||||
| C4 | 2.1% | 0 | 33 | 49 |
| C1 | 1.3% | 0 | 55 | 125 |
| C5 | 1.7% | 0 | 40 | 100 |
| Bottom—August | ||||
| C4 | 1.9% | 24 | 66 | 130 |
| C1 | 2.1% | 21 | 58 | 110 |
| C5 | 1.0% | 55 | 164 | 290 |
a Mean concentrations in March–April and in August–September were chosen to represent peak inputs and summer response periods, respectively. Percent decline was calculated from the ratio of mean March–April (or ratio of mean August–September) in the two time periods. Recovery time was determined by calculating a first-order exponential decline using the proportional difference as the rate constant and the concentration in 2015–2020 as time zero.
Decades to centuries will be required to reach more ambitious targets at C5. Of course, all this assumes that the present rates of decline continue into the future.
Lake Sediments as a Source of Zinc to the Lake
If remediation successfully reduces incoming metals to levels less than outgoing metals, further reduction in water column dissolved concentrations in the main body of the Lake will not only depend upon processes within the water column, but perhaps more importantly, on those that determine exchange of metals between the water column and the sediments. As discussed in Chapter 7, such exchange is largely driven by redox processes that are controlled by dissolved oxygen levels and the potential for lower pH in bottom waters that might accompany longer periods of stratification or greater productivity in surface waters. This section considers the potential for lake sediments to become a source of zinc as zinc loading to the Lake is reduced (as a result of remediation in the basin and other factors).
Kuwabara et al. (2007) estimated that dissolved zinc concentrations of about 0.2 μg/L (3 nM) would be typical of pre-mining conditions in the southern lake, which is in the range reported for other undisturbed freshwater lakes (see Table 1-6). As described in Chapter 3, the Central Treatment Plant (CTP) is removing a major, but not the only, source of zinc to the lake, and the lower basin will become a more important source of zinc as upstream remediation continues (EPA Region 10, 2021). Based on the late 2021 performance data, the CTP is currently discharging about 0.1 MT/yr (< 0.7 lb per day) of zinc, which is a small fraction of the 205 MT/yr entering the Lake (Chapter 3). Thus, further reductions at the CTP are unlikely to alter the current inputs.
The 0.2 μg/L level may be difficult to reach, given that recent average levels of dissolved zinc in the less impacted St. Joe River and North Fork of the CDA River are 1.5 and 3.5 μg/L, respectively (see Zinsser, 2020, Appendix 1). Assuming that remedial efforts in the watershed and flushing of residual zinc continue to reduce
levels following current trends (3.6 percent decrease per year; see Chapter 3), it is estimated that the concentration would be 5 μg/L by 2116 and 2.4 μg/L by 2136 in the CDA River at Harrison. Using a similar analysis for the Lake, these low levels will be reached between 2045 and 2119, based on Table 10-6. Obviously, reaching the 0.2 μg/L will take even longer (beyond the year 2200 for the CDA River). This also assumes that other anthropogenic sources of zinc (e.g., tire wear, sacrificial anodes for corrosion control) do not become relevant sources that prevent background levels from being obtained once mining sources of zinc are reduced/eliminated. Even so, an evaluation of how reduced zinc inputs will affect zinc levels in the Lake is needed.
As described in previous chapters, there is a large reservoir of zinc in the sediments of CDA Lake. The Lake serves to remove zinc from the water column, and as shown in Chapter 3, fluxes leaving the Lake are lower than those entering it. If the zinc concentrations in the water column decrease, there is the potential for release of zinc from the benthic sediments to the water column. The potential for this release will depend on the concentration gradient as well as the accessibility of the zinc to the overlying water. This accessibility will be driven by resuspension (Diamond, 1995), the depth at which the zinc is present, the mineral phases with which it is associated, and any redox or pH dynamics that affect the stability of these mineral phases and the association of zinc with them. There are also likely annual/seasonal dynamics that will affect the water/sediment fluxes, with biological uptake/sorption of zinc from the upper part of the water column during periods of biological productivity and deposition to lower water column and sediment in later months (e.g., Acterberg et al., 1997). It is unclear what is the critical Lake concentration at which the sediments will become more of a source of zinc than a sink.
Reduced concentrations of zinc may also affect phytoplankton, periphyton, and zooplankton dynamics in the Lake. To prevent harmful effects on freshwater algae, a zinc concentration of 10 μg/L was recommended for the Great Lakes (Wong and Chau, 1990), and Kuwabara et al. (2007) saw minimal effects in toxicity tests with algae from CDA Lake at 1 μg Zn/L. Evidence also suggests that at levels, in the range of 1–5 μg/L, zinc can act as a nutrient and stimulate growth of algae or phytoplankton (Wong and Chau, 1990; Canli, 2005). A recent microcosm study provides insight into the potential effects of zinc over a range of concentrations (8–160 μg/L; Hoang et al., 2021; see also, Box 9-2). Concentrations as low as 8 μg/L led to reduced abundance of Chlorophyta (both phytoplankton and periphyton) and Chrysophyta and decreased the diversity. This study led to a No Observed Effects Concentration of 14 μg/L (similar to the recommendation of Wong and Chau, 1990). Concentrations of 40 μg/L and greater (similar to those present in CDA Lake) also inhibited these algae, reduced overall diversity, and led to an increase in the abundance of cyanobacteria. Continued assessment of the role of zinc in the Lake on algal abundance and diversity as nutrient levels and other factors change will be important.
As zinc levels decline, any toxic inhibitions on specific algae are likely to decrease and a more stable algal community may result. Before reaching background levels, the concentration of zinc in the range of 1–5 μg/L may serve as a nutrient to enhance algal growth and could lead to a return to greater abundance and diversity of phytoplankton, periphyton, and zooplankton. The stimulated growth and/or the more diverse community could, in turn, limit the growth of harmful cyanobacteria, which may be favored at extreme dissolved zinc concentrations (Hoang et al., 2021). Once at background zinc levels, there may be less algal growth due to zinc nutrient limitations, but other factors, particularly low phosphorus supplies, are likely to be more important. Note that based on late 2021 performance of the CTP, the plant is not a significant source of phosphorus, and almost all of the phosphorus in the CDA River is coming from nonpoint sources across the CDA watershed.
***
In summary, the calculations in this section suggest that further progress in reducing toxic metals concentrations in the euphotic zone is possible on the timescale of a few decades if the present trends can be sustained and the challenges posed by climate change and population growth can be mitigated. Better understanding of how metals are affecting the lake ecosystem is necessary to address the question of whether further reductions in zinc and cadmium concentrations in the water column of the Lake are more likely to result in ecosystem benefits than in greater risks to the ecosystem (e.g., via eutrophication). The committee suggests that estimates of the time to reach various ecological targets be regularly evaluated as conditions develop, since the drivers of those trends are
likely to change (e.g., because of continued remediation, climate change, and changes in land use). Lake sediments represent an immense repository of toxic metals that will be difficult to mitigate. Better anticipating the effects of those metals would benefit from a concerted effort to fully understand the processes that lead to the releases of different metals (as well as phosphorus) from the Lake sediments and the relative rates of release at present (see Chapters 7 and 8).
CONCLUSIONS AND RECOMMENDATIONS
This chapter summarized the changes in climate likely to affect the Pacific Northwest generally and the CDA regional specifically (when local predictions were available). It then considered four changes in climate most likely to negatively impact water quality in CDA Lake, along with population growth in the nearshore watersheds, and it assessed the extent to which the trends revealed in Chapters 3 to 7 might be slowed or reversed by these changes. Because all four future climate changes, along with increased lakeshore populations, can lead to the eventual release of metals from lake sediments to the Lake (via lowering of either dissolved oxygen or pH in bottom waters), the long-term monitoring and assessment programs for both the watershed and the Lake need to be fortified and improved (see Chapter 8) to provide an early warning of deteriorating conditions. The following detailed conclusions are made about the future of water quality in CDA Lake.
- A major impact of climate change likely to affect water quality in the CDA region is air temperature warming as much as 2.5–3°C (4.5–5.4°F) by the year 2050, depending on the month. Data from the CDA region over the past 30 years show warming of about 0.4°F per decade. Increases in air temperature are expected to lead to increases in Lake temperature and increased fire risk across the region.
- Although there are no apparent trends in precipitation in the CDA region over the past 30 years, studies in the greater Pacific Northwest suggest that precipitation events in the top 1 percent of historical daily precipitation volumes are likely to become between 5–34 percent more intense by 2080. A shift is expected in the percentage of precipitation that falls as snow versus rain, such that by 2080 the peak snow water equivalent could decrease by an average of 73 percent. Finally, in the Pacific Northwest, the historic center of timing of the annual hydrograph is predicted to shift from April 15 in the 1980s to as early as March 4 by 2040, although there is not yet evidence of this shift over the past 30 years in the CDA region.
- Lake water temperatures have been increasing in surface water at station C4 over the past 30 years (although not in bottom water). It is reasonable to assume that this warming is related to the general global trend toward rising air temperatures, and this can be expected to increase in the future based on ongoing greenhouse forcing of the climate. Responses in the lake to such warming will likely include increased rates of ecosystem metabolism and lengthening of the duration of stratification, which may extend periods of dissolved oxygen consumption in the bottom waters and Lake sediments as well as lower pH in the bottom waters.
- Future climate change may slow or reverse the trends in metals and phosphorus loading to CDA Lake (discussed in Chapter 3) and the trends in dissolved oxygen, phosphorus, and metals concentrations within CDA Lake (discussed in Chapters 5 and 6), and it may increase the potential for metals release from lake sediments (discussed in Chapter 7). Those trends were based on historical data from the last 30 years and did not explicitly take future climate change into account (although it is clear that air and lake water warming have been underway during the past 30 years). The changes in climate considered by the committee were (1) increased frequency and magnitude of large runoff events, (2) a forward shift in the timing of flow to the Lake, (3) warming of lake water, and (4) increased frequency and size of fires. Of these four potential climate changes, the committee is most confident about warming of lake water, along with increases in lakeshore populations. There is not yet evidence in the CDA region of an increased frequency and magnitude of large runoff events, a forward shift in the timing of flow to the Lake, or increased frequency and size of fires, although these are predicted to occur for the Pacific Northwest.
- Zinc concentrations in surface waters are at or approaching the Lake Management Plan (LMP) target of 36 μg/L in some months and at some locations. If trends from the past decade continue into the future, it will take bottom waters 10 to more than 100 years to reach that target. The slowest changes are occurring in the southern Lake, where the response to declining inputs appears to be buffered by internal inputs from bottom sediments and hydrodynamic inputs from the northern Lake. Reaching lower concentrations more reflective of background conditions, like 5 μg/L, may take as many as 500 years at C5. Dissolved lead concentrations in CDA Lake are already below the LMP target of 0.54 μg/L in the measured Lake locations, with the exception of C4 during the spring. Cadmium concentrations are also already below the LMP target of 0.25 μg/L in the three measured Lake locations (C1, C4, C5).
- It is unclear at what in-lake zinc concentration the Lake sediments will become more of a zinc source than a sink. As shown in Chapter 3, CDA Lake is still a net sink for zinc. If zinc concentrations in the water column decrease owing to decreased loading from the basin, there is the potential for release of zinc from the Lake sediments to the water column, which will depend on the concentration gradient as well as the accessibility of the zinc in the sediments to the overlying water. This accessibility will be driven by resuspension, by the depth at which the zinc in present, by the mineral phases with which it is associated, and by any redox or pH dynamics that affect the stability of these mineral phases and the association of zinc with them. This conclusion could also apply to cadmium and arsenic under appropriate circumstances, but is less likely for lead.
REFERENCES
Abatzoglou, J. T., and A. P. Williams. 2016. Impact of anthropogenic climate change on wildfire across western US forests. PNAS 113(42):11770–11775. https://doi.org/10.1073/pnas.1607171113.
Abatzoglou, J. T., and T. J. Brown. 2012. A comparison of statistical downscaling methods suited for wildfire applications. International Journal of Climatology 32:772–780. https://doi.org/10.1002/joc.2312.
Acterberg, E. P., C. M. G. van den Berg, M. Boussemart, and W. Davison. 1997. Speciation and cycling of trace metals in Esthwaite Water: A productive English lake with seasonal deep-water anoxia, Geochim. Cosmochim. 61:5233–8253.
Beniston, M., and M. Stoffel. 2016. Rain-on-snow events, floods and climate change in the Alps: Events may increase with warming up to 4 C and decrease thereafter. Science of the Total Environment 571:228–236. https://doi.org/10.1016/j.scitotenv.2016.07.146.
Brandt, W. T., K. Haleakala, B. J. Hatchett, and M. Pan. 2022. A review of the hydrologic response mechanisms during mountain rain-on-snow. Frontiers in Earth Science. https://doi.org/10.3389/feart.2022.791760.
Brauer, V., M. Stomp, C. Rosso, S. A. M. van Beusekom, B. Emmerich, L. J. Stal, and J. Huisman. 2013. Low temperature delays timing and enhances the cost of nitrogen fixation in the unicellular cyanobacterium Cyanothece. ISME J 7:2105–2115. https://doi.org/10.1038/ismej.2013.103.
Breitbarth, E., A. Oschlies, and J. LaRoche. 2006. Physiological constraints on the global distribution of Trichodesmium – effect of temperature on diazotrophy. Biogeosciences Discuss. 3:779–801. https://doi.org/10.5194/bg-4-53-2007.
Brooks, E. 2021. Impacts of Wildfire on Phosphorus Transport in the CDA Basin. Presentation to the NASEM Committee. May 4, 2021.
Canli, M. 2005. The transfer of zinc in two liked trophic levels in fresh water and its effect on the reproduction of Daphnia magna. J. Freshwater Ecol. 20:269–276. https://doi.org/10.1080/02705060.2005.9664966.
Diamond, M. L. 1995. Application of a mass balance model to assess in-place arsenic pollution. Environ. Sci. Technol. 29:29–42.
Dudley, R. W., G. A. Hodgkins, M. R. McHale, M. J. Kolian, and B. Renard. 2017. Trends in snowmelt-related streamflow timing in the conterminous United States. Journal of Hydrology 547:208–221. https://doi.org/10.1016/j.jhydrol.2017.01.051.
EPA Region 10. 2021. Fifth five-year review for the Bunker Hill Superfund Site.
Hamman, J., B. Nijssen, A. Roberts, A. Craig, W. Maslowski, and R. Osinski. 2017. The coastal streamflow flux in the Regional Arctic System Model. Journal of Geophysical Research: Oceans 122:1683–1701. doi:10.1002/2016JC012323.
Hauer, F. R., and C. N. Spencer. 1998. Phosphorus and Nitrogen Dynamics in Streams Associated With Wildfire: a Study of Immediate and Long-term Effects. International Journal of Wildland Fire 8:183–198. https://doi.org/10.1071/WF9980183.
Helsel, D. R. 2011. Statistics for censored environmental data using Minitab and R, 2nd ed. John Wiley & Sons.
Hoang, T. C., J. M. Brausch, M. F. Cichra, D. J. Phlips, C. Van Genderen, and G. M. Rand. 2021. Effects of zinc in an outdoor freshwater microcosm system. Environ. Toxicol. Chem. 40:2051–2070. https://doi.org/10.1002/etc.5050.
Holden, Z. A., A. Swanson, C. H. Luce, W. M. Jolly, M. Maneta, J. W. Oyler, D. A. Warren, R. Parsons, and D. Affleck. 2018. Decreasing fire season precipitation increased recent western US forest wildfire activity. PNAS 115(36):E8349–E8357. https://doi.org/10.1073/pnas.1802316115.
Hornberger, M. I., S. N. Luoma, M. J. Johnson, and M. Holyoak. 2009. The influence of remediation in a mine-impacted river: do improvements upstream impact metal trends over large spatial and temporal scales? Ecological Applications 19(6):1522–1535. https://doi.org/10.1890/08-1529.1.
Huang, H., M. R. Fischella, Y. Liu, Z. Ban, J. V. Fayne, D. Li, K. C. Cavanaugh, and D. P. Lettenmaier. 2022. Changes in mechanisms and characteristics of western US floods over the last sixty years. Geophysical Research Letters 49(3):e2021GL097022. https://doi.org/10.1029/2021GL097022.
Kharin, V. V., F. W. Zwiers, X. Zhang, and M. Wehner. 2013. Changes in temperature and precipitation extremes in the CMIP5 ensemble. Climatic Change 119(2):345–357. https://doi.org/10.1007/s10584-013-0705-8.
Kuwabara, J. S., Topping, B. R., Woods, P. F., and J. L. Carter. 2007. Free zinc ion and dissolved orthophosphate effects on phytoplankton from Coeur d’Alene Lake, Idaho. Environ. Sci. Technol. 41(8):2811–2817. https://doi.org/10.1021/es062923l.
Leavesley, G. H., R. W. Lichty, B. M. Troutman, and L. G. Saindon. 1983. Precipitation-runoff modeling system-User’s manual: USGS Water-Resources Investigations Report 83-4238, 207 p.
Liang, X., D. P. Lettenmaier, E. F. Wood, and S. J. Burges. 1994. A simple hydrologically based model of land-surface water and energy fluxes for general-circulation models. Journal of Geophysical Research: Atmospheres 99:14415–14428. doi:10.1029/94jd00483.
López-Moreno, J. I., J. W. Pomeroy, E. Morán-Tejeda, J. Revuelto, F. M. Navarro-Serrano, I. Vidaller, and E. Alonso-González. 2021. Changes in the frequency of global high mountain rain-on-snow events due to climate warming. Environmental Research Letters 16(9):094021. https://doi.org/10.1088/1748-9326/ac0dde.
Luoma, S. N., and P. S. Rainbow. 2008. Metal Contamination in Aquatic Environments: Science and Lateral Management. Cambridge, UK: Cambridge University Press.
Mauger, G. 2021. Climate Change Impacts in the Pacific Northwest: Implications for the Coeur d’Alene Watershed. Presentation to the NASEM Committee. May 4, 2021.
McCullough, I. M., K. Spence Cheruvelil, J.-F. Lapierre, N. R. Lottig, M. A. Moritz, J. Stachelek, and P. A. Soranno. 2019. Do lakes feel the burn? Ecological consequences of increasing exposure of lakes to fire in the continental United States. Global Change Biology 25(9):2841–2854. https://doi.org/10.1111/gcb.14732.
Moore, J. N., and S. N. Luoma. 1990. Hazardous wastes from large scale metal extraction: a case study. Environ. Sci. Technol. 24:1279–1285.
National Research Council (NRC). 2005. Superfund and Mining Megasites: Lessons from the Coeur d’Alene River Basin. Washington, DC: National Academies Press. https://doi.org/10.17226/11359.
Preisler, H. K., J. A. Hicke, A. A. Ager, and J. L. Hayes. 2012. Climate and weather influences on spatial temporal patterns of mountain pine beetle populations in Washington and Oregon. Ecology 93(11):2421–2434. https://doi.org/10.1890/11-1412.1.
Rhoades, C. C., A. T. Chow, T. P. Covino, T. S. Fegel, D. N. Pierson, and A. E. Rhea. 2019. The legacy of a severe wildfire on stream nitrogen and carbon in headwater catchments. Ecosystems 22:643–657. https://doi.org/10.1007/s10021-018-0293-6.
Robarts, R. D., and T. Zohary. 1987. Temperature effects on photosynthetic capacity, respiration, and growth rates of bloom-forming cyanobacteria. New Zealand Journal of Marine and Freshwater Research 21:3:391–399. https://doi.org/10.1080/00288330.1987.9516235.
Rust, A. J., S. Saxe, J. McCray, C. C. Rhoades, and T. S. Hogue. 2019. Evaluating the factors responsible for post-fire water quality response in forests of the western USA. International Journal of Wildland Fire 28:769–784.
Rust, A. J., T. S. Hogue, S. Saxe, and J. McCray. 2018. Post-fire water-quality response in the western United States. International Journal of Wildland Fire 27:203–216. https://doi.org/10.1071/WF17115.
Shepherd, T. G., E. Boyd, R. A. Calel, S. C. Chapman, S. Dessai, I. M. Dima-West, H. J. Fowler, R. James, D. Maraun, O. Martius, C. A. Senior, A. H. Sobel, D. A. Stainforth, S. F. B. Tett, K. E. Trenberth, B. J. J. M. van den Hurk, N. W. Watkins, R. L. Wilby, and D. A. Zenghelis. 2018. Storylines: an alternative approach to representing uncertainty in physical aspects of climate change. Climatic Change 151(3):555–571. https://doi.org/10.1007/s10584-018-2317-9.
Siirila-Woodburn, E. R., A. M. Rhoades, B. J. Hatchett, L. S. Huning, J. Szinai, C. Tague, P. S. Nico, D. R. Feldman, A. D. Jones, W. D. Collins, and L. Kaatz. 2021. A low-to-no snow future and its impacts on water resources in the western United States. Nature Reviews Earth & Environment 2(11):800–819. https://doi.org/10.1038/s43017-021-00219-y.
Spencer, C. N., K. Odney Gabel, and F. R. Hauer. 2003. Wildfire effects on stream food webs and nutrient dynamics in Glacier National Park, USA. Forest Ecology and Management 178:141–153. https://doi.org/10.1016/S0378-1127(03)00058-6.
Taylor, K. E., R. J. Stouffer, and G. A. Meehl. 2012. An Overview of CMIP5 and the experiment design. Bull. Amer. Meteor. Soc. 93:485–498. doi:10.1175/BAMS-D-11-00094.1.
Warner, M. D., C. F. Mass, and E. P. Salathe, Jr. 2015. Changes in winter atmospheric rivers along the North American west coast in CMIP5 climate models. Journal of Hydrometeorology 16(1):118–128. https://doi.org/10.1175/JHM-D-14-0080.1.
Williams, A. P., B. I. Cook, and J. E. Smerdon. 2022a. Rapid intensification of the emerging southwestern North American megadrought in 2020–2021. Nature Climate Change 12:232–234. https://doi.org/10.1038/s41558-022-01290-z.
Williams, A. P., B. Livneh, K. A. McKinnon, W. D. Hansen, J. S. Mankin, B. I. Cook, J. E. Smerdon, A. M. Varuolo-Clarke, N. R. Bjarke, C. S. Juang, and D. P. Lettenmaier. 2022b. Growing impact of wildfire on western US water supply. PNAS 119(10). https://doi.org/10.1073/pnas.2114069119.
Wong, P. T. S., and Y. K. Chau. 1990. Zinc toxicity to freshwater algae. Tox. Assess. 5:167-177. https://doi.org/10.1002/tox.2540050205.
Wood, A. W., L. R. Leung, V. Sridhar, and D. P. Lettenmaier. 2004. Hydrologic implications of dynamical and statistical approaches to downscaling climate model outputs. Climatic Change 62:189–216. doi:10.1023/B:CLIM.0000013685.99609.9e.
Zhang, H., J. E. Mu, and B. A. McCarl. 2018. Adaptation to climate change via adjustment in land leasing: Evidence from dryland wheat farms in the US Pacific Northwest. Land Use Policy 79:424–432. https://doi.org/10.1016/j.landusepol.2018.07.030.
Zinsser, L. M. 2020. Trends in Concentrations, Loads, and Sources of Trace Metals and Nutrients in the Spokane River Watershed, Northern Idaho, Water Years 1990-2018. USGS Scientific Investigations Report 2020-5096. https://doi.org/10.3133/sir20205096.


