2
Long-Term Monitoring of Coeur d’Alene Lake and Its Watershed
This introductory chapter summarizes the various water quality data collected throughout the Coeur d’Alene (CDA) watershed, including the Lake and its tributaries, as well as the CDA and St. Joe rivers, by the U.S. Geological Survey (USGS), the Idaho Department of Environmental Quality (IDEQ), and the Coeur d’Alene Tribe (CDA Tribe). The generated data provide valuable information related to water quality, sediment quality, and biota, and have been used to drive numerous special studies (see Appendix A) and to model physical, chemical, and biological processes in the CDA watershed and the Lake (see Chapter 4). Data from these ongoing, long-term monitoring networks are analyzed by the Committee in Chapters 3 through 6 to reveal trends and highlight particular issues of concern. Subsequent to those analyses and building off of their limitations, Chapter 8 describes gaps in the long-term monitoring networks and in the evaluation of monitoring data, which should be filled in order for water quality in CDA Lake to be adequately and continuously assessed into the future.
The long history of research and associated monitoring activities in CDA Lake started with the U.S. Environmental Protection Agency (EPA) sampling the Lake as part of the National Eutrophication Survey (EPA, 1977). The USGS conducted comprehensive river and lake sampling in 1991–1992 as part of its baseline study of limnological conditions (Woods and Beckwith, 1997), which was used in the development of the initial Lake Management Plan in 1996. USGS and the CDA Tribe did an additional baseline study from October 2003 to August 2006 (Wood and Beckwith, 2008). During the 1990s and early 2000s, USGS published a number of studies characterizing water quality and sediments in the Lake (e.g., Horowitz et al., 1993, 1995; Woods and Beckwith, 1997; Kuwabara et al., 2000, 2003, 2006). Since then, USGS has monitored the rivers primarily in consultation with EPA as part of the Basin Environmental Monitoring Program, which began in October 2003, to evaluate the long-term effects of the Bunker Hill Superfund site remediation.
After efforts to develop a revised Lake Management Plan were unsuccessful, an assessment was completed in 2006 as part of an Alternative Dispute Resolution process among the CDA Tribe, IDEQ, and EPA. A key finding of the resolution process was a need for the CDA Tribe, IDEQ, and EPA to develop a consistent description of current water quality conditions in the Lake (Harty, 2007). Hence, one of the first objectives of the 2009 Lake Management Plan was to “improve scientific understanding of lake conditions through monitoring, modeling, and special studies” (IDEQ and CDA Tribe, 2009). Strategies to achieve this objective included the establishment of water quality triggers and routine monitoring of the Lake and rivers. In 2007, the CDA Tribe and IDEQ began a regular monitoring program that was a continuation of the baseline monitoring and some of the special studies previously done by USGS at key sites.
LAKE MONITORING
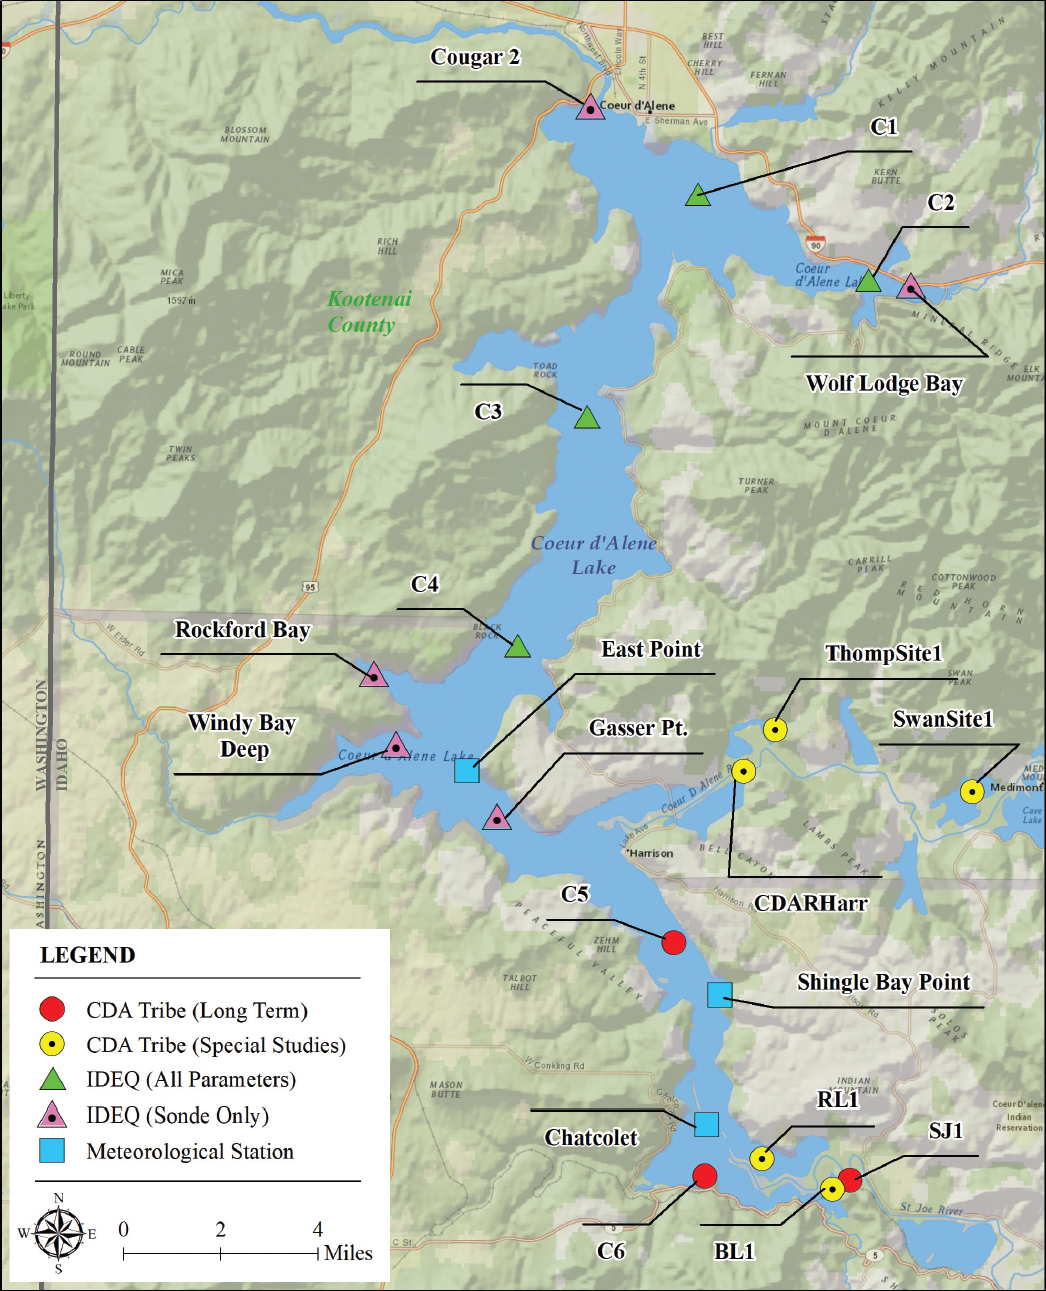
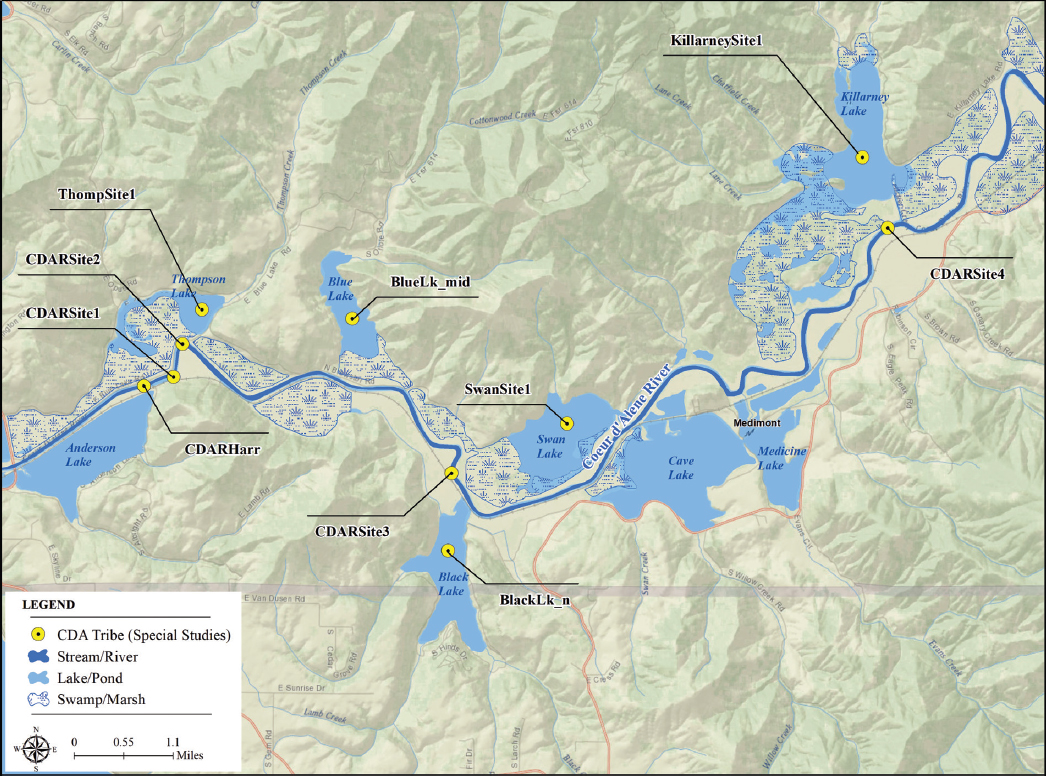
The long-term monitoring efforts of IDEQ, the CDA Tribe, and USGS capture different parts of the multifaceted CDA Lake and river system, as shown in Table 2-1 and Figure 2-1. IDEQ maintains long-term monitoring sites in the northern and central pools of the Lake, known as C1, C2, C3, and C4. Measurements at sites C1, C2, and C4 are done for all physical and water quality parameters, while less comprehensive assessment is done at the other IDEQ sites (see Table 2-1). The CDA Tribe maintains long-term monitoring sites in the southern part of the lake (called C5 and C6) and site SJ1 in the lower St. Joe River. It also maintains three meteorological stations and has measured many of the lateral lakes along the CDA River as part of special studies (Figures 2-1 and 2-2).
Throughout the Lake, water column sampling is done at discrete depths as well as several depth categories defined in the 2009 Lake Management Plan (IDEQ and CDA Tribe, 2009). These include the photic zone composite (five equally spaced samples from 1 m below the surface to the depth where underwater photosynthetically active radiation [PAR] is 1 percent of the light incident on the surface, composited into a churn splitter), discrete sampling at 20 and 30 m for northern pool stations, and 1 m above the Lake bottom or near bottom (a discrete sample with sampling depth determined from the Hydrolab profile). In general, physical parameters are measured continuously by profilers at discrete depths, while metals and nutrients are measured in the depth zones described above. Starting in 2017, the CDA Tribe also began measuring an epilimnion composite for metals and nutrients defined as grab samples from five equal depth increments from 1 m to the bottom of the epilimnion (composited in a churn splitter).
TABLE 2-1 Long-Term Monitoring Sites within CDA Lake
| Agency | Site Number (colloquial name) | Type of Monitoring | Latitude (°N) | Longitude (°W) | Max Depth (m) |
|---|---|---|---|---|---|
| IDEQ | C1 (Tubbs) | all WQ parameters | 47.65000 | 116.75833 | 40 |
| C2 (Wolf) | all WQ parameters | 47.62500 | 116.68300 | 30 | |
| C3 (Driftwood) | WQ parameters (sonde only) | 47.58330 | 116.80600 | 52 | |
| C4 (University) | all WQ parameters | 47.51500 | 116.83500 | 40 | |
| Cougar 2 | WQ parameters (sonde only) | 47.67433 | 116.45639 | ~20 | |
| Wolf Lodge Bay | WQ parameters (sonde only) | 47.62361 | 116.66417 | ~10 | |
| Rockford Bay | WQ parameters (sonde only) | 47.50589 | 116.89806 | ~15.5 | |
| Windy Bay Deep | WQ parameters (sonde only) | 47.48500 | 116.88778 | ~30 | |
| Gasser Pt. | WQ parameters (sonde only) | 47.46408 | 116.84306 | ~28 | |
| CDA Tribe | C5 (Chippy Pt.) | all WQ parameters | 47.42717 | 116.76476 | 18 |
| C6 (Chatcolet) | all WQ parameters | 47.35815 | 116.74987 | 11 | |
| SJ1 | all WQ parameters | 47.35744 | 116.68634 | 21 | |
| CDARHarr | All WQ parameters | 47.478448 | 116.735051 | 10.5 | |
| ThompSite1 | Phytoplankton and physical parameters | 47.490894 | 116.721537 | 7 | |
| SwanSite1 | Phytoplankton and physical parameters | 47.473211 | 116.634575 | 6.1 | |
| East Pt. | meteorological station | 47.477470 | 116.856526 | ||
| Shingle Bay Pt. | meteorological station | 47.411881 | 116.744303 | ||
| Chatcolet | meteorological station | 47.373530 | 116.749151 |
Note: WQ = water quality.
Constituents Measured and Methods
Tables 2-2 to 2-5 provide an overview of water quality and physical parameters measured in CDA Lake and some river sites by IDEQ and the CDA Tribe, organized by the constituents measured.1 The parameters measured are in part guided by the Lake Management Plan, which includes triggers for zinc (Zn), lead (Pb), cadmium (Cd), phosphorus (P), phytoplankton, and dissolved oxygen (DO) as indicators of lake health. Table 2-2 shows the metals measured in the Lake; it is apparent that the focus is on those heavy metals commonly found in the mining waste. In almost all cases, both total and dissolved metal fractions are measured. Nutrients and chlorophyll a, which are important to understanding the productivity of CDA Lake and the potential for future problems with nutrient enrichment, are the subject of Table 2-3. Table 2-4 shows the biological parameters related to lake productivity that are measured by the CDA Tribe in the southern portion of CDA Lake as well as in the lateral lakes Swann Lake and Thompson Lake. Finally, Table 2-5 lists the physical parameters measured throughout the Lake, including light, dissolved oxygen, pH, and other parameters.
Prior to reinitiating long-term monitoring in 2007, IDEQ and the CDA Tribe jointly prepared a Quality Assurance Project Plan approved by EPA, which was designed to address quality assurance/quality control issues and
___________________
1 This paragraph was edited after report release to more accurately describe the nutrient datasets provided to the committee.
TABLE 2-2 Monitoring of Metals and Other Water Quality Parameters in CDA Lake
| Site Name | Sample Datesa | Sample Depth | Number of Samples | Parameters Measured |
|---|---|---|---|---|
| C5, C6, SJ1 | 2007–2020 | Photic zone and one meter above bottom | ~200–300 per site | Filtered and total: As, Ca, Cd, Fe, Mg, Mn, Pb, Zn; total hardness |
| CDARHarr | 2013, 2015, 2018–2020 | Photic zone | 37 | Filtered and total: As, Ca, Cd, Fe, Mg, Mn, Pb, Zn |
| C1 | 1991–1992, 1995–2020 | varies | varies | Total and dissolved: As, Ca, Cd, Fe, Mg, Mn, Pb, Si, Zn, hardness |
| C2 | 2010–2020 | |||
| C3 | 1991–1992, 1995–2020 | |||
| C4 | 1991–1992, 1995–2020 | |||
| C5 | 1991–1992, 1995–1998, 2003–2006, 2013–2019 | |||
| C6 | 1991–1992, 2003–2006, 2015–2018 | |||
| Cougar 2 | 2013–2020 | |||
| Gasser Pt | 2014–2020 |
a Colors denote the agency conducting the monitoring: CDA Tribe, IDEQ, USGS.
TABLE 2-3 Monitoring of Nutrients and Chlorophyll a in CDA Lake
| Site | Sample Datesa | Sample Depth | Number of Samples | Parameters Measured |
|---|---|---|---|---|
| C1 | 1991–1992, 1995–2020 | Photic-near bottom | ~700 | Phosphorusb, nitrogenc, chlorophyll a |
| C2 | 2010–2019 | ~150 | ||
| C3 | 1991–1992, 1995–2006, 2010–2015 | ~400 | ||
| C4 | 1991–1992, 1995–2020 | ~700 | ||
| C5 | 1991–1992, 1995–1998, 2003–2006, 2015–2019 | ~200 | ||
| C6 | 1991–1992, 2003–2006 | ~200 | ||
| Cougar 2 | 2013–2015 | <100 | ||
| Gasser Pt | 2014–2015 | <50 | ||
| C5, C6, SJ1 | 2007–2020 | Photic zone, one meter above bottom | ~300/site | Phosphorus (total, phosphate), nitrogen (total, ammonia, nitrate), chlorophyll a |
| CDARHarr | 2013, 2015, 2018–2020 | Photic zone | 37 | Phosphorus (total, phosphate), nitrogen (total, ammonia, nitrate), sulfate, TOC, DOC |
| SJ1 | 2007–2020 | Photic zone | ~100 |
a Colors denote the agency conducting the monitoring: CDA Tribe, IDEQ, USGS.
b Phosphorus speciation when measured: total, dissolved total, dissolved reactive, total reactive, total acid-hydrolyzable, total reactive+acid-hydrolyzable, total organic.
c Nitrogen speciation when measured: total, ammonia, nitrate, nitrite, nitrate + nitrite.
Note: TOC and DOC = total organic carbon and dissolved organic carbon.
TABLE 2-4 Phytoplankton Monitoring in CDA Lake and Lateral Lakes by the CDA Tribe
| Site | Sample Dates | Sample Depth | Number of Samples per Site | Parameters Measured |
|---|---|---|---|---|
| BL1, RL1 | 2011–2019 | Photic zone | ~1,200 | Phytoplankton taxa identified to level of genus (usually), natural counting units (e.g., cells or colonies), biovolume |
| C5, C6, SJ1 | 2007–2020 | ~2,300 | ||
| ThompSite1 SwanSite1 | 2015 | Epilimnion | ~90 |
TABLE 2-5 Physical Parameters and Light Monitoring in CDA Lake and the Lateral Lakes
| Site | Sample Datesa | Sample Depth (m) | Number of Samples | Parameters Measured |
|---|---|---|---|---|
| C1 Tubbs | 1991–1992, 1995–2021 | 1–40m | ~5,000 | Temperature, conductivity, DO, pH, turbidity, pressure, photic zone depth, extinction coefficient, percent light, Secchi depth |
| C2 Wolf | 2010-2021 | 0–30 m | ~2,000 | |
| C3 Driftwood | 1991–1992, 1995–2006, 2010–2021 | 1–50+ m | ~4,000 | |
| C4 University | 1991–1992, 1995–2021 | 0–40 m | ~5,000 | |
| C5 Chippy Pt | 1991–1992, 1995–1998, 2003–2019 | 0–20 m | ~1,000 | |
| C6 Chatcolet | 1991–1992, 2003–2006 | 1–10 m | ~500 | |
| Cougar 2 | 2013–2021 | 0–20 m | ~2,000 | |
| Gasser Pt | 2014–2021 | 0–20 m | ~1,300 | |
| Windy Deep | 2016–2021 | 0–30 m | ~1,300 | |
| C5 | 2011, 2015, 2019 | 0.5- to 1-m resolution | 67,600 over 3 years | Temperature, specific conductance, pH, DO |
| C5, C6, SJ1 | 2007–2020 | 1-m resolution | 2,000–3,000 per site | Temperature, specific conductance, pH, DO, PAR, fluorescence |
| BlackLk_n | 2015, 2017 | 0–10 m | 200–300 per site | Temperature, specific conductance, pH, DO, PAR, fluorescence |
| BlueLk_mid | 2015 | |||
| Cataldo | 2015 | |||
| CDARHarr | 2013, 2015, 2018–2020 | |||
| CDARSite1 | 2013, 2015, 2018 | |||
| CDARSite2 | 2013, 2015–2016, 2018 | |||
| CDARSite3 | 2013, 2018 | |||
| CDARSite4 | 2018 | |||
| KillarneySite1 | 2015 | |||
| SwanSite1 | 2015, 2019 | |||
| ThompSite1 | 2015, 2017, 2019 |
a Colors denote the agency conducting the monitoring: CDA Tribe, IDEQ, USGS.
serve as an initial plan for the 2007 monitoring season (IDEQ and CDA Tribe, 2007). Currently, IDEQ and the CDA Tribe use different analytical laboratories, which affects the comparisons done across the Lake and data analysis of long-term trends. Samples collected by IDEQ are sent to EPA-certified labs for analysis (IDEQ, 2020). The CDA Tribe collects total recoverable and 0.45 μm filtered metals (arsenic, calcium, cadmium, iron, magnesium, manganese, lead, zinc), which are analyzed by the EPA Manchester Laboratory; total and speciated nitrogen and phosphorus, chlorophyll a, and organic carbon (2019–2020), which are analyzed by the Tshimakain Creek Laboratory; and phytoplankton, which is analyzed by Advanced Eco-Solutions, Inc. (Chess, 2021). Furthermore, different methods have been used to measure chlorophyll a, such that lab measurements of the same water yield different results (Cooper, 2021). Nutrient and chlorophyll a concentrations are also often near or below measurement detection limits, presenting challenges for the analytical methods (Cooper, 2021).
The Committee was sensitive to the possibility that comparability issues can affect using data from different laboratories and that methodologies change over time as technologies improve. Individual analyses found in Chapters 3–7 were usually associated with a single data source (e.g., watershed data were all from the quality-controlled databases of USGS). The report notes those instances where data were censored (e.g., metals time series were restricted to periods where quality assurance/quality control were reported or caveats are made about older data).
With respect to physical parameters, IDEQ measures Secchi depth and sonde profiles of light, temperature, conductivity, pH, turbidity and dissolved oxygen (Table 2-5). The CDA Tribe measures profiles of physical parameters at 1-m resolution coincident with their water quality measurements. The multi-parameter sonde measures temperature, dissolved oxygen, pH, specific conductance, fluorescence, and PAR (Table 2-5). An automated buoy profiler system has occasionally been deployed in the summertime at sites C5 (2011, 2015) and C6 (2014, 2018) to collect temperature, dissolved oxygen, pH, and specific conductance. In 2018, the Tribe began collecting profiles of temperature, specific conductance, and salinity at every site when they sampled water quality. The CDA Tribe also has three meteorological stations—East Point (2009–2019), Shingle Bay (2009–2019), and Chatcolet (2016–2020)—that log data every five minutes and measure temperature, relative humidity, solar radiation, PAR, wind speed, and wind direction (Chess, 2021).
Sampling Frequency
The frequency and timing of sampling varies by site and year, but generally sampling coincides with lake and river flow conditions of interest. There has historically been less monitoring during the winter when the Lake is cold and unstratified. Sampling tends to pick up in the spring, when there is peak runoff and influence from the rivers and it continues throughout the strong thermal stratification that develops in earlier summer (July) and weakens in the fall (October). Hence, IDEQ has traditionally sampled seven to nine times per year, including two rain-on snow events in February–April, monthly water quality measurements from May to September, fall lake turnover, and winter measurements in November–December, with sonde-only measurements in January–February (Cooper, 2021). From 2007 to 2020, the CDA Tribe’s monitoring of their three long-term sites has been most concentrated from April to November (10–14 samples per site per month), with fewer samples (0–6 samples per site per month) during the winter months when portions of the southern Lake freeze over, making sampling conditions difficult (Chess, 2021). Although there is less sampling during winter, there has been a focus on sampling rain-on-snow events, which may bias wintertime samples.
COEUR D’ALENE RIVER SAMPLING
USGS measures discharge and water quality at many gages throughout the Spokane River basin (Figure 2-3). The oldest gages in the system to measure discharge came online in 1911; more recent sites were added in the late 1980s on the South Fork of the CDA River associated with the Superfund site. Although sampling timing and frequency was variable prior to the late 1990s, in 2004 it became unified under EPA’s Basin Environmental Monitoring Program (EPA, 2004). Hence, the USGS data currently collected are concentrated in the CDA River basin and at the mouth of the St. Joe River as well as in the Spokane River where water flows out of CDA Lake. The water quality measurements are primarily of metals and nutrients. Water quality measurements from USGS date back to 1971, but the longest well-sampled periods date back to only 1990. There are 13 monitoring sites with sufficient data to be used in calculations of average concentrations and fluxes and to evaluate trends (shown
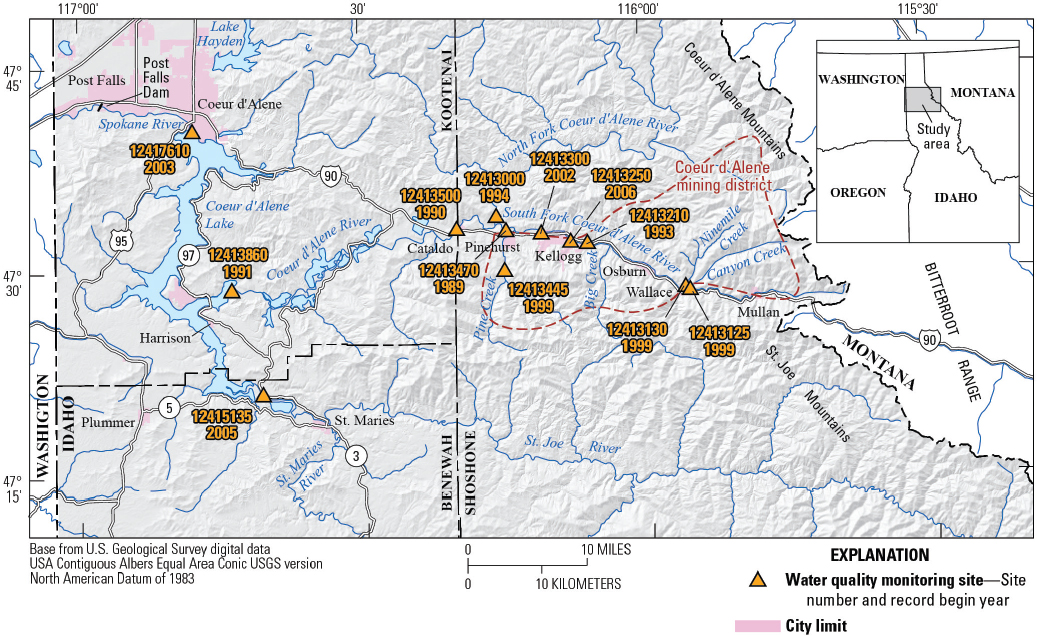
in Figure 2-3 and documented in Zinsser, 2020). Chapter 3 uses data from 6 of these 13 sites in its analysis (Site 12417610: Spokane River below lake outlet; Site 12413860: CDA River near Harrison; Site 12415135: St. Joe River at Ramsdell; Site 12413000: North Fork CDA River at Enaville; Site 12413470: South Fork CDA River near Pinehurst; and Site 12413210: South Fork CDA River at Elizabeth Park).
Water quality samples follow standardized collection methods and are isokinetic and width- and depth-integrated such that samples represent water quality across the entire river cross-section. USGS measures total and filtered metals, total and filtered nutrients, major cations, and suspended sediment concentrations. Samples are collected approximately five times per year during a variety of hydrologic conditions with an emphasis on high discharge events. All of these water quality monitoring sites are co-located at USGS stream gages, so there is a complete record of daily mean discharge available to accompany these water quality records. The discharge and water quality data are all available from the USGS (2020) National Water Information System (NWIS) web interface.
PUBLISHED SUMMARIES OF LONG-TERM MONITORING DATA
Agencies and consultants have regularly analyzed the data described above and produced results in reports and papers. IDEQ has regularly produced reports on CDA Lake status and trends in response to the 2009 Lake Management Plan. The most recent report, published in 2020, explored trends over the years 2015–2018 (IDEQ, 2020). Earlier such reports were produced in collaboration with the CDA Tribe, while the most recent report was produced by IDEQ independently. Most recently, in 2017 the Tribe produced a five-year synthesis of their water quality monitoring data from 2011 to 2015 (CDA Tribe and Avista, 2017). USGS produces both USGS reports and articles in the peer-reviewed literature. One recent example analyzing USGS river water quality data was Zinsser (2020), which analyzed trends in metals and nutrients from 1990 to 2018. Beyond its collaboration with USGS, EPA separately contracts with consultants to collect data in the upper basin to determine the effectiveness of the Superfund remedy.
DATA AVAILABILITY
Availability of long-term monitoring data to all interested parties is important for several reasons. There may be a wide range of scientists, regulators, and stakeholders who should have easy access to the relevant data. Given current data storage and data sharing capabilities, it should be possible for users to make requests for the data without needing assistance from the staff of the agencies that collected the data. Making the data widely and easily available could be of real benefit to all parties involved. Such a repository under the umbrella of the Lake Management Plan could be a constructive way to involve all stakeholders in developing a unified understanding of changes in the Lake into the future. When data are easily accessed, it becomes possible for more individuals and groups to analyze the data, develop new hypotheses, or test existing hypotheses. When these analyses are then published, it becomes possible for there to be an open debate about conclusions drawn, which, in the long run, will provide insights that can improve the strategies for future management of CDA Lake.
In addition, open sharing of datasets can be an important component of the quality assurance process. If multiple parties can view the data in a variety of ways, data that are likely to be in error may be recognized, and those who control the datasets can then evaluate the accuracy of data values and either delete or flag them. In short, the more a dataset is used, the more likely it is to improve over time. In the case of the Coeur d’Alene system, the river-related data (flow and chemistry) are stored in the USGS NWIS system (USGS, 2020), which has a national capability for visual examination of the data and direct download of the data in versions that are compatible with open source statistical software. For example, the R packages “dataRetrieval” (De Cicco et al., 2018) and “EGRET” (Hirsch and De Cicco, 2015) both provide simple automatic access to the USGS river system data.
There is no such system for the physical or chemical data that are routinely collected from CDA Lake; rather, data used by the Committee were provided by the two primary agencies (IDEQ and the CDA Tribe) as Excel spreadsheets. The spreadsheets of the two agencies were similar, but not identical, making it somewhat cumbersome to do unified consistent analyses across all of the sampling locations. Developing institutional arrangements and technical protocols to bring all data of a given type (e.g., lake chemistry data) into a unified data management and data sharing system is not a trivial matter, but experience in other systems has shown that the net result of the enhanced data transparency and delivery is worth the effort. One such example is the Non-Tidal Network for the Chesapeake Bay watershed, which includes data from 123 river monitoring sites sampled by 10 different agencies (see Box 2-1).
In addition to unified data availability, a system such as the Coeur d’Alene should have a process for regularly producing data synthesis products that make interpretations about the spatial and temporal characteristics of the data, with particular attention to trends. Such synthesis products should be based on data that are readily available to other scientists, as different researchers will have different approaches to data synthesis and there is strength in that diversity of approaches. The synergy generated by multiple approaches requires readily available data sets and publicly documented data analysis protocols.
***
The data generated by the long-term monitoring programs for the CDA watershed and CDA Lake form the basis for the analyses presented in the next three chapters. Those analyses revealed gaps and limitations in the monitoring program that form the basis of Chapter 8, which describes how the long-term monitoring programs for the CDA system can be improved.
REFERENCES
Chess, D. 2021. Water Quality Data Summary. Presentation to the NASEM Committee. February 26, 2021.
Coeur d’Alene Tribe and Avista Corporation. 2017. Coeur d’Alene Reservation Five-Year Synthesis 2011–2015 Monitoring Data 4(E) Condition No. 5 Spokane River Hydroelectric Project FERC Project No. 2545. February 2017.
Cooper, C. 2021. Coeur d’Alene Lake Management Plan Water Quality Data and Trends. Presentation to the NASEM Committee. February 26, 2021.
De Cicco, L. A., R. M. Hirsch, D. Lorenz, and W. D. Watkins. 2018. dataRetrieval: R packages for discovering and retrieving water data available from Federal hydrologic web services. doi:10.5066/P9X4L3GE.
EPA (U.S. Environmental Protection Agency). 1977. National Eutrophication Survey—Report on Coeur d’Alene Lake, Benewah and Kootenai Counties, Idaho, EPA Region X, Working Paper No. 778.
EPA. 2004. Basin Environmental Monitoring Plan, Bunker Hill Mining and Metallurgical Complex Operable Unit 3. Prepared by URS Group and CH2M Hill, for EPA Region 10, Seattle, WA.
Harty, J. M. 2007. Assessment Report on Prospects for Mediated Negotiation of a Lake Management Plan for Coeur d’Alene Lake. Harty Conflict Consulting & Mediation, Davis CA, prepared for U.S. Institute for Environmental Conflict Resolution.
Hirsch, R. M., and L. A. De Cicco. 2015. User guide to Exploration and Graphics for RivEr Trends (EGRET) and dataRetrieval: R Packages for Hydrologic Data (version 2.0, February 2015). U.S. Geological Survey Techniques and Methods Book 4, Chap. A10. doi:10.3133/tm4A10.
Horowitz, A. J., K. A. Elrick, and R. B. Cook. 1993. Effect of mining and related activities on the sediment trace element geochemistry of Lake Coeur d’Alene, Idaho, USA. Part I: surface sediments. Hydrol. Process. 7:403–423.
Horowitz, A. J., K. A. Elrick, J. A. Robbins, and R. B. Cook. 1995. Effect of mining related activities on the sediment trace element geochemistry of Lake Coeur d’Alene, Idaho. Part II—subsurface sediments. Hydrol. Process. 9:35–54. https://doi.org/10.1002/hyp.3360090105.
IDEQ (Idaho Department of Environmental Quality) and Coeur d’Alene Tribe. 2007. Quality Assurance Project Plan for Continued Monitoring of Water Quality Status and Trends in Coeur d’Alene Lake, Idaho. IDEQ, Coeur d’Alene, Idaho and CdA Tribe, Plummer, Idaho.
IDEQ and Coeur d’Alene Tribe. 2009. Coeur d’Alene Lake Management Plan. State of Idaho Department of Environmental Quality.
IDEQ. 2020. Coeur d’Alene Lake Management Plan: Coeur d’Alene Lake Status Update, 2015–2018. May 2020.
Kuwabara, J. S., B. R. Topping, P. F. Woods, J. L. Carter, and S. W. Hager. 2006. Interactive effects of dissolved zinc and orthophosphate on phytoplankton from Lake Coeur d’Alene, Idaho. U.S. Geological Survey Scientific Investigations Report 2006-5091. http://pubs.usgs.gov/sir/2006/5091.
Kuwabara, J. S., P. F. Woods, W. M. Berelson, L. S. Balistrieri, J. L. Carter, B. R. Topping and S. V. Fend. 2003. Importance of sediment-water interactions in Coeur d’Alene Lake, Idaho, USA: management implications. Environmental Management 32:348–359. https://doi.org/10.1007/s00267-003-0020-7.
Kuwabara, J. S., W. M. Berelson, L. S. Balistrieri, P. F. Woods, B. R. Topping, D. J. Steding, and D. P. Krabbenhoft. 2000. Benthic flux of metals and nutrients into the water column of Lake Coeur d’Alene, Idaho: Report of an August 1999 pilot study. U.S. Geological Survey Water-Resources Investigations Report 2000-4132. https://doi.org/10.3133/wri004132.
U.S. Geological Survey (USGS). 2020. National Water Information System (NWIS): U.S. Geological Survey, web interface, accessed January 2022. https://waterdata.usgs.gov/nwis.
Wood, M. S., and M. A. Beckwith. 2008. Coeur d’Alene Lake, Idaho: insights gained from limnological studies of 1991–92 and 2004–06. U.S. Geological Survey Scientific Report 2008-5168.
Woods, P. F., and M. A. Beckwith. 1997. Nutrient and trace-element enrichment of Coeur d’Alene Lake, Idaho. U.S. Geological Survey Water-Supply Paper 2485.
Zinsser, L. M. 2020. Trends in Concentrations, Loads, and Sources of Trace Metals and Nutrients in the Spokane River Watershed, Northern Idaho, Water Years 1990–2018. USGS Scientific Investigations Report 2020-5096. https://doi.org/10.3133/sir20205096.
Zinsser, L. M. 2021. U.S. Geological Survey Water-Quality Data and Analyses in the Spokane River Basin. Presentation to the NASEM Committee. February 16, 2021.
This page intentionally left blank.