
4
Framework for Evaluating Greenhouse Gas Emissions Information
In the previous chapters, we introduced the need for greenhouse gas (GHG) emissions information, described the types of information that are currently available, and evaluated the strengths and weaknesses of that information. In this chapter, we present a framework for evaluating GHG emissions information for decision making. The framework is comprised of a set of pillars, or criteria, that would ideally be met in order to provide the most useful and trustworthy information to decision makers. This chapter describes the six pillars, qualitatively discusses the current capability of each approach for quantifying GHG emissions (described in Chapter 2) to satisfy the pillars, and finally presents several case studies to provide examples of how the framework could be applied to existing GHG emissions information efforts.
In developing this framework and these pillars, the Committee seeks to initiate a discussion on the approach and criteria. One of the challenges in developing a framework for assessment is recognizing the many different scales, drivers, and intended uses for GHG emissions information. Another challenge is that, unlike weather forecasting, there is limited timely and easily available feedback on the quality and accuracy of GHG emissions information. The Committee has sought to develop pillars that are mutually exclusive and collectively exhaustive. The Committee does not propose a strict hierarchy but recognizes that successful GHG emissions information will be used, trusted, and of sufficient quality to be fit for purpose.
Pillars in Establishing a Greenhouse Gas Emissions Framework
The Committee has identified six criteria or “pillars” that form a framework to evaluate GHG emissions information. The pillars can be thought of as an ideal set of characteristics that GHG emissions information should have. These pillars are usability and timeliness, information transparency, evaluation and validation, completeness, inclusivity, and communication. Each pillar is described below.
The most useful and trustworthy information for decision makers will fulfill multiple or, potentially, all pillars. Some GHG emissions information may address some pillars only partially and some pillars not at all, which is often the result of a particular activity’s goals and constraints. Such
information can still be highly valuable but may need to be combined with other information to enhance its usability. The objective of the pillars is to provide decision makers with a framework to qualitatively assess GHG emissions information to meet their needs. These pillars are also intended to serve as a guide for designing more useful and trusted information.
Together, these pillars provide a framework for assessing GHG emissions information in the context of its intended purpose. This means that its intended purpose should be clearly described (information transparency) and communicated. Similarly, is the information usable and timely for its intended purpose? Does the quality, reliability, and accuracy of the information meet the needs of its intended purpose? The case studies considered at the end of this chapter illustrate this approach.
Usability and Timeliness
Usability means the GHG emissions information is relevant to decision makers and that the information can be incorporated into decision making with ease. Timeliness means the GHG emissions information is available on time scales relevant to decision making. This pillar ensures that investments and efforts in GHG emissions information system development are focused on the most relevant questions, usable by decision makers, and built in such a way that meets information needs as the policy environment changes. Usability also refers to the incorporation of decision-maker input—which may be extremely useful but also has to be protected from the possibility of being inherently political—into GHG emissions information systems such that the information developed responds to the true policy needs of decision makers and stakeholders. Timeliness also means information would be available with minimal lag time and regularly updated to be relevant to policy needs.
Usability and timeliness also mean that the approach is adoptable by other users and that GHG emissions information is comparable. Comparability of the GHG emissions information with other information includes (a) comparability within the GHG emissions information (e.g., among gases, sectors, time periods) and (b) comparability among the GHG emissions information derived from different estimation methods. Approaches to achieve comparability include standardization of units, clearly differentiating fluxes versus mixing ratios, clarifying scope(s) or system boundaries, and identifying the flux unit (e.g., per unit area in a grid or “asset”). Standardization of definitions would improve comparability to other studies, while differences in grid scales and temporal coverage may be barriers to comparability. Contextualization metrics could help to increase the usability and understandability of the information.
Information Transparency
Information transparency means that the data and methods used to produce GHG emissions information are publicly available and traceable. This includes the primary and key supporting data sources and the methods or models used, including definitions, version numbers, documentation, funding sources, and open access (i.e., freely available, not behind a paywall). This pillar is related to the concept of indirect reproducibility, which assesses “the transparency of available information to allow reproducibility,” and the underpinning standards of data transparency, analytic methods transparency, research materials transparency, and design and analysis transparency (NASEM, 2019). The Transparency and Openness Promotion (TOP) Guidelines developed for scientific publishing provide additional guidance on standards of transparency that could be adapted to GHG emissions information systems (Nosek et al., 2015).
The process and methods associated with source data collection and/or data transformation are also critical for information transparency. To be transparent, models, estimation procedures (e.g., conversion factors, statistical procedures, and algorithms), and analytical methods (including
calibration) should be well documented and freely available wherever possible. Documentation should include details about the system boundary or domain of the calculations, types of emissions included, and key assumptions of the approach. Information transparency is essential to allow users to assess data quality and accuracy (see also the evaluation and validation pillar).
Information transparency enables trust between information providers and users, contributing to political credibility and trust between agencies and actors. Information transparency is also essential for understanding GHG emissions information and its limitations, allowing results to be independently reproduced. Finally, information transparency contributes to reliability, credibility, consistency, comparability, and calibration by way of clarity in understanding how the information is generated. A clear understanding of data sources and methods also creates opportunities for verification of data and methods, intercomparisons of alternate approaches, and innovation and application of improved methods.
Evaluation and Validation
Evaluation and validation mean that the GHG emissions information and the data and methods used to create the information have been rigorously assessed to ensure they are reliable and of sufficient accuracy and quality for the intended purpose, with uncertainties quantified. We are using the terms “evaluation and validation” to broadly capture the concept of data quality because GHG emissions information systems often combine many different types and sources of data, each with their own quality standards, and use models and transformations to convert measured data to different temporal and spatial scales with implications for accuracy. This is especially important when working with GHG emissions from one or more sources that are not normally distributed in space and/or time.
Evaluation and validation should be performed by the creators of the GHG emissions information as well as by independent auditors, researchers, or users. The Committee uses the term evaluation to refer to the quantitative or qualitative examination of the quality, accuracy, and completeness of the GHG emissions information; review of the methodologies (including calibration); traceability of data used; consideration of the appropriateness of the approach; and documentation of potential errors, biases, and uncertainties. Evaluation should be quantitative where possible. If a quantitative evaluation is not possible, a qualitative evaluation can be conducted, rather than none at all.
Validation goes beyond evaluation, is highly quantitative, and typically involves comparison to independent datasets. Validation ensures the robustness of the information and the methods and data used to produce it. Steps include testing the reproducibility of the GHG emissions information and ensuring its accuracy by comparing it to independent information where possible. Ideally, the biases and uncertainties associated with the information are quantified and a more complete assessment of the limitations of the approach is provided. Successful validation of the information ensures reliability and readiness for applications.
Completeness
Completeness is a key principle in GHG emissions information development, supporting the comparison and verification of inventories with relevant guidelines or standards. Completeness means that the GHG emissions information for the geographic boundary covers all sources and sinks and all GHGs, similar to guidelines from the Intergovernmental Panel on Climate Change (IPCC, 2006, 2019a) and other organizations. Approaches as well as information and inputs to approaches should have comprehensive spatial and temporal coverage. All emissions sources, regardless of size (i.e., no pre-defined limit on the magnitude of sources), and one-time events along with routine emissions should be included. Consideration should be made for potential errors
generated when extrapolating from limited measurement campaigns to larger spatial or temporal scales to “complete” an inventory or using outdated information. There should be clear documentation of any sources that were absent, excluded, or not applicable. To achieve completeness, many different sources of information may be integrated.
Inclusivity
Inclusivity means that the GHG emissions information is generated by all relevant or applicable stakeholders, including decision makers, individual entities, locally-based experts, and the public. It considers who is involved in the creation of and covered by the GHG emissions information. Greater representation and participation would increase public understanding and trust in GHG emissions information. For example, current geographical gaps in information could be covered by satellites, airborne measurements, or even citizen science without the involvement of governments or scientists from those geographies. While this might meet scientific objectives of data coverage, it does not build support and capacity for sustained monitoring and could overlook local drivers of emissions. Similarly, while city-generated inventories may have differences from research-based inventories, the gap could be closed by capacity building and improved communication between local stakeholders and researchers.
In this context, inclusivity includes geographies and communities that have been historically underrepresented (e.g., the Global South and marginalized groups). Inclusivity also relates to participation through formal (e.g., official public comment mechanisms) and informal mechanisms. Broader public engagement can quickly help generate urgently needed data and information about emissions. Examples of public engagement include citizen science or data collection or monitoring by citizens. Deployment of innovative, low-cost sensor networks provides opportunities for broad participation in data collection, often providing some measurement data where there had been none (Kim et al., 2022b), and public review and comment allow citizens to engage in the development of plans and regulations. The more inclusive the approaches, the greater the trust can be in the process and outcomes.
Communication
Communication means that the GHG emissions information is effectively communicated to the public and decision makers. This communication goes beyond the information transparency pillar to consider the intended audience and “meet them where they are” in terms of communicating in accessible and understandable forms and formats the methodologies, assumptions, and their implications. To illustrate how this communication pillar complements the information transparency pillar, consider how scientific results can be published in journals or databases and fully meet the eight TOP Guidelines and yet not convey meaningful information to the public and decision makers. As another example, most people would not understand the meteorological information produced by weather services but do benefit from accessible and effectively communicated weather forecasts in the news and applications designed for the public.
Ways to effectively communicate GHG emissions information include websites that are simple to navigate, data that can be freely downloaded, data formats that are widely used (e.g., csv, json, xml), metadata that include units and other details, and documentation presented in several languages. Descriptions and supporting documentation should be provided in nontechnical language that is easy to understand. As discussed in the transparency pillar, special attention should be devoted to documenting open traceability of the underlying input/source data. Tutorials (including videos), the extensive use of visualizations, and short summaries (e.g., geographic or sectoral aggregation) of the datasets used and developed can provide useful information to nonexpert decision
makers. At the same time, communicating urgency can show why the inventory is important in policy considerations. Inclusivity requires data and results to be presented and communicated in a manner that a stakeholder or decision maker can reasonably assess and understand.
Framework for Evaluating Greenhouse Gas Emissions Information
The six pillars described above provide a set of criteria that can be used to qualitatively assess GHG emissions information. The framework is flexible and can be used across a range of applications and spatial scales. Assessment of GHG emissions information using the framework will depend on the user and the need that the user is trying to address; therefore, the outcome will vary, even for the same GHG emissions information. For example, a decision maker looking to create the most effective new policies to reduce GHG emissions might need information that scores high on completeness, transparency, and communication. A decision maker looking for the most reliable assessment of the effectiveness of policy actions on a particular GHG and sector might rather emphasize usability and timeliness, evaluation and validation, and inclusivity. Various decision makers and independent bodies can apply the framework and prioritize the pillars to assess which information best suits their needs to inform the decision-making process.
To provide a high-level overview of current GHG emissions information, the Committee attempts to summarize here how the current capabilities of the general approaches perform relative to the pillars, drawing on the background introduced in Chapters 2 and 3. For each approach (activity-based, atmospheric-based, and hybrid), we evaluate below the general performance of typical current applications for both their methods and data with respect to each pillar with qualitative descriptions and scores. Methods refer to the calculations and mathematical methodologies. Data capture both the input data (e.g., activity data, emissions factors, etc.) and the resulting emissions estimates.
In applying the framework generally to each approach, we considered a broad range of users, including national decision makers, regional/local decision makers, corporate entities, various GHG emissions information creators, researchers, and the public. The needs of the users or the applications for the GHG emissions information similarly span a large range including policy design, policy compliance, and research. In our description of the performance of each approach against the pillars, we include some consideration of different users and user needs.
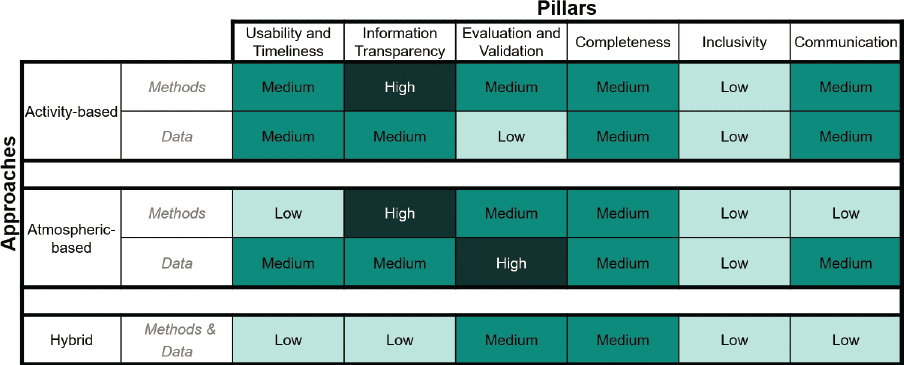
Figure 4-1 presents the Committee’s indicative mapping of the general approaches for developing GHG emissions information described in Chapter 2 to qualitatively score for each pillar. While it is difficult to assign a score when complex and varied analyses and datasets exist for each approach, the Committee sees value in applying the framework and mapping the key strengths and weaknesses to the pillar framework. Three different qualitative scores are used to assess the general ability of the approaches to satisfy the pillars. A high score indicates that the existing approach can consistently address the pillar criteria. A low score indicates the criteria related to that pillar are not usually well addressed. A medium score indicates that the approach ranks high in some instances but ranks low in others.
These evaluations are derived from the Committees’ expert knowledge and judgment, rather than through a detailed and exhaustive evaluation of a large number of programs and projects. We recognize the limitation of this strategy, but we believe there is value in making a qualitative assessment of how different methods and approaches perform relative to the pillars in order to inform key areas for improvement and additional effort. Readers should also note that we use the activity-based, atmospheric-based, and hybrid approaches in our grouping of GHG emissions information, but other aspects such as spatial scale, actors, and potential user communities are important to consider and these are also addressed in the evaluation. For activity-based approaches, we focus the scoring on national to global scale applications as outlined in the Statement of Task, recognizing
that many subnational activities may have different general characteristics, which we note in the description in some cases. For atmospheric-based and hybrid approaches we consider the state of the art more broadly in the scoring.
While we identify that each general approach has typical strengths and weaknesses when viewed against this framework, the performance of any specific GHG emissions information may differ from these broad categorizations when considering the specific design, implementation, and objectives of the effort and when considering a specific user. To illustrate this specificity and how the framework can be used to evaluate an individual application, example case studies in the following section illustrate how the pillars can be used as tools to evaluate specific efforts.
Activity-Based Approaches
Usability and timeliness [Methods: Medium, Data: Medium]:
Activity-based methods and data are ranked medium in usability and timeliness. Like most of the scoring for the activity-based approach, the volume and diversity of existing activity-based GHG information make single assignments challenging as there are exceptions in most cases.
Numerous activity-based inventory efforts have been under way for decades with new additions in recent years. Though they use different methods, they share similar barriers to methodological usability. National inventory reporting as part of the United Nations Framework Convention on Climate Change (UNFCCC) process was developed to directly assist the policy-making process and relies on guidelines and methods outlined by the IPCC (IPCC, 2006). Numerous inventories developed within the academic and research community rely on the general methodological guidance of the IPCC but often develop additional, specific methodologies for particular questions of interest. All inventories publish accessible methodologies (of varying thoroughness) but in forms and mediums often requiring expert knowledge. Furthermore, because many inventories were not initially targeted at the decision-making community, methods and methodological descriptions are not always useful to decision makers where simple emission metrics, cross-comparability, and space/time resolutions are focused on governance and/or land-use boundaries. There is a lack of
standardization of core methodological elements such as units, system boundaries, and geographic boundaries that would enable comparability across products. The development of inventories with higher information granularity is often time and labor intensive and, unlike national inventories, they may not be updated to regularly reflect updated activity data. Therefore, the use of the activity-based approach has typically been limited to a small, technical community because of its complexity and highly technical language.
The timeliness of the methods and data has undergone significant change in the last few years with the pressure placed on inventories to respond to the COVID-19 pandemic with more updated information (Le Quéré et al., 2020). Indeed, some global GHG inventories are producing GHG information with latencies of a few months (e.g., Dou et al., 2022; Forster et al., 2020; Jackson et al., 2022; Liu et al., 2020b), though they may not be as robust or as complete, and lack thorough evaluation (Oda et al., 2021). This pertains to data inputs or outputs and methodological documentation. However, the majority of activity-based GHG inventories have latencies of 2 to 3 years, often driven by the latency of data sources (e.g., updated activity data) which take time to produce and perform quality assurance and quality control.
We rank the usability of the activity-based data as medium. Activity-based GHG emissions information is often the primary data source used by decision makers, including the UNFCCC, national and subnational policy makers, corporations, and the public. However, the usability of activity-based GHG emissions information can be limited—depending on the application—by latency, GHG species coverage, a lack of spatial and temporal information that may be required by stakeholders, and comparable units and definitions. For example, 121 countries have signed the Global Methane Pledge which aims to reduce global methane emissions by at least 30 percent from 2020 levels by 2030 with a potential of reducing 0.2°C warming by 2050.1 Yet, methane emissions data remain uncertain or missing from some UNFCCC national submissions, which in turn impacts policy and scientific goals, and the ability to verify progress. In this light, it is notable that signatories to the Global Methane Pledge also “commit to moving towards using the highest tier IPCC good practice inventory methodologies, as well as working to continuously improve the accuracy, transparency, consistency, comparability, and completeness of national greenhouse gas inventory reporting under the UNFCCC and Paris Agreement, and to provide greater transparency in key sectors.”
Information transparency [Methods: High, Data: Medium]:
Global/national GHG inventories typically have well-defined, transparent, and documented methodologies, such as those following the IPCC guidelines (IPCC, 2006) or the detailed documentation found in nearly every global inventory produced within the research community. It is worth noting that at smaller scales (e.g., urban, facility, corporate), methodologies are often not fully reported. Nevertheless, for the global GHG emissions information efforts, methodological transparency is scored as high.
Regarding input data, some global/national data sources are publicly available but many are not, even if they are clearly identified (e.g., energy data). This is particularly important for the energy-related emissions which rely on a common, small set of national energy datasets. The emissions estimates that are produced by global inventory efforts are generally available and easy to access for global/national datasets (e.g., national reports for the UNFCCC; emission estimates based on primary energy data sources from the International Energy Agency or BP; compiled emissions datasets, for example, Open-source Data Inventory for Anthropogenic CO2 or the Global Carbon Project), but they can be in a wide variety of formats (see communication discussion). Overall, transparency in data and methods tends to be higher for global and national information but lower for facility- or city-scale information, and global aggregates of these. We scored the information
___________________
1 https://www.globalmethanepledge.org/. As of Sept 1, 2022.
transparency for activity-based data as medium, given the current mix of transparency for input versus data outputs.
Evaluation and validation [Methods: Medium, Data: Low]:
Of the activity-based inventories described in Chapter 2, the UNFCCC GHG information methodology undergoes a unique codified administrative evaluation (e.g., auditing the adherence to IPCC guidelines). Similar efforts are in place for the global aggregation of facility-scale information. However, for all global inventories, methodological evaluation such as comparisons of multiple methods, cross-checks of overlapping data, and documentation of potential errors and biases exists in some cases but is generally limited. Therefore, we scored the evaluation and validation for activity-based methods as medium. Evaluation and validation of input data and data products is similarly limited though there has been increasing work on activity-based intercomparisons (Han et al., 2021; Hutchins et al., 2017; Oda et al., 2018) and cross-approach intercomparisons (Deng et al., 2022). Such efforts provide important near-term steps toward evaluation, particularly if results are traced to methods or input data and recommendations for future improvements are made. Nevertheless, comparison to independent data and assignment of numerical uncertainty are not consistently performed (with some recent exceptions) and these are key goals in evaluation and validation of GHG emissions estimates. As a result, we scored the evaluation and validation for activity-based data as low.
Completeness [Methods: Medium, Data: Medium]:
Completeness of activity-based methods refers to methodologies that are designed to trace all GHGs and all emission sources and sinks, capture one-time events along with routine emissions, and include emissions of all magnitudes. Activity-based methods often include major gases and sources as part of the methodological intent, although this varies. For example, many global inventories are focused on carbon dioxide (CO2) only while others methodologically tackle all gases, even if data support is limited in the production of estimates. Furthermore, there is variation in methodological completeness across sectors or data sources. Inventories can mix algorithmic thoroughness by using new or novel methods to estimate particular emitting source categories but inherit results from separate inventories for others. There can also be gaps in methods, such as from the use of a minimum threshold for the magnitude of sources included in an inventory and the inability to capture nonroutine emissions. Many of the research community’s activity-based estimates are not regularly updated and thus do not provide temporally completed emission estimates.
As with the methodological limits, the input and output content of global inventories varies widely from single gases or sectors, often estimated with considerable detail and thoroughness, to more comprehensive efforts. Input data sources are often “sole source,” not availing of the potential for overlapping data sources or data constraints that exist at more than one space or time scale. Exceptions exist where multiple sources of overlapping data are employed in emissions estimation. Completeness may not be achieved when limited measurement campaigns are extrapolated for broader applications. Overall, we scored the completeness for activity-based methods and data as medium.
Inclusivity [Methods: Low, Data: Low]:
Methodological development (including calibration procedures) and input and output information are typically built and gathered by experts. It is worth noting that at local scales, where interaction and communication are potentially easier, there may be more collaboration on methods and data with users and stakeholders. However, at the global/national scale, public interaction and comment opportunities could engage a wider array of participants than is current practice. The UNFCCC process is an exception to this as it does involve large amounts of interaction with the international negotiating community directly and indirectly insofar as they represent a wider collection of interests. However, there remains considerable untapped potential to increase inclusivity via stakeholder engagement, citizen science efforts, and iterative surveys and outreach efforts. The limitations in inclusivity relate directly to the usability and timeli-
ness pillar in that more and earlier interaction with the user community can better inform aspects of usability currently missed in the existing information domain.
Communication [Methods: Medium, Data: Medium]:
Communication of activity-based methods and data spans a wide range. Global/national GHG inventory methods are typically communicated to the target decision-maker communities, though communication to decision makers at smaller scales is not emphasized. For example, UNFCCC inventory information is often further collected and summarized by the nongovernmental organization community to enhance understanding and use by both international decision makers and other communities such as the media, citizen organizations, and the business community. Some of the research-based inventories develop websites and other communication platforms, but these are more often targeted to expert audiences. Exceptions include some programs that have created effective, easy-to-understand descriptions and infographics for decision makers and the public. In general, methodological communication remains limited and not well suited to the decision-making community. Methodological communication along with the inclusivity and evaluation and validation pillars are critical elements in building the trust of information outputs. Hence, both the methodological and data communication is scored as medium, reflecting the wide variation in both communication focus and quality.
Atmospheric-Based Approaches
Usability and timeliness [Methods: Low, Data: Medium]:
Usability and timeliness in atmospheric-based approaches can vary. Often, due to the complexity of the methods and results, coarseness of the emissions estimates, and lack of specific attribution of emissions sectors, the usability of atmospheric-based methods and data can be low. On the other hand, the data from some approaches are highly usable, such as estimates of point-source emissions. Timeliness varies, as some global-scale methods require emissions estimates as well as meteorological data and measurements that have a time lag of years. In more recent work, researchers have sought to provide timelier analysis, though time lags of at least a year or two are still typical and may be longer for some regions. Some collaborative efforts have sought to improve the usability of the data from atmospheric-based approaches by improved communication between policy makers and researchers (e.g., European Union’s [EU’s] VERIFY project (Peylin, 2022), National Aeronautics and Space Administration’s Carbon Monitoring System [Hurtt et al., 2022]). Some collaborative efforts between researchers and policy makers exist, such as work in the states of Colorado and California and U.S. Environmental Protection Agency (EPA) collaborations with the research community (Duren et al., 2019; Fischer et al., 2020; Graven et al. 2018). Often the conclusions of the studies, rather than the specific numerical estimates of emissions—particularly after the synthesis of consistent findings by multiple studies—can be highly usable by decision makers. For example, multiple studies showing the presence of methane “super-emitters” and consistently higher natural gas leak rates from certain infrastructures compared to standard emission factor approaches (Alvarez et al., 2018) have helped to direct government and corporate priorities for methane mitigation actions in the oil and gas sector. Overall, we scored the methods as low and data as medium for usability and timeliness.
Information transparency [Methods: High, Data: Medium]:
Atmospheric-based methods are generally well documented in the academic literature and public websites. For this reason, we rank the transparency of atmospheric-based methods as high, although we note that costs to access some academic sources may be a barrier in some cases. The complexity of some methods may also present a barrier to usability as described above. The input data and derived emissions estimates or flux estimates are described in the peer-reviewed literature in nearly all cases, but the numerical input data and estimates are not always provided, so we ranked information transparency for data
as medium. Recently, many journals have instituted requirements for accessibility of input data, results, and model code, further improving accessibility and reproducibility.
Evaluation and validation [Methods: Medium, Data: High]:
A strong point of atmospheric-based approaches is that evaluation and validation of some aspects of measurement methodologies are well integrated with the technique and are supported by peer-reviewed descriptions. However, other aspects of the methodology are difficult to evaluate, including model transport uncertainty. For data and results of atmospheric-based approaches, there is generally validation and a quantitative assessment of uncertainty. Observations are typically calibrated and reported following standard practices (see Box 2-5). There are also activities regularly comparing and synthesizing different atmospheric-based results (e.g., TransCom-CH4, Global Methane Budget), which further support the evaluation and validation of the data. As a result, we rank atmospheric-based methods as medium (primarily due to the models used to convert measurements to emissions) and data as high for evaluation and validation.
Completeness [Methods: Medium, Data: Medium]:
Atmospheric-based approaches are typically comprehensive, as all sources and sinks are captured by the nature of atmospheric measurements that integrate fluxes. However, attributing GHG sources or sinks to specific sectors is a difficult task, so information is often complete in terms of total fluxes but incomplete in terms of specifying source sectors. Alternately, assumptions about the distributions or magnitudes of some sources can lead to biases in the resulting GHG source or sink estimates. The use of tracers to attribute sources is important for enhancing this type of completeness. Atmospheric analyses are frequently focused on single gases; multigas analysis is less common. Spatial and temporal coverage varies, as some information is based on limited measurement campaigns in specific regions while others are global. The spatial and temporal resolution can be coarse, with average emissions over regions and months or years commonly reported. Some techniques have a high temporal resolution in a fixed location (e.g., plume detection, eddy covariance). Therefore, we rank the atmospheric-based methods and data completeness as medium, given that they sense all sources, but frequently with only single-gas analysis, limits on spatial and temporal information, and difficulty separating sources and sinks.
Inclusivity [Methods: Low, Data: Low]:
The inclusivity of atmospheric-based methods and data is typically low, with little input from stakeholders on the methodology and data collection. Method development, atmospheric measurements, and data analysis are primarily performed by a small, technical community. In some regional and local work, there may be more collaboration with some measurements collected by corporations, local agencies, or citizens with engagement between technical experts and decision makers (see communication discussion below). Nevertheless, we ranked both methods and data low for the inclusivity pillar as these practices are more exceptional than standard.
Communication [Methods: Low, Data: Medium]:
Method communication is typically low for atmospheric-based approaches, as the primary venue for the presentation and discussion of this work is in scientific literature and specialized conferences, and thus not communicated widely. While methods are documented, they are typically in technical language and are quite complex. Communication of results can vary. The data and results from these approaches are often reported in scientific publications and technical conferences, although some efforts have been effectively communicated to decision makers and have had strong impacts on policies or corporate activities (e.g., natural gas leaks, the Kigali Amendment, CFC-11 detection). Sometimes efforts to communicate with decision makers and the public through the media, such as when journalists present a new finding, can be very effective. As mentioned in the usability discussion above, some efforts have aimed to improve usability via collaboration between scientists and decision makers, which also helps in the communication of atmospheric-based efforts to users. In light of this, we ranked the communication of atmospheric-based methods as low and data as medium.
Hybrid Approaches
Hybrid approaches that integrate different approaches and methodologies, potentially using advanced computational tools, are advancing and developing rapidly. They have the potential to capitalize on the different strengths and compensate for weaknesses of individual approaches, as well as innovate new approaches. While doing so, it may be a challenge for hybrid approaches to ensure the pillars of transparency, inclusivity, communication, and usability are addressed.
The methods and data of the hybrid approach are closely entwined, so we ranked the combined methods and data against the pillars.
Usability and timeliness [Low]:
Usability and timeliness is currently ranked low, although there is potential for excellent performance against this pillar with the hybrid approach. The low ranking is driven by the fact that this work is still in development in a small community of experts, and the demonstration of relevance and usability by decision makers is not well established. The hybrid approach has the potential to provide timely data and, if developed with attention to standardization of definitions and units and the key needs of decision makers, it could score very well against this pillar.
Information transparency [Low]:
We scored the hybrid approach as low for information transparency. It has many of the characteristics of the atmospheric-based approach, with complex methods, the need for expert knowledge, and some limits of access to information with paywalls and unreleased data and methodologies that are not always well documented. For example, a lack of transparency generally exists in the private-sector development of hybrid approaches, which may combine machine learning and other digital data collection technologies and are not peer reviewed or open source.
Evaluation and validation [Medium]:
Evaluation and validation is ranked medium, as the hybrid approach should include evaluation and validation as part of the development and peer review of the methods. However, some aspects of the approach may be difficult to evaluate. Data products may be compared to other results, although not all products have independent evaluation.
Completeness [Medium]:
Completeness is ranked as medium. The integration of data, potentially including atmospheric measurement data, activity data, and ancillary information, aims to provide a robust and complete picture, with the potential to rank high. However, it may be challenging to address all gases and sectors with a high degree of data coverage and data constraints. The hybrid approach may have limitations in the separation of sectors but is likely less limited than atmospheric-based approaches.
Inclusivity [Low]:
Inclusivity is scored as low, as this work is currently conducted by a small group of experts with methods that are not uniformly disseminated widely.
Communication [Low]:
As with usability and timeliness, communication is ranked as low for the current generation of hybrid approaches, given the limited dissemination of results and details. So far, much of this information is in conference proceedings, technical journals, or hard-to-access reports. On the other hand, some emerging hybrid approaches could address these pillars well at the outset by creating open-source software, publicly available datasets, community engagement, and web-based tools.
Case Studies Applying the Framework
The six case studies that follow provide examples of activity-based, atmospheric-based, and hybrid approaches for quantifying GHG emissions across a range of scales. Each case study is qualitatively evaluated against the six pillars described above and areas for improvement are identified. The evaluation relative to the pillars is done with multiple users in mind, and we seek to indicate where the pillars are met for one community (e.g., researchers) but not another. These
case studies demonstrate how the framework could be used to evaluate current efforts and identify their strengths and weaknesses.
Case studies were selected to illustrate the range of approaches outlined in this report, including the improvements to the well-established activity-based approach of the UNFCCC in the Enhanced Transparency Framework (ETF), an atmospheric-measurement-driven effort (Permian Methane Analysis Project), and several mixed or hybrid approaches. We sought to examine projects that used a range of approaches and that also exist in different communities—the policy world, research community, cross-community efforts—and across a range of scales. The set of case studies is only a small sample of current activities, but they provide a glimpse into the wide range of existing efforts and demonstrate how the framework can be applied to evaluate specific GHG emissions information. From these case studies, we see that innovation in atmospheric-based and hybrid approaches can improve traditional activity-based approaches and support target-based mitigation strategies.
4.1 UNFCCC Enhanced Transparency Framework
In this case study, we consider the ETF, established by the 2015 Paris Agreement, for country-level reporting to the UNFCCC. The ETF includes requirements for both developed and developing countries to report on various climate-related actions, implementation, and support (UNFCCC, 2021b). As part of the ETF, all Parties are required to report, on a biennial basis, a national GHG inventory according to the IPCC 2006 guidelines and report on progress made in implementing and achieving their nationally determined contributions (NDCs) (UNFCCC, 2015, Article 13). The GHG emissions inventories are to be reported electronically using the common reporting tables. These reporting requirements are one of the few legally binding commitments for both developed and developing Parties in the Paris Agreement (Weikmans and Gupta, 2021). Both groups of countries are required as part of their Biennial Transparency Reports to include a GHG emissions inventory, following the same requirements in the modalities, procedures, and guidelines, with some specific flexibility given to those developing countries who need it in light of their capacity. The first Biennial Transparency Reports are due at the end of 2024, with some discretion in timing for Small Island Developing States and Least Developed Countries. To meet current requirements under the Convention, developed countries must also continue to report an annual GHG inventory in years in which a Biennial Transparency Report is not due. Recognizing the various capacities of developing countries, the Global Environment Facility and the UNFCCC’s Consultative Group of Experts provide support for developing inventories (UNFCCC, 2020).
In the evaluation below (see also Figure 4-2), we consider users of the national reports and inventories from the ETF to be national decision makers as well as other users such as researchers or the public.
Usability and timeliness [Medium]:
For the UNFCCC user community, usability and timeliness is high because reporting is standardized, approved, and used at the international level. For other users, including the research community and corporations, usability and timeliness of data is lower, as the 2024 reporting will cover emissions from 2022 employing 2006 IPCC guidelines which may not include updated findings, and the information or information formats may not be optimal for their uses. Therefore, usability and timeliness is scored medium.
Information transparency [High]:
The new provisions under the ETF place a greater emphasis on reporting as the key mechanism of the Paris Agreement’s “pledge and review” approach where the rules of the Paris framework are envisioned to make countries’ actions transparent and to hold countries accountable to their NDCs (Gupta and van Asselt, 2019). Countries are required to report according to the documented IPCC 2006 guidelines. If countries all report and meet the
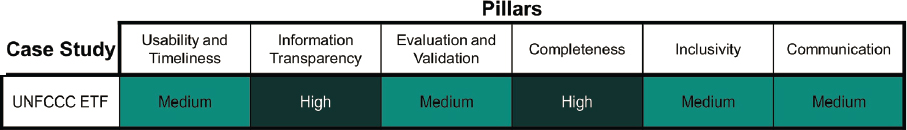
requirements, transparency should be high. However, this is currently not true for all countries, so transparency will depend on the extent to which countries adhere to the 2006 guidelines.
Evaluation and validation [Medium]:
Under the ETF, all countries are subject to a review of their GHG inventory by an expert review team who will publish a report of their findings on the UNFCCC website. All members of the review team must take and pass a training course to be certified to conduct the review. Under the modalities, procedures, and guidelines, Parties are encouraged, but not required, to undergo a separate peer review. Other opportunities for evaluation and validation, such as comparison to independent information and estimation of uncertainties, are likely to be done by only a few countries. The use of Tier 1 methods and generic or out-of-date emission factors may reduce the accuracy of the resulting estimates. Therefore, evaluation and validation is scored medium.
Completeness [High]:
The ETF is likely to score highly for completeness since countries will follow the IPCC 2006 guidelines. However, the guidelines allow for flexibility in the level of detail in national GHG inventories, including the scope of the inventory’s sectors and gases, among other dimensions (Goodwin and Kizzier, 2018). Therefore, some countries’ reporting may be low or medium for completeness.
Inclusivity [Medium]:
Inventory development and reporting will be inclusive at an international level as it will be conducted by all nations that are Parties to the Paris Agreement. However, nation-level reporting will be done at the political level and may not include all stakeholders. The process typically remains limited to a small group of technical experts, with little community engagement. Some developing countries have limited experience with the common reporting tables and may need capacity building (Falduto and Wartmann, 2021). Furthermore, underlying activity-based information may not be globally representative; for example, the IPCC Emission Factor Database was created using data from Organisation for Economic Co-operation and Development countries. Therefore, inclusivity is scored as medium.
Communication [Medium]:
The inventories that the Parties report to the UNFCCC and the common reporting tables will be available for download on the UNFCCC website. This will provide a uniform and familiar interface for people engaged in the UNFCCC process. For the general public and research communities, there is very limited effective, accessible, and understandable information provided by the UNFCCC directly. As a result, communication is ranked as medium.
4.2 Research Community’s Estimate of China’s National Emissions Based on Activity Data
This case study considers the work of Shan et al. (2020) as an academic research study to estimate China’s national GHG emissions using an activity-based approach at a finer level of detail than is available from the official UNFCCC reporting. In China, GHG emissions inventory information has been officially reported in its National Communications and Biennial Update Reports for 1994 (NDRC, 2004), 2005 (NDRC, 2012), 2010 (NDRC, 2019b), 2012 (NDRC, 2016), and 2014 (NDRC, 2019a). Since these reports have been released sporadically and lack detail and access to the underlying raw data, transparency is low. Shan et al. (2020) sought to assemble a detailed and
transparent CO2 emissions inventory for China for fossil fuel and cement production, in which more country- and region-specific information was used than global inventory estimates for China such as EDGAR (Emissions Database for Global Atmospheric Research) and CDIAC (Carbon Dioxide Information Analysis Center).
Parallel efforts in the government and the research community to estimate GHG emissions occurs not just in China, but is widespread in many developed as well as developing countries (see Case Study 4.4 below for another example). The work in China by Shan et al. (2020) is a particularly interesting case study because China is presently the largest contributor to global GHG emissions and prior work has revealed discrepancies of ~18 percent in GHG emissions calculated with different sources of activity data or emission factors, including national versus provincial level activity data and coal characteristics (Guan et al., 2012).
Shan et al. (2020) used national and provincial inventories and emissions factors from Shan et al. (2018) and Liu et al. (2015). In comparison to Guan et al. (2012), Shan et al. (2020) found that the activity data have improved over time, although both the activity data and emissions factors are important contributors to uncertainty. They applied the IPCC’s recommended Monte Carlo technique to estimate uncertainties on the overall emissions inventory and they report an uncertainty range for energy-related emissions of –15 percent to +30 percent at 97.5 percent confidence for 2016–2017. To create a transparent and verifiable dataset, the authors published the activity data, emission factors, and calculation code with the inventories (Shan et al., 2020). The Shan et al. (2020) study highlights how efforts in the research community can evolve rapidly, in parallel with ongoing reporting within the UNFCCC framework, and offers additional insights into the contributors to and trends in uncertainty. These research efforts provide access to valuable underlying datasets and produce inventories that can be important inputs to other analyses, including atmospheric-based studies.
In the evaluation below (see also Figure 4-3), we consider GHG emissions information available from the Shan et al. (2020) study and users of the information to include national decision makers, researchers, and the public.
Usability and timeliness [Medium]:
The data are in a structure that is likely to be very usable to national decision makers and researchers, using the 47 sectors that are in the Chinese energy statistics system. The units are clearly identified, and the data have been compared to other estimates. However, specific data products or descriptions of results that are aimed toward policy makers or the public have not been created or disseminated. Broader usability may be limited by the use of sectors that may not align with the IPCC sectors. The Shan et al. (2020) paper reports 2016 and 2017 emissions, a time lag that is important in a place with rapidly changing emissions and industries. Timeliness could be improved to enhance usability by decision makers and the public. Considering all these factors, a score of medium is given for usability and timeliness.
Information transparency [High]:
Data and methods from the study are documented and freely available online, after user registration. However, it is important that data access is maintained over time as some data from individual research studies such as this may become inaccessible if not deposited into a reliable data center. Therefore, transparency is rated high.
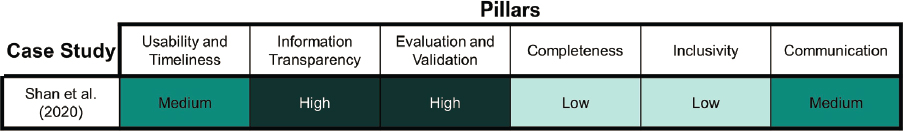
Evaluation and validation [High]:
The peer-reviewed papers provide a comparison of their datasets with a wide range of other inventories to validate the findings. The authors evaluated the data sources, applicability of emission factors, documented potential errors, and calculated uncertainties. Overall, this effort is ranked as high for evaluation and validation but could be improved further with comparison to independent data, including atmospheric GHG data.
Completeness [Low]:
Only CO2 emissions for certain sectors are estimated without estimating other GHGs or sectors, so completeness is ranked low.
Inclusivity [Low]:
Inclusivity is ranked low since this work was conducted by a small group of researchers and did not appear to engage with individual entities, locally based experts, or the public.
Communication [Medium]:
The data are downloadable and are in a widely used format (csv), but are likely to reach a small audience already familiar with such inventories in the research community. The descriptions of the data and methods are provided in an academic research paper, which are not likely to be easily discoverable or understood by decision makers or the public. There is no identified communication to the public and policy makers.
4.3 Urban Hybrid Approach: INFLUX
In this case study, we consider the development and use of a hybrid approach for estimating GHG emissions on an urban scale: the Indianapolis Flux Experiment (INFLUX) in the U.S. city of Indianapolis (Davis et al., 2017; Whetstone, 2018). Though not a global study, it offers a series of helpful clarifications of the framework in an experiment that has scaling potential in the future. Numerous academic institutions, researchers, and federal science agencies combined efforts to integrate state-of-the-art activity-based GHG estimation with atmospheric-based approaches. Initiated in 2010, INFLUX encompassed high-resolution (i.e., building, street-segment scale) activity-based estimation of fossil fuel CO2 emissions (the Hestia Project), atmospheric mixing ratio measurements of carbon monoxide (CO), methane, and CO2 at the surface (mobile and stationary), atmospheric 14CO2 measurements at surface locations, aircraft measurements of CO2 and methane fluxes, and upward-looking Total Carbon Column Observing Network column CO2 measurements (Davis et al., 2017; Turnbull et al., 2019; Whetstone, 2018). To support atmospheric inverse modeling, state-of-the-art Eulerian/Lagrangian transport models supported by a suite of new meteorological measurements were deployed (Lauvaux et al., 2016).
The initial aim of INFLUX was to better understand the many methodological challenges and uncertainties associated with activity-based and atmospheric-based approaches to estimating CO2 and methane emissions at urban scales. Additionally, INFLUX has progressed the furthest toward a hybrid framework through simple iteration and adjustments between the activity- and atmospheric-based approaches and combined different atmospheric-based techniques (tracer-tracer, eddy-flux, mass balance, inverse methods) to inform, for example, sector partitioning (Nathan et al., 2018; Turnbull et al., 2019; Wu et al., 2022). The experiment has significantly advanced knowledge on the more complete integration of approaches with numerous papers examining aspects of the modeling and measurements in addition to a direct comparison to the practitioner-based estimate made by the city (Mueller et al., 2021). While the initial aim was to explore methodological advances, it has shown surprisingly close convergence between the state-of-the-art atmospheric- and activity-based estimation with agreement within 3 percent over a multiyear timeframe (Lauvaux et al., 2020).
Though not necessarily the intention of INFLUX, it offers an example of a scientifically rich study that has provided GHG emissions information to the scientific community but has not devoted necessary resource investment toward transforming the GHG emissions information into forms usable by decision makers or incorporated stakeholders into the initial design and approaches to the research.
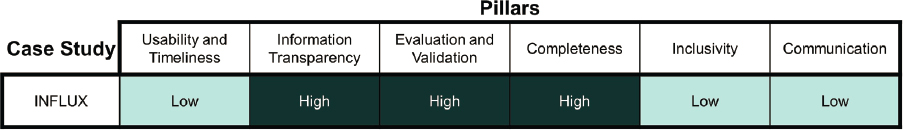
In the evaluation below (see also Figure 4-4), we consider GHG emissions information available from both the activity-based effort (the Hestia Project) and the atmospheric-based effort described and cited in Whetstone (2018) and Davis et al. (2017) as it related to users of the information including local decision makers, researchers, and the public.
Usability and timeliness [Low]:
The methods, data, and findings of INFLUX are highly usable by the research community. However, specific data products or descriptions that are aimed toward policy makers or the public have not been created or disseminated in ways that encourage uptake. The results have not been used by or institutionally embedded in any of the decision-maker communities. Timeliness is low, as the experiment does not produce emissions estimates regularly but is primarily associated with analysis papers. However, it is worth noting that data associated with atmospheric observations are maintained with little latency. To improve usability, engagement with local policy makers and the public from the beginning of the project would have ensured the research addressed key questions and communicated results in useful and timely ways. Considering these factors, usability and timeliness is rated low, since the only group that can (so far) use the outcomes of the studies is the research community.
Information transparency [High]:
As with the Shan et al. (2020) study in the previous section, the data and methods from the INFLUX study are documented and freely available online (e.g., Gurney et al., 2012; Heimburger et al., 2017; Miles et al., 2017). Therefore, transparency is rated high.
Evaluation and validation [High]:
As the primary aim of INFLUX was the development and evaluation of urban-scale GHG estimation by various techniques, there has been extensive comparison of multiple approaches, as well as overlapping data, sensitivity studies, and uncertainty estimation (e.g., Deng et al., 2017). INFLUX exemplifies a very extensive implementation of evaluation and validation that is unlikely to be feasible in many cases. Therefore, evaluation and validation ranks high.
Completeness [High]:
INFLUX produced estimates of anthropogenic CO2 and methane emissions (and natural fluxes of CO2). It considered all sectors without implementing thresholds or omitting nonroutine emissions. The analysis encompassed several years of measurement and estimation. Since CO2 and methane are responsible for the vast majority of emissions in Indianapolis, an overall ranking of high is given here, while completeness could be improved further by consideration of additional GHGs or extending the system boundaries to Scope 2 or even Scope 3 emissions.
Inclusivity [Low]:
INFLUX was conducted by a group of technical experts and researchers. There was limited engagement with practitioners and citizens in the city (e.g., local utility data were acquired), so inclusivity is rated low. Engagement with local policy makers and the public from the beginning of the project would have ensured that local knowledge was incorporated and potentially incorporated citizen science to broaden the measurement campaigns even further.
Communication [Low]:
Data are publicly available but not in forms that are easily used or understood by local practitioners, policy makers, or the public. Key findings have been discussed within the research community and presented in academic research papers, but results in nontechnical language have not been disseminated.
4.4 Methane Emissions Estimates from the U.S. Oil and Gas Supply Chain
In this case study, we consider the estimation of methane emissions from U.S. oil and gas facilities using different approaches. The motivation for including this case study is the increasing evidence from multiple studies that methane emissions from the oil and gas sector, particularly from production facilities, are underestimated in official estimates reported by the United States and other countries (Alvarez et al., 2018; Lu et al., 2022). Recent peer-reviewed research has shown the impact of high-emitting episodic activities, unaccounted emissions sources, and outdated emission factors on overall emissions (Chen et al., 2022b; NASEM, 2018; Schwietzke et al., 2017; Vaughn et al., 2018).
Innovation in methane emission quantifying technologies can support the development of measurement-informed inventories. While not without uncertainty, these measurement-informed inventories can improve the quality in terms of completeness and more representative GHG emissions data compared to existing national activity-based methodologies. The increasing deployment of novel technologies to quantify methane emissions and develop measurement-informed inventories, if developed at scale, can improve the timeliness and accuracy of GHG emissions estimates including supporting the U.S. GHG national inventory (GHGI) and U.S. EPA Greenhouse Gas Reporting Program (GHGRP) inventory development, international programs such as the International Methane Emissions Observatory, and support target-based mitigation strategies that are cost-effective and externally credible. The recently passed Inflation Reduction Act (IRA) and the CHIPS and Science Acts focus on the development of empirical GHG measurements. The IRA explicitly directs the U.S. EPA to revise the GHGRP emissions data with empirically derived methane emissions data at an individual-facility level. The inter- and intra-day variability in methane emissions can potentially be addressed by pairing high-frequency snapshot measurements with continuous emissions monitoring systems and a mechanistic understanding of facility-level operations, in addition to expert evaluation (Wang et al., 2022a). Such measurement-informed inventories and transparent reporting can also address the limitations of activity-based methods in capturing unaccounted or poorly characterized emission sources.
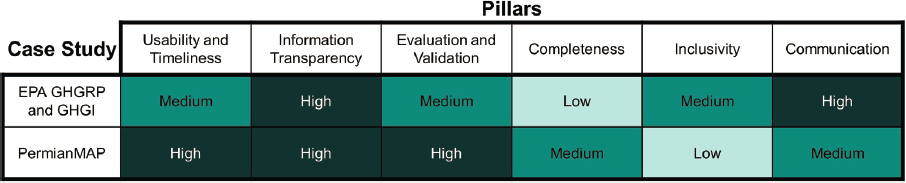
Here, we consider the activity-based approach used by the U.S. EPA and an independent regional assessment called the Permian Methane Analysis Project (PermianMAP) led by the Environmental Defense Fund (EDF) to estimate methane emissions from U.S. oil and gas facilities in the Permian basin. For the U.S. EPA, new scientific studies can be used directly to update the inventory methods and emission factors if the studies are representative and geographically diverse.2
4.4.1 EPA estimates
In its national GHGI, the U.S. EPA estimates that the oil and gas sector is the largest source of anthropogenic methane emissions in the United States, accounting for about a third of the total methane emissions in 2020 (EPA, 2022). In 2009, the U.S. EPA finalized the annual reporting of GHGs, codified under 40 CFR Part 98 of the GHGRP from large facilities emitting over 25,000 metric tons of CO2 equivalent, including oil and gas. Both the GHGI and GHGRP programs generally follow the 2006 IPCC Guidelines and the results are made publicly available on the U.S. EPA’s website.3 Detailed explanations of the U.S. EPA methods for estimating methane emissions from petroleum and natural gas systems are provided in each inventory report and data files are available
___________________
2 Revisions and Confidentiality Determinations for Data Elements Under the Greenhouse Gas Reporting Rule, April 29, 2022. Docket Id. No. EPA-HQ-OAR-2019-0424.
3 GHG inventory data are available at https://www.epa.gov/ghgemissions/inventory-us-greenhouse-gas-emissions-and-sinks-1990-2020. GHGRP information at a facility level can be found at https://ghgdata.epa.gov/ghgp/main.do.
to download.4 The U.S. national GHGI undergoes a 30-day expert review. Additionally, both inventories follow a 30-day public review after expert review through publication in the U.S. Federal Register. The U.S. EPA incorporates the feedback as deemed appropriate and publishes responses to the comments when the inventories are finalized and submitted to the UNFCCC. The GHGRP follows regulatory-approved accounting methods, including default emission factors, which were finalized after public review and comment. The U.S. EPA inventories are the basis for U.S. NDCs and historical baseline emissions (Executive Office of the President, 2021). Public policies related to mitigation of GHG emissions employ the U.S. EPA inventories (EPA, 2021).
Multiple studies employing both activity- and atmospheric-based measurements have concluded that the U.S. EPA or other activity-based inventories in the United States and other countries underestimate methane emissions from the oil and gas sector (Lu et al., 2022). The 2018 National Academies study attributed the gap between conventional activity- and atmospheric-based approaches to include the persistence of high-emitting episodic activities, unaccounted or poorly characterized emission sources, and outdated emission factors (NASEM, 2018). Recent research has shown the impact of such episodic events and emission sources on overall emissions estimates (Chen et al., 2022b; Cusworth et al., 2021b; Omara et al., 2022; Schwietzke et al., 2017; Vaughn et al., 2018).
In the evaluation below we consider GHG emissions information generated by the GHGI and GHGRP and users of emissions information from oil and gas facilities, including national decision makers, researchers, and the public.
Usability and timeliness [Medium]:
Usability and timeliness is medium. GHGIs are used for the U.S. NDCs and a historical baseline, so they are highly usable at the national level. Regional or gridded data are not currently available, which limits usability by local and regional policy makers and researchers. The latest GHGI submitted in April 2022 covers methane emissions for the period 1990–2020. While methane emissions estimates are filed by affected facilities under regulatory mandates of the GHGRP by March 31 for the prior calendar year, public access to the data lags by about 18–24 months. The GHGRP data are analyzed and integrated as appropriate into the GHGIs for the petroleum and natural gas sector.5 The requirements under the IRA to update U.S. EPA emission factors with empirical or measurement-informed data will improve the usability of the GHGRP and GHGI. However, the time lag in the availability of the methane emissions data limits planning and decision making.
Information transparency [High]:
The U.S. EPA national inventories can generally be considered to rank high in transparency because the methods are provided in each inventory report and the data files are available to download. The U.S. EPA follows regulatory-approved accounting methods, including default emission factors, which were finalized after sharing for public review and comment. Webpages include information about the inventories that is targeted at nonexpert audiences.
Evaluation and validation [Medium]:
Evaluation and validation is ranked medium. GHGIs go through a 30-day expert review and the methodology is validated, though comparison to independent data sources has revealed differences between measurement-based inventories and the U.S. EPA inventories. The U.S. EPA conducts independent validation and verification of GHGRP inventories submitted by operators, and errors are flagged for review and/or resubmittal of the GHGRP. The U.S. EPA also has the potential to undertake enforcement action against reporters for violations of reporting requirements under the GHGRP (40 CFR § 98.8).
Completeness [Low]:
Completeness is low. The GHGRP only includes certain high-emitting facilities, which excludes methane emissions from smaller oil and gas operations that are important
___________________
4 ANNEX 3 Methodological Descriptions for Additional Source or Sink Categories, Sections 3.5 and 3.6. https://www.epa.gov/system/files/documents/2022-04/us-ghg-inventory-2022-annex-3-additional-source-or-sink-categories-part-a.pdf.
5 https://www.epa.gov/sites/default/files/2015-07/documents/ghgrp_inventory_emissions_comparison.pdf
for a full accounting of emissions. The gap in reconciling the U.S. EPA inventory methane emissions versus observed estimates in the oil and gas sector described above is likely due to unaccounted emissions sources.
Inclusivity [Medium]:
Inclusivity is ranked as medium. The work is performed by technical experts but the GHGI includes a 30-day public review process in which feedback from the public may be incorporated.
Communication [High]:
Communication is high. The information is published on a public website, with explanatory information and summary statistics and visualizations targeted at nonexpert audiences.
4.4.2 The Permian Methane Analysis Project
PermianMAP is a research initiative of EDF and other research partners employing a variety of multiscale technologies including aircraft and satellites to measure methane emissions over a 10,000 km2 area in Texas and New Mexico, covering over 11,000 oil and gas wells operated by a myriad of operators. The project began collecting data in autumn 2019 and data collection is ongoing. The detailed methodology and data are publicly available.6 Multiple peer-reviewed papers have employed these data (Lyon et al., 2021; Shen et al., 2022; Zhang et al., 2020) and concluded that the methane emissions in the Permian Basin are higher than activity-based methods such as GHGI (Case Study 4.4.1). In addition, the PermianMAP project includes an operator dashboard7 that provides measured emissions during the study period after it has been verified by the various operators and other stakeholders.
In the evaluation below, we consider GHG emissions information from the PermianMAP website and users of the information including national decision makers, researchers, and the public.
Usability and timeliness [High]:
The data are specific to individual facilities and can be used by operators to assess performance at the time of measurement. Information is reported shortly after collection, so timeliness is high after each campaign. The data and results can be used in comparison to activity-based inventories such as GHGI or GHGRP.
Information transparency [High]:
PermianMAP scores high on transparency because methods and the data are freely available from the project website.
Evaluation and validation [High]:
Evaluation and validation is high. Different types of measurements are employed and compared, and there is independent evaluation and verification from academic experts.
Completeness [Medium]:
Completeness is medium. The GHG emissions information produced is only for methane sources from oil and gas facilities in the Permian Basin, but PermianMAP has clearly defined boundaries and covered all oil and gas sources within the boundary. The facility-level analysis is based on spot measurements (typically a few measurements per emission source), so it does not reflect daily variations of emissions or that super-emitters are stochastic.
Inclusivity [Low]:
Inclusivity is low because local stakeholders were not part of the project design. The project does have a mechanism to communicate with well operators and collect feedback on emissions and responses by operators, though facility-level measurements have stopped as of November 2021, hindering timely responses. Inclusivity could be improved by engaging local communities in this effort.
Communication [Medium]:
Communication is medium. A detailed, interactive website presents maps, quantitative data, trends, and more. Information targeted at well operators is generated
___________________
for and communicated with them. The methodology is documented on the website, but there is a lack of context and no background information for the general public.
In comparing the evaluation of the U.S. EPA GHGRP and GHGI and the PermianMAP study of oil and gas methane emissions in the Permian Basin, it is evident how different types of GHG information have different attributes and can complement each other (Figure 4-5). By using information from the two products together, decision makers have a better view of the actual emissions in the region and the issues that underpin the mitigation of methane emissions of this type in the Permian Basin, some of which can apply to other regions. Both approaches could improve inclusivity, particularly by engaging with local communities. Improving completeness in both approaches would also result in better information, and PermianMAP could link to and build on public-targeted information from the U.S. EPA to improve communication.
4.5 VERIFY
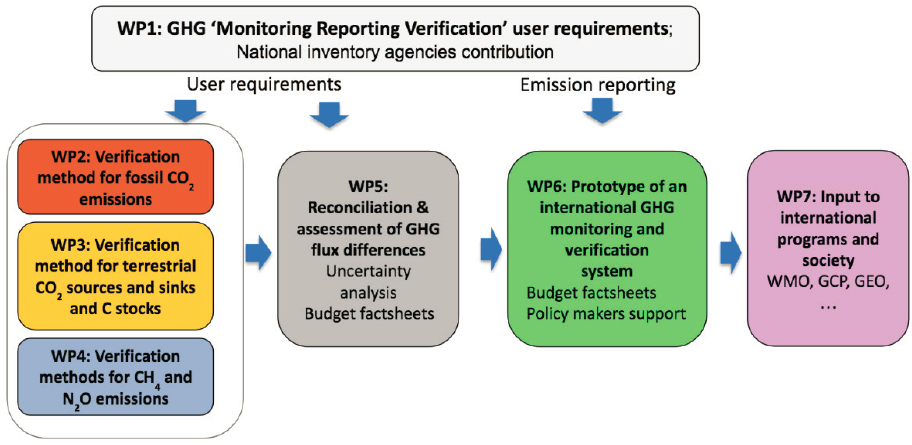
VERIFY8 is an EU-funded project that aimed to develop a system primarily for providing science-based support to EU countries’ emissions reporting to UNFCCC (Janssens-Maenhout et al., 2020). Part of the project included an assessment of the user requirements and needs from the GHG monitoring, reporting, and verification perspective, as well as challenges and potential for future science (e.g., quantifying different gases, spatial/temporal scales, observation resources, etc.). VERIFY identified three major topical research areas for developing verification tools: (1) fossil fuel CO2 emissions, (2) terrestrial CO2 sources and sinks and carbon stocks, and (3) methane and N2O emissions (see Figure 4-6).
VERIFY integrated atmospheric measurements, satellite observations, and ecosystem data with emissions inventories via modeling and data assimilation to produce country-level GHG budgets for major GHG gases (CO2, CH4, and N2O) for the EU domain using a combination of activity-based and atmospheric-based approaches. VERIFY explored the use of atmospheric tracer or co-emitted species measurements, such as 14C, CO, and NO2, to estimate fossil fuel CO2 emissions by separating them from other sources and natural sinks. This approach required improvements to their inventory approach and emission models for co-emitted species and data assimilation (Petrescu et al., 2021; Super et al., 2020). Other GHG emission models, including ecosystem models and land surface models, were improved to provide non-energy CO2 and methane and N2O process-specific emissions information more accurately (e.g., Balkovič et al., 2020; Schelhaas et al., 2018; Susiluoto et al., 2018). The activity-based emission models and atmospheric-based approaches incorporating them were used to produce GHG budgets with uncertainty assessments primarily for EU member countries (e.g., Petrescu et al., 2020, 2021).
___________________
While an EU-led and EU-focused project, VERIFY also considered how such efforts could be implemented in an international framework for GHG verification support to countries and regions outside of the EU domain. VERIFY also invested in regional and large-scale carbon cycling (e.g., river fluxes, Gommet et al., 2022), including oceans (Roobaert et al., 2018), as well as climate policy analysis (Perugini et al., 2021; Peters et al., 2020), to support the global collective assessment of climate mitigation (e.g., Global Stocktake).
In the evaluation below (see also Figure 4-7), we consider EU-wide and country-level GHG emissions information available from the VERIFY website and academic publications, and users of the information to include national decision makers, researchers, and the public in the European Union.
Usability and timeliness [Medium]:
Usability and timeliness is medium. The project aims to serve the policy maker community, and they have also had conversations with relevant international organizations (e.g., UNFCCC, the World Meteorological Organization, the Group on Earth Observations), indicating some relevance to stakeholders. While data and reports are available, there has been little evidence that VERIFY products have had an impact on decisions and reported inventories so far. Efforts initiated in VERIFY are likely to continue and become more useful with further development.
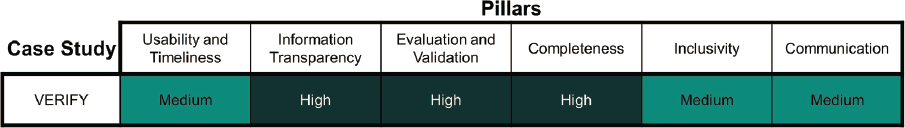
Information transparency [High]:
Transparency ranks high. The GHG budgets and estimates produced by VERIFY were presented as science synthesis reports9 and the results, including the budget data sheets and data, are available from their website and data repository for public use.10 Additionally, the data and plots are available from their interactive tools for improved user accessibility.11 VERIFY also make some model codes available via GIT.12
Evaluation and validation [High]:
VERIFY ranks high on evaluation and validation from a scientific standard because there have been efforts to address uncertainties and to apply and compare different approaches. Studies evaluating the results are published in reports and peer-reviewed literature.
Completeness [High]:
Completeness is high. VERIFY provides emissions estimates of sources and sinks for CO2, methane, and N2O for the European Union. The spatial coverage is limited to the European Union, as was intentional in the project design. F-gases were also analyzed in the project, and ocean and climate projection components were also included. Reliable atmospheric-based estimation of fossil fuel CO2 is pending further development.
Inclusivity [Medium]:
Inclusivity is medium because VERIFY is primarily an EU project with some non-EU collaborators, nearly all academic researchers. The project intended to prototype an international system, which could improve its inclusivity. Inclusivity would be improved by involving all potential users to define user requirements and making efforts to gather public comment.
Communication [Medium]:
Communication is medium. Their website provides information on project aims, key reports, and some summary graphics of findings. The VERIFY tools and datasets are not always in easily usable or in downloadable formats for a wide range of users.
4.6 Climate TRACE
Climate TRACE (Tracking Real-time Atmospheric Carbon Emissions) is a hybrid approach that utilizes nontraditional data including satellite imagery with artificial intelligence and other data science tools to develop an activity-based account of global GHG emissions. Climate TRACE launched in 2020 and released its first data product in 2021. With 12 member organizations and more than 50 contributors—including academic researchers, nonprofits, tech companies, and climate leaders—it accesses high-resolution satellite imagery and develops methodological approaches to detect and estimate GHG-emitting activities and emissions. Utilizing data from more than 300 satellites, over 11,000 sensors, and other emission sources (Climate TRACE, n.d.), Climate TRACE aims to evaluate GHG-emitting activities in 10 sectors, including agriculture, buildings, manufacturing, maritime, mineral extraction, forestry and land use, oil and gas, power, transport, and waste. Their first data release in 2021 reported national emissions totals in CO2-equivalents by subsector for the year 2020. They have also engaged with nations and subnational entities to obtain data. For example, Dalmia Cement, one of the largest cement companies in India and a core partner of Climate TRACE, has provided all of its facility-level emissions data to train the platform’s estimation of manufacturing-related emissions.
Due to the proprietary nature of some of the data sources underlying Climate TRACE’s emissions models and estimates, access to underlying data and source code is not available to the public. Only one and three subsectors out of 14 have code and data sources available, respectively. Methodology documents are limited to a few sectors generally detailing how sectoral emission estimates are derived, including information regarding data sources used, such as satellite data and ground-truth data. Since different organizations lead different sectoral emissions estimates, the
___________________
9 https://verify.lsce.ipsl.fr/index.php/repository/key-reports-verify
10 https://verify.lsce.ipsl.fr/index.php/products
11 https://verify.lsce.ipsl.fr/index.php/products?view=article&id=153
level of methodological granularity and quality varies by sector. For example, the methodology document for power sector emissions modeling prepared by WattTime provides information on the training data, including locations of power plants and remote sensing data to identify these plants’ operational status and the machine learning models utilized. Other sectors provide fewer details, such as the aviation sector, which largely refers to the International Civil Aviation Organization’s methodology to estimate carbon emissions for air travel and outlines broadly the estimation of aircraft emissions using historical information on flight distances traveled.
In the evaluation below (see also Figure 4-8), we consider GHG emissions information publicly available on the Climate TRACE website and users of the information including national decision makers, researchers, and the public.
Usability and timeliness [Low]:
Usability and timeliness is currently low because there is little evidence that their products have been utilized by decision makers to date. Climate TRACE provides national-level statistics, which can have limited utility for mitigation decisions. They released country-specific reports in the lead up to COP-26 (26th session of the Conference of the Parties). There is a framework for providing timely updates to data, but in most cases, only data for 2020 are currently available. The integration of data from a range of sources and more real-time information updates have the potential for high usability, but that has not been realized currently. Providing information at subnational scales may expand the number of potential users.
Information transparency [Low]:
Transparency is currently low. While there is methodology documentation publicly available on their website, transparency is limited by the proprietary nature of some of the data sources underlying Climate TRACE’s emissions models and estimates. Access to underlying data and source code is not currently available to the public.
Evaluation and validation [Low]:
Evaluation and validation is also currently low. Some of the underlying models have been published in the peer-review literature, and some data have been published as part of other thoroughly evaluated projects such as EDGAR. Currently, Climate TRACE-specific reports are only in the gray literature and there have been no peer-reviewed publications about their data product or any associated published evaluation against independent data.
Completeness [Medium]:
Completeness is medium. Strengths in completeness come from the large number of data sources and sectors included. However, emissions are reported in CO2 equivalent and, while this metric may be useful for reporting comparable values to the general public, information on individual GHGs is not currently available. Quantifying each GHG is important for mitigation decisions and would support information usability and evaluation and validation against other datasets. The data currently quantify emissions by country, globally, but do not provide spatially disaggregated information.
Inclusivity [Medium]:
Inclusivity is medium. The project is conducted by a large team of scientific and private-sector partners and, as described above, Climate TRACE has collected some information through engagement and partnership with local companies. Inclusivity could be strengthened through engagement with other types of local stakeholders (e.g., air quality agencies) or the incorporation of citizen science.
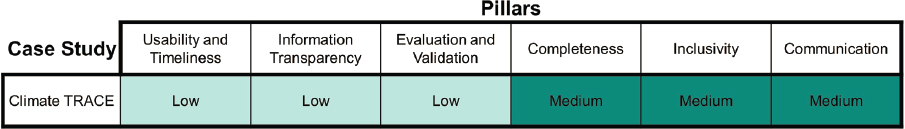
Communication [Medium]:
Communication is medium. An interactive website allows for data exploration and the data are available to download in usable formats (csv, json). Communication could be improved with online tutorials and more information on the webpage explaining the data and methods. Detailed documentation is not available in the gray literature reports that are publicly available. The metric of CO2 equivalent is difficult for decision makers to interpret and for researchers to make comparisons to.
Themes of Framework Evaluation for General Approaches and Case Studies
This chapter outlined six pillars for evaluating GHG emissions information, provided a qualitative evaluation of the capabilities of current approaches to satisfy these pillars, and presented a set of case studies to demonstrate how this framework could be applied to current efforts. While the case studies and approach rankings were not exhaustive of all possible applications, a number of themes emerged that have informed the recommendations the Committee makes in the following chapter.
Overall, usability and timeliness ratings are often low because the information is not available at relevant time scales and at the level of granularity needed to be useful; complex methods also tend to remain within a small, technical community. Information transparency tends to rate more highly because the information is often published and publicly available. Risks to information transparency include information behind paywalls, private data collection, and proprietary methodologies. While some form of evaluation and validation is often performed, there are opportunities to improve, particularly for activity-based data, and move beyond internal consistency checks to evaluate information against independent data and consistently develop and report uncertainty estimates.
For completeness, a primary limitation is that all GHGs are often not included, especially in atmospheric-based approaches. Areas for improvement in activity-based approaches include capturing all sources and sinks, representing nonroutine emissions, and applying appropriate emission factors. Inclusivity is low in most cases, particularly when considering historically underrepresented communities and geographies. Inclusivity could be enhanced by collaborating with stakeholders to develop methods and priorities, training and building the capacity of underrepresented communities, and using citizen scientists to make observations. Finally, communication is low in many cases when GHG emissions information is developed for technical communities and not adequately communicated to policy makers and the public. On the whole, GHG data are scattered across a large number of portals and repositories. However, some projects have shown promise by creating websites with easy-to-navigate information, explanatory background, and data in formats that are easy to use.
The case studies demonstrate how the framework of six pillars for evaluating GHG emissions information could be applied more specifically to current efforts to identify their strengths and the areas where improvement or supplemental information is needed. Within a given approach, there can still be a wide range of performance relative to the pillars depending on the application, the user, and the user’s needs. Case Study 4.4 on methane emissions in the Permian Basin showed how different types of GHG emissions information can be combined to produce a better picture of actual emissions. Efforts to move toward explicit hybridization of different approaches and datasets holds promise for combining the strengths of activity- and atmospheric-based approaches (INFLUX, VERIFY) and for mining untapped data sources (Climate TRACE), although these efforts may remain unused by decision makers if they do not target the needs of decision makers with transparent methods and data that are communicated well. As demonstrated again by the case studies, inclusivity of GHG emissions information is an area that needs improvement if the best information is to be produced.


