
3
Structural and Technical Limitations of the Current Greenhouse Gas Emissions Information Landscape
The approaches for quantifying greenhouse gas (GHG) emissions information discussed in Chapter 2, particularly activity- and atmospheric-based approaches, have been widely utilized by the scientific and regulatory communities to support national and regional emissions reporting, data collection, and research advances. However, a range of challenges have inhibited the usefulness of emissions information to support decision making. These challenges relate to both the institutions/structures and the technical work of developing inventories and other information. This chapter provides an overview and specific examples of these challenges, motivating the development of a framework for the evaluation of emissions information introduced in Chapter 4, and recommendations for improving future GHG information development and governance in Chapter 5. In both this chapter and the following chapter, we primarily focus on the national-to-global scale, in line with the Statement of Task.
Structural Limitations of the United Nations Framework Convention on Climate Change National Reporting Process
Limitations to the structure of the United Nations Framework Convention on Climate Change (UNFCCC) reporting process have hampered the completeness of global and national emissions inventories. The UNFCCC introduced the “common but differentiated responsibilities” concept that led to different standards and reporting requirements for Annex I countries and non-Annex I countries that have more reporting flexibility (see Chapter 2, Figure 2-3). Though justifiable from an international negotiating perspective, these differences in reporting standards have led to incomplete aggregate data at the United Nations—for example, around 45 countries have not reported emissions data since 2009 (Eilperin and Mooney, 2021). In addition, UNFCCC reporting requirements only include anthropogenic GHG emissions and sinks across five sectors. By convention, emissions from international marine bunker fuel and aviation are not part of national inventories, but may be reported separately. For the agriculture, forestry, and other land use sector, it can be difficult to identify and attribute emissions to human causes because these areas can function as both GHG sources and sinks due to natural and anthropogenic processes, contributing to large
uncertainties in data and measurements (Perugini et al., 2021). Only Annex I countries are currently required to estimate these uncertainties. Non-Annex I countries are not required to produce uncertainty estimates.
The Intergovernmental Panel on Climate Change (IPCC) guidelines have defined source categories for reporting national emissions designed to limit double counting or omissions. However, certain source categories have key emission sources reported under different categories. For example, the latest U.S. GHG inventory reports CO2 emissions from all combustion sources within the natural gas value chain under the Fossil Fuel Combustion source category, while methane and CO2 emissions from flaring are reported under the Natural Gas Systems source category. This makes it difficult to compare national GHG inventories with inventories developed by the regulated and scientific communities (see Table 2-1), especially for communities or decision makers unfamiliar with the IPCC reporting structures.
In general, the IPCC process has long grappled with the incorporation of peer-reviewed information and timeliness and has been limited by the complexity of the report writing process and sign-off by governments. The development process for the IPCC inventory guidelines also introduces issues that hinder the effectiveness of GHG inventory reporting. The expert synthesis process, by which the IPCC guidelines are updated, has remained unchanged since 1996. The four-stage process of expert written and revised drafts cannot always include peer-reviewed research due to publication deadlines, thereby hindering the incorporation of the latest scientific studies into future updates (Yona et al., 2020). It was not until 2015 that Annex I countries were required to use the 2006 guidelines as part of their inventory submittals (UNFCCC, 2014, Decision 24/CP.19). Similarly, the use of the 2019 refinements is optional for inventories submitted as part of the Enhanced Transparency Framework (ETF). While not required, the tiered architecture of the IPCC process does not prevent countries from using higher tiered (tier 2 and 3) approaches that reflect the latest literature and are relevant for the country.
Barriers to Capacity Building
GHG emissions inventory research, in general, has been limited in developing countries because of a lack of technical expertise and scientific capacity, often the result of limited financial resources and investments in institutions (Kim et al., 2022a). Moreover, climate change disproportionately affects developing countries (IPCC, 2006); thus, domestic funding often prioritizes adaptation to climate change rather than mitigation (Kim et al., 2022a; López-Ballesteros et al., 2018). While many local and regional efforts can be supported through capacity building, this section focuses on the UNFCCC reporting processes because it is a requirement for Parties and the foundation upon which many subnational emissions inventory efforts have been based.
Adopted at COP-21 (21st session of the Conference of the Parties), the Paris Agreement developed the ETF for action and support “in order to build mutual trust and confidence and to promote effective implementation” (UNFCCC, 2015, Article 13.1). The purpose of the ETF is to improve the understanding of climate mitigation approaches and track the progress countries are making toward their nationally determined contributions (Article 13.5). The ETF strengthens and improves existing transparency arrangements, including national communications and biennial update reports (BURs) while considering the different capacities and circumstances of least developed countries and small island developing states (Articles 13.3 and 13.4). Under this framework, each Party agrees to provide a regular national inventory report, prepared by using IPCC’s best practices (Article 13.7(a)).
Financial, technical, and capacity-building support is provided to assist with UNFCCC reporting requirements (UNFCCC, 2015, Articles 9, 10, 11). The Global Environment Facility (GEF) provides financial support and the Consultative Group of Experts provides technical support.
Still, barriers to capacity building remain. GEF funds are contractually provided, meaning they are provided to pay for a project (e.g., to prepare a BUR). Although GEF has fulfilled its function to fund the preparation of reporting projects, there can be a gap in funding cycles and, without domestic or other sustained funding, developing countries often lose the required technical knowledge—including staff, data, and methods documentation—to support GHG reporting. Subsequently, many countries must re-acquire all the necessary components for each new GHG inventory report (Damassa and Elsayed, 2013). Similarly, the lack of institutional arrangements (e.g., specific agencies responsible for reporting) within a country hinders the ability to sustain GHG reporting (Breidenich, 2011).
Kawanishi and Fujikura (2018) evaluated the capacity of non-Annex I countries to sustain national GHG inventory reports (i.e., NCs and/or BURs). They used criteria developed by Damassa and Elsayed (2013) and added two separate criteria related to the issue of sustained funding: one criterion for “external funding” and another for “domestic funding.” Kawanishi and Fujikura (2018) found a significant difference in all eight criteria except for “external funding” between countries that have conducted more regular reporting and countries with limited to no reporting, indicating external funding has played a limited role in capacity building. The most significant difference between the two groups was in the “institutional arrangements” criterion. Criteria “domestic funding,” “archiving,” and “data sharing agreements” were the next most significant (Kawanishi and Fujikura, 2018). Ultimately, Kawanishi and Fujikura (2018) found that access to GEF financial support did not necessarily translate to enhanced capacities to facilitate regular inventory reporting.
In addition to financial limitations, barriers to capacity can be a result of political, institutional, and/or technical factors that hinder or prevent the preparation of regular GHG inventory reports (Damassa and Elsayed, 2013; IPCC, 2006). In an assessment of 37 Asian developing countries, basic technical capacity (e.g., statistics and scientific expertise) in each country was crucial to support the improvement in overall GHG inventory reporting capacity (Umemiya et al., 2017). In a discussion among stakeholders, they noted important issues related to data and metadata and highlighted the importance of data and knowledge sharing (e.g., methodological guidance and research results) (López-Ballesteros et al., 2018). It is important to consider country- and context-specific needs (Kawanishi and Fujikura, 2018) and to ensure needs are provided and prioritized by developing countries themselves (Kim et al., 2022b).
Current Institutions and Their Limitations
As discussed in Chapter 2, there is a wide range of institutions involved in generating, collecting, curating, and disseminating GHG emissions information at global, national, and subnational scales. Figure 3-1 provides some examples of existing organizations, programs, and projects across spatial scales.
At the global scale, this includes the Committee on Earth Observation Satellites coordinating satellite observation systems; the World Meteorological Organization program Integrated Global Greenhouse Gas Information System (IG3IS) seeking to extend the observational capacity for GHGs to all scales and provide information to users from national governments, to cities, to facilities; the International Methane Emissions Observatory (IMEO) (see Box 3-1) focusing on methane emissions observations; other Earth observation portals such as Copernicus and National Aeronautics and Space Administration; and a number of institutions devoted to developing global inventories such as the Carbon Dioxide Information Analysis Center and the International Energy Agency (see Table 2-1 for a list of examples). The UNFCCC and IPCC have a unique role given their linkage to the UNFCCC national reporting requirements, with a separate set of issues described earlier in this chapter.
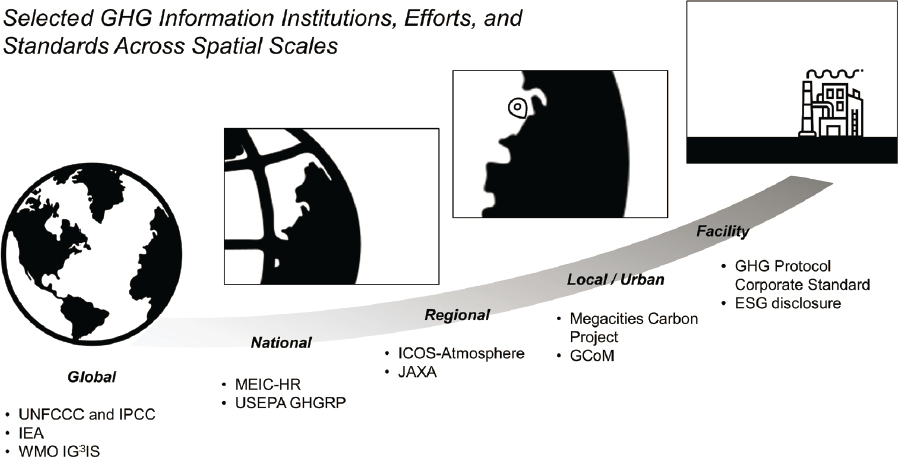
At the national scale, most countries have national institutions responsible for collecting climate change statistics according to the UN Statistical Commission Global Consultation on the Global Set of Climate Change Statistics and Indicators (UNSD, 2022), but the responsible institution or institutions vary. Most of the national statistical organizations have not yet developed specialized climate change surveys, reflecting that climate-specific indicators are a relatively new area for standardized tracking and a lack of mandates and capacity for collecting this information. The consultations also found that a minority of developing (non-Annex I) countries had requested technical assistance from regional and international organizations. Exceptions to this are worth
noting, such as the U.S. Environmental Protection Agency, which archives an increasingly rich complement of GHG emissions information both as part of the UNFCCC process and for domestic regulatory purposes.
As with research activities taking place at the global scale, there are also individual research efforts at the national scale that generate increasingly complex and granular GHG emissions information. However, these efforts typically lack the institutional infrastructure needed to systematically serve GHG emissions information to the wide spectrum of decision makers over long periods of time.
Drawbacks of the current global institutional structures include the lack of a framework for users to easily navigate and find relevant and useful information. The current landscape requires users to know what resources exist, how to find them, visit each resource to see what information is available, and then interpret the quality and utility of that information from often technical and hard-to-access documentation. Furthermore, the process by which new scientific research is integrated into analytical frameworks to develop inventories is opaque. These challenges are not unique to GHG emissions information. The air quality and meteorological communities face these same challenges, and the strategies, lessons learned, and infrastructure developments provide a template and collaborative opportunity for GHG-focused efforts. Furthermore, the synergy of GHG, air quality, and meteorology can be leveraged to advance science and better utilize resources, including analytical and measurement capabilities.
Technical Challenges with Current Approaches
Limitations to Activity-Based Approaches
As described in Chapter 2, the most general representation of the method at the core of most activity-based approaches involves multiplying an emission factor with activity data for the time period the inventory is developed. The quality of emissions inventories developed using this approach is thus often determined by the quality of the emission factor and activity data inputs.
Activity data.
Activity data can represent a wide variety of information such as direct flux observations, models, survey data, remotely-sensed data, and socioeconomic indicators. We do not exhaustively review all forms of activity data here but use a series of example activity-based information that provides common example limitations to activity data.
The simplest example involves the estimation of energy-related GHG emissions from fossil fuel combustion. Although other techniques exist (e.g., ratios to monitored local air pollution), country-scale energy statistics are the most common activity data used to estimate GHG emissions from energy-related activities (IEA, 2021c). As described in Chapter 2, energy statistics are acquired through national questionnaires or surveys (Andres et al., 2012) but they often lack transparency. This lack of transparency presents a potential limitation to the reliability and accuracy of this foundational energy information and is a key source of uncertainty for global inventories that rely on these activity data (e.g., Hoesly and Smith, 2018; Marland, 2008). The major energy statistics sources often provide national energy or fuel use datasets that are updated and revised on an annual basis. While the national energy or fuel use data do not provide enough information for emissions to be calculated beyond country and annual scales, the consistent and complete time series of national data should ensure robustness of interannual emissions. Thus, the resulting emissions can be used to support the evaluation of emission changes from a base year to target emission reductions (Oda et al., 2021) and the uncertainty discussed above may not be an issue for certain applications, such as UNFCCC reporting, that use these emissions estimates. Uncertainties associated with conventional fuel activity data at national scales are considered to be small, especially for CO2, due to the robust definition of the system boundary (i.e., apparent consumption approach)
and the direct connection of fuel and emissions (i.e., no chemistry other than oxidation) (Oda et al., 2021).
Additional energy information may be available at finer spatial scales, such as estimates from energy utilities, fuel accounts from individual energy industry companies, and fuel sales at the retail level. However, this information is often not universally available or archived systematically. In addition, defining the system boundaries of these activity data is more challenging than at the national level, particularly for certain sectors such as transportation (Oda et al., 2021). Beyond energy statistics, there is a lack of coordinated collection systems for activity data required to generate activity-based emission estimates. Unlike at the national level, there is no systematic evaluation of activity data at finer spatial scales to detect potential errors and biases.
Beyond simple fuel statistics, other forms of activity data pose unique challenges. For example, direct flux monitoring, such as those represented by continuous emission monitoring (CEM) devices present in large effluent stacks, is a promising approach to unambiguously quantify GHG emissions from an emitting activity (Gurney et al., 2016; Quick, 2014). However, CEMs have mostly been applied to power production facilities in high-income countries and require ongoing independent calibration and maintenance. Furthermore, where there are no regulatory requirements or market drivers, large effluent stack emitters are typically private actors and the expansion of CEMs must overcome proprietary and privacy barriers for wider deployment.
Given the importance of onroad vehicular GHG emissions, a common approach to estimating GHG emissions independent of fuel statistics is via measurements of the vehicle miles or kilometers traveled (Gately et al., 2017). Though a useful independent estimate of onroad emissions, these measurements require dense traffic monitoring across a statistically representative sample of road segments, often prohibitive to countries with a large geographic extent and/or limited resources. However, new forms of nontraditional activity data, such as ubiquitous cell phone and GPS locational information, offer the potential to overcome this limitation (Gately et al., 2017).
Estimating managed vegetative carbon uptake and emissions often requires the estimation of vegetation metrics such as vegetation cover or mass, growth rates, or soil composition (Oertel et al., 2016; Sha et al., 2022). These metrics can be estimated from the extrapolation of intensive plot studies or estimated from satellite-based measures of activity such as the Normalized Difference Vegetation Index or Solar Induced Fluorescence (SiF) (Kováč et al., 2022; MacBean et al., 2018). Extrapolation faces challenges of heterogeneity and sample representativeness particularly because the managed vegetation is considered regionally specific. Satellite-based approaches face challenges associated with cloud cover, overpass limits, and biome representativeness.
Some of the limitations of activity-based approaches are linked to the specific GHG considered. For example, methane emissions are challenging to quantify because large portions of methane emissions are from unintentional or unaccounted release (in the form of natural gas) from extraction to end-use delivery for which there are limited to no representative statistics. This and other forms of unintended emissions create particular challenges (e.g., Chen et al., 2022a; Cusworth et al., 2020; see Box 3-2).
Many forms of activity data are generated through survey collection, which can take several years and result in emission estimates that have a lag of 1 or 2 years (NRC, 2010). The implication of this time lag is that stakeholders do not have dynamic or contemporaneous estimates of emissions to better inform decisions, particularly at subnational levels (see Box 3-2). However, it is important to note that national emissions inventories are complete emission time series based on updated activity data over the period of interest. While there are many activity-based emissions estimates from the research community, they typically do not update their emissions estimates to reflect updated activity data. Emissions information products that are based on outdated activity data are challenging to compare to other estimates. Mostly because of the COVID pandemic, innovations
in inventory work have begun to address this limitation, such as with studies generating global estimates in near real-time (Liu et al., 2020b). However, these near-real-time estimates may have errors due to the use of activity data that have not been thoroughly evaluated (Oda et al., 2021).
Finally, recent years have seen the use of “nontraditional” activity data—for example, facility-level operational data (e.g., Liu et al., 2020a), cell phone data, and human mobility data (e.g., Forster et al., 2020). These data are typically used to produce higher time and spatial resolution emission estimates beyond annual country scales. However, while these nontraditional activity data are potentially useful, it can be challenging to ensure the spatial and temporal representativeness of the data for emissions calculations (Oda et al., 2021). The importance of a mechanistic understanding of high-emitting activities has been highlighted in multiple studies (NASEM, 2018; Schwietzke et al., 2017).
Very high-resolution optical remote sensing, available primarily from commercial satellites, is being explored to characterize emitting infrastructure, particularly because it is both more granular than the current global inventories and offers global data availability (Jervis et al., 2021; Jongaramrungruang et al., 2019). However, challenges remain in the interpretation and classification of imagery and the process by which GHG emissions are estimated (i.e., through emission factors or other transfer functions) (Jervis et al., 2021; Varon et al., 2018).
Emission factors.
Given the wide variety of activity data, emission factors or transfer functions from the activity to the estimate of emissions are equally diverse. This section will similarly avoid an exhaustive treatment of the many emission factor estimation techniques, focusing instead on a few representative examples with a description of their common limitations.
As with the activity data, the simplest and most widely used emission factor data, particularly when considering fuel combustion-related GHG emissions, is the carbon content of fuel. It is critical for these emission factors to be representative of the country, area, sector, and time of interest to provide accurate combustion-related emissions estimates (IPCC, 2006, 2019a). Emission factors can be found in the scientific literature or a database if not otherwise available. While emission
factors in the scientific literature or databases (e.g., IPCC Emission Factor Database1) often include references for traceability and transparency, the level of representativeness varies over countries, regions, and sectors. For example, emission factors for fossil fuel combustion emissions are relatively well known; however, emission factors for non-fossil fuel burning emissions (e.g., biomass burning) can be highly uncertain due to the heterogeneity of the fuel burned and the combustion conditions (e.g., Akagi et al., 2014). Furthermore, carbon content is often measured in physical units (e.g., mass carbon per gallon of fuel), which requires additional information about the heat content of fuel and imposes additional demands for observations and uncertainty quantification.
Combustion or fossil fuel-related emission factor estimations have been found to not align with peer-reviewed scientific studies and actual measured emissions in various sectors, creating a GHG accounting gap between GHG inventories and observations (Yona et al., 2022). For example, multiple studies in the oil and gas sector (e.g., Alvarez et al., 2018; Chan et al., 2020; Chen et al., 2022b), including longer-term measurements, have revealed that facility-level methane emissions are higher than those reported using conventional inventory methods (Wang et al., 2022a). This is mainly due to the continued use of outdated emission factors or poorly characterized and unaccounted emission sources (Cusworth et al., 2021b; Gordon, 2022; NASEM, 2018; Omara et al., 2022; see Case Study 4.4).
When considering onroad GHG emission estimation approaches that do not use bulk fuel statistics, several transformations are required. For example, the fuel efficiency of vehicles specific to country, region, vehicle class, driving condition, temperature, and maintenance level is critical to the accurate estimation of onroad emissions along with the fleet vehicle class distribution.
Transformation of vegetation characteristics to net emissions or uptake often requires techniques that span a wide spectrum of complexity from allometric relationships to complex carbon cycle plant or soil models. Both photosynthetic uptake and respiration emissions can be modeled and integrated (Velasco et al., 2013, 2016; Weissert et al., 2017).
Where relevant, emission factor databases that are widely used are often out of date and not regularly updated based on new information. For example, the IPCC Emission Factor Database, developed in 2006, has emission factors created using data from the 1990s based on Organisation for Economic Co-operation and Development countries (Chen and Brauch, 2021), and the same IPCC emission factors are used today.
Interest in consumption-based accounting perspectives faces numerous challenges. For example, translation of commodity flows at the national scale must overcome approximations related to the use of global average emission factors, coarse commodity categorization, and data transparency barriers (Iacovidou et al., 2017; Peters, 2008).
Furthermore, corporate inventories developed annually as part of either regulatory or voluntary requirements, such as Corporate Sustainability Reports, generally employ a similar accounting framework on the use of emission factors and activity data to report their direct (Scope 1) and indirect (Scope 2 and 3) emissions and have similar limitations as national inventories. The emission factors employed in corporate inventories are generally based on national or regional-level studies and, as such, may not be representative of a facility at the corporate level or across supply chains (Roman-White et al., 2021; Stern, 2022).
Spatial challenges.
Activity-based inventories include varied levels of spatial information. Emissions estimates can be disaggregated using geolocation information of sources and/or proxy (surrogate) data to estimate subsector emissions. Spatially explicit emissions can be calculated at the location of sources and used to provide subnational (province/state, cities, and facility levels) emissions, though uncertainties associated with spatial estimates can be large.
___________________
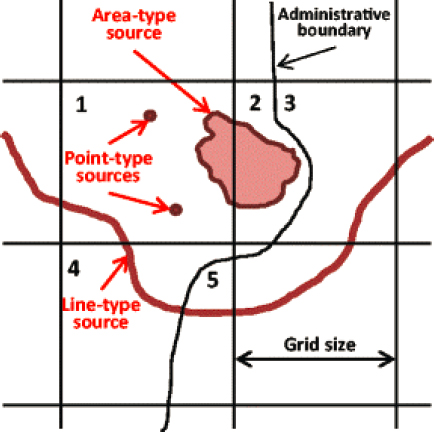
Activity-based inventory approaches are also applicable for subnational scales, such as state/province, cities, and individual facilities. Approaches used at subnational scales are often based on the same approaches used at national scales (e.g., community protocol for cities2), and thus are comparable to estimates from other subnational scales; however, emissions estimates may not be comparable because of the choice of emission factors and activity data. Particularly for activity data, the system boundary of subnational entities such as cities can be difficult to define (e.g., traffic emissions) and may not be the same as at the national level (Scope 3). For example, by disaggregating spatial data into 0.1° × 0.1° monthly gridded inventories of methane emissions for the United States, Maasakkers et al. (2016) were able to illustrate limitations and large errors in the spatial allocation in other inventory methods that can impact inverse analysis, if used as an a priori.
Examples of high-resolution GHG inventories have been developed for Europe, the United States, Poland, and Ukraine (Bun et al., 2007, 2019; Gately and Hutyra, 2017; Gurney et al., 2009, 2020b; Ivanova et al., 2017; Moran et al., 2018, 2022). In the case of Bun et al. (2019), emissions were disaggregated from province to source scales and categorized into IPCC sectors for CO2, methane, N2O, some F gases, and air pollutants. The emissions estimates were combined with corresponding geospatial source information (e.g., point, line, and areas) and provided as sectoral vector digital emission maps. Depending on source types, additional data, such as fuel use and type, were utilized to spatially downscale emissions by considering the nature of emissions sources. Unlike gridded products, this approach makes it possible to implement spatial emission analysis at key subnational administrative scales by correctly addressing administrative boundaries (Figure 3-2) and providing spatially resolved emission maps (up to 100 m). The efforts in Ukraine and Poland have done considerable work on quantifying the uncertainty associated with sectoral emissions estimates, spatial estimates, and these downscale/allocation procedures (Bun et al., 2007, 2019).
Examples in the United States avoid much downscaling with data at the asset scale such as facility-scale emissions stack monitoring and onroad vehicle activity at the individual road segment
___________________
2 https://ghgprotocol.org/greenhouse-gas-protocol-accounting-reporting-standard-cities
scale (Gately and Hutyra, 2017; Gurney et al., 2009, 2020a). Further research at the urban scale has resulted in emissions quantification at the individual building and road segment scale (Gurney et al., 2012, 2020b). However, even in data-rich countries such as the United States, these more spatially-resolved techniques face challenges. Independent evaluation is limited and atmospheric-based approaches must be constructed at finer scales to provide an alternative estimation. Furthermore, many of the data elements used in more spatially-resolved approaches are self-reported, raising challenges of validation, accuracy, representativeness, and trust.
The limitations of activity-based approaches noted above hinder timely action on mitigation strategies, especially in the case of short-lived climate forcers such as methane, for which there are significant uncertainties in existing emissions inventories.
Limitations of Atmospheric-Based Approaches
Atmospheric-based approaches utilize atmospheric measurements and models to quantify GHG emissions. However, atmospheric measurements can be limited in terms of precision, continuity, and coverage (see Box 3-3). In addition, models of atmospheric transport and chemical processes
introduce uncertainties and assumptions, impacting the accuracy of an emissions estimate from an atmospheric-based approach.
Major challenges for atmospheric-based studies relate to the continuity and comparability of atmospheric measurements. To resolve small gradients in the atmosphere, measurements must be highly precise and traceable to a reference (Brewer et al., 2018). The expert community of GHG measurement scientists regularly updates a set of recommendations for measurement and calibration techniques (WMO/IAEA, 2020). However, the capacity of central calibration laboratories may not be sufficient for future expansion in measurements and new systems may be needed. Calibration of satellite data and verification of its compatibility with other data requires ground-based remote sensing and aircraft measurements, and best practices are under ongoing development. Continuity of measurements is also needed to establish reliable atmospheric-based GHG information that can be integrated into decision making, but often atmospheric measurements are tied to specific research projects or political budget cycles and do not have secure, long-term support.
Another key challenge for atmospheric-based studies of CO2, methane, and N2O is the separation of anthropogenic and natural emissions. The most reliable (and similarly atmospheric-based) techniques use measurements of tracers that are sensitive to anthropogenic sources, which are associated with fossil fuel sources, but also biogenic sources in some cases. However, the sparseness of tracer data presently limits the use of these approaches. In some cases, uncertainties in emission ratios, emissions, or dynamics of these tracers are also limitations. For CO2, only a small number of inversions exist or are in development where fossil fuel emissions are determined for regional/national scales (Basu et al., 2020; Graven et al., 2018; Petrescu et al., 2021) and city scales (Turnbull et al. 2019). These studies used radiocarbon, nitrous oxides, and carbon monoxide as fossil fuel combustion tracers. For methane and N2O, isotopic measurements and tracers such as ethane have been used on scales ranging from global to local to separate different sources.
Inversion methods are the most widely used atmospheric-based approaches, and their development and limitations are the focus of the remainder of this section. There is a large body of scientific literature that discusses atmospheric inversions and the results of atmospheric inversion for inferring emissions (Deng et al., 2022; Friedlingstein et al., 2022; Jacob et al., 2022; Janssens-Maenhout et al., 2020; NASEM, 2018). Key points on the strengths and limitations of these approaches are briefly summarized here, in the areas of the datasets, inversion tools, and spatial and sectoral information.
There have been advancements in the tools for inversion analysis, especially as computing power has improved, and weather/dynamics models improve fidelity and resolution (Agustí-Panareda et al., 2019). Despite this progress, the transport in atmospheric models can still be an important source of error (Basu et al., 2018; Crowell et al., 2019; Peylin et al., 2013; Schuh et al., 2019). Atmospheric inversions utilize meteorological data and/or models to make connections between atmospheric observations and emissions. Thus, the error and uncertainty associated with atmospheric transport directly impact the resulting inverse estimates. The impact of atmospheric transport errors has been characterized by comparing results from different transport models (e.g., Crowell et al., 2019; Peylin et al., 2013), though using the model ensemble spread may be an insufficient approach to fully capture the transport errors. For example, Schuh et al. (2019) showed differences in meridional and vertical transport simulated in transport models commonly used in large-scale inversions (e.g., Crowell et al., 2019). Complex meteorology can also pose a challenge to inversions. There are limited atmospheric boundary layer height (ABLH; the lowest layer of the atmosphere in which GHG emissions get diluted observations) and there are large uncertainties in atmospheric transport models that need such observations to improve the representation of the ABLH. In addition, atmospheric inversions typically employ “offline” models driven by meteorological fields taken from global climate models (GCMs). Analysis from parent GCMs could mitigate transport errors (e.g., Yu et al., 2018).
Although atmospheric-based methods often involve air pollutant measurements, there has historically been limited collaboration between the GHG and air quality communities. The air quality community has a long record of developing and utilizing detailed emissions inventories using the same methods described in Chapter 2, and many of these inventories are tailored to cities that also account for the majority of GHG emissions. Not only do many air pollutants have common sources with GHGs, but air pollutant inventories also contain many of the same activity-based information relevant to developing GHG emissions inventories. Emissions inventories and measurements of air pollutants may not be co-located with GHG measurements or performed by different entities, hindering the ability of these independent measurements to constrain atmospheric-based estimates of GHG emissions. Thus, there would be large co-benefits for climate and human health from integrating studies of GHGs and air pollutants, as well as integrating mitigation policies for GHGs and air pollutants.
There has been a large increase in the number of remote sensing satellites for CO2 and methane since 2010 when National Research Council (2010) was written. The plans for future missions are described in Chapter 2 and Appendix B. While new satellite measurements and advances in inversion models have allowed progress in some areas, challenges remain related to data coverage, limitations of sensitivity, and difficulty in separating sectors. In some cases, the in situ and/or remote sensing data are not sufficient to characterize the flux or emissions of interest when the magnitude of the emissions is below the sensitivity of the analysis (Jacob et al., 2022). Inversion analysis is impacted by uncertainty on the fluxes of natural systems that make it hard to quantify anthropogenic emissions. Even then, the end user is often interested in emissions from a specific sector, not the integrated total that is sensed by atmospheric measurements. There are methods under development to add information on specific sector sources to inversion analysis, such as the use of isotopic tracers and multiple atmospheric gases (see Chapter 2). The inclusion of additional variables related to the activity of the natural system (such as carbonyl sulfide and SiF) can be used to try to separate the terms, but this is still an area of development. For regional and city scales and point sources, the background concentrations must be well specified, as they can have a large influence on inversion results. If there are multiple emissions sources located together in one area, it is unlikely that atmospheric inversions will be able to distinguish them. In addition, a single inverse estimate provides little information about the accuracy of the inverse estimate, so often, multiple inversions are needed to gain some insight into the consensus of the inversions and perhaps infer the accuracy of the inversion.
Other barriers exist related to the community of practitioners, communication of results, and data sharing. The application of inversion models is complicated, requires large computing resources, and utilizes large, complex computer codes. A small group of researchers performs these analyses, and the techniques and descriptions can even be hard for other scientists to understand. Results are usually shared via publication in the scientific literature using terminology aimed at other scientists. Findings and implications are rarely widely communicated or put in language more useful to policy makers. Although many measurement datasets are freely available (see Chapter 2), there are some datasets collected by private entities that are not publicly available or are available for purchase. This is a barrier to transparency: even if analysis results are published, the underlying data cannot be accessed for others to use in analysis.
Challenges in Reconciling Activity- and Atmospheric-Based Approaches
Atmospheric-based approaches can provide an emissions estimate that is independent of an activity-based estimate if the atmospheric-based approach does not use a prior estimate from an activity-based approach. Evaluations of activity-based estimates can often be challenging due to the lack of evaluation data, such as alternative emissions estimates (e.g., Andres et al., 2016; Oda
et al., 2019). Thus, assessment of an activity-based inventory’s uncertainties is often limited. In particular cases, atmospheric-based estimates may hold the potential to examine the accuracy of activity-based estimates and detect and quantify errors and biases, especially if the errors are associated with a particular approach (e.g., conceptualization error). However, comparisons of estimates from the two approaches can be challenging due to the mismatch of the spatial and temporal domain and coverage as well as the granularity of the information. Furthermore, separating emissions and removal contributions to atmospheric-based approaches can also make such comparisons challenging. Some programs, such as the Global Carbon Project, are reporting comparisons between estimates from activity-based and atmospheric-based methods (e.g., Friedlingstein et al., 2022).
The uncertainty associated with atmospheric-based approaches is often significantly higher than that of activity-based approaches (Cheewaphongphan et al., 2019; Vaughn et al., 2018), although the uncertainty in activity-based approaches is often not quantified or well understood. Reconciling activity- and atmospheric-based approaches is often challenging due to the difference in model conceptualization. Activity-based approaches often define the domain of interest as a system boundary (e.g., country). However, it is challenging to match the domain of atmospheric-based estimates with the proper boundary to carry out a fair comparison. Smaller spatial domains, such as cities, have a better chance of successfully reconciling activity- and atmospheric-based approaches, particularly if dense observation networks are utilized (e.g., Lauvaux et al., 2020). While atmospheric-based estimates are more accurate at smaller scales, facility-level emission estimates may not be available, especially outside of the United States.
For a given spatial scale, activity- and atmospheric-based approaches have sometimes been shown to lead to different conclusions, which is not unexpected as they were conceived and designed through different disciplines and for different purposes (Wilson and Swisher, 1993). Smaller-scale approaches have been shown to be effective in capturing specific emission sources and possible mitigation strategies (Duren, 2022); however, they require more resources, and emissions accounting procedures can differ temporally and from site to site (Nicholls et al., 2015). In comparison, for atmospheric-based approaches to adequately capture local-scale fluxes, a dense observational mesh is often required, though other approaches that provide less spatial information can also be used (e.g., Fitzmaurice et al., 2022; Kim et al., 2018, 2022b; Turner et al., 2020). Background observations are also needed to be able to determine finer GHG enhancements (Meijer, 2022).
Scientific research has suggested possible sources of discrepancies between activity- and atmospheric-based approaches. For example, the variation of emission factors and assumptions used in activity-based approaches has been shown to lead to overestimates of methane emissions in China inferred from inverse modeling studies (Cheewaphongphan et al., 2019). It is also worth noting that overestimates were observed to be strongly sector dependent. Other examples at the national and urban scales have shown convergence for fossil fuel CO2 emissions, such as the work of Basu et al. (2020) in the United States where the atmospheric-based and activity-based approaches agreed to within 1.4 percent at the national scale, and work by Lauvaux et al. (2020) in the city of Indianapolis where the atmospheric- and activity-based approaches agreed to within 3 percent on a multiyear mean basis. At the facility scale, it has been demonstrated that data completeness and a mechanistic understanding of emissions estimates from each approach are important for emissions verification, and that direct comparison of emissions estimates from methods covering widely different time scales can be misleading (Vaughn et al., 2018).
Limitations of Hybrid Approaches
As discussed in Chapter 2, integration of activity- and atmospheric-based approaches and other information has the potential to offer more robust and comprehensive GHG emissions information.
The hybrid approaches inherit the strengths of activity- and atmospheric-based approaches as well as their weaknesses and limitations discussed above. Additionally, techniques used to integrate the information can also introduce challenges. For example, while data assimilation methods are generally mature, research advances (e.g., improving model resolution and mechanistic representation of processes) and work at large modeling centers have not been tailored to inform decision makers across spatial scales. In the section that follows, some additional limitations for machine learning (ML)-based approaches and the application of other digital technologies for data storage and integration are discussed in greater detail given that many of these approaches are relatively nascent and present significant potential, especially if these limitations are addressed.
Algorithmic bias.
Data quality and “missingness” are primary concerns in ML applications since ML algorithms require high-quality input data to accurately train algorithms and classifiers for prediction. The lack of representative ground-truth data to validate ML-based methods is another challenge that could lead to algorithmic bias, a known problem with ML, particularly in computer vision models that have notoriously failed to accurately detect skin tone and gender (Buolamwini and Gebru, 2018; Burns et al., 2018). Validation is another main challenge for ML prediction since ground-based GHG emissions data are limited and scarcer in some regions than others. This challenge is recognized in studies that have implemented hybrid approaches for air pollution monitoring, where ground-based monitors are limited in some developing country regions, such as sub-Saharan Africa and Latin America (Shaddick et al., 2018).
Interoperability challenges.
A major challenge to achieve hybrid approaches that seek to leverage and integrate the rapid proliferation of Earth observation (EO) data, nontraditional data (e.g., open social activity data), and digitally enabled collection of other relevant data that can be fused with ML algorithms is the design and development of storage, processing, and exchange systems that allow for decision makers to maximize their utility. In this domain, interoperability, or the open exchange of data between different data systems, types, and standards, is a key consideration with respect to integrating the influx of new datasets and sources while maintaining traceability and trackability (Sudmanns et al., 2020). Data taxonomies, or schemas, are critical for finding parsimony between distinct datasets and utilizing ML-based approaches for insights. Data taxonomies in other research areas such as in life sciences (with the Integrated Taxonomic Information System) and in guidelines for peer-reviewed articles (NISO, 2013) have benefited data sharing. For example, the U.S. National Research Council in 1993 first introduced the concept of a Spatial Data Infrastructure that facilitates and coordinates geospatial data exchange between systems, networks, and standards (Giuliani et al., 2017). Other examples include the Group on Earth Observation, the EU Spatial Data Infrastructure, and the Global Framework for Climate Services (Giuliani et al., 2017). Clear taxonomies allow entity matching and insight generation but will not alone combat the issues of data fragmentation (Lee and Stvilia, 2014). Federated data commons, which are a composite of diverse data sources, are a useful solution to querying heterogeneous datasets. For example, OS-Climate, a workstream of the Linux Foundation, is a data commons that unifies fragmented EO datasets using connectors like Trino. The OS-Climate data mesh is one example that allows interoperability between distinct datasets with entity matching, taxonomy, and connectors federating the dataset that would otherwise require centralized, reconfigured relational databases.
Increased energy demand.
A common critique of next-generation digital technologies and data-intensive approaches to collect, process, and integrate climate data is the increased energy demand due to cloud storage and server requirements. For instance, the Centre for Environmental Data Analysis, which is the United Kingdom’s atmospheric and Earth observation data center, holds over 15 petabytes of data in over 250 million files, with over 10 terabytes of data being generated and requiring storage daily (Eggleton and Winfield, 2020). Data centers are currently estimated to account for 1 percent of worldwide electricity consumption, and while there is debate in terms of exactly how much future growth in energy demand will result from new technologies, Masanet
et al. (2020) found that between 2010 and 2018 energy consumption as a result of data centers only grew 6 percent due to increases in energy efficiency. Next-generation data storage, such as blockchains, as a potential decentralized climate data integration and storage solution (see Chapter 2), has also been criticized as an energy-intensive process due to the complexity of some of the cryptographic algorithms to complete computational tasks for applications like cryptocurrency (i.e., bitcoin) (Mora et al., 2018; Sedlmeir et al., 2020; Truby, 2018). The modification of distributed ledger technologies that power blockchains for data storage is an active area of research as a way to lower the transactional costs of existing modes of climate data collection while ensuring energy demands do not outpace the advantages (Schletz et al., 2022). However, there are some experiments (e.g., Microsoft3) to reduce energy overheads.
Data quality and uncertainty.
With the velocity, variety, and volume (or three of the five Vs of Big Data identified by van Genderen et al. (2020)) of data being generated through EO and other digital technologies, a critical issue is the quality and uncertainty of the data being generated. The sheer volume of the anticipated growth in environment- and climate-related data is on the order of upward of 300 petabytes, requiring storage within the next few years (Eggleton and Winfield, 2020). Analyzing and integrating these data pose a major challenge, and even with data integration solutions such as data cubes, which aim to provide an interface for users to interact with large spatiotemporal EO data, quality is a major concern because most lack data quality or uncertainty information within metadata records (Giuliani et al., 2019). Once integrated within data cubes or other similar digital architectures, uncertainty and errors can unknowingly propagate.
Governance and transparency challenges.
With the promise of digital technologies, standards to govern sharing and management of new data being generated are important considerations. Although data sharing standards such as the FAIR principles, which stand for findability, accessibility, interoperability, and reusability of data (Wilkinson et al., 2016), have been adopted as best practice for many data providers and researchers developing climate-related datasets, an evaluation of current energy databases found that many fail basic FAIR data principles that allow for interoperability and transparency (Schwanitz et al., 2022). In employing more complex, nonlinear statistical and ML approaches to improve GHG data integration, a major risk is the “black-box” problem, where such algorithms tend to diffuse information that make interpretation difficult and threaten methodological transparency (Castelvecchi, 2016).
However, the volume and complexity of data to be integrated through hybrid approaches may necessitate new governance modes and principles to ensure transparency. For example, artificial intelligence and ML approaches could introduce machine agents in lieu of human intervention requiring clearly coded rules to define authority and boundaries (i.e., smart contracts to verify data provenance) (Ramachandran and Kantarcioglu, 2017). Similarly, the emergence of decentralized autonomous organizations (DAOs), which apply blockchain technology to democratize decision making, introduces new digital collaboration and governance models with distributed ledger technology (see Box 2-7), formalizing governance rules in computer code that may potentially lower transactional costs by eliminating the need for third parties or centralized regulators (e.g., klimaDAO) (De Filippi et al., 2020; Kloppenburg et al., 2022). With these automated governance approaches, however, also come risks. Governance through DAOs is often slower moving because decisions rely on a majority vote and information asymmetries abound between members (Morrison et al., 2020).
___________________
3 https://news.microsoft.com/innovation-stories/project-natick-underwater-datacenter/
This page intentionally left blank.


