2
Existing Infrastructure for CO2 Utilization
This chapter describes the existing infrastructure in the United States to capture, transport, and store carbon dioxide (CO2), and its relationship to current and future CO2 utilization opportunities. Current sources of CO2 are also described to assist in evaluating the potential for locating new industries and assessing required infrastructure. Because CO2 utilization processes and technologies can require inputs of clean electricity, clean hydrogen, water, and natural gas, the status of those industries is also discussed. Net-zero enabling technologies and infrastructure are necessary inputs to directly de-fossilize CO2 utilization processes themselves and to achieve net-zero emissions of CO2 utilization systems from a complete life cycle perspective.
2.1 CO2 SOURCES
Sources of CO2 for utilization include concentrated point sources of emissions and diffuse resources such as CO2 in the atmosphere and oceans, particularly collected via direct air capture (DAC) and direct ocean capture (DOC). The following sections describe CO2 emissions from U.S. sources by location and type of source and provide an overview of the current market for CO2.
2.1.1 Current U.S. and Global CO2 Emissions and Stocks
In 2019, 5.259 gigatonnes (Gt) of CO2 were released into the atmosphere from sources in the United States, equivalent to 1.435 Gt of carbon (EPA 2022). Global emissions of CO2 amounted to 33.4 Gt CO2 from the energy system (9.1 Gt carbon), or 40.5 Gt CO2 (11.0 Gt C) including the energy system and land-use change (Hausfather 2021; IEA 2021). The stock of CO2 in the atmosphere is about 829 Gt carbon, of which about 240 Gt have been added in the industrial era, when CO2 began to increase due to human activity, primarily from fossil-fuel combustion (Bruhwiler et al. 2018). By comparison, the global demand for chemicals and derivative materials yielded 0.450 Gt of carbon embodied in the carbon-based products themselves in 2020, 84 percent of which was fossil-derived carbon (57 percent oil, 25 percent natural gas, and 1.7 percent coal), ~10 percent bio-based carbon, and ~5 percent recycled carbon (Kahler et al. 2021). Future CO2 utilization will aim to replace a portion of the embodied carbon in chemicals and derivative materials with carbon derived from CO2.
2.1.1.1 Current Point Sources of CO2
Point sources of CO2 emissions include electric power plants, industrial and manufacturing facilities, waste facilities, and various other sources of combustion or chemical process emissions. Point sources offer the opportunity to capture emissions before they are released to the atmosphere.
Figure 2-1 depicts CO2 emissions from major emitting facilities, characterized by source, emission quantity, and location in 2019. The U.S. Environmental Protection Agency (EPA) Facility Level GHG [greenhouse gas] Emissions Inventory (FLIGHT database) facilities are shown in panel (a) (fossil-fuel sources) and panel (b) (industrial facilities), totaling 6,934 facility emission sources with 2,588 million metric tons (MMT) of CO2 emitted in 2019 (EPA 2017).1 Fossil facilities include power plants, natural gas and oil systems, and refineries. Industrial emitters include chemical manufacture, industrial gas suppliers, metals, minerals, pulp and paper, waste, and other. The committee also estimated biogenic CO2 emissions from ethanol plants, panel (c), which are not tracked in the FLIGHT database. Point-source facilities including those shown in Figure 2-1(a)–(c) represent opportunities for
___________________
1 CO2 emissions recorded in the FLIGHT database in 2020 were about 10 percent lower than 2019 emissions, due to the changes in energy use during the COVID-19 pandemic. Because the 2020 data are less representative of the general trend in CO2 emissions over time, the older 2019 data were used for analysis.
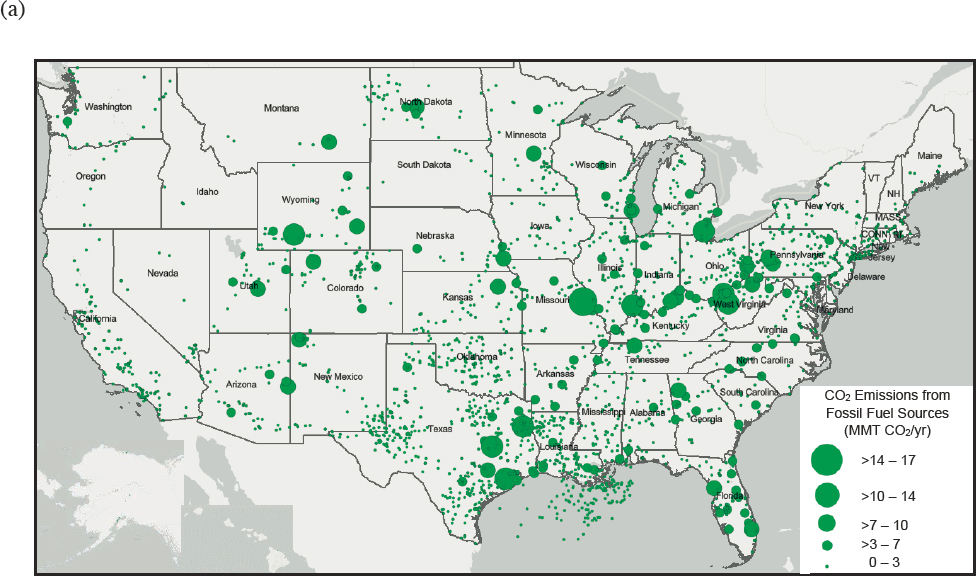
SOURCE: Data from FLIGHT database for fossil-fuel facility and industrial emissions and from Ethanol Producer Magazine at ethanolproducer.com for ethanol plant emissions.
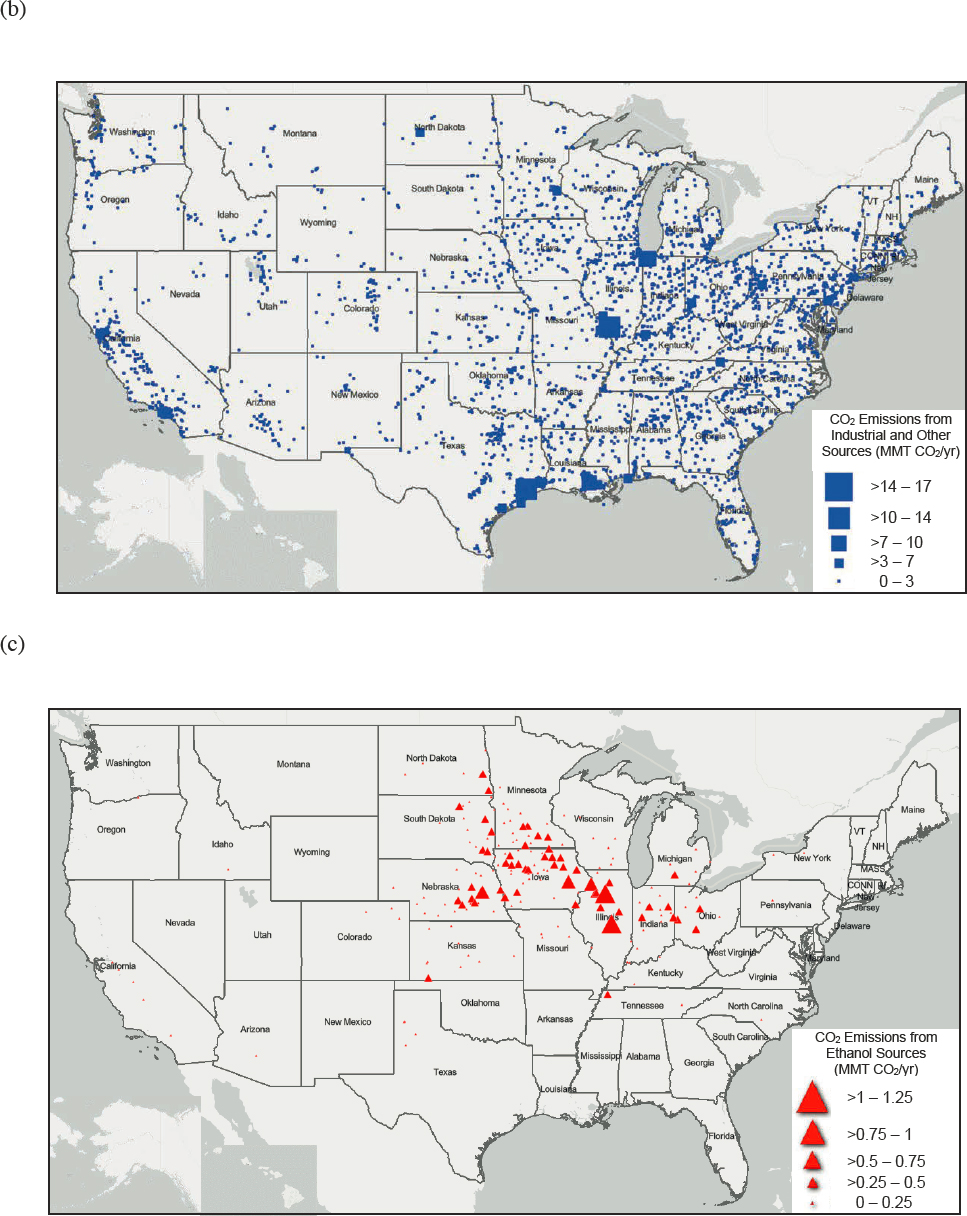
emissions capture at the source. Power plants were the largest source of CO2 emissions among facilities in 2019, followed by facilities from the oil and gas system, refinery, and chemical sectors. The top states for CO2 emissions were Texas and Louisiana, which have significant emissions from facilities in the top emitting categories.
2.1.1.2 Current Nonpoint Sources of CO2
Nonpoint sources of CO2 are those that are difficult to capture at the point of emission, either because they are mobile or too small to warrant local CO2 capture. CO2 from these sources likely must be captured from the atmosphere or bodies of water into which the CO2 dissolves using technologies such as DAC or DOC. With these technologies, the atmosphere and bodies of water could become major reservoirs for carbon that is accessible for use. Major current nonpoint sources of CO2 include vehicles powered by combustion, distributed agricultural and land-use-based emissions, emissions from combustion-based building heating systems, and natural events such as wildfires. Figure 2-2 plots nonpoint source emissions, not including land-use emissions, compared to point-source emissions.
Transportation is the largest emitting sector in the United States, with 1,818 MMT CO2 emissions in 2019, representing 35 percent of U.S. CO2 emissions from combustion of fossil fuels (EPA 2022). Combustion of fuels in homes and businesses for heating and hot water emitted 341 and 251 MMT CO2, respectively, in 2019. CO2 emissions related to agricultural and other land uses (not including combustion of fossil fuels) were 7.6 MMT in 2019, primarily from urea and lime use as fertilizers. Land use, land-use change, and forestry currently represent a net CO2 emissions sink in the United States, with about 800 MMT CO2 being removed from the atmosphere per year, primarily through forest growth (EPA 2022).
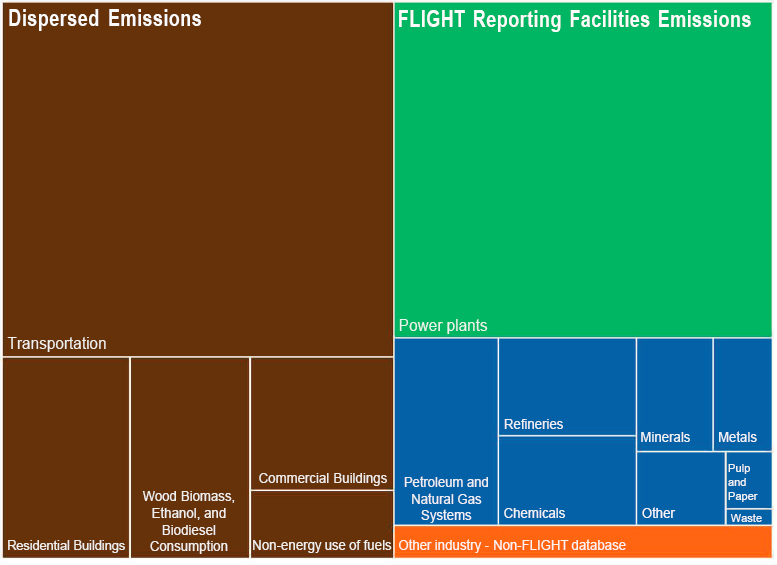
SOURCE: Data from EPA, 2022, “Facility Level Information on GreenHouse gases Tool (FLIGHT) Database,” and 1999–2019, “Inventory of U.S. Greenhouse Gas Emissions and Sinks.”
2.1.1.3 Atmosphere and Water Bodies
DAC and DOC could be used to transform diffuse, atmospheric concentrations of CO2 into concentrated, point sources of CO2 for utilization. Currently no commercial facilities for DAC or DOC operate in the United States. However, the number of companies emerging in this space is increasing rapidly, as the newly launched Direct Air Capture Coalition (DAC Coalition 2022) and the 2022 milestone winners in the Carbon Removal XPrize (XPRIZE 2022) show. A recent National Academies report on the research needs for ocean-based CO2 removal describes a research strategy for various negative emissions aspects of ocean capture (NASEM 2022).
2.1.2 Current Sourcing of CO2 for Utilization
2.1.2.1 Demand and Supply Balance
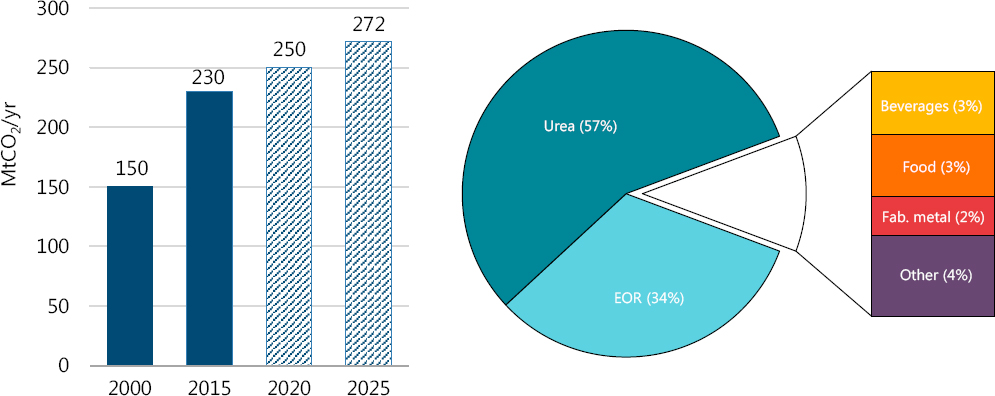
CO2 is a valuable and necessary commodity in today’s economy and will become only more integral as new uses emerge. Grand View Research estimated the global market to be over $7.8 billion in 2020 and anticipated growth at a compound annual growth rate of 4.0 percent from 2021 to 2028 (Grand View Research 2022). Global annual use of CO2 exceeds 230 MMT, primarily in the fertilizer industry for urea manufacturing (130 MMT CO2), with the second largest user being the oil and gas industry, which consumes 70–80 MMT CO2 for enhanced oil recovery (EOR; IEA 2019; see Figure 2-3). According to IHS Markit (2021), Mainland China and North America are today’s major markets for CO2, accounting for about 28 percent and 27 percent, respectively, of global demand in 2020, followed by Southwest Asia and the Middle East, accounting for 11 percent and 8 percent, respectively.
The CO2 market comprises both captive industrial users, who typically produce and consume CO2 on-site, and merchant users, who receive deliveries of CO2 in a variety of forms. While the most common captive use of CO2 today is in the manufacturing of urea, as illustrated in Figure 2-3, various industrial processes, including methanol synthesis, use merchant supply of CO2. CO2 is used as an acidifier in beverage and water treatment applications, as a shielding and inerting gas (e.g., in metalworking or food preservation), and as a chilling and cleaning agent while in a solid state. In the merchant market, the food and beverage industry is the largest consumer of liquid CO2, and this demand is a key external driver in the market.
SOURCE: International Energy Agency, 2019, Putting CO2 to Use: Creating Value from Emissions, Paris: IEA, https://www.iea.org/reports/putting-co2-to-use. All rights reserved.
Most merchant CO2 is recovered in gaseous form from industrial processes with a by-product stream that has a high concentration of CO2, such as in corn-to-ethanol or hydrogen production. An estimated breakdown of CO2 sources for merchant supply in the United States includes ethanol (46 percent), natural gas processing (28 percent), NH3 production (18 percent), steam methane reforming (SMR) plants (6 percent), and nontraditional sources (2 percent). Large amounts of CO2 also can be extracted from naturally occurring underground sources, such as the McElmo Dome in Colorado or the Jackson Dome in Mississippi (DiPietro et al. 2012). Notably, many of the currently utilized point sources of CO2 may change in a net-zero emissions future. For example, the demand for bioethanol to blend in gasoline or natural gas for heating and power generation may decrease as vehicles and space heating electrify and the electric grid decarbonizes. Therefore, CO2 sourced from natural gas processing is likely to decrease as fossil fuels are broadly phased out; however, CO2 from ethanol production may decrease along with biofuel blend use in transportation, or may remain if ethanol production pivots to other uses of sustainable liquid fuels or carbon products. Depending on the source, the purity of the CO2 product varies, and merchant CO2 is often sold under different grades, for example, industrial, food, or specialty grade. Merchant CO2 is typically liquefied for distribution due to its favorable economics compared to gaseous distribution.
CO2 market dynamics are variable. Global geopolitics impact the demand for CO2 for oil and gas production, as observed during the 2020 oil price competition between the Organization of Petroleum Exporting Countries (OPEC) and U.S. shale oil producers, when oil prices plummeted, along with the demand for CO2 for EOR. The COVID-19 pandemic also led to supply volatility in the United States. Widespread declines in motor vehicle and air travel as people stayed at home reduced demand for fuel, leading to operating reductions or idling of some U.S. ethanol production plants, causing pockets of CO2 supply shortages (Kelly and Polansek 2020). At the same time, use of CO2 in the food and beverage sector increased as consumer demand for frozen and packaged foods and carbonated beverages soared. Shipment of food products, as well as vaccine transportation and distribution, boosted the demand for CO2 in the form of dry ice. Local disruptions in supply-chain markets present an opportunity to find more sources of CO2 that are more reliable for existing as well as emerging markets.
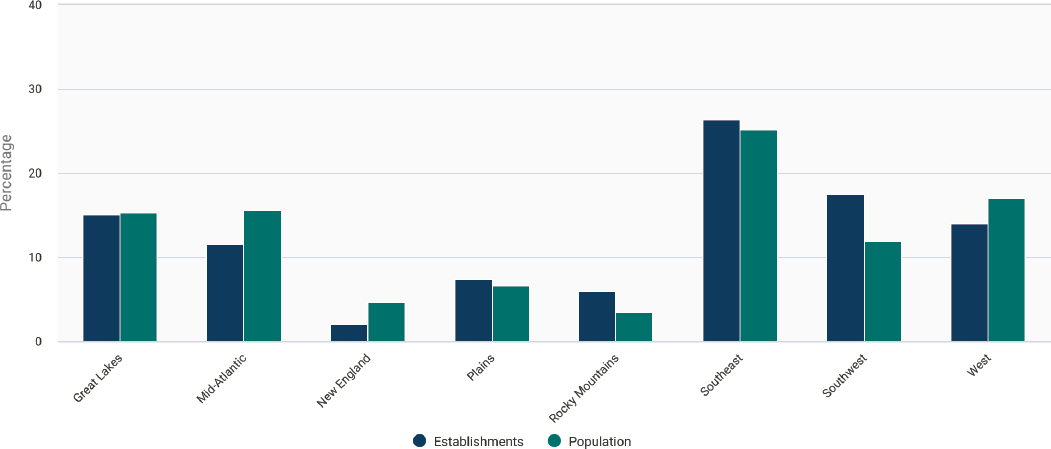
The major issue in the current CO2 market is balancing regional supply and demand. CO2 sources may or may not exist where demand is greatest. As with most industrial gases, production and consumption of CO2 most often occur within regional networks, due to the high cost of transport relative to the value of the industrial gas product. In the merchant market, CO2 distribution to end users is often in pressurized cylinders, tankers, and railcars. Overall, current demand for CO2 is concentrated around population centers, and CO2 production establishments are usually coupled with or located near downstream customers to reduce transportation costs. Regional production in the United States does not completely parallel population, as illustrated in Figure 2-4. Note that the figure uses production facilities (establishments) as a proxy for production volume, since companies do not release specific production details publicly. Imbalances occur along both coasts, where demand exceeds supply, as well in midwestern and southwestern states, where the reverse condition is observed. Increasing demand for CO2 can encourage more rapid scale-up and deployment of carbon capture technologies, driving down their costs. The current market for CO2 is expected to change significantly as uses in the United States develop beyond the existing EOR and industrial processes, to transformations via mineralization, chemical, and biological CO2 utilization processes.
2.1.2.2 CO2 Being Captured and Fed into Utilization or Storage
As of April 2022, the United States has 12 commercial-scale carbon capture and storage (CCS) facilities in operation and 58 more in some phase of development or construction (Global CCS Institute 2022). Section 4.1 discusses the infrastructure for CO2 capture in greater detail. One way to estimate the potential for carbon capture is to determine the number of facilities that could utilize the 45Q tax credit, which, according to a 2020 analysis from the Great Plains Institute, is 1,517 of 6,586 power plants and industrial facilities, accounting for 89 percent of the CO2 emissions from those sectors (Abramson et al. 2020). As noted above, no commercial U.S.-based facilities for DAC or DOC are operating yet, although a number of research, development, and demonstration (RD&D) projects are ongoing (DOE 2021; NASEM 2022), and the Infrastructure Investment and Jobs Act of 2021 (IIJA) authorized and appropriated $3.5 billion for the creation of four regional DAC hubs, which were defined to
SOURCE: J. Madigan, 2020, “Carbon Dioxide Production,” United States - Specialized Report OD4929, IBISWorld. © IBISWorld.
include capture, potential utilization off-takers, CO2 transport infrastructure, subsurface resources, and sequestration infrastructure (IIJA 2021 § 40308).
2.2 EXISTING PROCESSES AND FACILITIES UTILIZING CO2
Established production capability for CO2-derived products exists, but the number of commercial entities emphasizing new or net-zero CO2 utilization opportunities has increased only gradually from less than 200 in 2016 (Global CO2 Initiative 2018), remaining in the low hundreds as of 2022, including CO2 capture firms (Circular Carbon Network 2022).
2.2.1 Current Mineralization CO2 Utilization Processes and Facilities
Pilot-scale production of mineralized CO2 products has demonstrated commercial viability for mineralized waste materials (Hills et al. 2020), and the formation of limestone aggregates has seen early commercial implementation in construction projects (Constantz et al. 2015). CO2 curing of ready-mix concrete is commercialized (Monkman and MacDonald 2017) and deployed in more than 100 facilities as a bolt-on addition to existing production sites. Precast concrete CO2 curing and the use of carbonated aggregates in concrete are at advanced stages of deployment (Solidia 2022).
2.2.2 Current Chemical CO2 Utilization Processes and Facilities
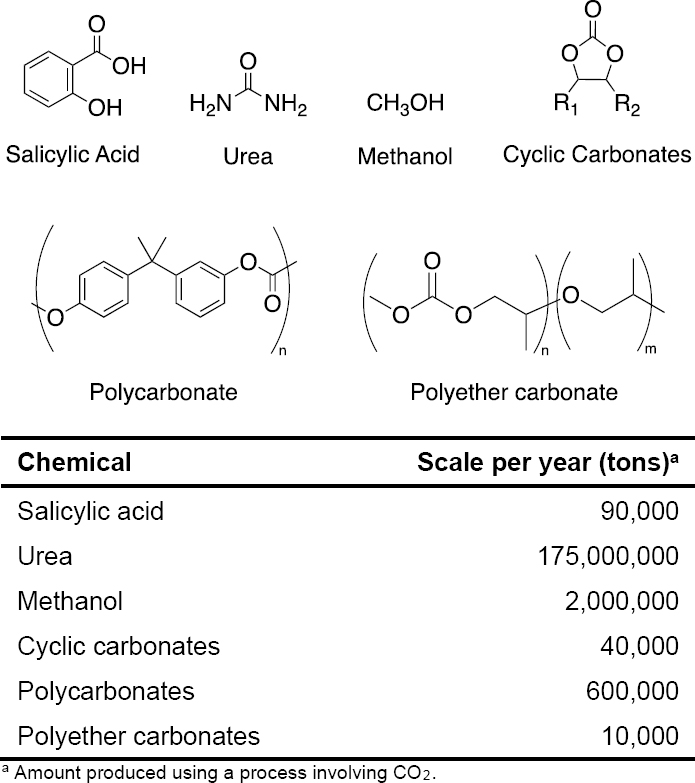
The highest volume chemical transformation of CO2 today is urea synthesis, as illustrated in Figure 2-3, above. Figure 2-5 shows other major products chemically synthesized from CO2 at industrial scale, which include organic
SOURCE: Adapted with permission from M.D. Burkart, N. Hazari, C.L. Tway, and E.L. Zeitler, 2019, “Opportunities and Challenges for Catalysis in Carbon Dioxide Utilization,” ACS Catalysis 9(9):7937–7956, https://doi.org/10.1021/acscatal.9b02113. Copyright 2019, American Chemical Society.
carbonates and their polymers, methanol, and salicylic acid. The scale of urea production dwarfs that of the other chemicals by at least two orders of magnitude. These chemicals are produced using CO2 because it is chemically advantageous to do so, in part because they are relatively highly oxygenated.
In addition to industrial-scale transformation of CO2, pilot-scale utilization is emerging for additional processes and products. These processes and products include carbon monoxide, methanol, methane, other hydrocarbon fuels, oxalic acid, ethylene carbonate, ethylene glycol, and polyurethane (Bright 2020; Burkart et al. 2019). These pilot projects are implementing known CO2 transformation technologies with sustainable CO2, or are developing new transformations of CO2, each of which are important steps in further developing commercial CO2 utilization. Methanol from CO2 is the most advanced of the emerging chemical CO2 utilization technologies, with major pilot projects and commercial-scale plants in the works in both Europe and Asia (Carbon Recycling International n.d.; Greenwood 2021; Hobson 2018; Mitsubishi Gas Chemical Company 2021; Pires da Mata Costa et al. 2021). Likewise, pilot plants for carbon monoxide production using solid oxide electrolyzer technology have led to commercially available electrolyzers (Küngas et al. 2017). There are multiple pilot plants of various sizes in Europe for producing methane and Fischer-Tropsch fuels, which have market opportunities in storing energy and powering
aviation (Ineratec 2017). As one example, Haldor-Topsoe is partnering with Arcadia eFuels in Denmark to implement their gas-to-liquid “e-fuels” technology in a commercial-scale plant, which is scheduled to start operations by the end of 2024 (Arcadia eFuels 2022; Haldor-Topsoe 2022). Several companies have also commercialized technologies for the production of polycarbonates from CO2; as one example, Asahi Kasei’s CO2 to polycarbonate process is being used worldwide to produce around 900,000 tons of polycarbonate per year, equivalent to 16 percent of total polycarbonate production capacity (Asahi Kasei Corporation 2021). Pilot plants to utilize CO2 in producing oxalic acid, ethylene glycol, and polyurethane, among other chemicals and plastics, are all below 50 tonnes of product per year, and thus are still pre-commercial (Scott 2019; Yang et al. 2019).
2.2.3 Current Biological CO2 Utilization Processes and Facilities
CO2 utilization by microbes (naturally occurring or genetically modified) ranges from the production of chemicals as simple as ethanol, for which large-scale facilities exist, all the way to complex molecules that include proteins. In particular, green algae are being used to produce biodiesel, renewable synthetic diesel and gasoline, protein, pentanoic acids, and astaxanthin. Cyanobacteria yield ethanol, iso- and n-butanol, butanediol, propane-diol, hydroxybutanoic and propanoic acids, fatty acids, ethylene, 2-methyl-1,3-butadiene, heptadecane, limonene, bisabolene, squalene, and farnesene (Burkart et al. 2019). Some products are made as mixtures, such as biodiesel. Several biological CO2 utilization processes are in the pilot stage. Most biological processes for making carbon-based chemicals and materials use CO2 indirectly, via plants using CO2 to make biomass, conversion of biomass to sugar, and then sugar to the final product. This study examines only direct uses of CO2 by microbes for CO2 utilization.
2.3 EXISTING CO2 TRANSPORT AND STORAGE INFRASTRUCTURE
2.3.1 CO2 Pipeline Systems
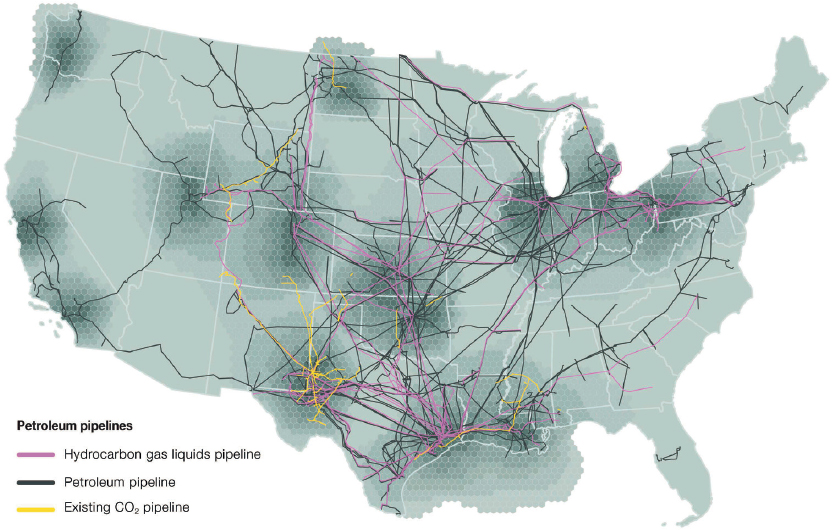
As of 2020, there were 5,150 miles of pipelines for supercritical fluid CO2 transport in the United States, controlled by 32 different pipeline operators, with the largest pipeline networks in the Gulf Coast, Permian Basin, and Rocky Mountain areas (CEQ 2021; NPC 2021b; PHMSA 2022c). An additional 60 miles of CO2 pipelines transport CO2 in the gaseous state (CEQ 2021). The existing CO2 pipeline network is shown by the yellow lines in Figure 2-6. Pipelines for transporting CO2 as a supercritical fluid have the capacity to move 890 to 103,000 tonnes of CO2 per day depending on their length and diameter and must be maintained above 1,080 psi (NPC 2021b).
Approximately 90 percent of the CO2 pipeline infrastructure in the United States is used for EOR and primarily connects geologic CO2 sources with depleted oil reservoirs (Edwards and Celia 2018; NPC 2021b). As of the end of 2020, U.S. EOR operations used 1.6 billion cubic feet of CO2 per day (Bcf/d), 1.3 Bcf/d from geologic sources and 0.3 Bcf/d from industrial sources (ARI 2021), which is equivalent to about 67,000 tonnes/day from geologic sources and 16,000 tonnes/day from industrial sources. EOR is not within the scope of CO2 utilization as defined in this report (see Box 1-2). Nonetheless, the existing infrastructure and over 50 years of experience transporting CO2 for EOR can be leveraged when developing future CO2 utilization infrastructure.
Pipeline transport has the benefit of achieving economies of scale for large volumes of CO2, but its development has high capital costs (NPC 2021b). Using the National Energy Technology Laboratory’s CO2 transport cost model, the Great Plains Institute estimated costs for capital investment as well as operation and maintenance of CO2 pipelines, finding that large, shared trunk lines transporting greater than 12 million tonnes CO2 per year could cost less than $10/tonne CO2, while small feeder lines transporting less than 4 million tonnes of CO2 per year could cost in excess of $20/tonne CO2 (Abramson et al. 2020).2 Actual costs for CO2 pipeline construction have varied widely due to geographic and right-of-way considerations for different projects (e.g., costs of acquisition, permitting, and construction). For example, pipeline costs for six projects completed since 2009 ranged from $68,635 to $199,176 per diameter inch mile (NPC 2021b). In general, an
___________________
2 See the appendix of Abramson et al. (2020) for details about the methodology used to make these cost estimates.
NOTES: Hydrocarbon gas liquids (HGLs) are defined as hydrocarbons that exist in the gas phase at atmospheric pressure and in the liquid phase at higher pressures. HGLs include alkanes such as ethane, propane, butane, and pentane, and alkenes such as ethylene, propylene, and butylene (EIA 2021).
SOURCE: Adapted from E. Abramson, E. Thomley, and D. McFarlane, 2022, An Atlas of Carbon and Hydrogen Hubs for United States Decarbonization, Minneapolis, MN: Great Plains Institute, https://scripts.betterenergy.org/CarbonCaptureReady/GPI_Carbon_and_Hydrogen_Hubs_Atlas.pdf.
inverse relationship between cost per tonne CO2 and volume of CO2 transported is expected and argues for coordinated infrastructure development (Abramson et al. 2020). Oversizing of pipeline infrastructure is more cost-effective in the long term because it can allow for future expansion without the environmental impacts of an additional pipeline project. Section 6.1 provides more information about funding and investment opportunities for shared pipeline development.
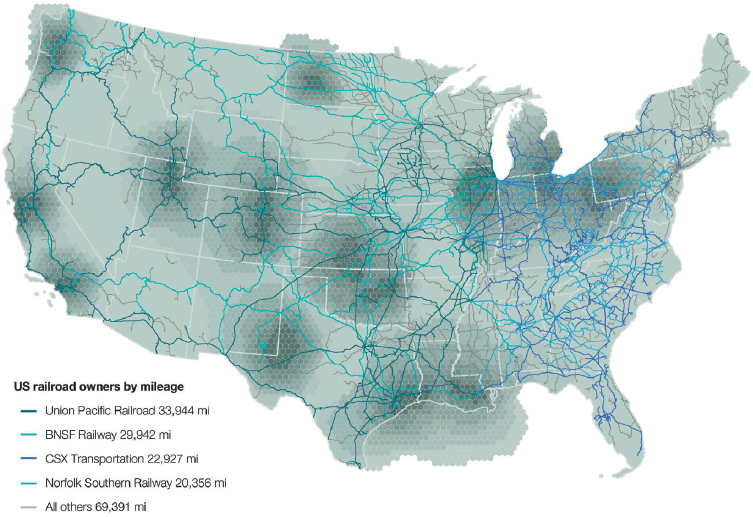
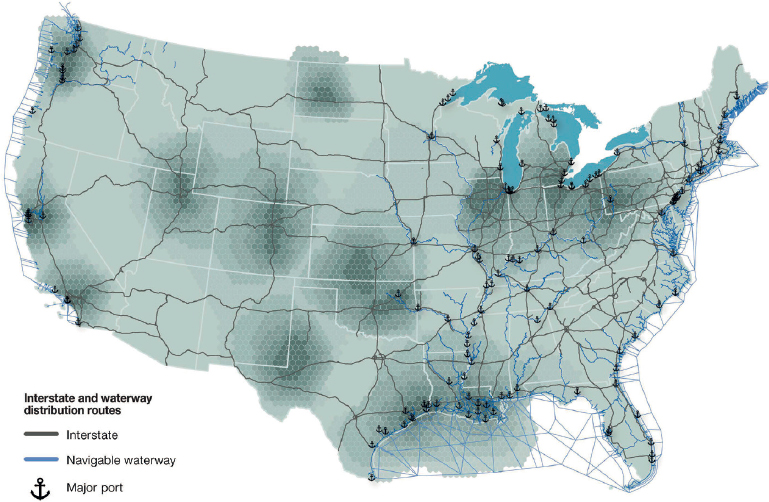
2.3.2 Other Transportation Methods
Alternative modes of CO2 transport include truck, rail, ship, and barge. Figure 2-7 shows the rail lines used in the contiguous United States for fuel transport, and Figure 2-8 shows U.S. interstates and navigable waterways. Truck and rail transport are most viable for shorter distances (less than 200 miles for truck and less than 1,000 miles for rail) and for smaller CO2 volumes (up to several hundred tonnes) but typically cost about 3–10 times more per tonne CO2 than pipeline transport (NPC 2021b). Currently, the beverage industry is the primary user of truck CO2 transport, carrying 18 tonnes of CO2 per truck (NPC 2021b). Ship and barge transport can be used for crossing large bodies of water or navigating intercoastal waterways, respectively; neither option is used widely as of the writing of this report, though ship transport is gaining interest in Europe, notably as part of the Northern Lights project in Norway (Northern Lights 2021; NPC 2021b). For CCS applications, ship transport could provide some flexibility for use at either onshore or offshore storage locations (ZEP 2011). Ship transport can also be cost-effective, but siting pressurized CO2 shipping and receiving terminals requires consideration of public safety concerns (NPC 2021b).
SOURCE: E. Abramson, E. Thomley, and D. McFarlane, 2022, An Atlas of Carbon and Hydrogen Hubs for United States Decarbonization, Minneapolis, MN: Great Plains Institute, https://scripts.betterenergy.org/CarbonCaptureReady/GPI_Carbon_and_Hydrogen_Hubs_Atlas.pdf.
SOURCE: E. Abramson, E. Thomley, and D. McFarlane, 2022, An Atlas of Carbon and Hydrogen Hubs for United States Decarbonization, Minneapolis, MN: Great Plains Institute, https://scripts.betterenergy.org/CarbonCaptureReady/GPI_Carbon_and_Hydrogen_Hubs_Atlas.pdf.
2.3.3 Co-located CO2 Capture and Use
Currently, no commercial-scale facilities in the United States co-locate capture and use of CO2 for purposes other than EOR or urea production. Some government–industry collaborations test and research real-world operating conditions for co-located CO2 capture and utilization (CCU), for example, at Wyoming’s Integrated Test Center and the National Carbon Capture Center (National Carbon Capture Center 2022; Wyoming ITC n.d.). The XPRIZE Foundation’s NRG COSIA Carbon XPRIZE supported testing of breakthrough CO2 utilization technologies, providing the competition’s finalist teams with access to power plant flue gas and testing bays equipped with other necessary inputs such as electricity and water (XPRIZE n.d.). The U.S. Department of Energy (DOE) is providing funding for two front-end engineering design (FEED) studies to integrate DAC with CO2 conversion technologies, one to generate concrete and the other to electrochemically produce formic acid (DOE-FECM 2022).
Also under development are systems for “capture and conversion,” or “reactive capture,” which integrate CO2 separation from waste gas and conversion to product in a single step. Whereas traditional CO2 “capture and release” is limited by the need for weak capture binding energy that results in lower capture efficiency, “capture and conversion” enables stronger binding free energies for the capture step, resulting in more efficient systems that require less sorbent material and energy (Omodolor et al. 2020; Shao et al. 2022). Desorption is accomplished by first reacting the captured CO2, for example, with hydrogen or electrochemically, producing a less strongly sorbed product that can be released at low energy cost, while also forming a higher-value-added product using the same sorbent and system (“process intensification”). Capture and conversion technology is much less mature (technology readiness level <5) than traditional carbon capture but is an active area of research to reduce costs for CCU (Deutsch et al. 2021).
Co-location of CO2 capture and conversion facilities provides the potential to reduce transportation costs and energy footprints, and can synergistically align regulatory requirements. These opportunities must be identified on a case-by-case basis, aligning CO2 source (fossil versus biogenic or atmospheric) with duration of product end use or end-of-life sequestration, to ensure sustainable outcomes. Project developers will need to consider the future availability of CO2 point sources, particularly fossil sources, before making investments in capital-intensive conversion processes and infrastructure. These challenges in some cases may require flexible and adaptive enabling infrastructure to match distributed electricity, hydrogen production, and other inputs with distributed CO2 capture and utilization processes, and end-use applications.
2.3.4 CO2 Storage Infrastructure
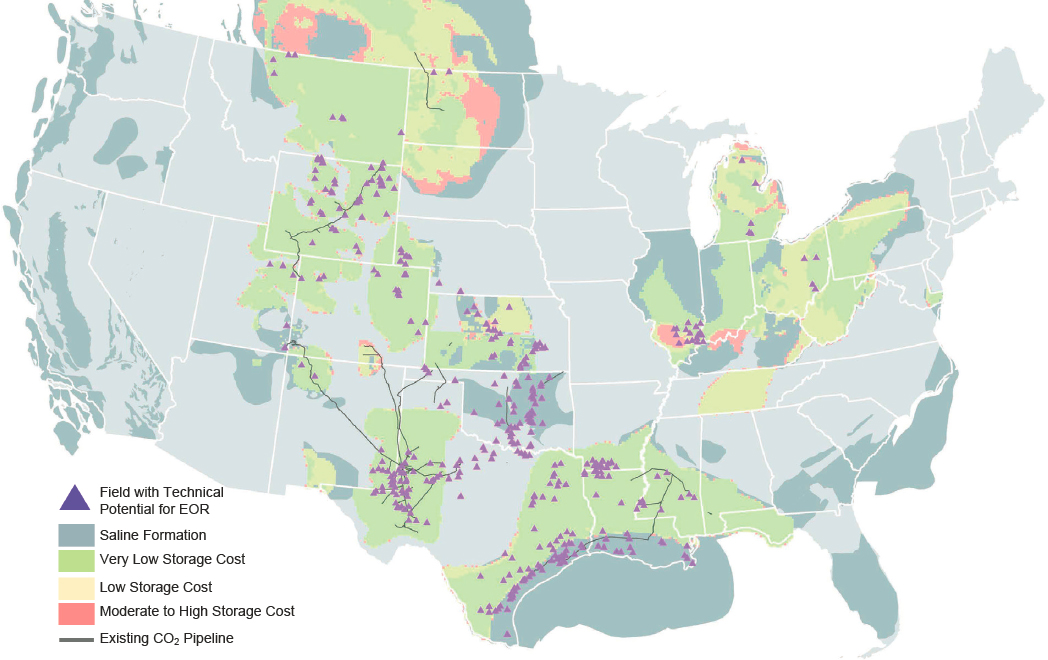
To achieve a net-zero emissions future, the endpoint of most captured CO2 probably will need to be long-term geologic storage.3 As noted above, much of the existing CO2 pipeline infrastructure has been developed to inject CO2 underground for EOR. Only 1 of the 12 commercial CCS facilities in the United States is currently injecting CO2solely for the purpose of storage (and not for EOR): the Archer Daniels Midland plant in Illinois, which captures and stores about 3,000 tonnes of CO2 per day from a bioethanol plant (Jones and Lawson 2021; NPC 2021a). The other 11 facilities inject CO2 only for EOR. For secure underground storage of CO2, the geology must include a storage reservoir with the porosity to hold CO2 and the permeability to accommodate injection, situated underneath an impermeable rock formation to minimize CO2 leakage (LEP 2021). Geologic formations considered for storage include depleted oil and gas reservoirs, deep saline reservoirs, and unmineable coal seams. Estimates of storage capacity in the United States range from 2.6 to 22 trillion tonnes CO2, pending future evaluation of the suitability of sites for proximity to CO2 sources, porosity, permeability, and potential for leakage (Jones and Lawson 2021). Figure 2-9 shows potential CO2 storage sites in the United States and their proximity to existing CO2 pipelines, indicating those sites that are expected to have very low (green) and low (yellow) storage costs,
___________________
3 Best practices have been established for monitoring and verification of CO2 storage to ensure safety and permanence. These involve considerations of risks that could result in CO2 leakage over the long term (e.g., hundreds of years) (NETL 2017a). As one example, use of depleted hydrocarbon reservoirs for CO2 storage can mitigate seismicity risks related to CO2 injection (Dvory and Zoback 2021). Financial risks and liabilities that extend beyond a CCS project’s operational lifetime also need to be considered and addressed (Donlan and Trabucchi 2011), but doing so is beyond the scope of this study.
SOURCE: Adapted from E. Abramson, D. McFarlane, and J. Brown, 2020, Transport Infrastructure for Carbon Capture and Storage Whitepaper on Regional Infrastructure for Midcentury Decarbonization, Minneapolis, MN: Great Plains Institute, https://www.betterenergy.org/wp-content/uploads/2020/06/GPI_RegionalCO2Whitepaper.pdf.
respectively. DOE’s cost estimates for CO2 storage in the United States range from $7 to $13/t CO2 (2013$), depending on the depth of the geologic formation and the number of injection wells needed, the volume and purity of the CO2 for storage, the current use of the land, and the capability for surface and subsurface monitoring (NPC 2021a). Detailed discussion of CO2 storage costs is outside the scope of this report, but more information on CCS costing methodologies can be found in Rubin et al. (2013), and estimates for specific projects can be made using the National Energy Technology Laboratory’s CO2 Saline Storage Cost Model (NETL 2017b).
2.4 STATUS OF ENABLING INFRASTRUCTURE FOR CO2 UTILIZATION
Enabling infrastructure for CO2 utilization encompasses the sourcing and transport of other feedstocks and components needed to manufacture CO2-derived products. An important aspect of project development is considering the energy and fuel consumption requirements for capturing CO2. As will be further discussed in Chapter 3, clean energy and hydrogen are required in large amounts to upgrade CO2 into hydrocarbon products. Thus, expansion of CO2 utilization for products encompassing large sectors of the U.S. economy, including fuels and chemicals, would require extensive expansion of infrastructure for clean electricity and hydrogen. Water may be required (e.g., for on-site generation of hydrogen or process cooling), and wastewater may be generated that requires treatment. This section overviews the status of enabling infrastructure for CO2 utilization, specifically clean electricity, hydrogen, water, and natural gas.
2.4.1 Clean Electricity
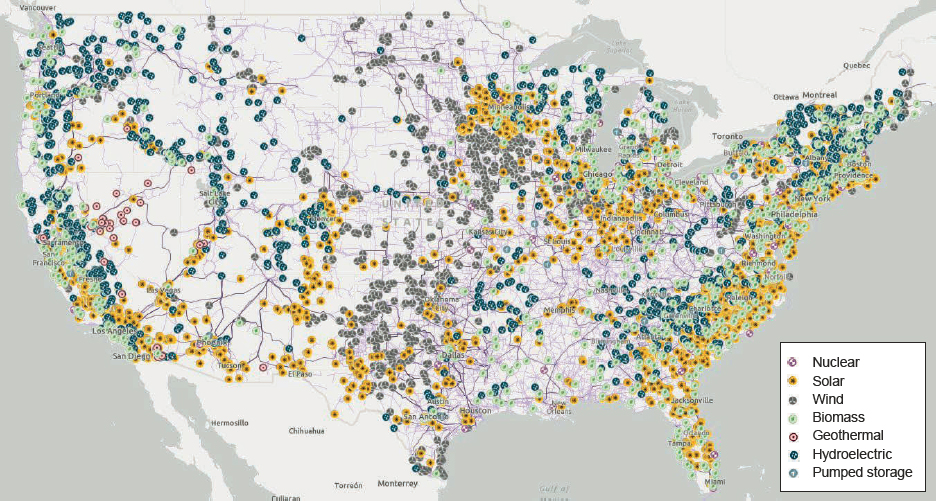
The electrical grid in the United States is undergoing a transformation from majority fossil-based to predominantly low-carbon sources, including renewable wind and solar, hydro, geothermal, nuclear, and natural gas or biomass with CCS. In 2021, 61 percent (2,504 billion kilowatt hours [kWh]) of U.S. electricity generation came from fossil sources, 19 percent (778 billion kWh) came from nuclear, and 20 percent (826 billion kWh) came from renewables (wind, hydropower, solar, geothermal, and biomass) (EIA 2022). Figure 2-10 shows the locations of non-fossil electricity generating facilities in the United States. Clean electricity will become the most important vector for decarbonizing energy-consuming sectors, including transportation, building heating and hot water, and industry. Electricity demand will increase significantly to achieve net-zero goals. For example, converting from petroleum-fueled vehicles to highly efficient battery electric vehicles will shift energy consumption from petroleum to electricity, placing increasing demand on grid utilization. Changes to manufacturing that replace thermally driven processes with electrically driven ones will further increase electricity demand. Projections of electricity demand for a net-zero economy in the United States range from 6,000 to 10,500 terawatt hours (TWh) in 2050, depending on the assumptions used in modeling; regardless, all represent significant increases from the current electricity demand, approximately 4,000 TWh in 2019 (Holmes et al. 2021).
Current U.S. roadmaps for electricity system expansion include electrification of transportation and in some cases residential heating, but generally lack significant consideration of electrification needs for industrial process decarbonization (see, e.g., Larson et al. 2021; Murphy et al. 2021). Many industrial processes currently proposed for CO2 utilization are capital intensive, given the complexity of the facilities, the multiple steps involved, and/or the high operating temperatures and pressures. In these cases, the most economically efficient and safest operational profile would be 24/7. Grid interconnection and energy storage therefore can become important enablers to maintain constant operation with net-zero carbon electricity inputs, given the intermittency of appropriately sized renewable energy generation. Geothermal energy and hydroelectric power can provide dispatchable renewable electricity but are limited in location and scope. Long-term energy storage is expected to be particularly important
SOURCE: Adapted from U.S. Energy Information Administration, 2021, “Map of the Electricity Infrastructure in the U.S.,” https://atlas.eia.gov/apps/electricity/explore.
in future energy systems with significantly increased power generation from wind and solar (Dowling et al. 2020; Shaner et al. 2018). Without energy storage, simpler low-capital-expenditure processes operating with few process steps, at lower pressures, and requiring less heat integration may be considered if electricity inputs are intermittent. Potential examples of such processes include some mineralization or biological CO2 conversion approaches that are envisioned as having lower capital costs; however, there are limited operating examples, so this possibility has yet to be proven. Historically in its FutureGen and Vision21 programs, and today in its Integrated Energy Systems Program, DOE has studied operational strategies for power plants that use power at times of low electricity demand to make storable fuels. Learning from these programs can be leveraged for potential intermittent use of electricity by CO2 utilization projects.
2.4.2 Hydrogen
Hydrogen will be an important input to many CO2 utilization processes. The United States produces approximately 11 million tonnes of hydrogen annually. Current primary uses of hydrogen include petroleum refining to fuels and chemicals, food processing (e.g., hydrogenation of vegetable oils), and production of fertilizer. Studies estimate that for hydrogen to serve as a clean energy vector and contribute to achieving net-zero goals, a fivefold or more increase in its use may be required (FCHEA 2020; Ruth et al. 2020; World Energy Council 2021). Consequently, a substantial expansion in production, storage, and distribution facilities also would be needed. The majority (~77 percent) of hydrogen produced annually in the United States is generated via SMR, with 23 percent produced as a by-product of petroleum refining and other industrial processes and less than 1 percent from water electrolysis (EFI 2021). Use of hydrogen in a future net-zero emissions system will require decarbonization of production. Generation of clean hydrogen from natural gas with CCS has been demonstrated at commercial scale (Global CCS Institute 2021), and advanced technologies (e.g., autothermal reforming and partial oxidation) are known commercially to integrate better with carbon capture than existing technologies. Another method for producing clean hydrogen is water electrolysis using low-carbon electricity; as of May 2022, there were 18.5 megawatts (MW) installed electrolysis capacity and 602.6 MW planned capacity located across the United States (DOE 2022; see Figure 2-11).4 Methane pyrolysis to generate hydrogen and solid carbon, with no CO2 emissions, is the subject of ongoing research and development with one facility having achieved commercial scale as of June 2022 (PARC 2022).
Much hydrogen is used on the site of production. When required, hydrogen transport from the site of production to the site of use occurs mostly by pipeline, or alternatively via tube trailer and tanker truck or, for larger volumes, by rail or ship (DOE 2020). The United States currently has about 1,600 miles of hydrogen pipelines supported by a private pipeline network primarily located in the Gulf Coast (DOE-EERE n.d.), as shown in Figure 2-12. This existing network could provide some connectivity and rights-of-way for future expansion. Gaseous hydrogen delivery by tube trailer is currently a common method to match supply and demand in relatively small quantities, about 1–2 tonnes per tube trailer. Tanker trucks can accommodate about five times more hydrogen than tube trailers, given that they transport hydrogen in liquid form, which maintains purity better than gaseous hydrogen transport (DOE 2020). However, liquefying hydrogen for transport in tanker trucks has significant energy requirements: state-of-the-art liquefaction systems add about 12 kWh/kg to the energy requirements for hydrogen production and storage, which represents about one-third of the energy required to produce hydrogen (33 kWh/ kg) at the limit of 100 percent efficiency (IDEALHy n.d.). Industry and DOE research targets aim ultimately to reduce the specific power consumption to 6 kWh/kg (DOE-HFTO n.d.). In some cases, hydrogen requires storage before or after transport; its storage as a compressed gas (350 to 700 bar, or about 5,080 to 10,150 psi) and as a cryogenic liquid are well known but require additional development and deployment to decrease costs and increase capacity (DOE 2020). As further discussed in Chapter 4, for some CO2 utilization applications, on-demand, on-site hydrogen production may be preferable to avoid the costs and challenges of transport and storage.
___________________
4 In the upper limit of production, assuming a 100 percent capacity factor and 100 percent efficient electrolyzer, the installed electrolysis capacity would generate about 4,860 tonnes H2 per year, and the installed plus planned capacity would generate around 163,000 tonnes H2 per year.

SOURCE: U.S. Department of Energy, 2022, “PEM Electrolyzer Capacity Installations in the United States,” DOE Hydrogen Program Record 22001, https://www.hydrogen.energy.gov/pdfs/22001-electrolyzers-installed-in-united-states.pdf.
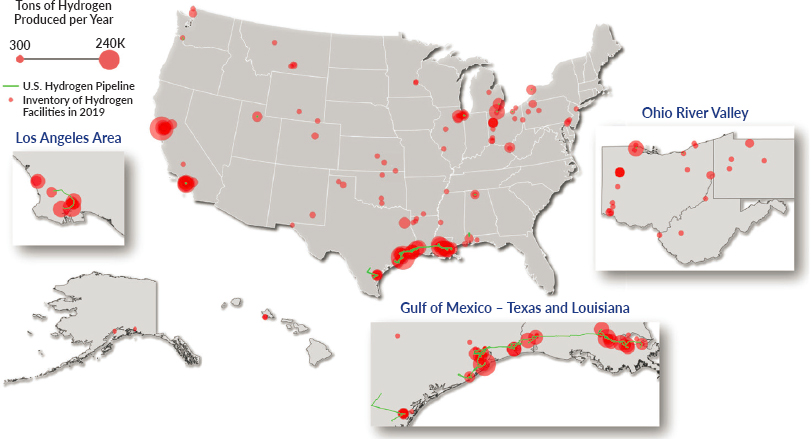
NOTES: Figures 2-11 and 2-12 use different units to depict the amount of hydrogen production, megawatts and tons per annum, respectively. Converting from megawatts to tons of hydrogen requires knowing the capacity factor and electrolyzer efficiency; in the upper limit, assuming a 100 percent capacity factor and 100 percent efficient electrolyzer, a 1-MW electrolyzer would produce 290 tons (260 tonnes) of hydrogen in 1 year.
SOURCE: Energy Futures Initiative, 2021, The Future of Clean Hydrogen in the United States: Views from Industry, Market Innovators, and Investors, Part of the EFI Report Series From Kilograms to Gigatons: Pathways for Hydrogen Market Formation in the United States, Washington, DC, https://energyfuturesinitiative.org/wp-content/uploads/sites/2/2022/03/The-Futureof-Clean-Hydrogen-in-the-U.S._Report-1.pdf.
2.4.3 Water
Water is a required input for several aspects of CCU, including for CO2 capture, hydrogen generation, and production of the utilization product, especially for biological CO2 utilization processes that need water for algae and other microbe cultivation. Water use in the United States is documented by the U.S. Geological Survey; their most recent assessment in 2015 estimated self-supplied industrial water use at 14,800 million gallons per day, of which 95 percent is freshwater, and thermoelectric power water use at 133,000 million gallons per day, of which 87 percent is freshwater (Dieter et al. 2018). The energy sector accounts for approximately 10 percent of U.S. water consumption and 40 percent of U.S. water withdrawals (Grubert and Sanders 2018). Figure 2-13 shows total water withdrawals by state, with a darker blue coloration indicating higher water withdrawals. Notably, some of the highest-withdrawal states, for example, Texas and California, are also those with the greatest risk of water stress, a metric comparing water demand with water supply (see Figure 2-14). In these locations, desalination may be required to obtain sufficient freshwater for the desired application. Desalination costs need to be considered in the capital expenditures but are generally lower than the impact of electrolyzer capital expenditures or the cost of electricity; as an example, the additional energy requirements to perform desalination by reverse osmosis are estimated to result in added costs of $0.01–0.02 per kg hydrogen produced by electrolysis (Beswick et al. 2021).
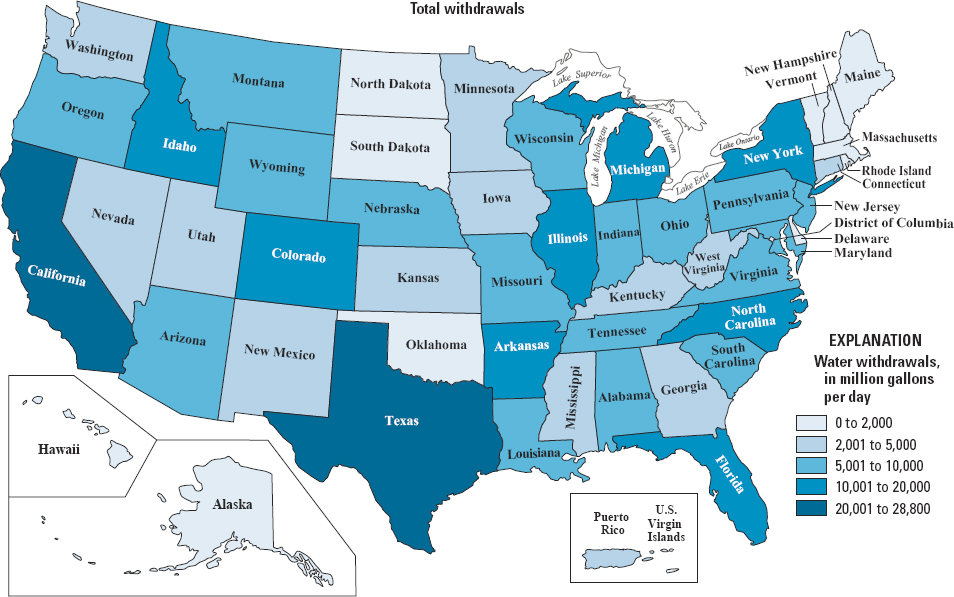
SOURCE: C.A. Dieter, M.A. Maupin, R.R. Caldwell, et al., 2018, Estimated Use of Water in the United States in 2015, Water Availability and Use Science Program, Circular 1441 (supersedes USGS Open-File Report 2017-1131), Reston, VA: U.S. Geological Survey, https://pubs.usgs.gov/circ/1441/circ1441.pdf.
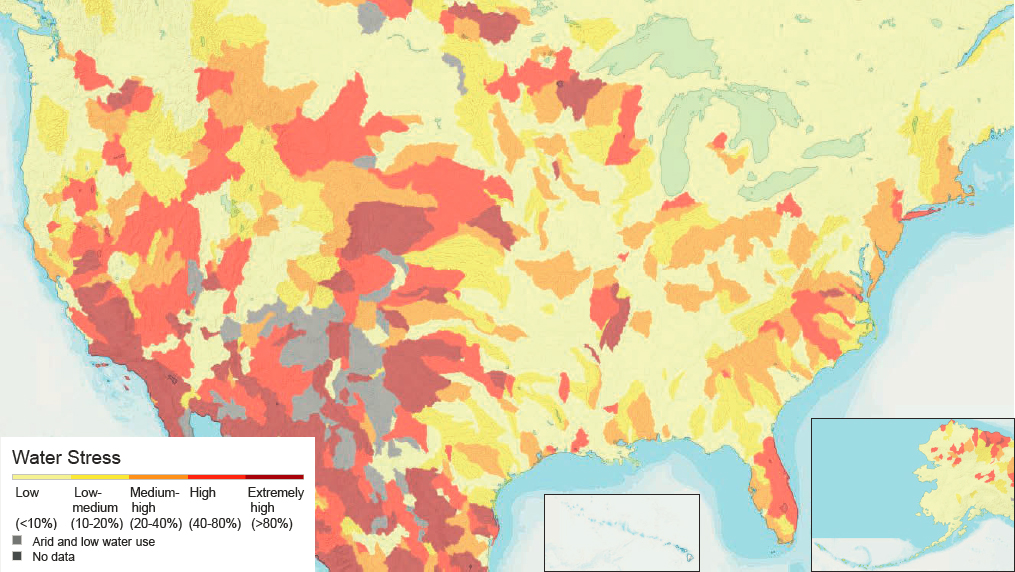
SOURCE: World Resources Institute, 2019, “Aqueduct Water Risk Atlas,” wri.org/aqueduct. CC BY 4.0.
2.4.4 Natural Gas
The U.S. natural gas infrastructure is well established and mature across the country (see Figure 2-15), with about 17,000 miles of gathering pipelines, 300,000 miles of transmission pipelines, and 2.3 million miles of distribution pipelines as of 2021 (PHMSA 2022a,b). When paired with CCS, natural gas can generate clean hydrogen and electricity. Natural gas usage is projected to decline globally in the coming decades in response to the transition to net-zero emissions, but the extent of this decline will depend on how much clean electricity and hydrogen is generated via natural gas with CCS versus via renewable or clean electricity. The United States has abundant natural gas reserves and infrastructure relative to future demand scenarios and is cost advantaged for production of clean hydrogen from natural gas and CCS.
As the country moves toward a future net-zero economy, natural gas will be gradually replaced by electricity or hydrogen for many end-use applications, potentially creating opportunities to repurpose the associated infrastructure. However, some scenarios, mostly depending on the energy price, anticipate the use of natural gas beyond mid-century, and low-carbon-intensity or renewable natural gas will likely remain energy sources for decades, presenting a coordination challenge during the transition. In any case, converting the remaining available natural gas pipelines to CO2 trunk lines for capture and use or to hydrogen pipelines as a clean replacement for natural gas will be limited by metallurgical and/or pressure constraints, as discussed further in Sections 4.3.4 and 4.5.2. However, pipeline rights-of-way may be important for supportive infrastructure such as H2 pipelines to enable clean transportation, energy storage, and industrial heating, as well as for manufacture of synthetic fuels and chemicals from CO2.
Utilizing existing natural gas pipeline infrastructure for CO2 transport provides a potential opportunity to address some of the myriad challenges associated with the buildout of pipelines. Pipeline projects are currently facing unprecedented pushback associated with societal and safety concerns (see, e.g., Payne 2021; PHMSA 2022d,e; Wittenberg 2022). These concerns need to be acknowledged and addressed through a transparent, inclusive process so as not to foster or perpetuate misinformation. The use of existing natural gas pipelines to transport CO2 in gaseous form reduces this development risk, as it allows existing infrastructure to be used with fewer or no
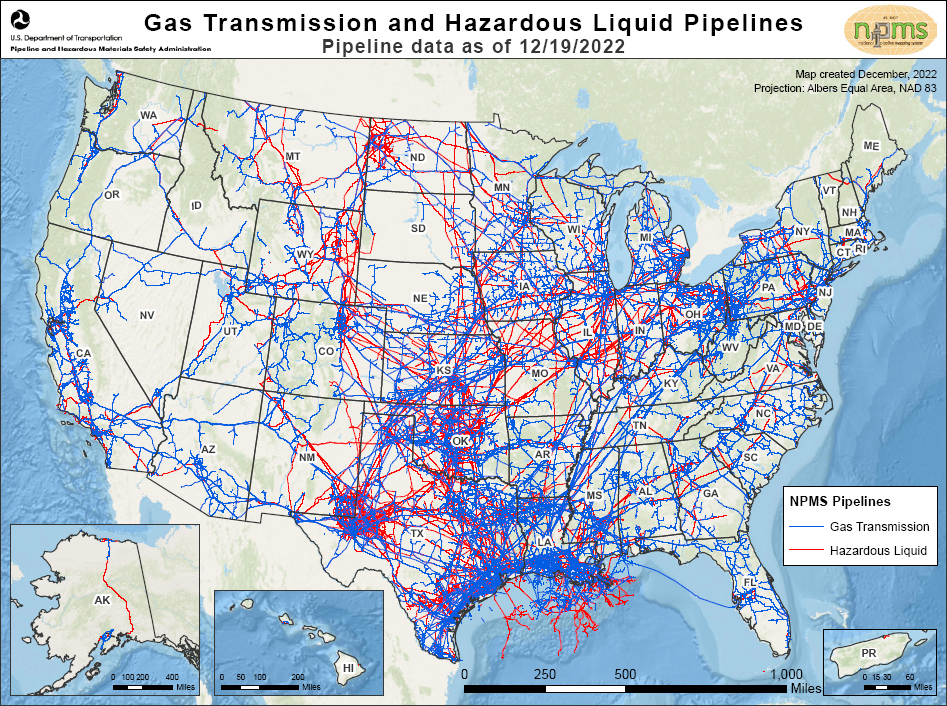
SOURCE: National Pipeline Mapping System, 2022, “Gas Transmission and Hazardous Liquid Pipelines.” U.S. Department of Transportation Pipeline and Hazardous Materials Safety Administration, https://www.npms.phmsa.dot.gov/Documents/NPMS_Pipelines_Map.pdf.
added surface impacts. However, as discussed in Section 4.3, transporting CO2 in the supercritical phase is much more economically viable than gas-phase transportation, and requires a higher transportation pressure than the safe operating pressure of natural gas pipelines. Therefore, achieving the scale of CCS or CCU necessary to meet climate objectives is unlikely to occur by relying solely on existing natural gas pipeline infrastructure. Section 4.3.4 provides more detail on considerations for retrofitting natural gas pipelines to transport CO2.
id="chapter02_pz50-5">2.5 FINDINGS ON EXISTING INFRASTRUCTURE FOR CO2 UTILIZATIONFINDING 2.1 Barriers to Commercialization. As of 2022, few commercial processes transform CO2 into useful products. Motivation to produce CO2-derived products is limited because most products utilizing CO2 are currently more expensive to produce than incumbents, especially fossil-fuel-derived products. Additionally, there are no requirements and limited global incentives in place to produce carbon-based products that can be certified as net-zero emissions. The availability of net-zero-carbon electricity, hydrogen, and heat is still limited, hindering their use in net-zero-emissions chemical and material production.
FINDING 2.2 Enhanced Oil Recovery. Enhanced oil recovery (EOR) currently accounts for the largest volume of CO2 use in the United States, around 91,000 tons CO2 per day as of 2020, primarily sourced from geologic
CO2 reservoirs. The use of CO2 for EOR is not a sustainable CO2 utilization process, because it facilitates further fossil-fuel production and does not involve a chemical transformation of CO2 into a product.
FINDING 2.3 Existing CO2 Infrastructure. The majority of the existing infrastructure that could be used for carbon capture, utilization, and storage (CCUS) in the United States has been developed for EOR, and most CO2 pipelines connect geologic or fossil sources of CO2 with depleted oil reservoirs. These sources and sinks are generally not aligned with opportunities for sustainable CO2 utilization in a net-zero emissions future, thereby limiting the opportunities to leverage existing infrastructure for development of CO2 utilization processes.
FINDING 2.4 Co-location of CO2 Capture and Use. Some CO2 utilization processes can use flue gas directly (e.g., reactive capture) or be performed in situ at the point of CO2 capture, both of which avoid the costs of CO2 compression and transport. The feasibility of co-locating CO2 capture and utilization will be influenced by the nature of the emissions source and the utilization process and product, economic viability, as well as the availability of other required low-carbon-emission energy sources (e.g., electricity and hydrogen) and infrastructure to transport the utilization product.
FINDING 2.5 Infrastructure for CO2 Storage. To meet net-zero emissions goals, and given the much larger volumes of CO2 that can be geologically stored versus used in products, most CO2 captured from point sources, the atmosphere, and bodies of water will need to be sequestered in long-term geologic storage. Large-scale infrastructure for CCS will need to be developed in the coming decade, with some of this infrastructure potentially able to serve CO2 utilization projects.
FINDING 2.6 Existing Hydrogen Infrastructure. The current U.S. infrastructure for hydrogen production and distribution—located almost entirely in the Gulf Coast region—supports a market for refining of petroleum into hydrocarbon fuels and petrochemicals that is anticipated to decline as the world transitions to net-zero emissions, as well as growing markets for hydrogen as a fuel, for use in ammonia production for fertilizer, and potentially as an energy carrier. The addition of carbon capture would allow the current hydrogen infrastructure for petroleum refining to be rededicated to future markets including sustainable CO2 utilization products.
2.6 REFERENCES
Abramson, E., D. McFarlane, and J. Brown. 2020. Transport Infrastructure for Carbon Capture and Storage: Whitepaper on Regional Infrastructure for Midcentury Decarbonization. Minneapolis, MN: Great Plains Institute. https://www.betterenergy.org/wp-content/uploads/2020/06/GPI_RegionalCO2Whitepaper.pdf.
Abramson, E., E. Thomley, and D. McFarlane. 2022. An Atlas of Carbon and Hydrogen Hubs for United States Decarbonization. Minneapolis, MN: Great Plains Institute. https://scripts.betterenergy.org/CarbonCaptureReady/GPI_Carbon_and_Hydrogen_Hubs_Atlas.pdf.
Arcadia eFuels. 2022. “Arcadia eFuels Announces Its First eFuels Plant Location in Vordingborg, Denmark.” https://www.arcadiaefuels.com/arcadia-efuels-announces-its-first-efuels-plant-location-in-vordingborg-denmark.
ARI (Advanced Resources International). 2021. “The U.S. CO2 Enhanced Oil Recovery Survey.” https://adv-res.com/pdf/ARI-2021-EOY-2020-CO2-EOR-Survey-OCT-21-2021.pdf.
Asahi Kasei Corporation. 2021. “Asahi Kasei Licenses Technology Package to Manufacture High-Purity Ethylene Carbonate and Dimethyl Carbonate Using CO2 as Main Feedstock.” https://www.asahi-kasei.com/news/2021/e210701.html.
Beswick, R.R., A.M. Oliveira, and Y. Yan. 2021. “Does the Green Hydrogen Economy Have a Water Problem?” ACS Energy Letters 6(9):3167–3169. https://doi.org/10.1021/acsenergylett.1c01375.
Bright, M. 2020. “Mapping the Progress and Potential of Carbon Capture, Use, and Storage.” Third Way. June 1, 2020. https://www.thirdway.org/memo/mapping-the-progress-and-potential-of-carbon-capture-use-and-storage.
Bruhwiler, L., A.M. Michalak, R. Birdsey, J.B. Fisher, R.A. Houghton, D.N. Huntzinger, and J.B. Miller. 2018. “Chapter 1: Overview of the Global Carbon Cycle.” Pp. 42–70 in Second State of the Carbon Cycle Report. Sustained Assessment, N. Cavallaro, G. Shrestha, R. Birdsey, M.A. Mayes, R.G. Najjar, S.C. Reed, P. Romero-Lankao, and Z. Zhu, eds. Washington, DC: U.S. Global Change Research Program. https://doi.org/10.7930/SOCCR2.2018.Ch1.
Burkart, M.D., N. Hazari, C.L. Tway, and E.L. Zeitler. 2019. “Opportunities and Challenges for Catalysis in Carbon Dioxide Utilization.” ACS Catalysis 9(9):7937–7956. https://doi.org/10.1021/acscatal.9b02113.
Carbon Recycling International. n.d. “George Olah Renewable Methanol Plant: First Production of Fuel from CO2 at Industrial Scale.” https://www.carbonrecycling.is/project-goplant.
CEQ (Council on Environmental Quality). 2021. Council on Environmental Quality Report to Congress on Carbon Capture, Utilization, and Sequestration. Washington, DC. https://www.whitehouse.gov/wp-content/uploads/2021/06/CEQ-CCUS-Permitting-Report.pdf.
Circular Carbon Network. 2022. “Innovator Index.” https://circularcarbon.org/innovator-index.
Constantz, B.R., M.A. Bewernitz, C.L. Camiré, S.-H. Kang, J. Schneider, and R.R. Wade. 2015. “Bioinspired Concrete.” Pp. 297–308 in Biotechnologies and Biomimetics for Civil Engineering, F.P. Torgal, J.A. Labrincha, M.V. Diamanti, C.-P. Yu, and H.K. Lee, eds. Cham: Springer International Publishing. https://doi.org/10.1007/978-3-319-09287-4_13.
DAC (Direct Air Capture) Coalition. 2022. “The DAC Coalition: Technology Companies and Partners Working Together to Advance DAC Deployment.” https://daccoalition.org/the-coalition.
Deutsch, T.G., S. Baker, P. Agbo, D.R. Kauffman, J. Vickers, and J.A. Schaidle. 2021. “Summary Report of the Reactive CO2 Capture: Process Integration for the New Carbon Economy Workshop, February 18–19, 2020.” Technical Report NREL/ TP-5100-78466. Golden, CO: National Renewable Energy Laboratory. https://www.nrel.gov/docs/fy21osti/78466.pdf.
Dieter, C.A., M.A. Maupin, R.R. Caldwell, M.A. Harris, T.I. Ivahnenko, J.K. Lovelace, N.L. Barber, and K.S. Linsey. 2018. Estimated Use of Water in the United States in 2015. Water Availability and Use Science Program. Circular 1441 (supersedes USGS Open-File Report 2017-1131). Reston, VA: U.S. Geological Survey. https://pubs.usgs.gov/circ/1441/circ1441.pdf.
DiPietro, P., P. Balash, and M. Wallace. 2012. “A Note on Sources of CO2 Supply for Enhanced-Oil-Recovery Operations.” SPE Economic & Management 4(2):69–74.
DOE (U.S. Department of Energy). 2020. Department of Energy Hydrogen Program Plan. Washington, DC. https://www.hydrogen.energy.gov/pdfs/hydrogen-program-plan-2020.pdf.
DOE. 2021. “DOE Announces $12 Million for Direct Air Capture Technology.” https://www.energy.gov/articles/doe-announces-12-million-direct-air-capture-technology.
DOE. 2022. “PEM Electrolyzer Capacity Installations in the United States.” DOE Hydrogen Program Record 22001. https://www.hydrogen.energy.gov/pdfs/22001-electrolyzers-installed-in-united-states.pdf.
DOE-EERE (Office of Energy Efficiency & Renewable Energy). n.d. “Hydrogen Pipelines.” https://www.energy.gov/eere/fuelcells/hydrogen-pipelines.
DOE-FECM (Office of Fossil Energy and Carbon Management). 2022. “Selections for Funding Opportunity Announcement 2560: Direct Air Capture Combined with Dedicated Long-Term Carbon Storage, Coupled to Existing Low-Carbon Energy.” https://www.energy.gov/fecm/articles/selections-funding-opportunity-announcement-2560-direct-air-capture-combined.
DOE-HFTO (Hydrogen and Fuel Cell Technologies Office). n.d. “DOE Technical Targets for Hydrogen Delivery.” https://www.energy.gov/eere/fuelcells/doe-technical-targets-hydrogen-delivery.
Donlan, M., and C. Trabucchi. 2011. “Valuation of Consequences Arising from CO2 Migration at Candidate CCS Sites in the US.” Energy Procedia 4:2222–2229. https://doi.org/10.1016/j.egypro.2011.02.110.
Dowling, J.A., K.Z. Rinaldi, T.H. Ruggles, S.J. Davis, M. Yuan, F. Tong, N.S. Lewis, and K. Caldeira. 2020. “Role of Long-Duration Energy Storage in Variable Renewable Electricity Systems.” Joule 4(9):1907–1928. https://doi.org/10.1016/j.joule.2020.07.007.
Dvory, N.Z., and M.D. Zoback. 2021.” Prior Oil and Gas Production Can Limit the Occurrence of Injection-Induced Seismicity: A Case Study in the Delaware Basin of Western Texas and Southeastern New Mexico, USA.” Geology 49(10):1198–1203. https://doi.org/10.1130/G49015.1.
Edwards, R.W.J., and M.A. Celia. “Infrastructure to Enable Deployment of Carbon Capture, Utilization, and Storage in the United States.” Proceedings of the National Academy of Sciences 115(38):E8815–E8824. https://doi.org/10.1073/pnas.1806504115.
EFI (Energy Futures Initiative). 2021. The Future of Clean Hydrogen in the United States: Views from Industry, Market Innovators, and Investors. Part of the EFI Report Series From Kilograms to Gigatons: Pathways for Hydrogen Market Formation in the United States. Washington, DC. https://energyfuturesinitiative.org/wp-content/uploads/sites/2/2022/03/The-Future-of-Clean-Hydrogen-in-the-U.S._Report-1.pdf.
EIA (U.S. Energy Information Administration). 2021. “What Are Hydrocarbon Gas Liquids?” Updated October 26. https://www.eia.gov/energyexplained/hydrocarbon-gas-liquids.
EIA. 2022. “What Is U.S. Electricity Generation by Energy Source?” Frequently Asked Questions (FAQS). https://www.eia.gov/tools/faqs/faq.php?id=427&t=3.
EPA (U.S. Environmental Protection Agency). 2017. “Greenhouse Gas Reporting Program Dataset.” FLIGHT database. https://www.epa.gov/ghgreporting/data-sets.
EPA. 2022. Inventory of U.S. Greenhouse Gas Emissions and Sinks: 1990–2020. EPA 430-R-22-003. https://www.epa.gov/system/files/documents/2022-04/us-ghg-inventory-2022-main-text.pdf.
FCHEA (Fuel Cell and Hydrogen Energy Association). 2020. “Road Map to a US Hydrogen Economy.” https://www.fchea.org/us-hydrogen-study.
Global CCS Institute. 2021. Blue Hydrogen. Washington, DC. https://www.globalccsinstitute.com/wp-content/uploads/2021/04/Circular-Carbon-Economy-series-Blue-Hydrogen.pdf.
Global CCS Institute. 2022. “CO2RE Facilities Database.” https://co2re.co/FacilityData.
Global CO2 Initiative. 2018. “Global Roadmap Study of CO2U Technologies.” Technical Report. University of Michigan. https://hdl.handle.net/2027.42/146529.
Grand View Research. 2022. Carbon Dioxide Market Size, Share & Trends Analysis Report by Source (Ethyl Alcohol, Ethylene Oxide), by Application (Food & Beverages, Oil & Gas, Medical), by Region, and Segment Forecasts, 2022–2030. San Francisco. https://www.grandviewresearch.com/industry-analysis/carbon-dioxide-market.
Greenwood, A. 2021. “CO2-Based Methanol from US Celanese JV Resemble Natgas-Based Costs.” Independent Commodity Intelligence Services. https://www.icis.com/explore/resources/news/2021/04/23/10631870/co2-based-methanol-from-us-celanese-jv-resemble-natgas-based-costs.
Grubert, E., and K.T. Sanders. 2018. “Water Use in the United States Energy System: A National Assessment and Unit Process Inventory of Water Consumption and Withdrawals.” Environmental Science & Technology 52(11):6695–6703. https://doi.org/10.1021/acs.est.8b00139.
Haldor-Topsoe. 2022. “G2LTM eFuels Technology.” Topsoe. https://www.topsoe.com/our-resources/knowledge/our-products/process-licensing/g2ltm-efuels-technology?hsLang=en.
Hausfather, Z. 2021. “Global CO2 Emissions Have Been Flat for a Decade, New Data Reveals.” CarbonBrief, November 4. https://www.carbonbrief.org/global-co2-emissions-have-been-flat-for-a-decade-new-data-reveals.
Hills, C.D., N. Tripathi, R.S. Singh, P.J. Carey, and F. Lowry. 2020. “Valorisation of Agricultural Biomass-Ash with CO2.” Scientific Reports 10(1):13801. https://doi.org/10.1038/s41598-020-70504-1.
Hobson, C. 2018. Renewable Methanol Report. Madrid, Spain: Methanol Institute. https://www.methanol.org/wp-content/uploads/2019/01/MethanolReport.pdf.
Holmes, K.J., E. Zeitler, M. Kerxhalli-Kleinfield, and R. DeBoer. 2021. “Scaling Deep Decarbonization Technologies.” Earth’s Future 9(11):e2021EF002399. https://doi.org/10.1029/2021EF002399.
IDEALHy (Integrated Design for Efficient Advanced Liquefaction of Hydrogen). n.d. “Liquid Hydrogen Outline.” https://www.idealhy.eu/index.php?page=lh2_outline.
IEA (International Energy Agency). 2019. Putting CO2 to Use: Creating Value from Emissions. Paris. https://iea.blob.core.windows.net/assets/50652405-26db-4c41-82dc-c23657893059/Putting_CO2_to_Use.pdf.
IEA. 2021. Global Energy Review 2021. Paris: IEA. https://www.iea.org/reports/global-energy-review-2021.
IHS Markit. 2021. “Carbon Dioxide Market Research: Carbon Dioxide (CO2) Outlook, Supply & Demand, Forecast and Analysis.” In Chemical Economics Handbook—Carbon Dioxide. S&P Global. https://ihsmarkit.com/products/carbon-dioxide-chemical-economics-handbook.html.
Ineratec. 2017. “Sustainable E-fuels for Aviation.” https://ineratec.de/en/e-fuels-for-aviation.
Jones, A.C., and A.J. Lawson. 2021. Carbon Capture and Sequestration in the United States. Washington, DC: Congressional Research Service. https://sgp.fas.org/crs/misc/R44902.pdf.
Kahler, F., M. Carus, O. Porc, and C. vom Berg. 2021. Turning Off the Tap for Fossil Carbon—Future Prospects for a Global Chemical and Derived Material Sector Based on Renewable Carbon. Hurth, Germany: Nova Institute for Ecology and Innovation. https://renewable-carbon.eu/publications/product/turning-off-the-tap-for-fossil-carbon-future-prospects-for-a-global-chemical-and-derived-material-sector-based-on-renewable-carbon.
Kelly, S., and T. Polansek. 2020. “Side Effects: Fuel Demand Crash Shuts U.S. Ethanol Plants, Meatpackers Lack Refrigerant.” Reuters, April 7. https://www.reuters.com/article/us-health-coronavirus-carbon-dioxide/side-effects-fuel-demand-crash-shuts-u-s-ethanol-plants-meatpackers-lack-refrigerant-idUSKBN21P2DK.
Küngas, R., P. Blennow, T. Heiredal-Clausen, T. Holt, J. Rass-Hansen, S. Primdahl, and J. Bøgild Hansen. 2017. “ECOs—A Commercial CO2 Electrolysis System Developed by Haldor Topsoe.” ECS Transactions 78(1):2879. https://doi.org/10.1149/07801.2879ecst.
Larson, E., C. Greig, J. Jenkins, E. Mayfield, A. Pascale, C. Zhang, J. Drossman, et al. 2021. Net-Zero America: Potential Pathways, Infrastructure, and Impacts. Final Report. Princeton, NJ: Princeton University. https://netzeroamerica.princeton.edu/the-report.
LEP (Labor Energy Partnership). 2021. Building to Net-Zero: A U.S. Policy Blueprint for Gigaton-Scale CO2 Transport and Storage Infrastructure. Washington, DC: Energy Futures Initiative and AFL-CIO. https://laborenergy.org/wp-content/uploads/2021/10/LEP-Building_to_Net-Zero-June-2021-v4.pdf.
Madigan, J. 2020. “Carbon Dioxide Production.” US Industry (Specialized) Report OD4929. IBISWorld.
Mitsubishi Gas Chemical Company, Inc. 2021. “Mitsubishi Gas Chemical to Launch ‘Circular Carbon Methanol’ Production.” https://www.mgc.co.jp/eng/corporate/news/files/210330e.pdf.
Monkman, S., and M. MacDonald. 2017. “On Carbon Dioxide Utilization as a Means to Improve the Sustainability of Ready-Mixed Concrete.” Journal of Cleaner Production 167(November):365–375. https://doi.org/10.1016/j.jclepro.2017.08.194.
Murphy, C., T. Mai, Y. Sun, P. Jadun, M. Muratori, B. Nelson, and R. Jones. 2021. Electrification Futures Study: Scenarios of Power System Evolution and Infrastructure Development for the United States. NREL/TP-6A20-72330. Golden, CO: National Renewable Energy Laboratory. https://doi.org/10.2172/1762438.
NASEM (National Academies of Sciences, Engineering, and Medicine). 2022. A Research Strategy for Ocean-Based Carbon Dioxide Removal and Sequestration. Washington, DC: The National Academies Press. https://doi.org/10.17226/26278.
National Carbon Capture Center. 2022. “Homepage.” https://www.nationalcarboncapturecenter.com.
NETL (National Energy Technology Laboratory). 2017a. Best Practices: Monitoring, Verification, and Accounting (MVA) for Geologic Storage Projects. DOE/NETL-2017/1847, Revised Edition. U.S. Department of Energy. https://netl.doe.gov/sites/default/files/2018-10/BPM-MVA-2012.pdf.
NETL. 2017b. “FE/NETL CO2 Saline Storage Cost Model (2017).” U.S. Department of Energy. Last update, September (version 3). https://www.netl.doe.gov/research/energy-analysis/search-publications/vuedetails?id=2403.
Northern Lights. 2021. “What It Takes to Ship CO2.” https://northernlightsccs.com/news/what-it-takes-to-ship-co2.
NPC (National Petroleum Council). 2021a. “CO2 Geologic Storage.” Chapter 7 in Meeting the Dual Challenge: A Roadmap to At-Scale Deployment of Carbon Capture, Use, and Storage, 2021. A Report of the National Petroleum Council. https://dualchallenge.npc.org/files/CCUS-Chap_7-030521.pdf.
NPC. 2021b. “CO2 Transport.” Chapter 6 in Meeting the Dual Challenge: A Roadmap to At-Scale Deployment of Carbon Capture, Use, and Storage. 2021. A Report of the National Petroleum Council. https://dualchallenge.npc.org/files/CCUS-Chap_6-030521.pdf.
NPMS (National Pipeline Mapping System). 2022. “Gas Transmission and Hazardous Liquid Pipelines.” U.S. Department of Transportation Pipeline and Hazardous Materials Safety Administration. https://www.npms.phmsa.dot.gov/Documents/NPMS_Pipelines_MAP.pdf.
Omodolor, I.S., H.O. Otor, J.A. Andonegui, B.J. Allen, and A.C. Alba-Rubio. 2020. “Dual-Function Materials for CO2 Capture and Conversion: A Review.” Industrial & Engineering Chemistry Research 59(40):17612–176331. https://doi.org/10.1021/acs.iecr.0c02218.
PARC (Palo Alto Research Center). 2022. “Commercial Methane Pyrolysis Efforts.” https://docs.google.com/spreadsheets/d/1IcMP7WlmhntRz3hKvVjvr2IwrFprgCe-1bYAtY56eOk/edit#gid=0.
Payne, K. 2021. “Proposed Carbon Dioxide Pipeline Draws Opposition from Iowa Farmers and Environmentalists Alike.” Iowa Public Radio. October 13. https://www.iowapublicradio.org/ipr-news/2021-10-13/proposed-carbon-dioxide-pipeline-draws-opposition-from-iowa-farmers-and-environmentalists-alike.
PHMSA (Pipeline and Hazardous Materials Safety Administration). 2022a. “Annual Report Mileage for Gas Transmission & Gathering Systems.” U.S. Department of Transportation. June 1. https://www.phmsa.dot.gov/data-and-statistics/pipeline/annual-report-mileage-natural-gas-transmission-gathering-systems.
PHMSA. 2022b. “Annual Report Mileage for Gas Distribution Systems.” U.S. Department of Transportation. June 1. https://www.phmsa.dot.gov/data-and-statistics/pipeline/annual-report-mileage-gas-distribution-systems.
PHMSA. 2022c. “Annual Report Mileage for Hazardous Liquid or Carbon Dioxide Systems.” U.S. Department of Transportation. May 2. https://www.phmsa.dot.gov/data-and-statistics/pipeline/annual-report-mileage-hazardous-liquid-or-carbon-dioxide-systems.
PHMSA. 2022d. Failure Investigation Report—Denbury Gulf Coast Pipelines, LLC–Pipeline Rupture/Natural Force Damage. Washington, DC: U.S. Department of Transportation. https://www.phmsa.dot.gov/sites/phmsa.dot.gov/files/2022-05/Failure%20Investigation%20Report%20-%20Denbury%20Gulf%20Coast%20Pipeline.pdf.
PHMSA. 2022e. “PHMSA Announces New Safety Measures to Protect Americans from Carbon Dioxide Pipeline Failures After Satartia, MS Leak.” U.S. Department of Transportation. May 26. https://www.phmsa.dot.gov/news/phmsa-announces-new-safety-measures-protect-americans-carbon-dioxide-pipeline-failures.
Pires da Mata Costa, L., D.M. Vaz de Miranda, A.C. Couto de Oliveira, L. Falcon, M.S. Silva Pimenta, I. G. Bessa, S. Juarez Wouters, M.H.S. Andrade, and J.C. Pinto. 2021. “Capture and Reuse of Carbon Dioxide (CO2) for a Plastics Circular Economy: A Review.” Processes 9(5):759. https://doi.org/10.3390/pr9050759.
Rubin, E.S., C. Short, G. Booras, J. Davison, C. Ekstrom, M. Matuszewski, and S. McCoy. 2013. “A Proposed Methodology for CO2 Capture and Storage Cost Estimates.” International Journal of Greenhouse Gas Control 17(September):488–503. https://doi.org/10.1016/j.ijggc.2013.06.004.
Ruth, M.F., P. Jadun, N. Gilroy, E. Connelly, R. Boardman, A.J. Simon, A. Elgowainy, and J. Zuboy. 2020. The Technical and Economic Potential of the H2@Scale Concept Within the United States. NREL/TP-6A20-77610. Golden, CO: National Renewable Energy Laboratory. https://www.nrel.gov/docs/fy21osti/77610.pdf.
Scott, A. 2019. “Avantium Is Making Bioethylene Glycol.” C&EN Global Enterprise 97(45):14. https://doi.org/10.1021/cen-09745-buscon10.
Shaner, M.R., S.J. Davis, N.S. Lewis, and K. Caldeira. 2018. “Geophysical Constraints on the Reliability of Solar and Wind Power in the United States.” Energy & Environmental Science 11(4):914–925. https://doi.org/10.1039/C7EE03029K.
Shao, B., Y. Zhang, Z. Sun, J. Li, Z. Gao, Z. Xie, J. Hu, and H. Liu. 2022. “CO2 Capture and In-Situ Conversion: Recent Progresses and Perspectives.” Green Chemical Engineering 3(3):189–198. https://doi.org/10.1016/j.gce.2021.11.009.
Solidia (Solidia Technologies). 2022. “The U.S. Department of Energy Grants $2.1M to Solidia Technologies to Develop CO2 Capture and Utilization Technologies for Building Materials.” 3BL CSRwire May 23. https://www.csrwire.com/press_releases/745286-us-department-energy-grants-21m-solidia-technologies-develop-co2-capture-and.
Wittenberg, A. 2022. “Strange Bedfellows: Farmers and Big Greens Square Off Against Biden and the GOP.” Politico, May 29. https://www.politico.com/news/2022/05/29/iowa-manchin-carbon-capture-pipeline-00030361.
World Energy Council. 2021. Hydrogen on the Horizon: Ready, Almost Set, Go? Innovation Insights Briefing. London: World Energy Council. https://www.worldenergy.org/assets/downloads/Innovation_Insights_Briefing_-_Hydrogen_on_the_Horizon_-_Ready%2C_Almost_Set%2C_Go_-_July_2021.pdf.
Wyoming ITC (Integrated Test Center). n.d. “Homepage.” https://www.wyomingitc.org.
XPRIZE. 2022. “XPRIZE and the Musk Foundation Award $15M to Prize Milestone.” https://www.xprize.org/prizes/elonmusk/articles/xprize-and-the-musk-foundation-award-15m-to-prize-milestone-winners-in-100m-carbon-removal-competition.
XPRIZE. n.d. “Turning CO2 into Products: NRG COSIA Carbon XPRIZE Guidelines.” https://www.xprize.org/prizes/carbon/guidelines.
Yang, Q., X. Liu, S. Zhu, W. Huang, and D. Zhang. 2019. “Efficient Utilization of CO2 in a Coal to Ethylene Glycol Process Integrated with Dry/Steam-Mixed Reforming: Conceptual Design and Technoeconomic Analysis.” ACS Sustainable Chemistry & Engineering 7(3):3496–3510. https://doi.org/10.1021/acssuschemeng.8b05757.
ZEP (Zero Emissions Platform). 2011. The Costs of CO2 Transport: Post-Demonstration CCS in the EU. Brussels, Belgium: European Technology Platform for Zero Emission Fossil Fuel Power Plants. https://www.globalccsinstitute.com/archive/hub/publications/119811/costs-co2-transport-post-demonstration-ccs-eu.pdf.