
4
Infrastructure Considerations for CO2 Utilization
This chapter describes considerations for developing infrastructure for carbon dioxide (CO2) utilization, taking into account the CO2-derived products identified in Chapter 3 and the existing infrastructure discussed in Chapter 2. Infrastructure needs throughout the CO2 utilization value chain are examined, from capture to purification, transportation, conversion, and, where applicable, transportation of the CO2-derived product. Requirements for enabling infrastructure, namely, clean electricity, hydrogen, water, land, and energy storage, are also considered.
4.1 CO2 CAPTURE
There are currently only 12 commercial CO2 capture and storage (CCS) facilities in the United States, with a combined installed capacity of around 20 million tonnes per annum (Mtpa), and two more plants under construction (Global CCS Institute 2022). As noted in Chapter 2, 11 of these CCS facilities capture CO2 for use in enhanced oil recovery (EOR), with only one having geologic CO2 storage as its sole purpose. The Petra Nova project was the only large U.S. commercial electricity-generating plant to be equipped with carbon capture equipment, and that project was shut down in 2020 due to a combination of the economic effects of the COVID-19 pandemic and persistently low oil prices that reduced the economic benefit of using captured CO2 for EOR (Anchondo and Klump 2020). Per the Global CCS Institute’s CO2RE database, as of June 2022, about 60 carbon capture projects are in various stages of development in the United States, only one of which is for direct air capture (DAC) (Global CCS Institute 2022). The Clean Air Task Force maintains a database of publicly announced CO2 capture, utilization, and storage (CCUS) projects under development in the United States, which includes information about the project status (e.g., announced, pre-front-end engineering design [pre-FEED], FEED, FEED complete), location, capture capacity, and sector (CATF 2022). Figure 4-1 shows the geographic locations, sectors, and capture capacities of these projects.
Carbon capture technologies are at varying levels of maturity today. Amine-based solvents for post-combustion capture constitute the most advanced carbon capture technology and are the most commonly deployed in commercial carbon capture facilities. However, other technologies have been deployed commercially in the United States, such as vacuum swing adsorption (e.g., at the Air Products’ Port Arthur Hydrogen CCS project in Texas) and cryogenic separation performed at Exxon’s Shute Creek natural gas processing facility in Wyoming. Other technologies including sorbents, membranes, and chemical and calcium looping cycles are in various stages of development.
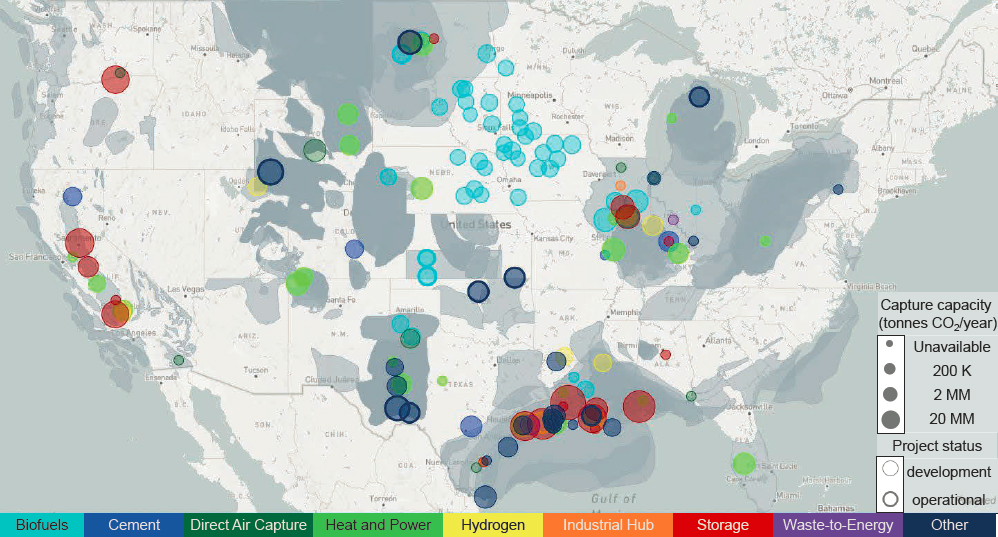
SOURCE: Adapted from Clean Air Task Force, 2021, “US Carbon Capture Activity and Project Map,” https://www.catf.us/ccsmapus.
Multiple assessments, including those by the International Energy Agency (IEA 2020), Concawe (2021), and the Global CCS Institute (Kearns et al. 2021), analyze the maturity of different carbon capture technologies. Drawing from these publications, Table 4-1 summarizes the maturity of select carbon capture technologies.
Today’s commercial CCS facilities are deployed at natural gas processing plants, fertilizer plants, bioethanol plants, coal-fired power plants, and hydrogen production facilities, while other applications are under development. In practice, the most appropriate capture technology for a given application depends on several factors, including the initial and final desired CO2 concentration (i.e., the percentage of CO2 to be removed), scale of CO2 capture, operating pressure and temperature, composition and flow rate of the gas stream, integration with the original facility, and cost considerations.
Post-combustion capture technologies can be retrofitted at the exhaust point of existing combustion and other CO2-emitting facilities. New combustion facilities employing oxy-fuel combustion and pre-combustion CO2 capture provide alternative approaches that ultimately may result in lower capture costs due to higher concentrations of CO2. Oxy-combustion power production uses oxygen instead of air for fuel combustion, resulting in a flue gas stream that is approximately 70 percent CO2 by volume with the balance being water vapor, oxygen, and trace compounds. Oxy-combustion CO2 capture is applicable only to facilities with a special oxy-combustion boiler, and requires significant capital investment in an air separation unit for oxygen production in addition to CO2 purification equipment. Oxy-combustion can have broader application in industry, such as for metals and glass production (Linde 2022), where oxygen enhancement both improves process efficiency and reduces fuel consumption and its associated greenhouse gas (GHG) and other noxious emissions. In pre-combustion capture processes, a fuel is transformed into hydrogen so that the CO2 can be removed from the feedstock prior to combustion. Solid or gaseous fuels can be converted first to synthesis gas (syngas, carbon monoxide and hydrogen) via either gasification or partial oxidation (POx) under high pressure and temperature. This syngas can undergo the
TABLE 4-1 Technology Readiness Levels of Select Carbon Capture Technologies
| Carbon Capture Technology | Technology Status (Technology Readiness Level) | |||
|---|---|---|---|---|
| Emerging (1–3) | Under Development (4–6) | Near Commercial (7–8) | Commercial (9) | |
| Solvents |
|
|
|
|
| Sorbents |
|
|
|
|
| Membranes |
|
|
|
|
| Other technologies |
|
|
||
SOURCES: Data from Concawe (2021); IEA (2020); Kearns et al. (2021).
water-gas shift reaction to convert CO and added steam to hydrogen and a CO2-rich gas. Autothermal reforming (ATR), an alternative hydrogen production process, combines the steam reforming and partial oxidation steps into a single reactor, followed by a series of shift reactions to generate syngas with CO2 concentration of 25–30 percent by volume. ATR was developed in the 1950s and is used in commercial applications to provide syngas for ammonia and methanol synthesis but has not been deployed commercially yet for hydrogen production with carbon capture. Since syngas is at high pressure (~30 bar), the CO2 can be cost-effectively separated. It is also possible to produce hydrogen with steam methane reforming (SMR), where CO2 is captured from the flue gas (18–20 percent by volume, atmospheric pressure).
The cost of CO2 capture can vary significantly but is inversely proportional to the concentration of CO2 in the gas stream, with CO2 capture from ambient air at ~420 parts per million by volume (0.042% CO2 in air) being the costliest of all. The plant’s location, energy and steam supply, and integration with the original facility will also have an impact on the cost of capture (Ferrari et al. 2019; IEAGHG 2018). Though CO2 capture is implemented, its cost has been a deterrent to more widespread deployment. The cost of CO2 capture today can be as high as $600/tonne captured CO2 in the case of DAC (Tollefson 2018) or as low as $15/tonne in the case of industrial CO2 capture from natural gas processing plants where CO2 concentrations are above 95 percent (IEA 2021). DAC has seen a surge in interest and investment over the past few years, and a growing number of companies are entering the space. Nonetheless, achieving the U.S. Department of Energy’s (DOE’s) target cost of less than $100/net tonne of CO2-equivalent by 2030 will require significant research and development (R&D). Ongoing DOE financial support for CO2 capture FEED studies and large pilot or demonstration facilities may spur additional investment in commercial deployments. For example, DOE recently released a notice of intent for a Carbon Capture Demonstration Projects Program to fund projects that “will address technical, environmental, permitting, and financing challenges for commercial deployment” (DOE 2022). Table 4-2 summarizes some of the necessary improvements in next-generation innovations to drive down the costs and improve the performance of technologies for CO2 capture.
TABLE 4-2 RD&D Targets to Improve Carbon Capture Systems
| CO2 Capture Technology | Research Trends for Reducing Carbon Capture Costs |
|---|---|
| Advanced solvents |
|
| Sorbents |
|
| Membranes |
|
| Novel concepts |
|
SOURCE: Data from National Energy Technology Laboratory, 2020, 2020 Carbon Capture Program R&D: Compendium of Carbon Capture Technology, Pittsburgh: National Energy Technology Laboratory, https://www.netl.doe.gov/sites/default/files/2020-07/Carbon-CaptureTechnology-Compendium-2020.pdf.
Because of the additional energy required to capture CO2, deployment of carbon capture technology can impact emissions of other pollutants. It is important to differentiate between emissions at the life cycle level from direct emissions. At the location of the capture unit, emissions of nitrogen oxides (NOx), sulfur oxides (SOx), and particulate matter are likely to decrease because of the additional purification of the flue gas stream required before it enters the capture unit. Most carbon capture technologies are poisoned by sulfur compounds, so flue gas pre-treatment for carbon capture removes SOx in excess of what is scrubbed out during typical flue gas desulfurization in power plants (EEA 2020). On the other hand, capture technologies may increase emissions of some pollutants; for instance, commercially available amine-based capture systems may cause local increases in volatile organic compounds due to the carryover of compounds from solvent degradation in the treated flue gas (NETL 2020). Emissions of ammonia (NH3) due to amine solvent degradation or nitrosamine formation from reaction of the amine solvent with NOx in the flue gas can also occur (Benquet et al. 2021; Gibbins and Lucquiaud 2021; Gorset et al. 2014; Spietz et al. 2017). Because solvent losses from post-combustion capture—whether due to degradation products such as nitrosamines or solvent carryover—have economic impacts as well as potential health and environmental effects, their mitigation is an active area of research. Some system designs can integrate CO2 capture synergistically with removal of SOx and NOx in order to reduce criteria pollutants in addition to CO2 (Shaw 2009). Flue gas pre-treatments to reduce aerosol concentrations, and as a result minimize solvent losses, are also being explored (see, e.g., Bostick 2019, 2022). Oxy-combustion reduces air pollutants because it does not heat and react with the nitrogen component of air, so there are significantly fewer NOx emissions compared to conventional combustion processes.
At the life cycle level, the impact on non-CO2 emissions depends on the fuel used in the capture unit and its effect on the system. For instance, in a power plant, the heat required for regenerating the solvent in post-combustion capture is generally extracted from the turbine of the power plant, resulting in an efficiency penalty (i.e., less net electricity output per unit of fuel input). If this penalty is compensated for using the same type of power plant, a larger amount of fuel would be needed to produce the same amount of electricity output, resulting in an increase in life cycle emissions of air pollutants (Corsten et al. 2013).
4.2 CO2 PURIFICATION
Depending on the origin of the CO2 source, the CO2 flow contains different impurities, which can impact CO2 transport, utilization, and storage. Impurities such as water, sulfur trioxide (SO3), nitrogen dioxide (NO2), hydrogen sulfide (H2S), and oxygen can affect corrosion rates. Nitrogen, argon, and hydrogen reduce fluid density and can increase compression costs. Impurities also can affect the phase boundaries and make it more difficult to maintain single-phase flow. The maximum concentration of toxic or flammable gases such as H2S, carbon monoxide, and hydrocarbons is not determined by technical constraints, but rather by risk assessments of potential pipeline failure, which will depend on regional aspects such as population density. Table 4-3 shows an overview of impurities in CO2 flows by type of source. These impurities change depending on the specific component in the feedstock, the type of process and process specifications, and the capture process. Limited literature exists on trace impurities (an overview is shown in Table 4-4), but these need to be considered when designing CO2 capture and utilization (CCU) processes. Table 4-5 gives the maximum impurity thresholds by transport type as reported in different studies and projects, showing that the thresholds can differ significantly among regions. In countries such as Norway and the United Kingdom, where large-scale CO2 transport (for CCS) has just begun to be deployed, the limits are stricter. There are trade-offs between the cost of cleaning the flue gas and the operational costs and lifetime of the pipelines.
The required purity of CO2 feedstock varies with the utilization process, and Table 4-6 gives an overview of impurities of concern by utilization type. The potential impact of impurities on CO2 utilization has not been studied extensively. In fact, most studies generally assume that the CO2 feed to the utilization process is 100 percent pure. As indicated in Table 4-5, this will not be the case; even with strict CO2 transport thresholds, there still will be impurities that can affect the utilization processes. For example, although biological CO2 conversion is fairly impurity tolerant, care must be taken to avoid oxygen if the processes require an anaerobic environment. On the other end of the spectrum, electrochemical CO2 conversion requires high-purity CO2 streams and therefore may
TABLE 4-3 Overview of Impurity Concentrations of CO2 Streams from Different Illustrative Facility Types
| Component | Subcritical Pulverized Bituminous Coal (Illinois #6) Plant with Post-Combustion Capturea | Natural Gas with Carbon Capturec | Oxyfuel Combustion at Supercritical Pulverized Coal Planta,d | Cement Planta | Refinery Stacka | Bioethanol Plante | Direct Air Capturef |
|---|---|---|---|---|---|---|---|
| Gas leaving the carbon capture unit (post combustion with MEAb) | Gas leaving the carbon capture unit (post combustion with MEAb) | Gas leaving the boiler unit | Gas leaving the carbon capture unit (post combustion wit MEAb) | Gas leaving the carbon capture unit (post combustion with MEAb) | Raw CO2 gas from ethanol plant | Gas leaving the capture unit (KOH sorbent) | |
| CO2 | 99.7% | 95% | 96.65% | 99.8% | 99.6% | 90% | 97.11% |
| CO | 750 ppmv | 1.2 ppmv | |||||
| H2O | 640 ppmv | 100 ppmv | 640 ppmv | 640 ppmv | 1–5 ppmv | 0.01% | |
| CH4 | 4% | 0.026 ppmv | 0–3 ppmv | ||||
| SO2 | <1 ppmv | 50 ppmv | <0.1 ppmv | 1.3 ppmv | |||
| SO3 | 20 ppmv | ||||||
| NO2 | 1.5 ppmv | 0.86 ppmv | 2.5 ppmv | ||||
| NOx | 100 ppmv | ||||||
| O2 | 61 ppmv | 0.81% | 35 ppmv | 121 ppmv | 10–100 ppmv | 1.36% | |
| H2S | 200 ppmv | 7.9 ppmv | |||||
| N2 | 0.18% | 0.5% | 1.96% | 893 ppmv | 0.29% | 50–600 ppmv | 1.51% |
| Ar | 22 ppmv | 0.57% | 11 ppmv | 38 ppmv | |||
| Hg | 0.0007 ppmv | 0.011 ppmv | 0.00073 ppmv | ||||
| As | 0.0055 ppmv | 0.026 ppmv | 0.0029 ppmv | ||||
| Se | 0.017 ppmv | 0.08 ppmv | 0.0088 ppmv | ||||
| Cl | 0.85 ppmv | 0.41 ppmv | 0.4 ppmv | ||||
| Ethanol | 25–950 ppmv | ||||||
| Methanol | 1–50 ppmv | ||||||
| Acetaldehyde | 3–75 ppmv | ||||||
| Isoamyl acetate | 0.6–3.0 ppmv | ||||||
| Isobutanol | 0–3 ppmv | ||||||
| Ethylacetate | 2–30 ppmv |
b MEA = monoethanolamine
c Values from SINTEF (2019).
d Values from Rütters et al. (2015).
e Values from McKaskle et al. (2018).
f Values from Keith et al. (2018).
TABLE 4-4 Overview of Trace Impurities by CO2 Source
| Impurity | CO2 Source | |||||||||
|---|---|---|---|---|---|---|---|---|---|---|
| Combustion | Wells/Geothermal | Fermentation/Bioethanol Anaerobic Digestion (purely energy crops) | Anaerobic Digestion (waste) | Hydrogen or Ammonia | Phosphate Rock | Coal Gasification | Ethylene Oxide | Acid Neutralization | Vinyl Acetate | |
| Aldehydes | ✔ | ✔ | ✔ | ✔ | ✔ | ✔ | ✔ | ✔ | ||
| Amines | ✔ | ✔ | ||||||||
| Benzene | ✔ | ✔ | ✔ | ✔ | ✔ | ✔ | ✔ | ✔ | ✔ | |
| Carbon monoxide | ✔ | ✔ | ✔ | ✔ | ✔ | ✔ | ✔ | ✔ | ✔ | ✔ |
| Carbonyl sulfide | ✔ | ✔ | ✔ | ✔ | ✔ | ✔ | ✔ | ✔ | ||
| Cyclic aliphatic hydrocarbons | ✔ | ✔ | ✔ | ✔ | ✔ | ✔ | ✔ | |||
| Dimethyl sulfide | ✔ | ✔ | ✔ | ✔ | ✔ | ✔ | ||||
| Ethanol | ✔ | ✔ | ✔ | ✔ | ✔ | ✔ | ✔ | ✔ | ||
| Ethers | ✔ | ✔ | ✔ | ✔ | ✔ | ✔ | ✔ | |||
| Ethyl acetate | ✔ | ✔ | ✔ | ✔ | ✔ | ✔ | ||||
| Ethyl benzene | ✔ | ✔ | ✔ | ✔ | ✔ | ✔ | ||||
| Ethylene oxide | ✔ | ✔ | ||||||||
| Halocarbons | ✔ | ✔ | ✔ | ✔ | ✔ | |||||
| Hydrogen cyanide | ✔ | ✔ | ||||||||
| Hydrogen sulfide | ✔ | ✔ | ✔ | ✔ | ✔ | ✔ | ✔ | ✔ | ✔ | ✔ |
| Ketones | ✔ | ✔ | ✔ | ✔ | ✔ | ✔ | ✔ | ✔ | ||
| Mercaptans | ✔ | ✔ | ✔ | ✔ | ✔ | ✔ | ✔ | ✔ | ✔ | |
| Mercury | ✔ | ✔ | ✔ | |||||||
| Methanol | ✔ | ✔ | ✔ | ✔ | ✔ | ✔ | ✔ | ✔ | ||
| Nitrogen oxides | ✔ | ✔ | ✔ | ✔ | ✔ | ✔ | ✔ | |||
| Phosphine | ✔ | |||||||||
| Radon | ✔ | ✔ | ✔ | |||||||
| Sulfur dioxide | ✔ | ✔ | ✔ | ✔ | ✔ | ✔ | ✔ | ✔ | ||
| Toluene | ✔ | ✔ | ✔ | ✔ | ✔ | ✔ | ✔ | |||
| Vinyl chloride | ✔ | ✔ | ✔ | ✔ | ||||||
| Volatile hydrocarbons | ✔ | ✔ | ✔ | ✔ | ✔ | ✔ | ✔ | ✔ | ||
| Xylene | ✔ | ✔ | ✔ | ✔ | ✔ | ✔ | ✔ | |||
SOURCE: Adapted from European Industrial Gases Association, 2016, “Carbon Dioxide Food and Beverages Grade, Source Qualification, Quality Standards and Verification,” EIGA Doc 70/17, revision of Doc 70/08, https://www.eiga.eu/ct_documents/doc070-pdf.
TABLE 4-5 Overview of Recommended Maximum Impurity Limits for CO2 Transport in Pipelines and Shipping
| Component | Pipelines | Shipping | |||
|---|---|---|---|---|---|
| NETL (United States)a | National Grid Carbon (United Kingdom)b | Northern Lights Project (Norway)c | EU CCUS Projects Networkd | ||
| Conceptual Design | Range in Literature | ||||
| H2O (ppmv) | 500 | 20–650 | 50 | 30 | 50 |
| N2 vol% | 4 | 0–7 | <0.3 | ||
| O2 vol% | 0.001 | 0.001–4 | 0.001 | 10 | Unknown |
| Ar vol% | 4 | 0.01–4 | <0.3 | ||
| CH4 vol% | 4 | 0.01–4 | <0.3 | ||
| H2 vol% | 4 | 0–4 | 2 | 50 | <0.3 |
| CO ppmv | 35 | 10–5,000 | 200 | 100 | 2,000 |
| H2S vol% | 0.01 | 0.002–1.3 | 0.002 (for dense-phase 150 barg) 0.008 (for gas-phase 38 barg) | 0.0009 | 200 ppm |
| SO2 ppmv | 100 | 10–50,000 | |||
| SOx ppmv | 100 | ||||
| NOx ppmv | 100 | 20–2,500 | 100 | 10 | |
| NH3 ppmv | 50 | 0–50 | 10 | ||
| COS ppmv | trace | trace | |||
| C2H6 ppmv | 1 | 0–1 | |||
| C3+ ppmv | <1 | 0–1 | |||
| Particulates ppmv | 1 | 0–1 | |||
| Hg ppmv | 0.03 | ||||
| Glycol ppmv | 46 | 0–174 | |||
| Cd, Tl, ppm | 0.03 (sum) | ||||
a Values from NETL (2019).
b Values from Gibbins and Lucquiaud (2021).
c Values from Equinor (2019).
d Values from Brownsort (2019).
be most feasible if paired with DAC CO2 because of the latter’s limited contamination. Indeed, the number of explorative CO2 utilization studies that use DAC as the CO2 source is increasing in the literature. Further purification of CO2 streams can be accomplished using existing technologies (see, e.g., Abbas et al. 2013), so this does not necessarily present a technological challenge but rather an issue to consider when selecting the source of the CO2 and designing CO2 utilization routes, since further purifying CO2 flows to desired levels significantly impacts CO2 capture and utilization costs. Given that no single purity specification would be appropriate for all processes, infrastructure decisions for CO2 transport likely will be based on purity needed for transport, with any further purification performed at the utilization facility if necessary.
TABLE 4-6 Overview of Impurities of Concern by CO2 Utilization Route
| CO2 Utilization Route | Required Purity | Impurities of Concern |
|---|---|---|
| Mineralization | Low | Most processes can work directly with flue gas if desired |
| Biological conversion (anaerobic) | Low to medium | High tolerance to impurities except for oxygen |
| Thermochemical conversion | High to very high | Metals, sulfur can damage the catalyst |
| Electrochemical conversion | Very high | Metals, sulfur (SO2, H2S, COS) at part-per-million levels can damage the electrochemical reactor |
| CO2 with food-grade puritya | Very high | Carbon monoxide, hydrocarbons, metals (CO2: >99%; H2O: <2 ppm; CO: <10 ppm; CxHy: < 50 ppmv; oil: <10 ppmw; and passing tests for acidity and red substances) |
a Although use of CO2 in the food and beverage industry is out of scope for this report, these purity levels have been included as a point of comparison, since many CO2 utilization studies assume that the input CO2 is food-grade purity. Purity levels are taken from EIGA (2018).
4.3 CO2 TRANSPORTATION
CO2 capture from point sources, the atmosphere, or bodies of water can be transported using modular means (ship, barges, trucks, or rail), high-pressure pipelines, or most likely, a combination of these various means, especially in the case of some stranded emitters where the construction of stand-alone conversion facilities may not be economically viable. Of the various modes of transportation, pressurized pipelines are considered by far the most cost-effective way of transporting large volumes of CO2 in the supercritical or dense phase.
As discussed in Chapter 2, the United States has more than 5,150 miles of pressurized pipelines (see Figure 2-6) transporting 66 Mtpa of dense-phase CO2 captured from industrial and natural sources, mostly for EOR, which is not a sustainable use of CO2.1 The Permian Basin has the most extensive pipeline network, owned by Kinder Morgan and Occidental Petroleum, carrying 38 Mtpa of CO2 to eastern New Mexico, west Texas, and southeastern Utah for EOR (NPC 2021). Although some of these existing CO2 pipelines have additional capacity to transport CO2, they are not located near the most likely potential CCUS industrial clusters and CO2 emitters, and the additional capacity is too small on its own to fulfill climate objectives.
As also introduced in Chapter 2, the United States enjoys an extensive network of freight highways, rail lines, and barge waterways that are already used for long-distance transport of bulk commodities and energy products (see Figures 2-7 and 2-8). Shipping can be more cost-effective over long distances and may be viable in the long term for transporting CO2 from regions of the United States not located near geologic storage sites, such as the Northeast and Northwest (Jenkins 2022). Today, merchant liquid CO2 is cost-effectively moved via trucks and trailers up to 200 miles for use in the food and beverage and other industries, although this cost is higher than CO2 moved by pipeline. Given the long lead time needed to build dedicated CO2 pipelines, such existing modes may be used as interim measures to transport CO2 for utilization wherever feasible.
Many analyses indicate that orders of magnitude increase in the existing U.S. CO2 transport infrastructure capacity, primarily to transport captured CO2 for long-term geologic storage,2 will be needed to make a significant contribution toward a net-zero emissions target using CCUS (see, e.g., Abramson et al. 2020; Larson et al. 2021; NETL 2015). The following sections outline considerations for incorporating CO2 utilization opportunities in the planning and development of future CO2 transportation infrastructure, such as the location of CO2 sources, scenarios for multimodal transport, the hazards and safety aspects of CO2 pipelines, and the feasibility of repurposing existing infrastructure.
___________________
1 EOR does result in some long-term storage of CO2 underground, the exact amount of which (as a percentage of CO2 injected) depends on the size and the breakthrough, permeability, and porosity of the geology of the reservoir.
2 Ongoing work, such as the National Energy Technology Laboratory’s Carbon Storage Program (NETL 2022), performs monitoring and verification to ensure long-term CO2 storage.
4.3.1 CO2 Transport in Industrial Clusters
When designing a transportation network for CO2, it is important to consider proximity to current and future CO2-emission-intensive sources in the United States. Clustering CCUS infrastructure around energy supplies, power generation facilities, or ports (see Figures 2-1 and 2-8) provides opportunities to deploy projects in a manner that may be less capital intensive and less likely to have a negative impact on other resources. Thus, to take advantage of economies of scale, it could be more cost-effective to capture CO2 in CCUS industrial clusters sharing common transport, storage, and utilization infrastructures. In Europe, several of such industrial clusters emitting more than 300 Mtpa CO2 are either being considered or under development (ZEP 2020), and the United Kingdom’s industrial decarbonization strategy prioritizes industrial cluster formation (HM Government 2021). The Infrastructure Investment and Jobs Act (IIJA, Public Law 117-58) authorizes and appropriates $3.5 billion for DAC hubs ($7 billion including nonfederal cost share), which plans for co-location of DAC projects, CO2 utilization offtakers, sequestration infrastructure, and transportation infrastructure to connect them. This has been estimated by the Rapid Energy Policy Evaluation and Analysis Toolkit (REPEAT) project to result in 4.9 million metric tonnes (MMT) CO2 captured per year by 2026 (REPEAT 2022). Considering the current locations of industrial emissions, point-source fossil-fuel use, and hydrogen and ammonia production, a recent analysis by the Great Plains Institute identified prime candidates for carbon and hydrogen industrial clusters (Abramson et al. 2022) (see Figure 4-2). Distributed across the contiguous United States, collectively these proposed clusters emit around 1.7 billion tonnes of CO2e (gigatonnes of carbon dioxide equivalents) per annum, accounting for nearly 70 percent of the total CO2 emissions from industrial and power sources (Abramson et al. 2022). For many of these proposed industrial clusters, as well as the CCS projects currently under development (see Figure 4-1), it may be beneficial to divert some of the CO2 stream for utilization facilities as opposed to transporting it all to long-term geological storage, due to economics, public acceptance, or for learning through piloting and increasing scale of
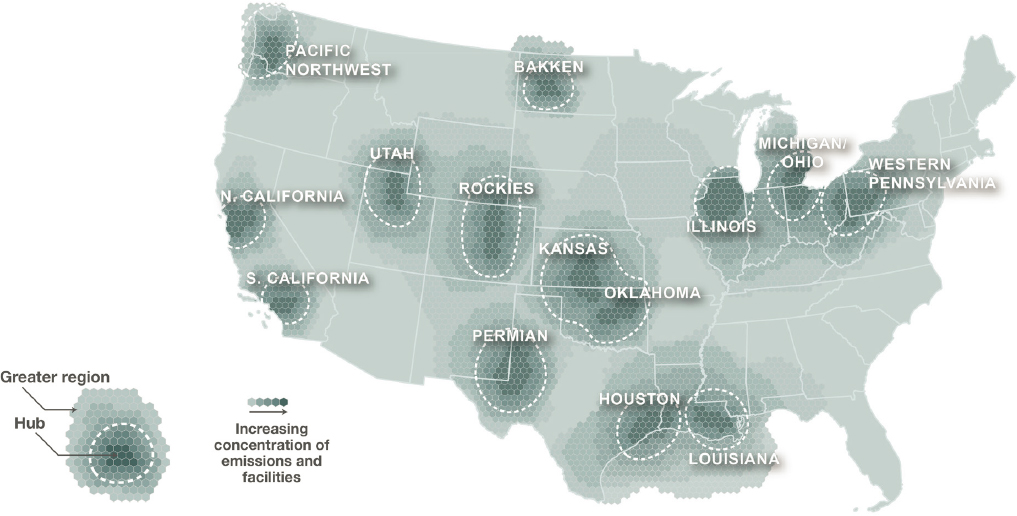
SOURCE: E. Abramson, E. Thomley, and D. McFarlane. 2022, An Atlas of Carbon and Hydrogen Hubs for United States Decarbonization, Minneapolis, MN: Great Plains Institute,https://scripts.betterenergy.org/CarbonCaptureReady/GPI_Carbon_and_Hydrogen_Hubs_Atlas.pdf.
utilization. However, the feasibility of doing so will depend on the composition of the captured CO2, purification costs, market demand, and policy incentives. Additionally, as discussed further in Chapter 6, some of the CO2 sources in industrial clusters are not sustainable for pairing with utilization of short-lived products and will need to be replaced with DAC or biogenic CO2 in the long term as displacement of emissions yields decreasing returns and as fossil point sources are phased out over time.
4.3.2 Multimodal CO2 Transport Infrastructure
Besides transporting CO2 by pipeline, CO2 also can be transported in trucks, trains, and ships. Table 4-7 presents an overview of condition requirements by mode of transport (Al Baroudi et al. 2021). Tanker trucks are used primarily for bulk transportation of CO2 for retail purposes. Such motor carriers store liquid CO2 in cryogenic vessels typically at 17 bar (246 psi) and –30°C (Deng et al. 2019) and have storage capacities of 20 to 30 tonnes. Tanker trucks are considered a flexible modality, which may be relevant when small amounts of CO2 are needed. Railroad systems have a larger transport capacity. Literature on the use of rail is limited compared to other types of CO2 transport, but it appears more competitive than truck transport when the necessary infrastructure is already available. One of the few available literature studies, Stolaroff et al. (2021), estimates that for smaller CO2 flows (<0.3 MMT per year) and for distances between 40 and 200 km (~25–125 miles), CO2 transport by rail, if available, is preferable to transport by trucks (see Figure 4-3). However, the authors noted that rail access can be limited, and building new rail can cost $0.6M–1.2M per km ($0.96M–$1.92M per mile), which is somewhat more expensive than CO2 pipelines. The authors also indicated that for distances below 40 km, truck appears to be the most cost-effective transport mode, while for CO2 flow rates above 1 MMT per year, CO2 pipelines are the best option.
CO2 also can be transported by ship, which is most cost-effective for large distances. Ship transport likely would be in the liquid phase, as transport in gaseous and solid form is considered uneconomical. In the former case, this is due to the low density of gaseous CO2, while in the latter it is due to the significant effort involved in loading and unloading solid CO2 (Geske et al. 2015). CO2 transport by ship exists today to transport food-grade
TABLE 4-7 Overview of Conditions for CO2 Transportation Alternatives in the Literature
| Transportation Method | Range of Conditions in Literature | Transport Phase | Remarks |
|---|---|---|---|
| Pipelines | 48–200 bar (~695–2,900 psi) 9.85°C–34°C (49.73℉–93.2℉) |
Vapor, dense, liquid, and supercritical phases |
|
| Ships | 6.5–45 bar (~95–650 psi) −52.2°C–9.85°C (−62.5°F–49.73°F) |
Liquid |
|
| Trucks | 17–20 bar (~246–290 psi) −30.2°C–20.15°C (−22.36°F to −4.27°F) |
Liquid |
|
| Rail | 6.5–26 bar (~95–380 psi) −50.15°C to −20.15°C (−58.27°F to −4.27°F) |
Liquid |
|
SOURCE: Adapted from H. Al Baroudi, A. Awoyomi, K. Patchigolla, K. Jonnalagadda, and E.J. Anthony, 2021, “A Review of Large-Scale CO2 Shipping and Marine Emissions Management for Carbon Capture, Utilisation and Storage,” Applied Energy 287(April):116510, https://doi.org/10.1016/j.apenergy.2021.116510.
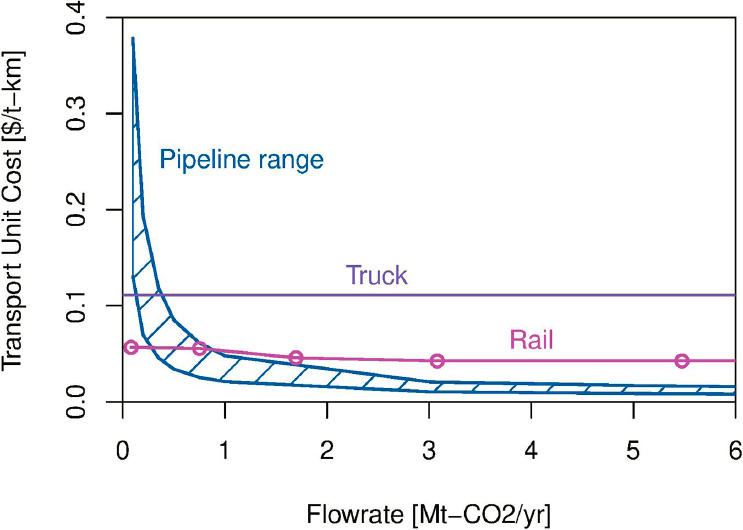
SOURCE: J.K. Stolaroff, S.H. Pang, W. Li, et al. 2021, “Transport Cost for Carbon Removal Projects with Biomass and CO2 Storage,” Frontiers in Energy Research 9(May), https://www.frontiersin.org/article/10.3389/fenrg.2021.639943. CC BY 4.0.
CO2. Such ships typically have a capacity of about 1,000–1,500 m3 with operating pressures between 14 and 20 bar (~200–290 psi) (Jackson and Brodal 2019; ZEP 2011). Ship transportation conditions for CO2 represent a tradeoff between temperature and pressure. Roussanaly et al. (2021), for instance, pointed out that for transporting up to 20 MMT CO2/year up to 2,000 km (1,242 miles), shipping CO2 at 7-bar (101-psi) pressure reduces shipping costs up to 30 percent compared to shipping at 15 bar (218 psi). Bjerketvedt et al. (2022) found similar results and further reported a techno-economic limit to transport CO2 at pressures of 15 bar beyond 10,000 tonnes due to high weight and poor capacity utilization. However, although transporting at lower pressure (7 bar, −52°C) is often recommended in the literature, to-date no commercial ship operations exist for CO2 transport at these conditions.
Current CO2 transport by ship occurs primarily in the food and beverage industry with ship capacities of 2,000 tonnes or less (Al Baroudi et al. 2021; Element Energy 2018; Neele et al. 2017; Reyes-Lúa et al. 2021). Given the large amounts of CO2 expected to require transport, most studies consider that new ships with high capacities (at least 10,000 tonnes, with some studies proposing up to 100,000 tonnes) will need to be designed and built (Al Baroudi et al. 2021; IEAGHG 2004; Neele et al. 2017). It is expected that such ships can be built with design elements similar to those of liquefied petroleum gas (LPG) ships. Other options are repurposing LPG ships for CO2 shipping or building ships in such a way that they could operate as multigas ships, for example, for transporting CO2 as well as LPG. Such multipurpose vessels could improve business cases; however, they increase the complexity of the supply chain (e.g., vessel cleaning will be required before the ship is loaded with a different type of product) (Zahid et al. 2015). The technical and economic feasibility of repurposing existing LPG ships or of multigas operation has not yet been proven (Element Energy 2018). Finally, existing ports may be cost-effective for CO2 shipping projects due to the availability of services and infrastructure, for example, for docking as well as storing and loading CO2. However, the ports may impose constraints on CO2 shipping projects, including ship length, ship draft, berth availability, and storage space requirements, that need to be considered when designing value chains (Element Energy 2018).
Transport of CO2 in the liquid phase, regardless of transport mode, will require CO2 liquefaction and temporary CO2 storage facilities. A liquefaction plant is considered the most energy-consuming section in the CO2 transport
chain, demanding between 95 and 105 kWh/tonne CO2 (Element Energy 2018; Jackson and Brodal 2019). Current industrial practices liquefy CO2 to temperatures of −30°C and pressures of 17 bar (246 psi), generally using an external refrigerant process because of the lower unit operating energy cost. However, if CO2 is required at different specifications, such as −52°C and 7 bar (101 psi) for large-scale commercial ship transport, much lower temperatures will be required to achieve CO2 liquefaction than the currently employed industrial process, and other routes for liquefaction likely will be needed (e.g., high compression with free liquid expansion) (Element Energy 2018). Bjerketvedt et al. (2022) estimate that the cost of retrofitting a 15-bar (218-psi) liquefaction plant to a 7-bar (101-psi) one comprises 40 percent of the investment cost. The impact of impurities in the liquefaction process also requires attention. Deng et al. (2019) indicated that the need to purge impurities can increase the liquefaction cost by up to 34 percent compared to pure CO2, which can influence the selection of an optimal transport mode, the location of the CO2 utilization facility, and the economic viability of the product. An intriguing option to consider is repurposing current liquefied natural gas (LNG) facilities for CO2 liquefaction, given the existing and increasing capacity of natural gas liquefaction capacity in the United States. U.S. LNG export capacity has increased significantly in recent years, from about 1 billion cubic feet per day in 2015 to nearly 11 billion cubic feet per day by the end of 2021 (EIA 2022b). Concurrently, liquefaction capacities for LNG have been increasing, with new facilities coming online and under construction (EIA 2022c), and are expected to continue increasing from 69.9 Mtpa in 2020 to 205.1 Mtpa in 2024 (Gulf Publishing Holdings LLC 2022). However, the committee found no information on repurposing LNG facilities for CO2 liquefaction in the literature, and therefore could not assess the feasibility of this option, although an important consideration will be the much higher liquefaction temperature of CO2 (−52°C) as compared to LNG (−162°C).
Another common element among transport chains for different CO2 transportation modes is the need for temporary CO2 storage. Liquid CO2 can be stored in a cryogenic tank for long durations, as long as heat leaks into the tank are minimized (Lee et al. 2012). The size of the temporary storage will depend on the type and requirements of transport mode. For shipping, the capacity of CO2 temporary storage in the port has been reported to be between 100 and 150 percent of the ship size (ZEP 2011). The transport mode dictates the pressures required for cryogenic storage. For shipping, temporary storage could be at 7 or 15 bar (101 or 218 psi) depending on the shipping conditions, as noted above. Bjerketvedt et al. (2022) indicate that the capital expenditure of buffer tanks at 7 bar is significantly lower than at 15 bar (€478 versus €867 per tonne CO2, respectively) due to the thicker tank walls required at higher pressures. As CCS and CCU develop, the need for temporary storage will move from “simple” storage tanks toward CO2 terminals with large-volume influxes. The extensive industry experience operating and managing LNG terminals may be used as guidance for the development of CO2 terminals (Element Energy 2018; Myers et al. 2012; Zahid et al. 2015).
As mentioned above, in many instances, a multimodal CO2 transport infrastructure involving ships, trucks, trains, and pipelines probably will be required. Multimodal transport is common in the industrial gas industry today, with the gas product typically railed from production to a rail depot and trucked to the last mile. Most of the industrial gas industry uses a production allocation modeling system to optimize distribution modes. Distance from production site to customer is the primary factor considered, but other aspects taken into account include feedstock costs, taxes and other financial factors, the capacity of the plant, and scheduling. Multimodal transport will especially be needed for small-scale emitters in proximity of hubs or utilization sites to enable CCU and for those located far from main pipelines where the construction of dedicated CO2 transport and conversion plants will not be economically viable. In such circumstances, the optimal transport solution can be determined by identifying key indicators associated with cost, flexible operation, safety, and environmental impact, using multicriteria optimization models. Such an approach will involve cost-benefit analysis of a CO2 transport network, utilizing the different modes for CO2 transport, to minimize costs and environmental impact, reduce risks of failure, and maximize the global CO2 utilization potential in the region. Life cycle assessment of CO2 transport infrastructure in the selected geographic areas may also incorporate safety and environmental impacts.
Optimizing road transport of CO2 requires solving a vehicle routing problem to determine the size of a fleet of vehicles needed to transport CO2 to interim storage hubs or utilization plants. The design of a pipeline network operating at different pressure levels, alongside other transport modes, represents a significantly more sophisticated transportation system than has been conceived thus far in the deployment of CCUS infrastructure. Understanding
the interaction between the different modes of CO2 transport is important, as their major cost components differ: for pipelines, capital cost is the main driver, whereas for ships, trucks, and trains, operating costs make up the bulk of total cost. Reducing the purity of CO2 streams admitted into various parts of a multitiered transportation network may also help reduce costs of CO2 transportation. It is therefore essential for the transport system designers to understand and formulate how the synergies between the different modes of transportation of CO2 can be used to drive down costs, while taking into account safety and minimizing carbon footprint, in order to accelerate the rollout of CO2 utilization through the development of its supply chain. Low-carbon multimodal transportation path optimization methodologies developed for cargo transport (see, e.g., Zhang et al. 2021) can be a useful starting point for developing similar methodologies for CO2.
4.3.3 CO2 Transport Safety Considerations
CO2 is a colorless, odorless gas that is heavier than air. The legal airborne concentration limit is 5,000 ppm averaged over an 8-hour shift; concentrations of 10 percent (100,000 ppm) or more can produce unconsciousness or death due to asphyxiation (EPA 2000; New Jersey Department of Health 2016). CO2 can collect in depressions in the land, in basements, and in other low-lying areas such as valleys near a pipeline route, presenting a significant hazard if leaks continue undetected. Because CO2 is inert, it can remain undetected for a very long time. The captured CO2 also may contain, albeit in small concentrations, potentially toxic substances such as H2S, whose natural dispersion might be impeded by the dense CO2 vapor layer close to the ground, further increasing hazards (see, e.g., Soraghan and Anchondo 2022). Furthermore, upon rapid expansion, CO2 can cool down to temperatures as low as −70°C, resulting in frostbite upon exposure, or may lead to the much more serious propagating brittle pipeline fracture for as long as the steel temperature remains below its ductile-to-brittle transition temperature (Talemi et al. 2016). Technical approaches to dealing with these safety risks are described below, but equally important in pipeline, as in other infrastructure, development is to consider the environmental, justice, and societal acceptance aspects of safety, which are discussed further in Chapter 5.
Given the above, the risks and consequences associated with the accidental release of CO2 during its transportation must be determined. Trucking tankers are routinely monitored and checked for CO2 leaks. Railcars often are used for transport of hazardous chemicals, so rail crews have general HAZMAT training; however, the training is not CO2-specific, and railcars are frequently stored in railyards without attendants.3 Of the various transportation modes, long-distance, pressurized pipelines pose the greatest hazard in the unlikely event of failure, given the large amounts of CO2 being transported4 and the potential for leaks remaining undetected for hours to days. These risks are especially notable for pipelines that pass near populated areas. The U.S. Pipeline and Hazardous Materials Safety Administration began regulating supercritical CO2 pipelines in 1991, mostly for EOR applications, although it has the authority to order corrective action to address an identified safety issue on both supercritical and gaseous CO2 pipelines. Notably, the majority of U.S. CO2 pipelines traverse only low population areas. Despite their excellent safety record, it is not possible to draw a meaningful statistical representation of their associated risk due to the small number of CO2 pipelines currently in operation.
A considerable body of work and understanding exists regarding the hazards associated with the high-pressure transportation of CO2. Examples of relevant work include the European Commission FP7 project, CO2PipeHaz (Woolley et al. 2014), which involved medium-scale CO2 pipeline rupture tests and led to the development and validation of atmospheric dispersion models for calculating minimum safe distances to pressurized pipelines. Another important output of this work was the publication of Good Practice Guidelines for CO2 pipeline safety (Wilday et al. 2014). In a separate study, using dispersion and risk contours mapping, Knoope et al. (2014) showed that dense-phase CO2 pipeline transport leads to shorter lethality distances and smaller locational risks than gaseous CO2 pipeline transport. These differences are attributed to the large momentum behind a dense-phase CO2 release, which leads to a smaller but higher jet and a higher mixing rate with the surrounding air than a gaseous CO2 release. Knoope et al. (2014) note that locational risks for gaseous CO2 pipeline transport can be significantly
___________________
3 Aaron Sandquist, Linde CO2 product manager, personal communication with committee.
4 For example, over 40 Mt for a typical 100 km (62 mile) long, 0.8-m-inner-diameter pipeline transporting CO2 at 70 bar (1,015 psi) at 20°C.
reduced if risk mitigation measures are applied, such as burying the pipeline at 2.0-m depth, installing marker tape, and increasing surveillance.
The eventual transformation of a small puncture into a much more serious propagating brittle facture given the very low temperatures reached during the slow depressurization process was recently identified as being likely for CO2 transportation pipelines (Martynov et al. 2017). However, field tests of sufficiently large scale and duration to lead to such type of failure in practice have not been conducted. The required tests involve the construction of large-scale pipeline test facilities (of the type recently constructed in China, funded by the European Commission and industry; see CO2Quest 2017), which are capital intensive and require industry participation and commitment.
Of the typical impurities found in the captured CO2 stream, water and H2S are particularly problematic for presenting hazards during pipeline transportation. Water presents the risk of corrosion due to the formation of carbonic acid, as mentioned previously, and H2S presents the risk of stress corrosion cracking on its own or with corrosion in the presence of water (Zeng and Li 2020). The presence of oxygen (O2) can act as a promoter of corrosion. Experiments have shown that the presence of both sulfur dioxide (SO2) and O2 significantly increases the corrosion rate of carbon steel under CO2 supercritical conditions (Choi et al. 2010). Chemicals in the vapor state at typical pipeline operation conditions are referred to as noncondensable gases (NCGs). Potential NCGs in the case of CCS are nitrogen (N2), hydrogen (H2), argon (Ar), O2, and methane (CH4). Ar, N2, and O2 are likely to be present in CO2 flows originating from oxyfuel plants, while flows from pre-combustion capture are likely to contain H2 and CH4. The introduction of NCGs can affect the phase behavior of the mixture. Inert gases such as N2, H2, and Ar impact the CO2 flow properties and influence the amount of CO2 that can be transported in two ways: by taking up volume and influencing the flow velocity. Moreover, inert gases may increase the amount of energy required for compression, as their compressibility factors are higher than that of CO2. NCGs also increase the saturation pressure of CO2, thereby increasing the risk of propagating ductile fractures (Mahgerefteh et al. 2012).
Impurities in the CO2 stream also present the risk of transition into two-phase flow, which must be avoided for a number of reasons. First, it may cause cavitation in the pipeline, resulting in the momentary opening of in-line non-return isolation valves or causing compressor trips (Peletiri et al. 2019). Second, when dense CO2 turns into gas, the transition results in a rise in pressure, which may be above the pipeline’s safe design pressure. Furthermore, the density of gaseous CO2 is much lower than that of dense phase CO2, which significantly reduces the transport capacity.
4.3.4 Repurposing Natural Gas Pipelines for Transporting CO2: Opportunities and Challenges
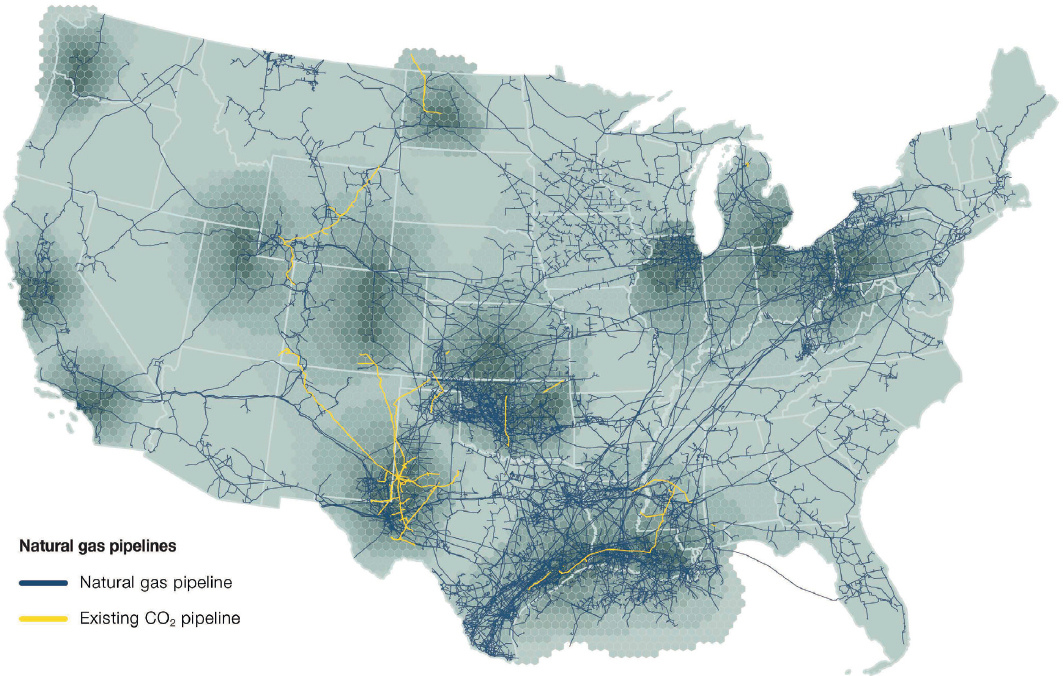
In addition to the potential construction of new CO2 pipelines, repurposing existing hydrocarbon pipelines to transport CO2 is being considered as a possible means of reducing surface impacts and capital expenditure costs (Nickel et al. 2022). Notwithstanding overcoming the regulatory issues associated with the different hazard profile of CO2 compared to hydrocarbon pipelines, repurposing the existing hydrocarbon pipeline assets could reduce implementation time by simplifying acquisition of rights-of-way, easements, or other necessary landowner agreements. With over 495,000 miles of pressurized hydrocarbon pipelines, the United States is in a unique position to consider taking advantage of such resources for transporting CO2. Figure 4-4 shows the locations of natural gas and CO2 pipelines in the United States, with the majority (>300,000 miles) being for natural gas. The transition away from natural gas to meet the 2050 net-zero-emissions target will mean that many of these valuable pipeline and distribution assets may become available, and potentially could be used for transporting CO2; however, coordinating the shift from natural gas to CO2 could be logistically challenging.
Evaluating the feasibility of converting hydrocarbon pipelines to transport CO2 will require addressing a number of pipeline integrity and operational issues. As mentioned earlier, the most efficient way to transport CO2 by pipeline is either in its dense phase (below its critical temperature of 31.04°C and above its critical pressure of 1,070 psi) or in its supercritical phase (above both the critical temperature and pressure) (Wang et al. 2019). In both of these states, CO2 advantageously exhibits both liquid-like (high-density) and gas-like (low-viscosity) behavior. However, when possible, transporting CO2 in the dense phase as opposed to the supercritical state is advantageous, given the higher fracture toughness requirement in the case of the latter (Talemi et al. 2019).
Most natural gas pipelines are rated below 1,070 psi, so the CO2 would need to be transported in the gaseous
state, thereby increasing the compression power requirements. (Retrofitting natural gas pipelines to increase the pressure rating is not possible.) Fluid flow simulations have shown that to transport significant volumes of gas-phase CO2 for distances over 140 km (87 miles), a large number of in-line compressors located at relatively short distances would be required, significantly increasing costs (NPC 2021). Where possible, this may be counteracted by using larger-diameter natural gas pipelines to reduce frictional losses, or a favorable elevation profile. Secondly, the presence of even small amounts of water (>500 ppm) may result in pipeline corrosion due to the formation of carbonic acid, as mentioned earlier (Brownsort 2019). As such, additional dehydration may be required for gaseous- versus dense- or supercritical-phase transport, thereby increasing costs. CO2 has an unusually high saturation pressure; consequently, CO2 pipelines are more prone to propagating ductile fractures than natural gas pipelines (Mahgerefteh et al. 2012). Other than increasing the pipeline fracture toughness, which is impractical, in-line crack arrestors may be required to reduce the risk of propagating ductile fractures. Furthermore, supercritical CO2 is an excellent solvent, so the pipeline gaskets and elastomeric seals would have to be changed to new materials to reduce the risk of leaks and explosive decompression damage (Chemical Engineering 2010; Ho 2006). Notwithstanding all the issues above, in some cases, the cost to repurpose a hydrocarbon pipeline for CO2 transportation may be significantly less than the cost of building new pipelines. For example, reuse of the Atlantic pipeline in the Acorn CCS project is estimated at €38 million, whereas the cost of building a new pipeline could be over €110 million (Alcalde et al. 2019).
SOURCE: E. Abramson, E. Thomley, and D. McFarlane. 2022, An Atlas of Carbon and Hydrogen Hubs for United States Decarbonization, Minneapolis, MN: Great Plains Institute, https://scripts.betterenergy.org/CarbonCaptureReady/GPI_Carbon_and_Hydrogen_Hubs_Atlas.pdf.
4.4 CO2 CONVERSION AND PRODUCT TRANSPORTATION
4.4.1 Impact of Feedstock and Product Properties on Infrastructure Decisions
Where possible, co-located CO2 capture and use is the most sensible approach for CO2 utilization to avoid the expense of CO2 transport. CO2 from DAC, biogenic sources (e.g., ethanol plants), and the chemical process emissions from cement plants (from calcium carbonate decomposition) are examples of sustainable sources of CO2. Each class of CO2 source has its own profile for co-location with utilization. DAC facilities require substantial low-cost land area and would be suitable for co-locating a CO2 conversion unit. Hydrogen needed for hydrocarbon CO2-derived products may be co-generated from renewable wind and solar or other zero-carbon electricity (e.g., by integrating wind farms or solar with DAC), and the resulting products transported from the facility via trucks, rail, or new or existing5 pipelines.
Biogenic CO2 from corn ethanol plants is produced in small quantities per plant relative to those needed for large, capital-intensive processes, for example, hydrocarbon product synthesis. Distributed ethanol plants may be good candidates for collecting CO2 to a central site for utilization. For example, three CO2 trunk lines have been proposed in Iowa and surrounding states to collect biogenic CO2 sources for long-term geologic storage (Eller 2022). Despite potential challenges with intermittency in CO2 supply, the lower cost of highly concentrated bioethanol CO2 ($15–$25/tonne) compared to that of more dilute streams from power generation or iron and steel production ($40–$120/tonne; see IEA 2021) makes its use for hydrocarbon synthesis a potentially profitable opportunity.
Biological processing of CO2 is well suited for a distributed, co-located scale, and in some cases can link directly to a flue gas site or DAC system (Holmgren 2022). Photosynthetic methods for biological CO2 utilization typically are performed either in open-pond or closed-photobioreactor designs, the choice of which has implications for water and land use, as well as capital and operational costs (NASEM 2019). Other important factors to consider in infrastructure design include the requirements for nutrients to cultivate algae or other microbes, regulations on use of genetically modified organisms, and methods to increase CO2 solubility (NASEM 2019).
Cement plants are smaller scale than refineries or petrochemical plants and inherently distributed (Cemnet 2022) due to the cost of transporting limestone feedstock. As noted in the 2019 National Academies’ report Gaseous Carbon Waste Streams Utilization, “if mineral carbonation is to be used to produce construction materials that can replace existing materials, (1) CO2 will need to be consumed in many discrete locations to produce a range of materials and products, and (2) the logistics of CO2 access and transportation of manufactured products will be critical for economic viability” (NASEM 2019, p. 49). For example, the mining of materials may not take place at the cement production site where CO2 is available for capture, and the final product may need to be delivered by truck or rail to its point of use, which could require hydrogen or clean electricity to reduce transportation CO2 emissions. Given the distributed nature of cement manufacturing (dependent on limestone ore location), and the likely persistent use of cement and concrete in the future economy, co-location of distributed plants for cement manufacture and utilization of the CO2 emitted from these plants is likely a durable investment. The CO2 released from the calcination reaction of limestone is not considered fossil-fuel derived and might be accepted as unavoidable CO2 emissions, and treated similarly to DAC or biogenic CO2 for use in Track 2 nondurable end products. On the other hand, the CO2 emitted from the combustion of fossil fuels to make cement is avoidable via replacement of fuel with clean energy. Alternatively, that CO2 could be captured for incorporation during cement curing, but this would require co-location of end use with capture site, which would be challenging given the highly distributed nature of end uses for concrete.
To convert CO2 to hydrocarbon products, the substantial amount of hydrogen required will need to be generated at or transported to the site of utilization, which can be accomplished in one of the following ways: (1) via pipeline, truck, or rail; (2) by onsite generation via water electrolysis (requiring water and electricity); or (3) formed from natural gas (sourced via pipeline) with offtake of CO2 to storage (onsite or via pipeline), or (4) via natural gas pyrolysis to form hydrogen with solid carbon co-product for storage or use. Figure 3-8 details these options in terms of maximum power required if hydrogen is supplied by electrolysis, or maximum natural gas where both
___________________
5 Existing pipelines can be used if the product is a synthetic fuel or other chemical currently transported by pipeline and if the siting is favorably located.
hydrogen and electricity are supplied from natural gas with CCS. Option 3, combining hydrogen generated by natural gas with CCS with sustainable CO2 (i.e., from DAC, direct ocean capture [DOC], or a biogenic source), is counterintuitive from an energy and efficiency perspective but relevant to consider given current policy incentives (e.g., the 45Q tax credit, which is discussed further in Chapter 5).
4.4.2 Considerations for Transporting Supercritical or Dense Phase CO2 Feedstock Versus a Solid or Liquid Product
When co-location of the CO2 feedstock and utilization plant is not feasible, customer needs and the economics of the market drive decisions of where to locate facilities. Important considerations include the capacity factor of the plant, the ability to obtain economies of scale, and process flexibility to adapt to fluctuations in supply. The industrial gas industry has traditionally employed centralized hub-and-spoke models to make use of economies of scale and to drive down costs. However, future CO2 markets may have to consider the interdependence of the CO2 capture process and the CO2 utilization plant. As an example, if the CO2 utilization goes down for any reason, captured CO2 may be vented to the atmosphere, unless buffering storage has been built into the design. Similarly, interruptions to the CO2 capture process can negatively impact the reliability of feedstock supply to the CO2 utilization plant. This interdependence stacks operational risks and can pose a challenge for investors and financiers. Also, different CO2 sources may have different sustainability profiles, impacting the life cycle assessment of a utilization process and complicating source switching.
Continuous industrial processes, such as production of liquid synthetic fuels or chemicals, operate best in a steady state. Large-scale production of liquid chemicals is typically served by direct pipeline connection to the feedstock, to reduce both supply-chain disruptions and costs. As discussed in Section 4.3, CO2 is typically transported by pipeline in the dense or the supercritical state. However, where possible, that is, when the ambient temperature is below the critical temperature of CO2 (31.04°C), transport of CO2 in the dense phase is preferred, given the lower pipeline fracture toughness required. To maintain CO2 in the dense phase during transport, the inlet pipeline pressure must be maintained above the critical pressure of CO2. The need for booster pumps depends on pipeline length and diameter (Peletiri et al. 2018). Changes in CO2 phase, impurities, or humidity accelerate pipeline materials corrosion, corrosion product deposition, and hydrate formation, considerations that play a significant role in pipeline development projects. Pipelines can be leveraged over long distances in CO2 hubs, networks, and clusters, as discussed in Section 4.3.1. Although this option is considered best for reliability of supply, it is also more expensive over longer distances for single point source to sink.
For solid and liquid products that can leverage existing infrastructure through either co-generation or retrofit, siting at current facilities could be economically advantageous. Synthetic natural gas can be produced at natural gas processing facilities to make use of widespread natural gas pipelines for product transfer. Generation of ethylene or propylene or other gaseous products other than synthetic natural gas would best be located at facilities that use these chemicals as feedstock; otherwise, dedicated pipelines must be constructed, which is expensive at small scale. As mentioned earlier, CO2 mineralization plants are better located near urban centers where there is a higher demand for construction products, as opposed to location at a large industrial CO2 emitter. An alternative option would be to locate the CO2 mineralization plant near the source of mined minerals to react with CO2 and then transport the products to point-of-use, but transportation of heavy solid CO2 mineralization products is typically more expensive than moving CO2 over long distances. Improving the logistics for the last mile delivery can help balance supply and demand and increase profitability of solid CO2 products. Biologically based CO2 utilization technologies are good candidates for distributed systems that can link directly to flue gas sources without CO2 capture, or even to DAC systems, which have more flexibility of placement. For smaller and more distributed systems, such as niche CO2 products that have smaller capacities and higher profit margins, CO2 can be transported cost-effectively to conversion facilities as a liquid product. Depending on their proximity to the CO2 conversion facility and the delivery locations, redundant oil pipelines may be employed to transport liquid CO2-derived products such as methanol. However, given the much higher flammability of such products, stricter safety and mitigation procedures will need to be put into place.
4.5 ENABLING INFRASTRUCTURE
Substantial increases in infrastructure are needed to provide the electricity, hydrogen, and water required for CO2 utilization. The net-zero economy broadly is projected to require at minimum a 40 percent increase in demand for electricity and a much greater increase in generating capacity (up to 800 percent for some scenarios, given low stream factors for variable renewable energy) (Cole et al. 2021; Larson et al. 2021; Ruth et al. 2020). A dramatic expansion in hydrogen production—using either a portion of this electricity or natural gas with CCS—will also be required to achieve economy-wide decarbonization goals, which includes use of hydrogen for energy storage (Cole et al. 2021; Larson et al. 2021; Ruth et al. 2020). Overall water use for the energy sector will diminish as steam power cycles are replaced by renewable energy, but some of this reduction will be offset by electrolytic generation of hydrogen and increased use of steam for reforming of natural gas (with CCS). CO2 utilization will play a part in these changing energy system demands. Deployment of enabling infrastructure for CO2 utilization is challenged because use of existing fossil point sources of CO2 is not sustainable (i.e., not compatible with the Paris Agreement goal of limiting global warming to below 1.5°C compared to pre-industrial levels) for all utilization processes, and DAC facilities do not yet exist. This section discusses considerations for developing the extensive infrastructure that would be needed for clean electricity, hydrogen, water, natural gas, and energy storage required to support future CO2 utilization projects. Land-use constraints that might impact infrastructure decisions also are described, with particular emphasis on tradeoffs between areal land use and energy and hydrogen requirements for different methods of hydrocarbon production.
4.5.1 Clean Electricity
As introduced in Chapter 3, CO2 capture and utilization processes require significant amounts of clean electricity. For example, synthesis of hydrocarbon fuels from CO2 requires about four times more energy than direct use of renewable/clean electricity for a given usage scenario. Therefore, deployment of CO2 utilization technologies will put added demands on grid expansion beyond the already significant need to expand renewable power for direct electrification of industry, residential, and transportation sectors. Different regions of the country will have different demand curves emerging as electrification continues, for example, the “duck curve” in California, driven by daily solar generation patterns (DOE-EERE 2017) versus the “butterfly curve” in New England, driven by demand during the winter months if heating is increasingly electrified (Hewitt 2019). As more renewable electricity is connected to the grid, the intermittency and relative lack of dispatchability of these sources may create an increasing temporal mismatch between demand and supply of clean electricity across hours of the day and seasons of the year. In any case, as the U.S. power grid transitions to renewable energy, energy storage must be included to enable CO2 capture and utilization operations. With the increased stand-alone storage and hybrid capacity entering interconnection queues across organized markets as an indication (LBNL 2022), it would seem that some of the necessary grid updates are trending in the right direction, provided interconnections actually occur. Accommodating increased demand will require grid updates (transformers, high-voltage lines including high-voltage direct current, etc.) for existing electricity infrastructure and connection of new clean electricity generation to the grid (NASEM 2021). As of the end of 2021, about 900 gigawatts (GW) of wind and solar generation were in the interconnection queue (LBNL 2022), providing a sense for how much supply is coming into the market.
As discussed in Section 2.4.1, constant operation is favorable for the many current CO2 utilization technologies that entail multiple steps, or high-pressure or -temperature operation. If a CO2 utilization process is developed that can be economically viable while operating intermittently, it may be able to take advantage of negatively priced carbon-free electricity at times of excess supply. Ultimately, this question will be a function of energy, capital, and other costs, and a matter for grid optimization and utilization facility electricity procurement terms.
An entity attempting to reduce or eliminate the carbon intensity of its input electricity to advance net-zero emissions CO2 utilization may locate the production facility within an electricity grid (by service provider or region) that has a low average emissions profile (see EIA 2022a, Table 6; Van Atten et al. 2021, slide 15) or in a state that has aggressive state-level decarbonization goals (C2ES 2021). A third option is to enter into a power-purchase agreement (PPA), which allows decarbonized electricity from an identified provider to be purchased from the existing grid without significant infrastructure upgrades at the point of consumption. Alternatively, the project developer could sponsor a new decarbonized electricity project (e.g., solar or wind), but this may have significant infrastructure or land-use implications at the project location and may require distribution and/or transmission upgrades.
Finally, carbon credits generated during excess renewable electricity availability may be used to offset some or all of the carbon-emitting supply to a CO2 utilization facility to achieve 24/7 low-carbon electricity on a “net” basis. Any project involving siting or development of new electricity infrastructure will need to incorporate community engagement and consider environmental and justice impacts, best practices for which are discussed in Chapter 5.
4.5.2 Hydrogen
Developing infrastructure for hydrogen production, distribution, storage, and use requires consideration of many factors. A primary consideration is whether, for a given application, to rely on centralized or decentralized (distributed) hydrogen production. Centralized production takes advantage of economies of scale but will likely require transportation to move hydrogen from the point of production to the point of consumption. Figure 4-5 illustrates the complexity of hydrogen value chains involving transportation by truck and pipeline or by ship. On the other hand, decentralized production takes advantage of economies of location. Both centralized and decentralized hydrogen production ideally require access to a stable, 24-hour guarantee of electricity. In the case of decentralized production, access to wholesale electricity prices might not be possible, so an appropriate tariff will need to be set up to acquire the requisite electricity at a low-enough cost. Importantly, the generation mix underlying
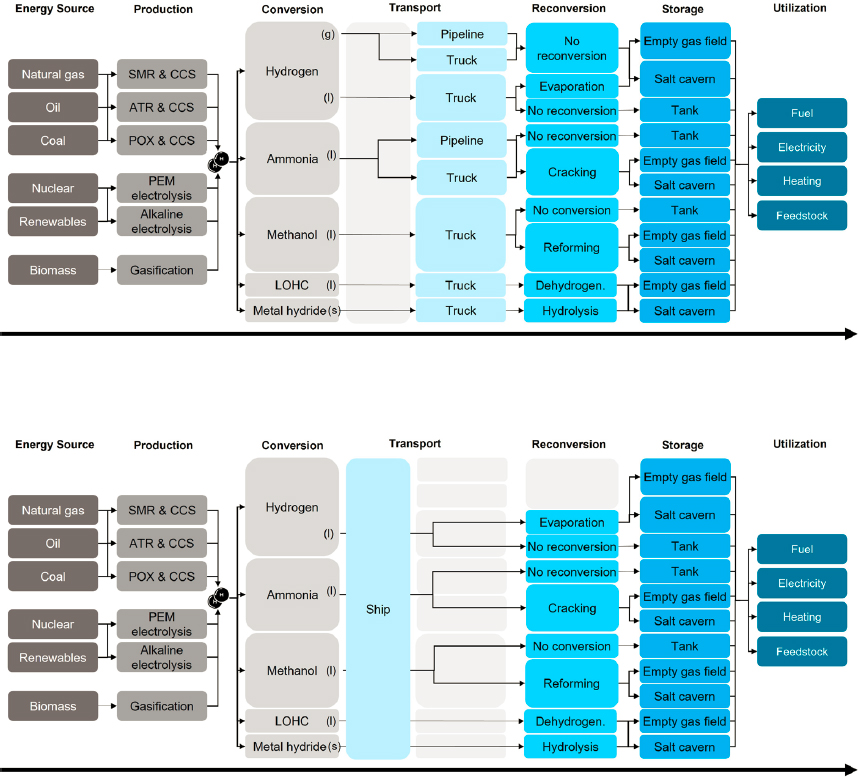
SOURCE: M. Hiestermann, 2022, “Hydrogen Supply Chain Portfolios in the Netherlands Between 2030 and 2050,” Master thesis, Delft University of Technology, Netherlands, https://repository.tudelft.nl/islandora/object/uuid%3Ac4b1c997-f0f6-4859-ba9b-0f579c8d9052.
such a tariff would have to be of an emissions intensity amenable to the life cycle CO2 requirement for the CO2 utilization product to be low-, neutral-, or negative-carbon.
There may be opportunities to adapt existing infrastructure for hydrogen, for example, by converting natural gas pipelines for hydrogen transport or using SMR or ATR with CCS for hydrogen generation. Blending hydrogen into natural gas pipelines, at levels up to about 20 percent by volume, is being explored as an option to decrease the carbon intensity of gas-powered end uses with existing infrastructure (Blanton et al. 2021; EFI 2021; IEA 2019). However, such blends of hydrogen and natural gas are not an attractive option as a method of transporting hydrogen for CO2 utilization, because utilization processes would require pure hydrogen. Repurposing natural gas pipelines to transport 100 percent hydrogen faces technical challenges, such as requirements for higher compression power and modifications to prevent embrittlement; case-by-case analyses are needed to determine its feasibility (ACER 2021). Clean hydrogen production from SMR or ATR with CCS in some cases can use existing infrastructure, which would allow for more rapid permitting at lower cost. These factors also provide a large incentive to co-locate CCU projects with CO2 storage sites and their connecting pipeline infrastructure. However, hydrogen generation from SMR with CCS could result in additional local air pollution depending on the carbon capture technology used, as discussed in Section 4.1. Therefore, the impacts on the surrounding community would need to be assessed carefully and the community consulted before developing such a facility. Newer technologies for hydrogen generation from natural gas (e.g., ATR, POx) enable co-generation of clean power, such that both the process and process-energy used for hydrogen generation can be decarbonized from a single point of capture (Liu 2021).
It is also important to recognize that hydrogen has a 100-year global warming potential (GWP),6 which is still being investigated but with estimates that range from 3.3 to 11 (Field and Derwent 2021; Warwick et al. 2022). Although hydrogen itself is not a greenhouse gas, it could alter atmospheric chemistry by reacting with hydroxyl radicals (OH•) that would otherwise react with other pollutants such as methane, thereby extending its lifetime in the atmosphere. Hydrogen’s GWP can influence infrastructure decisions. For instance, infrastructure may be designed to minimize hydrogen transport, such as through distributed production, or minimize any leakage of hydrogen during transport or storage by conversion into less volatile hydrogen carriers such as methanol or ammonia. Which of these energy carriers would provide a better solution (i.e., lower GHG emissions) requires further knowledge of the total (direct and indirect) contribution of the different hydrogen carriers to the GHG potential. However, hydrogen leakage would be much smaller than the CO2 emissions that it would replace, resulting in an overall positive climate impact. The total emissions (i.e., carbon footprint) attributed to hydrogen highly depend on the way it is produced, as shown in Mac Dowell et al. (2021) (see Figure 4-6). In the case of electrolytic hydrogen, the primary determining factor is the carbon intensity of the electricity used; if the carbon intensity of electricity exceeds 140 kg CO2/MWhe (megawatt-hours of electricity), the hydrogen generated will have a higher carbon footprint than that produced by SMR of natural gas with CCS (Mac Dowell et al. 2021). Figure 4-6 also shows that, for hydrogen derived from natural gas with CCS, guaranteeing deployment of best practices in the natural gas supply chain is critical to achieving zero-emission targets.
4.5.3 Water
Water is a fundamental commodity for almost every step of production processes around the world. It is used as a feedstock and/or as a utility for heating and cooling products and equipment. Understanding whether a given technology’s demand for water resources will compete with other water uses is fundamental in determining the impact of that technology on the full water and energy system. In the case of CCU, water is used during the capture of CO2, to produce hydrogen, and during the production of CO2-based products. A recent review (Rosa et al. 2021) reported the water footprint of CO2 capture in the range of 0.5 to 3 m3 water per tonne CO2 for point-source capture from fossil sources (for electricity generation) and 2 to 7 m3 water per tonne CO2 for DAC with carbon sequestration. Water is used in the capture process itself, and the amount required is highly dependent on the type of capture and the cooling technology employed.
During the production of CO2-derived products, water is used not only for cooling equipment but also as an extractive or absorptive medium or for other processes. As noted in Section 2.4.3, water availability is an
___________________
6 GWP indicates the amount of energy that the emission of 1 ton of a given greenhouse gas absorbs over time (typically 100 years) compared to that for 1 ton of CO2. As the reference gas, CO2 is given a GWP of 1 (EPA 2022b).
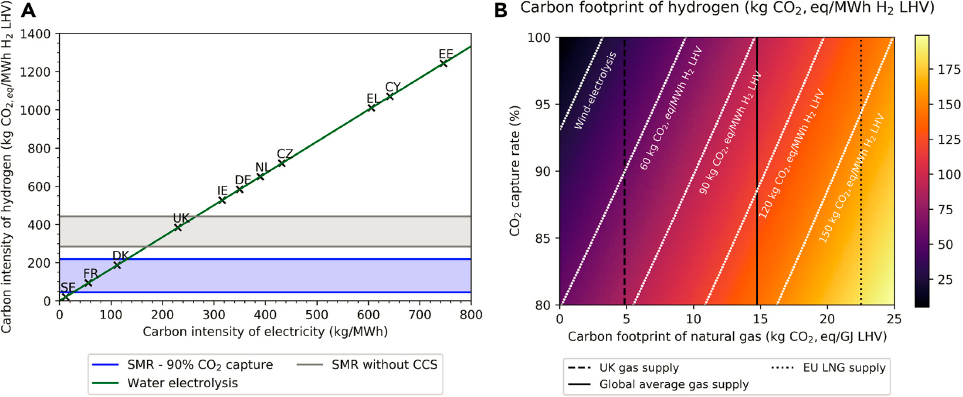
SOURCE: Reprinted from N. Mac Dowell, N. Sunny, N. Brandon, et al., 2021, “The Hydrogen Economy: A Pragmatic Path Forward,” Joule 5(10):2524–2529, https://doi.org/10.1016/j.joule.2021.09.014. Copyright 2021, with permission from Elsevier.
especially important consideration for biological CO2 utilization processes that need water for cultivating algae and other microbes. Argonne National Laboratory, with support from DOE’s Bioenergy Technology Office and Office of Fossil Energy and Carbon Management, has developed the Available Water Remaining for the United States (AWARE-US) Model (ANL 2020), which has been used to analyze the water stress impacts of siting algal cultivation systems (see, e.g., DOE-BETO 2021; Xu et al. 2019). As another example, mineralization of waste often involves high-water-containing “wet” systems, where waste particles are suspended in or dissolved in an aqueous solution. A comparison of five different mineralization processes that take place under aqueous conditions showed a large range of water requirements (mostly to form the slurry at the desired concentration), varying from 35 to 1,400 tonnes water per tonne CO2 (Naraharisetti et al. 2017). Other processes that need water include vacuum production, product rinsing, dilution, and distillation. Finally, not only the amount but also the quality of the water differs per process. In processes that operate at high temperature and/or pressure, requirements are in place regarding impurities (e.g., salts) that could cause scale formation. Other processes have even stricter requirements for water quality, such as electrolytic processes for hydrogen production in proton exchange membrane (PEM) systems where high-purity water7 is required. For PEM systems, cation impurities in the water feed are a constraint, with the most common being Fe3+, Mg2+, Ca2+, Cu2+, and Na+ (Yoshimura et al. 2022).
As discussed in Chapter 3, and illustrated in Figure 3-7, many CO2 utilization products, especially chemicals and fuels, will require hydrogen as a feedstock. Today, most hydrogen is produced from natural gas (through SMR), but to be compatible with net-zero-emission targets, a shift toward low-carbon routes such as water electrolysis is expected, as discussed in Section 2.4.2. Of the various methods for hydrogen production, water electrolysis
___________________
7 The American Society for Testing and Materials defines Type II water, as required in commercial electrolyzers, as having a resistivity of >1 MΩ-cm, sodium and chloride content <5μg/L, and <50 ppb total organic carbon.
has the largest water intensity, as illustrated in Figure 3-8. Note that the range of values in Figure 3-8 reflects to a large extent “local” water consumption used at the production site. If all water used in upstream processes were accounted for, the values could be larger. The additional water demand throughout the supply chain is important to consider when designing large-scale infrastructure strategies. For instance, Shi et al. (2020) assessed water usage in the full supply chain of hydrogen production through electrolysis, including manufacturing of the system; production, installation, and operation of photovoltaic (PV) panels and the electrolysis system; and electrolysis operation. The authors report water consumption for green hydrogen from PV in the range of 22 to 126 kg water per kg hydrogen depending on solar radiation, lifetime, and silicon content.
At the global and national levels, there is limited concern about total water availability for hydrogen production (i.e., electrolysis operation). The International Renewable Energy Agency estimated that to supply approximately 409 million tonnes hydrogen by 2050 (the projected need in the 1.5°C pathway called for in the Paris Agreement, see UNFCCC 2022), about 7–9 billion m3 water per year will be required, which corresponds to less than 0.25 percent of current total freshwater consumption annually worldwide (IRENA 2022). Although this indicates that, at a global level, water availability is not a showstopper for hydrogen production, the regions where low-carbon electricity can be produced most efficiently (e.g., regions with reliably high incoming solar radiation loads) also tend to be the driest. Tarroja et al. (2018) report that water availability can limit solar thermal utilization in California to between 11 and 53 percent of its solar thermal potential and conclude that the spatial distribution of water will drive the extent to which California can use its solar thermal and geothermal resources. Devitt et al. (2020) report a similar result for west Texas and point out that changes induced by climate change may lessen the potential further. A recent study in the United Kingdom estimates a 5 percent national increase in freshwater consumption due to the implementation of a hydrogen economy; however, local impacts in hydrogen hubs may be as high as 20 percent (Hopcroft and Papadamou 2021). In the United States, local water impacts of hydrogen production are just starting to be investigated (Rustagi 2022) and will need to be considered in the context of environmental justice and equitable deployment of energy infrastructure.
Furthermore, Rystad Energy (2021) reported that over 85 percent of the green hydrogen capacity in 2040, based on projects planned worldwide as of mid-2021, may need to source water via desalination, which would add to the cost of hydrogen and impose additional demand for clean electricity to keep a low carbon footprint for hydrogen. Increasing deployment of desalination facilities could, on the other hand, decrease local water stress indices by providing communities with water not only for hydrogen production but also for other uses. Additionally, it may be possible to co-locate a desalination plant with a DOC facility in order to decrease the costs and energy consumption of CO2 capture (Digdaya et al. 2020; Eisaman et al. 2018). Finally, another possibility to mitigate local impacts of hydrogen production in freshwater availability is the development of seawater electrolysis. This option is still in its infancy, however, and will require significant R&D before commercialization (Khan et al. 2021).
Fresh or potable water availability must be considered in implementing CO2 capture and utilization projects, including supply of electricity and hydrogen. If hydrogen is generated at the CO2 utilization manufacturing site, then the required water must be supplied on-site. Alternatively, hydrogen may be generated at a centralized facility using the indicated amount of water and transported to the manufacturing site by hydrogen pipeline, rail, or truck. Many conventional power cycles consume water as withdrawals via steam cycles used in power generation, though direct use of solar or wind energy will reduce this need (Lampert et al. 2015, 2016). Some DAC facilities may either consume or co-produce water in a sorbent-regeneration step. The total amount of water needed for the full plant will depend on the water needs for the steam regeneration unit (when heat is required for regenerating the sorbent) and the pure water generated as by-product. Among the most water-intensive approaches are capture methods based on humidity swing absorption, for instance, which use water as the regeneration medium. Van der Giesen et al. (2017) report water requirements for this DAC system on the order of 15.2 tonnes water per tonne CO2 capture. For other types of DAC systems, values are lower; for example, Keith et al. (2018) report water requirements of 4.7 tonnes water per tonne CO2 captured for a DAC system based on an aqueous potassium hydroxide sorbent, while Ozkan (2021) reports 1–7 tonnes water per tonne CO2 capture for similar systems.
4.5.4 Land-Use Constraints
Increased deployment of CO2 utilization could have substantial land-use impacts depending on the CO2 source and utilization process. Existing hydrocarbon production largely uses carbon and energy feedstocks derived from
subsurface resources of oil and gas that are high energy density and have a low areal footprint. Sustainable CO2derived hydrocarbon products require CO2 from DAC or biogenic CO2 derived from currently limited biofuels or bio-based chemicals production. DAC requires less land area than the equivalent use of first- or second-generation bio-based feedstocks, but more land than associated with production from oil and gas.
Figure 4-7 presents the committee’s analysis of relative land-use requirements for different methods of hydrocarbon production. For illustration, units of −CH2− represent the hydrocarbon product such as synthetic diesel or hydrocarbon polymers. This analysis assumed hydrogen generation via electrolysis using 50.4 MWh of electricity per ton hydrogen (Bazzanella and Ausfelder 2017), and used the estimates given in Figure 3-7 of kilograms hydrogen required to react with CO2 to generate hydrocarbon products. For synthetic fuel or ethylene produced from CO2 by DAC, estimated land-use requirements (per million tonnes fuel per year) range from 400 to 1,600 km2 (150–600 mi2), relative to 3,500 km2 (1,350 mi2) from biomass, 0.2 to 0.5 km2 (0.07–0.2 mi2) from natural gas or oil, and about 30 km2 (12 mi2) if the CO2 were stored (sequestered) instead of transformed into hydrocarbons (labeled as “DAC only” in Figure 4-7). These estimates show the increase in land use associated with production of synthetic fuels or chemicals from CO2, relative to current production from traditional petroleum or natural gas, and compared to the options of storing the captured CO2 or producing fuels from biomass. Land use for synthetic fuels or chemicals from CO2 is somewhat less than use of biomass. Land-use and ecosystem impacts of unconventional oil and gas production (“fracking”) can be larger (Allred et al. 2015).
Land and infrastructure for DAC are largely nonexistent today, as the technology is at the early stages of demonstration and development. Land-use requirements for renewable energy are also much greater than for fossil
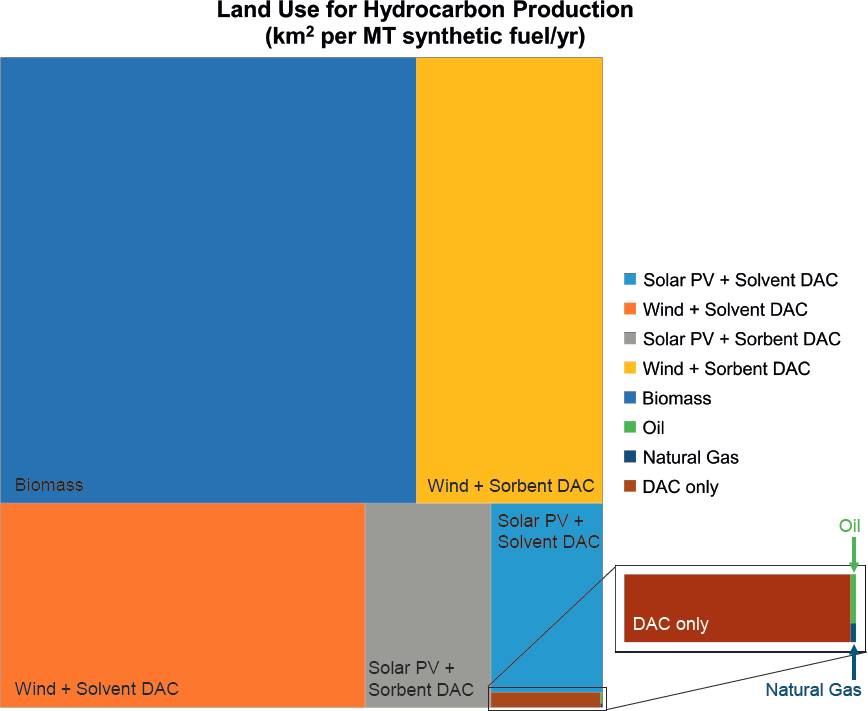
SOURCES: Committee generated based on data from Bazzanella and Ausfelder (2017); Lebling et al. (2022); Ozkan et al. (2022); van Zalk and Behrens (2018).
energy and chemicals, which adds to usage requirements for DAC and other renewably-powered technologies. Any CO2 utilization process requiring hydrogen may need additional land for hydrogen production, depending on how and where that hydrogen is produced. Land-use impacts would be particularly large for hydrogen production via biomass gasification, since biomass is a low-density feedstock with significant land requirements for its growth. Land considerations might be a factor in some brownfield developments and are likely to be a significant consideration for many potential new development projects when implications and needs for conveying infrastructure, pipes, wires, rail, and road transport are considered.
To understand the scale and R&D challenges of deploying industrial-scale “Power-to-X” systems, Smith et al. (2019) estimated the energy and size requirements for a 10,000-tons-per-day methanol plant based on CO2 from DAC and hydrogen from PV/water electrolysis. Figure 4-8 compares the relevant scale of each component of the proposed system to the largest current installed or planned facility for each technology, showing that orders of magnitude increases in solar photovoltaic land area, cross section of CO2 direct air capture, and electrolyzer catalyst surface area would be required beyond the scale of current implementations of those technologies to achieve the desired 10,000-tons-per-day capacity. Given these results, Smith et al. (2019) suggest that decentralized, smaller plants may be more practical and economical for Power-to-X processes, though the optimal solution will also depend on resource availability, geography, and political factors.
4.5.5 Energy and Hydrogen Storage
Facilities that convert CO2 to hydrocarbon products via traditional thermochemical routes are capital intensive and therefore must operate 24/7 to be economical. Storage of energy and hydrogen may be required to achieve constant operation. If variable renewable energy (e.g., wind and solar) is used to power these facilities or to manufacture hydrogen, then energy storage probably will be required, which will add to the cost. For larger-scale manufacturing, seasonal energy storage in the form of hydrogen stored in salt domes could enable economical hydrocarbon production, but the manufacturing facilities would need to be located at or within a transportable distance from the salt dome, which imposes geographic limitations. An example of this approach is the HyDeal project, which plans to connect green hydrogen production in the Los Angeles basin with salt dome storage in Utah via a dedicated hydrogen pipeline (Green Hydrogen Coalition n.d.).
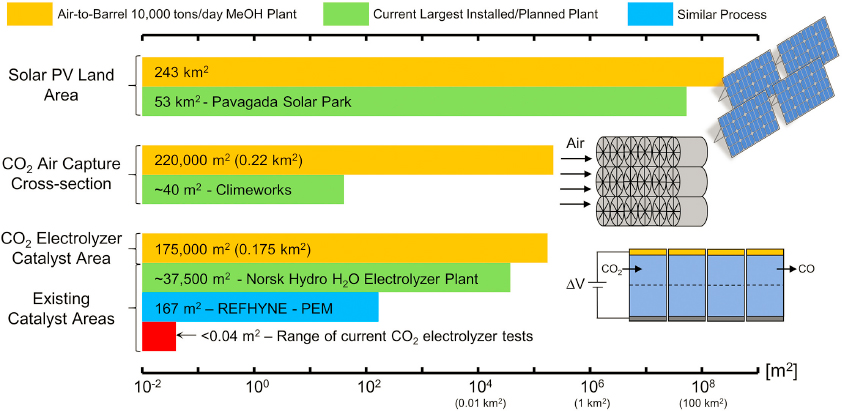
SOURCE: Reprinted from W.A. Smith, T. Burdyny, D.A. Vermaas, and H. Geerlings, 2019, “Pathways to Industrial-Scale Fuel Out of Thin Air from CO2 Electrolysis,” Joule 3(8):1822–1834. Copyright 2019 with permission from Elsevier.
Electrochemical energy storage (batteries) can be deployed for short duration (4.5–13 hours) but adds cost to projects that include dedicated renewable power generation, or to power purchase agreements. Hydrogen storage via salt domes provides lower cost for longer-duration storage of renewable energy versus use of tanks, spheres, or generation of a carrier such as ammonia or methanol (Penev et al. 2019). Otherwise, it may be more cost-effective for third-party entities to store the overproduction of electricity to then be used as a buffer against real-time high marginal prices. Ultimately, this question is a function of grid optimization and utilization facility electricity procurement terms.
4.6 FINDINGS AND RECOMMENDATIONS ON INFRASTRUCTURE CONSIDERATIONS FOR CO2 UTILIZATION
FINDING 4.1 CO2 Capture. The cost of CO2 capture is a deterrent to more widespread implementation of CO2 utilization technologies. The cost of the CO2 feedstock for utilization can vary significantly but largely depends on the concentration of CO2 in the emission source and the type of CO2 capture technology deployed. Today’s commercial CO2 capture facilities are deployed at high-purity CO2 sources with mature capture technologies and produce relatively low-cost CO2 as an output. Reducing CO2 output costs for other capture technologies and for application at less concentrated CO2 sources will require further development to lower capital expenses, improve technology performance, enable better integration of the capture technology with the emission source, and/or reduce energy requirements for capture.
FINDING 4.2 CO2 Purity Requirements. CO2 capture, transport, utilization, and storage all have different CO2 impurity tolerances. Satisfying the purity requirements of all stakeholders across the carbon capture, utilization, and storage value chain, while also prioritizing safety and environmental considerations, is a major challenge. In the United States, purity requirements often are dictated by the midstream transportation company through a contractual obligation, though some impurities that could adversely impact CO2 conversion are not included in such agreements.
FINDING 4.3 CO2 Purity Needs for Utilization. CO2 waste streams may need to be purified to meet the requirements of the CO2 utilization technology for conversion into the desired product. The impurities present will play a key role in dictating whether and for what type of utilization the CO2 stream is suitable. Of the various CO2 utilization processes, mineralization and biological CO2 conversion are the most resilient to impurities, while electrochemical and thermochemical CO2 conversions are the most sensitive. Technologies for purifying CO2 waste streams are commercially available but their use will increase the costs of either the CO2 capture processes or the CO2-based products, depending on the stage at which purification takes place.
FINDING 4.4 Liquid CO2 Transport. The high costs and energy needs of liquefaction facilities to prepare liquid CO2 for transport could impact site selection of a CO2 utilization project and the optimal transport mode to access that project site.
FINDING 4.5 Repurposing Liquefied Natural Gas Facilities for CO2. In recent years, U.S. exports of liquefied natural gas (LNG) have increased significantly, and the capacity of natural gas liquefaction facilities has been growing concurrently, with additional facilities under development. Repurposing natural gas liquefaction facilities for CO2 liquefaction or co-designing a new facility for both natural gas and CO2 liquefaction has not been studied extensively. If feasible, these options could prevent stranded assets if demand for natural gas decreases as the world transitions to a net-zero-emissions future.
RECOMMENDATION 4.1. Agencies with authority over LNG facilities—including the U.S. Department of Energy, the Pipeline and Hazardous Materials Safety Administration, the Federal Energy Regulatory Commission, and the U.S. Coast Guard—should collaborate to assess the possibility of repurposing existing
LNG facilities for CO2 liquefaction, as well as the feasibility of co-designing any future facilities to be able to compress both natural gas and CO2.
FINDING 4.6 Multimodal CO2 Transportation. Determining the optimal (potentially multimodal) CO2 transportation method for a given CO2 utilization project requires considering the location and type of CO2 source, proposed sites of utilization, and estimated product volumes in order to minimize cost, environmental and justice impacts, and safety concerns. Pipeline networks can transport large volumes of CO2 and benefit from economies of scale, but they require aggregation of CO2 sources and may face safety and regulatory challenges if being developed near residential areas, railroads, and/or utilities. For facilities that emit smaller volumes of CO2 or are located far from existing pipeline networks, on-site CO2 conversion or multimodal transport of the CO2 by truck, train, a dedicated pipeline, and/or ship likely will be more economically viable than developing a pipeline network to connect these emission sources to a remote storage or utilization site. These decisions will depend in part on how each transportation method impacts the overall CO2 footprint of the capture and utilization process.
RECOMMENDATION 4.2. The U.S. Department of Energy should develop dedicated methodologies for optimizing multimodal transport of CO2 for utilization purposes to assist transport system designers and project developers in their planning. These methodologies should prioritize safety and environmental justice, minimize carbon footprint, and incorporate existing knowledge and lessons learned from cargo transport and other gas transportation.
FINDING 4.7 CO2 Transport Safety. CO2 is an asphyxiant gas but otherwise nontoxic, as well as nonflammable. There is already a considerable level of understanding of the risks associated with pipeline transportation of CO2, including for different types of CO2 pipelines that have different risks related to impurities. For example, the natural CO2 sources used for enhanced oil recovery (EOR) can contain toxic hydrogen sulfide gas, whereas the CO2 streams transported for CO2 utilization will be higher purity. Most of the practical experience associated with CO2 pipeline operation has been confined to EOR applications. Given the relatively small number and remote locations of these pipelines, it is difficult to draw meaningful conclusions about their failure statistics. No major safety issues are envisaged provided that appropriate mitigation steps are put in place. However, given the unique thermophysical properties of CO2, special consideration needs to be given to selecting pipeline materials with appropriate mechanical properties to resist ductile and brittle propagating fractures, the latter of which has not received considerable attention.
RECOMMENDATION 4.3. In collaboration with national laboratories and university researchers, the U.S. Department of Energy, the Pipeline and Hazardous Materials Safety Administration, and industry should co-fund research to develop rigorous fluid-structure models validated by large-scale field tests to better understand the complex processes leading to propagating brittle fractures in CO2 pipelines, including its typical stream impurities, and provide practical solutions for avoiding them.
FINDING 4.8 Repurposing Natural Gas Pipelines for CO2. Given the large number of parameters involved, the economic and operational feasibility of repurposing existing natural gas pipelines for transporting CO2 requires examination on a case-by-case basis using rigorous systems analysis, with techno-economic, safety, environmental, and justice considerations being the overarching factors.
FINDING 4.9 CO2 and Product Transportation Infrastructure. The economics of infrastructure placement will be dictated in part by the ease of transporting CO2, hydrogen, electricity, and other inputs, versus the ease of transporting the carbon-based products. For example, aggregates are expensive to transport and so will favor distributed production, likely close to urban centers where most concrete and aggregates are used.
FINDING 4.10 CO2 Transportation Infrastructure. The optimal CO2 transport and delivery infrastructure to enable utilization depends on the product type. In some cases, commodity chemicals, plastics, and fuels derived
from CO2 can be synthesized using existing facilities for petrochemical-based production and would benefit from centralized infrastructure for CO2 capture, transport, and conversion. On the other hand, concretes and aggregates are produced locally, and would be best served with a smaller-scale, local or regional CO2 capture and/or distribution network. Clarity is needed on the long-term availability and desirability of utilizing CO2 from point sources (fossil or biogenic) versus sourcing CO2 from air or water, as well as the system-level trade-offs that result from developing infrastructure at different locations and scales.
FINDING 4.11 Electricity Requirements for CO2 Utilization. Many CO2 utilization processes will significantly increase demand for electricity, particularly zero-carbon-emissions electricity, compared to current production methods for the same product, and likely require 24/7 operation to be economical. These requirements will impact the optimal power generation mix, load management, and transmission and distribution planning for the electricity grid, especially given that many zero-carbon-emissions electricity sources provide intermittent generation and therefore likely will require concomitant development of energy storage.
RECOMMENDATION 4.4. National policy should prioritize carbon-emissions-free energy as inputs to all aspects of a net-zero-carbon-emissions system, including growth in emissions-free energy to accommodate CO2 utilization. In the near term, the U.S. Department of Energy should coordinate efforts to advance CO2 utilization with carbon-emissions-free energy projects, especially those with intermittent characteristics, such as solar and wind energy systems that offer opportunities to capitalize on production capacity that would otherwise be curtailed.
FINDING 4.12 Hydrogen Requirements for CO2 Utilization. Many CO2 utilization processes require net-zero-emissions hydrogen as an input. Hydrogen is difficult to transport and store (though proven technologies exist for both), and studies on its global warming potential are evolving. These factors may impact decisions about the design of hydrogen infrastructure, favoring on-site, on-demand production of hydrogen where feasible and potentially motivating the use of hydrogen carriers (which themselves could be products of CO2 utilization) for long-distance transportation.
RECOMMENDATION 4.5. Given the complexity of transporting and storing the hydrogen required for upgrading CO2 to hydrocarbon products, project planners should consider co-location of hydrogen generation with manufacturing plants utilizing CO2 as a feedstock. Given that most utilization projects will require 24/7 plant operation to be economically viable, project planners should also incorporate energy storage into the facility design.
FINDING 4.13 Water Requirements for Different CO2 Utilization Processes. In the near term, CO2 utilization processes requiring water include electrolytic hydrogen production for reaction with CO2, biological CO2 conversion, and process cooling. In the longer term, (photo)electrochemical conversion of CO2 to chemicals and fuels also may be deployed commercially and would require water as a direct input.
FINDING 4.14 Local Water Impacts of CO2 Utilization. In total nationally, the water requirements for CO2 utilization do not represent a significant increase above current water demand, but water availability may be limited at a local level due to geographic variability. Many regions that have the abundance of clean electricity generation capacity needed to support net-zero or net-negative CO2 utilization processes are water stressed, which could lead to local competition for water resources.
RECOMMENDATION 4.6. The U.S. Department of Energy (DOE) should work with its national laboratories to analyze the effect of CO2 utilization, and the required enabling inputs (e.g., hydrogen), on local water demands. This analysis should identify regions that may experience water stress and opportunities for water infrastructure to serve multiple projects or facilities, while at the same time considering local environmental and justice impacts. The analysis should also explore the feasibility of using non-freshwater for some appli-
cations and deploying desalination projects that can provide water for hydrogen and other uses. The results of this analysis should be taken into account in project and location selection for any DOE-funded activity.
FINDING 4.15 Climate Impact of Decarbonizing Energy. In the long term, CO2 utilization will fit into a larger system powered by net-zero-carbon-emissions energy, including decarbonized electric power for transportation, buildings, and other industrial activities. In the short term, with limited availability of emissions-free electricity, decarbonizing electric power systems will have more impact on total emissions reduction than using that same electricity to directly enable CO2 utilization for net-zero chemicals and materials production. Photosynthetic processes for biological CO2 conversion can use energy from the sun directly, without requiring any clean electricity infrastructure for photosynthesis.
4.7 REFERENCES
Abbas, Z., T. Mezher, and M.R.M. Abu-Zahra. 2013. “CO2 Purification. Part I: Purification Requirement Review and the Selection of Impurities Deep Removal Technologies.” International Journal of Greenhouse Gas Control 16(August):324–334. https://doi.org/10.1016/j.ijggc.2013.01.053.
Abramson, E., D. McFarlane, and J. Brown. 2020. “Transport Infrastructure for Carbon Capture and Storage: Whitepaper on Regional Infrastructure for Midcentury Decarbonization.” Minneapolis, MN: Great Plains Institute. https://www.betterenergy.org/wp-content/uploads/2020/06/GPI_RegionalCO2Whitepaper.pdf.
Abramson, E., E. Thomley, and D. McFarlane. 2022. An Atlas of Carbon and Hydrogen Hubs for United States Decarbonization. Minneapolis, MN: Great Plains Institute. https://scripts.betterenergy.org/CarbonCaptureReady/GPI_Carbon_and_Hydrogen_Hubs_Atlas.pdf.
ACER (European Union Agency for the Cooperation of Energy Regulators). 2021. Transporting Pure Hydrogen by Repurposing Existing Gas Infrastructure: Overview of Existing Studies and Reflections on the Conditions for Repurposing. Ljubljana, Slovenia: ACER. https://acer.europa.eu/Official_documents/Acts_of_the_Agency/Publication/Transporting%20Pure%20Hydrogen%20by%20Repurposing%20Existing%20Gas%20Infrastructure_Overview%20of%20studies.pdf.
Al Baroudi, H., A. Awoyomi, K. Patchigolla, K. Jonnalagadda, and E.J. Anthony. 2021. “A Review of Large-Scale CO2 Shipping and Marine Emissions Management for Carbon Capture, Utilisation and Storage.” Applied Energy 287(April):116510. https://doi.org/10.1016/j.apenergy.2021.116510.
Alcalde, J., N. Heinemann, L. Mabon, R.H. Worden, H. de Coninck, H. Robertson, M. Maver, et al. 2019. “Acorn: Developing Full-Chain Industrial Carbon Capture and Storage in a Resource- and Infrastructure-Rich Hydrocarbon Province.” Journal of Cleaner Production 233(October):963–971. https://doi.org/10.1016/j.jclepro.2019.06.087.
Allred, B.W., W.K. Smith, D. Twidwell, J.H. Haggerty, S.W. Running, D.E. Naugle, and S.D. Fuhlendorf. 2015. “Ecosystem Services Lost to Oil and Gas in North America.” Science 348(6233):401–402. https://doi.org/10.1126/science.aaa4785.
Anchondo, C., and E. Klump. 2020. “Petra Nova Is Closed: What It Means for Carbon Capture.” E&E News, September 22. https://www.eenews.net/articles/petra-nova-is-closed-what-it-means-for-carbon-capture.
ANL (Argonne National Laboratory). 2020. “Available Water Remaining for the United States (AWARE-US) Model.” Energy Systems, February 18. https://greet.es.anl.gov/aware#page-header.
Bazzanella, A.M., and F. Ausfelder. 2017. Low Carbon Energy and Feedstock for the European Chemical Industry. Technology Study. Germany: DECHEMA. https://dechema.de/dechema_media/Downloads/Positionspapiere/Technology_study_Low_carbon_energy_and_feedstock_for_the_European_chemical_industry-p-20002750.pdf.
Benquet, C., A. Knarvik, E. Gjernes, O.A. Hvidsten, E.R. Kleppe, and S. Akhter. 2021. “First Process Results and Operational Experience with CESAR1 Solvent at TCM with High Capture Rates (ALIGN-CCUS Project).” Proceedings of the 15th Greenhouse Gas Control Technologies Conference. Abu Dhabi, UAE. https://dx.doi.org/10.2139/ssrn.3814712.
Bjerketvedt, V.S., A. Tomasgard, and S. Roussanaly. 2022. “Deploying a Shipping Infrastructure to Enable Carbon Capture and Storage from Norwegian Industries.” Journal of Cleaner Production 333(January):129586. https://doi.org/10.1016/j.jclepro.2021.129586.
Blanton, E.M., M.C. Lott, and K.N. Smith. 2021. Investing in the US Natural Gas Pipeline System to Support Net-Zero Targets. New York: Columbia University Center on Global Energy Policy. https://www.energypolicy.columbia.edu/sites/default/files/file-uploads/GasPipelines_CGEP_Report_081721.pdf.
Bostick, D. 2019. “Flue Gas Aerosol Pretreatment Technologies to Minimize Post-Combustion CO2 Capture (PCC) Solvent Losses.” Presented at the 2019 NETL CO2 Capture Technology Meeting, Pittsburgh, PA. August 26. https://netl.doe.gov/sites/default/files/netl-file/D-Bostick-Linde-Aerosol-Pretreatment.pdf.
Bostick, D. 2022. “Flue Gas Aerosol Pretreatment Technologies to Minimize PCC Solvent Losses.” In 2022 Compendium of Carbon Capture Technologies. DOE Project No. FE0031592. Linde Gas North America, LLC. https://edx.netl.doe.gov/dataset/flue-gas-aerosol-pretreatment-technologies-to-minimize-pcc-solvent-losses.
Brownsort, P.A. 2019. Briefing on Carbon Dioxide Specifications for Transport. 1st Report of the Thematic Working Group on CO2 Transport, Storage and Networks. European Union: CCUS Projects Network. https://www.ccusnetwork.eu/sites/default/files/TG3_Briefing-CO2-Specifications-for-Transport.pdf.
C2ES (Center for Climate and Energy Solutions). 2021. “U.S. State Greenhouse Gas Emissions Targets.” https://www.c2es.org/document/greenhouse-gas-emissions-targets.
CATF (Clean Air Task Force). 2021. “US Carbon Capture Activity and Project Map.” https://www.catf.us/ccsmapus.
CATF. 2022. “Potential Carbon Capture Projects Under 45Q Federal Tax Credit.” https://docs.google.com/spreadsheets/d/115hsADg3ymy3lKBy4PBQRXz_MBknptqlRtlfuv79XV8/edit#gid=1540463113.
Cemnet. 2022. “Cement Plants Located in United States.” https://www.cemnet.com/global-cement-report/country/united-states.
Chemical Engineering. 2010. “Supercritical CO2: A Green Solvent. Chemical Engineering: Essentials for the CPI Professional.” https://www.chemengonline.com/supercritical-co2-a-green-solvent/?printmode=1.
Choi, Y.S., S. Nesic, and D. Young. 2010. “Effect of Impurities on the Corrosion Behavior of CO2 Transmission Pipeline Steel in Supercritical CO2−Water Environments.” Environmental Science & Technology 44(23):9233–9238. https://doi.org/10.1021/es102578c.
CO2Quest. 2017. “Overviews: Experiments Video.” CO2Quest: Impact of the Quality of CO2 on Storage and Transport. 2017. https://www.co2quest.eu/overviews/#tab-1-3-experiments-video.
Cole, W.J., D. Greer, P. Denholm, A.W. Frazier, S. Machen, T. Mai, N. Vincent, and S.F. Baldwin. 2021. “Quantifying the Challenge of Reaching a 100% Renewable Energy Power System for the United States.” Joule 5(7):1732–1748. https://doi.org/10.1016/j.joule.2021.05.011.
Concawe. 2021. “Technology Scouting—Carbon Capture: From Today’s to Novel Technologies.” Concawe Review 29(2):4–14.
Corsten, M., A. Ramírez, L. Shen, J. Koornneef, and A. Faaij. 2013. “Environmental Impact Assessment of CCS Chains—Lessons Learned and Limitations from LCA Literature.” International Journal of Greenhouse Gas Control 13(March):59–71. https://doi.org/10.1016/j.ijggc.2012.12.003.
Deng, H., S. Roussanaly, and G. Skaugen. 2019. “Techno-Economic Analyses of CO2 Liquefaction: Impact of Product Pressure and Impurities.” International Journal of Refrigeration 103(July):301–315. https://doi.org/10.1016/j.ijrefrig.2019.04.011.
Devitt, D.A., M.H. Young, and J.P. Pierre. 2020. “Assessing the Potential for Greater Solar Development in West Texas, USA.” Energy Strategy Reviews 29(May):100490. https://doi.org/10.1016/j.esr.2020.100490.
Digdaya, I.A., I. Sullivan, M. Lin, L. Han, W. Cheng, H.A. Atwater, and C. Xiang. 2020. “A Direct Coupled Electrochemical System for Capture and Conversion of CO2 from Oceanwater.” Nature Communications 11(1):4412. https://doi.org/10.1038/s41467-020-18232-y.
DOE (U.S. Department of Energy). 2022. “Biden-Harris Administration Launches $2.6 Billion Funding Programs to Slash Carbon Emissions.” Energy.gov. https://www.energy.gov/articles/biden-harris-administration-launches-26-billion-funding-programs-slash-carbon-emissions?utm_medium=email&utm_source=govdelivery.
DOE-BETO (Bioenergy Technologies Office). 2021. 2021 Project Peer Review. Washington, DC: DOE. https://www.energy.gov/sites/default/files/2022-06/beto-00-2021-peer-review-report.pdf.
DOE-EERE (Office of Energy Efficiency & Renewable Energy). 2017. “Confronting the Duck Curve: How to Address Over-Generation of Solar Energy.” Energy.gov, October 12. https://www.energy.gov/eere/articles/confronting-duck-curve-how-address-over-generation-solar-energy.
EC (European Commission, Directorate-General for Climate Action). 2011. Implementation of Directive 2009/31/EC on the Geological Storage of Carbon Dioxide: Guidance Document 2, Characterisation of the Storage Complex, CO2 Stream Composition, Monitoring and Corrective Measures. Luxembourg: Publications Office. https://doi.org/DOI:%2010.2834/98293.
EEA (European Environment Agency). 2020. “Carbon Capture and Storage Could Also Impact Air Pollution.” https://www.eea.europa.eu/highlights/carbon-capture-and-storage-could.
EFI (Energy Futures Initiative). 2021. The Future of Clean Hydrogen in the United States: Views from Industry, Market Innovators, and Investors. From Kilograms to Gigatons: Pathways for Hydrogen Market Formation in the United States. Washington, DC: EFI. https://energyfuturesinitiative.org/wp-content/uploads/sites/2/2022/03/The-Future-of-Clean-Hydrogen-in-the-U.S._Report-1.pdf.
EIA (U.S. Energy Information Administration). 2022a. “Energy-Related CO2 Emission Data Tables.” https://www.eia.gov/environment/emissions/state.
EIA. 2022b. “Natural Gas Explained: Liquefied Natural Gas.” https://www.eia.gov/energyexplained/natural-gas/liquefied-natural-gas.php.
EIA. 2022c. “U.S. Liquefaction Capacity.” https://www.eia.gov/naturalgas/data.php#imports.
EIGA (European Industrial Gases Association). 2016. “Carbon Dioxide Food and Beverages Grade, Source Qualification, Quality Standards and Verification.” EIGA Doc 70/17, revision of Doc 70/08. https://www.eiga.eu/ct_documents/doc070-pdf.
EIGA. 2018. “Minimum Specifications for Food Gas Applications.” EIGA Doc 126/20, revision of Doc 126/18. https://www.eiga.eu/ct_documents/doc126-pdf.
Eisaman, M.D., J.L.B. Rivest, S.D. Karnitz, C. de Lannoy, A. Jose, R.W. DeVaul, and K. Hannun. 2018. “Indirect Ocean Capture of Atmospheric CO2: Part II. Understanding the Cost of Negative Emissions.” International Journal of Greenhouse Gas Control 70(March):254–261. https://doi.org/10.1016/j.ijggc.2018.02.020.
Element Energy. 2018. Shipping CO2—UK Cost Estimation Study. Final report for Business, Energy & Industrial Strategy Department. Cambridge, UK. https://assets.publishing.service.gov.uk/government/uploads/system/uploads/attachment_data/file/761762/BEIS_Shipping_CO2.pdf.
Eller, D. 2022. “What We Know About Three Carbon Capture Pipelines Proposed in Iowa.” Des Moines Register April 24. https://www.desmoinesregister.com/story/money/business/2021/11/28/what-is-carbon-capture-pipeline-proposals-iowa-ag-ethanol-emissions/8717904002.
EPA (U.S. Environmental Protection Agency). 2000. “Appendix B–Overview of Acute Health Effects.” In Carbon Dioxide as a Fire Suppressant: Examining the Risks. Washington, DC: Office of Air and Radiation Stratospheric Protection Division. https://www.epa.gov/sites/default/files/2015-06/documents/co2appendixb.pdf.
EPA. 2022a. “Summary Data: EGRID2020.” https://www.epa.gov/system/files/documents/2022-01/egrid2020_summary_tables.pdf.
EPA. 2022b. “Understanding Global Warming Potentials.” https://www.epa.gov/ghgemissions/understanding-global-warming-potentials.
Equinor. 2019. Northern Lights Project Concept Report. RE-PM673-00001. Washington, DC. https://ccsnorway.com/app/uploads/sites/6/2020/05/Northern-Lights-Project-Concept-report.pdf.
Ferrari, N., L. Mancuso, K. Burnard, and F. Consonni. 2019. “Effects of Plant Location on Cost of CO2 Capture.” International Journal of Greenhouse Gas Control 90(November):102783. https://doi.org/10.1016/j.ijggc.2019.102783.
Field, R.A., and R.G. Derwent. 2021. “Global Warming Consequences of Replacing Natural Gas with Hydrogen in the Domestic Energy Sectors of Future Low-Carbon Economies in the United Kingdom and the United States of America.” International Journal of Hydrogen Energy 46(58):30190–30203. https://doi.org/10.1016/j.ijhydene.2021.06.120.
Geske, J., N. Berghout, and M. van den Broek. 2015. “Cost-Effective Balance between CO2 Vessel and Pipeline Transport. Part I—Impact of Optimally Sized Vessels and Fleets.” International Journal of Greenhouse Gas Control 36(May):175–188. https://doi.org/10.1016/j.ijggc.2015.01.026.
Gibbins, J., and M. Lucquiaud. 2021. BAT Review for New-Build and Retrofit Post-Combustion Carbon Dioxide Capture Using Amine-Based Technologies for Power and CHP Plants Fueled by Gas and Biomass as an Emerging Technology Under the IED for the UK, UKCCSRC Report. UKCCSRC Report, ver.1.0. Sheffield, UK: UK CCS Research Centre. https://ukccsrc.ac.uk/wp-content/uploads/2021/06/BAT-for-PCC_V1_0.pdf.
Global CCS Institute. 2022. “CO2RE Facilities Database.” https://co2re.co/FacilityData.
Gorset, O., J.N. Knudsen, O.M. Bade, and I. Askestad. 2014. “Results from Testing of Aker Solutions Advanced Amine Solvents at CO2 Technology Centre Mongstad.” Energy Procedia 63:6267–6280. https://doi.org/10.1016/j.egypro.2014.11.658.
Green Hydrogen Coalition. n.d. “HyDeal Los Angeles: Architecting the Green Hydrogen Ecosystem for a Deeply Decarbonized LA.” https://static1.squarespace.com/static/5e8961cdcbb9c05d73b3f9c4/t/6179eb9cf8ac24238842374d/1635380127410/HyDeal+LA+Phase+1+Takeaways.pdf.
Gulf Publishing Holdings LLC. 2022. “US to Drive LNG Liquefaction Capacity Growth in North America by 2024.” Gas Processing & LNG. http://www.gasprocessingnews.com/news/us-to-drive-lng-liquefaction-capacity-growth-in-north-america-by-2024.aspx.
Hewitt, D. 2019. “Behold the Butterfly Graph. Northeast Energy Efficiency Partnerships.” https://neep.org/blog/behold-butterfly-graph.
Hiestermann, M. 2022. “Hydrogen Supply Chain Portfolios in the Netherlands Between 2030 and 2050.” Master thesis, Delft University of Technology, Netherlands. https://repository.tudelft.nl/islandora/object/uuid%3Ac4b1c997-f0f6-4859-ba9b-0f579c8d9052.
HM Government. 2021. Industrial Decarbonisation Strategy. United Kingdom: Department for Business, Energy & Industrial Strategy. https://assets.publishing.service.gov.uk/government/uploads/system/uploads/attachment_data/file/970229/Industrial_Decarbonisation_Strategy_March_2021.pdf.
Ho, E. 2006. Elastomeric Seals for Rapid Gas Decompression Applications in High-Pressure Services. Bedfordshire, UK: BHR Group Limited. https://www.hse.gov.uk/research/rrpdf/rr485.pdf.
Holmgren, J. 2022. “Infrastructure Needs for Capture and Utilization Companies: LanzaTech.” Presentation to the National Academies’Committee on Carbon Utilization Infrastructure, Markets, Research and Development Meeting #2. March 2. https://www.nationalacademies.org/event/03-01-2022/carbon-utilization-infrastructure-markets-research-and-development-meeting-2.
Hopcroft, T., and A. Papadamou. 2021. “The Water Industry in a Hydrogen Economy.” PA Consulting, July 12. https://www.paconsulting.com/newsroom/expert-opinion/the-water-report-the-water-industry-in-a-hydrogen-economy-12-july-2021.
IEA (International Energy Agency). 2019. The Future of Hydrogen: Seizing Today’s Opportunities. Paris. https://iea.blob.core.windows.net/assets/9e3a3493-b9a6-4b7d-b499-7ca48e357561/The_Future_of_Hydrogen.pdf.
IEA. 2020. Energy Technology Perspectives 2020 – Special Report on Carbon Capture Utilisation and Storage: CCUS in Clean Energy Transitions. Paris. https://iea.blob.core.windows.net/assets/181b48b4-323f-454d-96fb-0bb1889d96a9/CCUS_in_clean_energy_transitions.pdf.
IEA. 2021. “Is Carbon Capture Too Expensive?” https://www.iea.org/commentaries/is-carbon-capture-too-expensive.
IEAGHG (IEA Greenhouse Gas R&D Programme). 2004. Ship Transport of CO2. Report No. PH4/30. Cheltenham, UK. https://ieaghg.org/docs/General_Docs/Reports/PH4-30%20Ship%20Transport.pdf.
IEAGHG. 2018. Cost of CO2 Capture in the Industrial Sector: Cement and Iron and Steel Industries. IEAGHG Technical Review 2018-TR03. Cheltenham, UK. https://ieaghg.org/publications/technical-reports/reports-list/10-technical-reviews/931-2018-tr03-cost-of-co2-capture-in-the-industrial-sector-cement-and-iron-and-steel-industries.
IRENA (International Renewable Energy Agency). 2022. Geopolitics of the Energy Transformation: The Hydrogen Factor. Abu Dhabi: IRENA. https://www.irena.org/-/media/Files/IRENA/Agency/Publication/2022/Jan/IRENA_Geopolitics_Hydrogen_2022.pdf.
Jackson, S., and E. Brodal. 2019. “Optimization of the CO2 Liquefaction Process-Performance Study with Varying Ambient Temperature.” Applied Sciences 9(20):4467. https://doi.org/10.3390/app9204467.
Jenkins, J. 2022. “CO2 Transportation Options.” Presentation to the National Academies’ Committee on Carbon Utilization Infrastructure, Markets, Research and Development Meeting #2. https://www.nationalacademies.org/event/03-01-2022/carbon-utilization-infrastructure-markets-research-and-development-meeting-2.
Kearns, D., H. Liu, and C. Consoli. 2021. Technology Readiness and Costs of CCS. The Circular Carbon Economy: Keystone to Global Sustainability Series. Melbourne, AU: Global CCS Institute. https://www.globalccsinstitute.com/wp-content/uploads/2021/03/Technology-Readiness-and-Costs-for-CCS-2021-1.pdf.
Keith, D.W., G. Holmes, D. St. Angelo, and K. Heidel. 2018. “A Process for Capturing CO2 from the Atmosphere.” Joule 2(8):1573–1594. https://doi.org/10.1016/j.joule.2018.05.006.
Khan, M.A., T. Al-Attas, S. Roy, M.M. Rahman, N. Ghaffour, V. Thangadurai, S. Larter, J. Hu, P.M. Ajayan, and M.G. Kibria. 2021. “Seawater Electrolysis for Hydrogen Production: A Solution Looking for a Problem?” Energy & Environmental Science 14(9):4831–4839. https://doi.org/10.1039/D1EE00870F.
Knoope, M.M.J., I.M.E. Raben, A. Ramírez, M.P.N. Spruijt, and A.P.C. Faaij. 2014. “The Influence of Risk Mitigation Measures on the Risks, Costs and Routing of CO2 Pipelines.” International Journal of Greenhouse Gas Control 29(Octo-ber):104–124. https://doi.org/10.1016/j.ijggc.2014.08.001.
Lampert, D.J., H. Cai, Z. Wang, J. Keisman, M. Wu, J. Han, J. Dunn, et al. 2015. Development of a Life Cycle Inventory of Water Consumption Associated with the Production of Transportation Fuels. ANL/ESD-15/27. Argonne, IL: Argonne National Laboratory. https://doi.org/10.2172/1224980.
Lampert, D.J., H. Cai, and A. Elgowainy. 2016. “Wells to Wheels: Water Consumption for Transportation Fuels in the United States.” Energy & Environmental Science 9(3):787–802. https://doi.org/10.1039/C5EE03254G.
Larson, E., C. Greig, J. Jenkins, E. Mayfield, A. Pascale, C. Zhang, J. Drossman, et al. 2021. Net-Zero America: Potential Pathways, Infrastructure, and Impacts. Final Report. Princeton, NJ: Princeton University. https://netzeroamerica.princeton.edu/the-report.
LBNL (Lawrence Berkeley National Laboratory). 2022. “Generation, Storage, and Hybrid Capacity in Interconnection Queues.” https://emp.lbl.gov/generation-storage-and-hybrid-capacity.
Lebling, K., H. Leslie-Bole, Z. Byrum, and E. Bridgwater. 2022. “6 Things to Know About Direct Air Capture. World Resources Institute.” https://www.wri.org/insights/direct-air-capture-resource-considerations-and-costs-carbon-remova.
Lee, U., Y. Lim, S. Lee, J. Jung, and C. Han. 2012. “CO2 Storage Terminal for Ship Transportation.” Industrial & Engineering Chemistry Research 51(1):389–397. https://doi.org/10.1021/ie200762f.
Linde. 2022. “Oxygen-Enhanced Combustion for Metal Production.” https://www.lindeus.com/industries/metal-production/oxygen-enhanced-combustion.
Liu, N. 2021. “Increasing Blue Hydrogen Production Affordability.” Hydrocarbon Processing June. https://www.hydrocarbonprocessing.com/magazine/2021/june-2021/special-focus-process-optimization/increasing-blue-hydrogen-production-affordability.
Mac Dowell, N., N. Sunny, N. Brandon, H. Herzog, A.Y. Ku, W. Maas, A. Ramirez, D.M. Reiner, G.N. Sant, and N. Shah. 2021. “The Hydrogen Economy: A Pragmatic Path Forward.” Joule 5(10):2524–2529, reprint. https://doi.org/10.1016/j.joule.2021.09.014.
Mahgerefteh, H., S. Brown, and G. Denton. 2012. “Modelling the Impact of Stream Impurities on Ductile Fractures in CO2 Pipelines.” Chemical Engineering Science 74(May):200–210. https://doi.org/10.1016/j.ces.2012.02.037.
Martynov, S.B., R.H. Talemi, S. Brown, and H. Mahgerefteh. 2017. “Assessment of Fracture Propagation in Pipelines Transporting Impure CO2 Streams.” Energy Procedia 114 (July):6685–6697. https://doi.org/10.1016/j.egypro.2017.03.1797.
McKaskle, R., K. Fisher, P. Selz, and Y. Lu. 2018. Evaluation of Carbon Dioxide Capture Options from Ethanol Plants. Circular 595. Champaign: Illinois State Geological Survey and Prairie Research Institute. https://library.isgs.illinois.edu/Pubs/pdfs/circulars/c595.pdf.
Myers, J.R., G.S. Ruberto, R.A. Paccella, J.A. Ventura, A.L. Boehman, R.J. Briggs, M.T. Pietrucha, S. Bloser, and J.R. Anstrom. 2012. Feasibility Study for Liquefied Natural Gas Utilization for Commercial Vehicles on the Pennsylvania Turnpike. PSU-2011-03. Mid-Atlantic Universities Transportation Center. https://rosap.ntl.bts.gov/view/dot/25519.
Naraharisetti, P.K., T.Y. Yeo, and J. Bu. 2017. “Factors Influencing CO2 and Energy Penalties of CO2 Mineralization Processes.” ChemPhysChem 18(22):3189–3202. https://doi.org/10.1002/cphc.201700565.
NASEM (National Academies of Sciences, Engineering, and Medicine). 2019. Gaseous Carbon Waste Streams Utilization: Status and Research Needs. Washington, DC: The National Academies Press. https://doi.org/10.17226/25232.
NASEM. 2021. The Future of Electric Power in the United States. Washington, DC: The National Academies Press. https://doi.org/10.17226/25968.
Neele, F., R. de Kler, M. Nienoord, P. Brownsort, J. Koornneef, S. Belfroid, L. Peters, A. van Wijhe, and D. Loeve. 2017. “CO2 Transport by Ship: The Way Forward in Europe.” Energy Procedia 114:6824–6834. https://doi.org/10.1016/j.egypro.2017.03.1813.
NETL (National Energy Technology Laboratory). 2015. A Review of the CO2 Pipeline Infrastructure in the U.S. DOE/NETL-2014/1681. Washington, DC: U.S. Department of Energy. https://www.energy.gov/sites/prod/files/2015/04/f22/QER%20Analysis%20-%20A%20Review%20of%20the%20CO2%20Pipeline%20Infrastructure%20in%20the%20U.S_0.pdf.
NETL. 2019. CO2 Impurity Design Parameters. Quality Guidelines for Energy System Studies. Pittsburgh: National Energy Technology Laboratory. https://www.netl.doe.gov/projects/files/QGESSCO2ImpurityDesignParameters_010119.pdf.
NETL. 2020. 2020 Carbon Capture Program R&D: Compendium of Carbon Capture Technology. Pittsburgh: National Energy Technology Laboratory. https://www.netl.doe.gov/sites/default/files/2020-07/Carbon-Capture-Technology-Compendium-2020.pdf.
NETL. 2022. “Carbon Storage Program.” U.S. Department of Energy. https://netl.doe.gov/sites/default/files/2022-08/Program-116.pdf.
New Jersey Department of Health. 2016. “Hazardous Substance Fact Sheet: Carbon Dioxide.” https://nj.gov/health/eoh/rtkweb/documents/fs/0343.pdf.
Nickel, R., L. Hampton, and N. Williams. 2022. “N. America’s Old Pipelines Seek New Life Moving Carbon in Climate Push.” Reuters February 23. https://www.reuters.com/business/sustainable-business/n-americas-old-pipelines-seek-new-life-moving-carbon-climate-push-2022-02-23.
NPC (National Petroleum Council). 2021. “CO2 Transport.” Chapter 6 in Meeting the Dual Challenge: A Roadmap to At-Scale Deployment of Carbon Capture, Use, and Storage. Washington, DC. https://dualchallenge.npc.org/files/CCUS-Chap_6-030521.pdf.
Ozkan, M. 2021. “Direct Air Capture of CO2: A Response to Meet the Global Climate Targets.” MRS Energy & Sustainability 8(2):51–56. https://doi.org/10.1557/s43581-021-00005-9.
Ozkan, M., S.P. Nayak, A.D. Ruiz, and W. Jiang. 2022. “Current Status and Pillars of Direct Air Capture Technologies.” IScience 25(4):103990. https://doi.org/10.1016/j.isci.2022.103990.
Peletiri, S.P., N. Rahmanian, and I.M. Mujtaba. 2018. “CO2 Pipeline Design: A Review.” Energies 11(9):2184. https://doi.org/10.3390/en11092184.
Peletiri, S.P., I.M. Mujtaba, and N. Rahmanian. 2019. “Process Simulation of Impurity Impacts on CO2 Fluids Flowing in Pipelines.” Journal of Cleaner Production 240(December):118145. https://doi.org/10.1016/j.jclepro.2019.118145.
Penev, M., N. Rustagi, C. Hunter, and J. Eichman. 2019. “Energy Storage: Days of Service Sensitivity Analysis.” Presentation to the Hydrogen and Fuel Cell Technical Advisory Committee. March 19. https://www.nrel.gov/docs/fy19osti/73520.pdf.
REPEAT (Rapid Energy Policy Evaluation and Analysis Toolkit). 2022. “Repeatproject.” repeatproject.org.
Reyes-Lúa, A., Y. Arellano, I. Treu Røe, L. Rycroft, T. Wildenborg, and K. Jordal. 2021. CO2 Ship Transport: Benefits for Early Movers and Aspects to Consider. ENER/C2/2017-65/SI2.793333. European Union: CCUS Projects Network. https://www.ccusnetwork.eu/sites/default/files/TG3_Briefing-CO2-ship-transport-Benefits-for-early-movers-and-aspects-to-consider. pdf.
Rosa, L., D.L. Sanchez, G. Realmonte, D. Baldocchi, and P. D’Odorico. 2021. “The Water Footprint of Carbon Capture and Storage Technologies.” Renewable and Sustainable Energy Reviews 138(March):110511. https://doi.org/10.1016/j.rser.2020.110511.
Roussanaly, S., H. Deng, G. Skaugen, and T. Gundersen. 2021. “At What Pressure Shall CO2 Be Transported by Ship? An in-Depth Cost Comparison of 7 and 15 Barg Shipping.” Energies 14(18):5635. https://doi.org/10.3390/en14185635.
Rustagi, N. 2022. “NREL Systems Analysis Overview.” Presentation at the DOE Hydrogen Annual Merit Review. June 6. https://www.hydrogen.energy.gov/pdfs/review22/plenary9_rustagi_2022_o.pdf.
Ruth, M.F., P. Jadun, N. Gilroy, E. Connelly, R. Boardman, A.J. Simon, A. Elgowainy, and J. Zuboy. 2020. The Technical and Economic Potential of the H2@Scale Concept Within the United States. NREL/TP-6A20-77610. Golden, CO: National Renewable Energy Laboratory. https://www.nrel.gov/docs/fy21osti/77610.pdf.
Rütters, H., D. Bettge, R. Eggers, A. Kather, C. Lempp, U. Lubenau, and COORAL-Team. 2015. CO2-Reinheit Für Die Abscheidung Und Lagerung (COORAL)–Synthese. Hannover: Bundesanstalt für Geowissenschaften und Rohstoffe. https://www.bgr.bund.de/DE/Themen/Nutzung_tieferer_Untergrund_CO2Speicherung/CO2Speicherung/COORAL/Downloads/Synthesebericht.pdf?__blob=publicationFile&v=6.
Rystad Energy. 2021. “Green Hydrogen Projects Will Stay Dry Without a Parallel Desalination Market to Provide Fresh Water.” https://www.hellenicshippingnews.com/green-hydrogen-projects-will-stay-dry-without-a-parallel-desalination-market-to-provide-fresh-water.
Shaw, D. 2009. “Cansolv CO2 Capture: The Value of Integration.” Energy Procedia 1(1):237–246. https://doi.org/10.1016/j.egypro.2009.01.034.
Shi, X., X. Liao, and Y. Li. 2020. “Quantification of Fresh Water Consumption and Scarcity Footprints of Hydrogen from Water Electrolysis: A Methodology Framework.” Renewable Energy 154(July):786–796. https://doi.org/10.1016/j.renene.2020.03.026.
SINTEF. 2019. “CO2 Impurities: What Else Is There in CO2 except CO2?” Blog. November 6. https://blog.sintef.com/sintefenergy/energy-efficiency/what-else-is-there-in-co2-except-co2.
Smith, W.A., T. Burdyny, D.A. Vermaas, and H. Geerlings. 2019. “Pathways to Industrial-Scale Fuel Out of Thin Air from CO2 Electrolysis.” Joule 3(8):1822–1834. https://doi.org/10.1016/j.joule.2019.07.009.
Soraghan, M., and C. Anchondo. 2022. “Biden Releases Plan to Avoid “Dangerous” CO2 Pipeline Failures.” E&E News, May 27. https://www.eenews.net/articles/biden-releases-plan-to-avoid-dangerous-co2-pipeline-failures.
Spietz, T., S. Dobras, L. Więcław-Solny, and A. Krótki. 2017. “Nitrosamines and Nitramines in Carbon Capture Plants.” Environmental Protection and Natural Resources 28(4):43–50. https://doi.org/10.1515/oszn-2017-0027.
Stolaroff, J.K., S.H. Pang, W. Li, W.G. Kirkendall, H.M. Goldstein, R.D. Aines, and S.E. Baker. 2021. “Transport Cost for Carbon Removal Projects with Biomass and CO2 Storage.” Frontiers in Energy Research 9(May). https://www.frontiersin.org/article/10.3389/fenrg.2021.639943.
Talemi, R.H., S. Brown, S. Martynov, and H. Mahgerefteh. 2016. “Hybrid Fluid–Structure Interaction Modelling of Dynamic Brittle Fracture in Steel Pipelines Transporting CO2 Streams.” International Journal of Greenhouse Gas Control 54(Novem-ber):702–715. https://doi.org/10.1016/j.ijggc.2016.08.021.
Talemi, R., S. Cooreman, H. Mahgerefteh, S. Martynov, and S. Brown. 2019. “A Fully Coupled Fluid-Structure Interaction Simulation of Three-Dimensional Dynamic Ductile Fracture in a Steel Pipeline.” Theoretical and Applied Fracture Mechanics 101(June):224–235. https://doi.org/10.1016/j.tafmec.2019.02.005.
Tarroja, B., F. Chiang, A. AghaKouchak, and S. Samuelsen. 2018. “Assessing Future Water Resource Constraints on Thermally Based Renewable Energy Resources in California.” Applied Energy 226(September):49–60. https://doi.org/10.1016/j.apenergy.2018.05.105.
Tollefson, J. 2018. “Sucking Carbon Dioxide from Air Is Cheaper Than Scientists Thought.” Nature 558(173). https://doi.org/10.1038/d41586-018-05357-w.
UNFCCC (United Nations Framework Convention on Climate Change). 2022. “The Paris Agreement.” https://unfccc.int/process-and-meetings/the-paris-agreement/the-paris-agreement.
Van Atten, C., A. Saha, L. Hellgren, and T. Langlois. 2021. Benchmarking Air Emissions of the 100 Largest Electric Power Producers in the United States. Concord, MA: M.J. Bradley & Associates. https://www.mjbradley.com/sites/default/files/Presentation_of_Results_2021.pdf.
Van der Giesen, C., C.J. Meinrenken, R. Kleijn, B. Sprecher, K.S. Lackner, and G.J. Kramer. 2017. “A Life Cycle Assessment Case Study of Coal-Fired Electricity Generation with Humidity Swing Direct Air Capture of CO2 Versus MEA-Based Post-combustion Capture.” Environmental Science & Technology 51(2):1024–1034. https://doi.org/10.1021/acs.est.6b05028.
van Zalk, J., and P. Behrens. 2018. “The Spatial Extent of Renewable and Non-Renewable Power Generation: A Review and Meta-Analysis of Power Densities and Their Application in the U.S.” Energy Policy 123(December):83–91. https://doi.org/10.1016/j.enpol.2018.08.023.
Wang, H., J. Chen, and Q. Li. 2019. “A Review of Pipeline Transportation Technology of Carbon Dioxide.” IOP Conference Series: Earth and Environmental Science 310(3):032033. https://doi.org/10.1088/1755-1315/310/3/032033.
Warwick, N., P. Griffiths, J. Keeble, A. Archibald, J. Pyle, and K. Shine. 2022. Atmospheric Implications of Increased Hydrogen Use. Cambridge, UK: University of Cambridge, National Centre for Atmospheric Sciences, University of Reading. https://assets.publishing.service.gov.uk/government/uploads/system/uploads/attachment_data/file/1067144/atmospheric-implications-of-increased-hydrogen-use.pdf.
Wilday, J., J.L. Saw, M. Wardman, and M. Bilio. 2014. “The CO2PipeHaz Good Practice Guidelines for CO2 Pipeline Safety.” Institution of Chemical Engineers Symposium Series, January. https://www.icheme.org/media/8946/xxiv-paper-51.pdf.
Woolley, R.M., M. Fairweather, C.J. Wareing, S.A.E.G. Falle, H. Mahgerefteh, S. Martynov, S. Brown, et al. 2014. “CO2PipeHaz: Quantitative Hazard Assessment for Next Generation CO2 Pipelines.” Energy Procedia 63:2510–2529. https://doi.org/10.1016/j.egypro.2014.11.274.
Xu, H., U. Lee, A.M. Coleman, M.S. Wigmosta, and M. Wang. 2019. “Assessment of Algal Biofuel Resource Potential in the United States with Consideration of Regional Water Stress.” Algal Research 37(January):30–39. https://doi.org/10.1016/j.algal.2018.11.002.
Yoshimura, R., S. Wai, Y. Ota, K. Nishioka, and Y. Suzuki. 2022. “Effects of Artificial River Water on PEM Water Electrolysis Performance.” Catalysts 12(9):934. https://doi.org/10.3390/catal12090934.
Zahid, U., J. An, C. Lee, U. Lee, and C. Han. 2015. “Design and Operation Strategy of CO2 Terminal.” Industrial & Engineering Chemistry Research 54(8):2353–2365. https://doi.org/10.1021/ie503696x.
Zeng, Y., and K. Li. 2020. “Influence of SO2 on the Corrosion and Stress Corrosion Cracking Susceptibility of Supercritical CO2 Transportation Pipelines.” Corrosion Science 165(April):108404. https://doi.org/10.1016/j.corsci.2019.108404.
ZEP (Zero Emissions Platform). 2011. The Costs of CO2 Transport: Post-Demonstration CCS in the EU. Brussels: European Technology Platform for Zero Emission Fossil Fuel Power Plants. https://www.globalccsinstitute.com/archive/hub/publications/119811/costs-co2-transport-post-demonstration-ccs-eu.pdf.
ZEP. 2020. A Trans-European Transportation Infrastructure for CCUS: Opportunities & Challenges. Brussels: Zero Emissions Platform. https://zeroemissionsplatform.eu/wp-content/uploads/A-Trans-European-CO2-Transportation-Infrastructure-for-CCUS-Opportunities-Challenges-1.pdf.
Zhang, X., F. Jin, X. Yuan, and H. Zhang. 2021. “Low-Carbon Multimodal Transportation Path Optimization Under Dual Uncertainty of Demand and Time.” Sustainability 13(15):8180. https://doi.org/10.3390/su13158180.


