
2
Types of Data and Methods for Combining Them
This chapter briefly discusses types of data, including government surveys and data collected by government agencies while administering programs (administrative records), as well as non-governmental data from the private sector, sensors and satellites, the internet, and other sources. The chapter also discusses some of the methods that have been proposed for combining these data, providing background information for subsequent chapters discussing ways that federal statistical programs use, or could use, alternative data sources. These issues are described in lay terms, and readers interested in technical details are referred to the cited literature. The panel’s approach complements that of the first National Academies of Sciences, Engineering, and Medicine (National Academies) report in this series (NASEM, 2023), which discusses issues of acquiring data, data governance, and key desired attributes of a new data infrastructure. Many of the data sources considered contain records on individual persons or businesses, raising concerns about informed consent, privacy, and confidentiality. Privacy issues will be studied in depth in subsequent reports in this series, but it is important to note that finding workable solutions to address these concerns is essential for data sharing and linkages.
2.1 TYPES OF DATA SOURCES
In the 19th and early 20th centuries, when many of the federal statistical agencies were formed, data were scarce and difficult to obtain. Today, data are plentiful. However, some data sources are more suitable than others for providing statistics that are fit for a particular use (see Chapter 1). Citro
(2014) and the National Academies (NASEM, 2017c) detailed advantages and disadvantages of various types of data for producing official statistics. This section briefly describes the major types of data discussed in this report. Table 2-1 summarizes features of these data types that are related to their fitness for use.
Probability Samples
The 1930s were a period of devastating poverty and unemployment in the United States. Newspapers showed pictures of people standing in long bread lines; many people suffered the effects of unemployment personally. How many? No one knew. Estimates of unemployment varied widely, depending on the data sources and calculation techniques. There was no definitive source of information about conditions of the labor force and no way to track changes over time.
Throughout the 1930s, economists and statisticians explored methods for obtaining reliable, objective measures of unemployment and month-to-month changes. These efforts culminated in an April 1940 memorandum titled Monthly Report for Unemployment, which estimated the national unemployment rate to be 15 percent. This statistic was based on a survey of 8,000 households taken in March 1940, and it marked the first unemployment rate estimate from the survey now known as the Current Population Survey (CPS)—the longest-running probability survey in the United States.
Two major characteristics set the CPS apart from previous methods of measuring unemployment.
- The CPS is a probability sample. Housing units, and noninstitutional group quarters such as rooming houses and college dormitories, are randomly selected from the U.S. Census Bureau’s Master Address File, a continually updated list of addresses in the United States. Each month’s sample consists of about 60,000 eligible housing units.1 The key characteristic of a probability sample, under ideal implementation, is that each subset of the population has a known, nonzero probability of being included in the sample. These probabilities can then be used to give an accurate assessment of the precision of each statistic calculated from the sample, typically through a margin of error or a confidence interval.2
___________________
1 See https://www.bls.gov/opub/hom/cps/design.htm and U.S. Census Bureau (2019) for descriptions of how housing units are selected for the CPS. The CPS has used a full probability sampling design since October 1943. See Bregger (1984) and Dunn, Haugen, & Kang (2018) for the history of the CPS.
2 The following references, ordered from least to most technical, describe how probability sampling works: Methods 101 videos from Pew Research (2017), which illustrate the basic
TABLE 2-1 Characteristics of Data Sources
| Characteristic | Probability Survey or Census Conducted by Statistical Agency | Administrative Records | Private-Sector Records | Sensor or Satellite Data | Convenience Samples, Social Media, or Crowdsourcing |
|---|---|---|---|---|---|
| Well-Defined Population | Yes. The agency defines the population of interest. | Yes. The population is usually defined by program requirements. For example, tax records include most persons and businesses that are required to file. | Depends on source. | Usually, since there is control over which data are measured. | Usually not. Population members choose whether to be in the dataset. Sometimes posts are made by automated systems, not real persons. |
| Population Coverage | Usually high, but some parts of population may be underrepresented because of undercoverage or nonresponse (see Chapter 3). | High if population of interest equals the set of records, but administrative records often have undercoverage of the population of interest. | Depends on source and definition of population. Transaction records from a credit card company contain all records from that company’s customers but exclude transactions with other credit cards or cash. | Depends on source. Satellite data may have high coverage; traffic sensors may cover only specific highways; cell phone location data are limited to cell phone users. | Usually poor because sample is self-selected. |
| Statistical Agency Control over Information Collected | High | Low; administrative records are collected for the purpose of the program, but cooperative agreements may be possible whereby additional variables are collected. | Low, but cooperative agreements may be possible. | Low unless data collection is contracted by agency. | Usually low |
| Characteristic | Probability Survey or Census Conducted by Statistical Agency | Administrative Records | Private-Sector Records | Sensor or Satellite Data | Convenience Samples, Social Media, or Crowdsourcing |
|---|---|---|---|---|---|
| Geographic or Subpopulation Detail | Limited for most probability surveys because of sample size; high for censuses. | High for large datasets if variables defining the subpopulations are measured. | Can be high for large datasets, but private-sector organizations might not be willing to share geographic locations or details about subpopulations. | High geographic detail | Usually low |
| Timeliness of Data Availability | Low for most surveys and censuses. Some surveys (such as CPS) provide monthly estimates; most other surveys provide annual or less frequent estimates. | Depends on how frequently data are processed and released. Data collection is often continuous, but data release may take time. | Depends on how frequently data are processed and released. Data collection is often continuous, but it may take time to release to statistical agency. | Depends on how frequently data are processed and released. Data collection is often continuous, and data may be released in “real time” or soon after collection. | Depends on how frequently data are processed and released. Data collection is often continuous. |
| Potential for Record Linkage | High if identifying information is available. | High if identifying information is available. | Depends on availability of linkage information. | High for geographical linkage. | Low, unless survey respondent provides social media account information. |
| Potential for Combining Statistics | High | High | High if population and subgroups are well defined. | High | Low, unless information can be verified from another source. |
SOURCE: Panel generated. This table was inspired by Table 5.1 of Citro (2014), which evaluates additional dimensions.
- The data are gathered for the express purpose of calculating statistics about the labor force. The statistical agency thus controls what information is collected and how it is collected. For the CPS, this means that unemployment is measured using questions specifically designed and tested for that purpose. Month-to-month and year-to-year changes in the unemployment rate can be calculated because unemployment is measured the same way every month.3
Following the success of the CPS, probability samples became widely used throughout the federal government. They allowed for faster and more frequent data collection than a population census, because accurate statistics for the nation as a whole could be calculated from a relatively small sample.4 In 2022, probability samples still form the foundation for statistics in areas ranging from health to crime to agriculture to economic activity. The U.S. Census Bureau alone conducts more than 100 surveys of households and businesses each year.5
Despite their widespread use, however, probability surveys face challenges that diminish their usefulness as a sole source of information. These include:
- Undercoverage and nonresponse. As mentioned earlier, when population units are selected according to the probabilities specified by the survey design, those probabilities can be used to compute
___________________
ideas of random sampling (other videos in the series discuss issues such as question wording and mode effects); Appendix B of Federal Committee for Statistical Methodology (2020), which describes sources of error in various types of data, including probability samples; Kalton (2020), a short book describing the basics of probability sampling; Lohr (2022), a longer book describing how to design and analyze data from probability samples; and Skinner & Wakefield (2017), a compact and comprehensive description of survey methods at a high technical level.
The selection probabilities for a probability sample can be unequal, as long as they are known. For example, CPS sample sizes for states are determined so that each state-level estimate of unemployment, and the national estimate of unemployment, will attain a prespecified level of accuracy. States with smaller populations need higher sampling ratios to achieve that accuracy. The differing designed selection probabilities are accounted for in the estimation process (U.S. Census Bureau, 2019; https://www.bls.gov/opub/hom/cps/design.htm).
3 The CPS questions have been revised at various points in its history, but revisions have been implemented such that changes over time can still be calculated. When the CPS questionnaire was revised in 1994, for example, the old and new questionnaires were run in parallel for 18 months so that statisticians could assess how changes in the questionnaire would affect labor force estimates (U.S. Census Bureau, 2019, p. 112).
4 Of course, a probability sample does not have to be small. Technically, the U.S. Decennial Census of Population and Housing and other censuses can be considered to be probability samples because they are designed so that each subset of the population has a known probability (set equal to one) of being included in the census.
5 https://www.census.gov/programs-surveys/surveyhelp/list-of-surveys.html
-
confidence intervals or margins of error that accurately quantify the accuracy of statistics calculated from the sample; in other words, the sample is designed to be representative of the population. But when the data are collected, the actual probability with which a unit is selected for the sample can end up differing from the designed probability, and this may result in a sample that is no longer representative of the population. The two main causes of discrepancies between the designed and actual probabilities (which may be unknown) are undercoverage and nonresponse.
Units in a probability sample are drawn from a sampling frame, which is typically a list or map of units in the target population. Undercoverage occurs when some target population units are missing from the sampling frame—these missing units then have a zero probability of being included in the sample. The CPS target population is the civilian noninstitutional population aged 16 and over, so some parts of the U.S. population are excluded by design. Since the CPS’s sampling frame is based on housing units, there is undercoverage of groups that are not in that frame, such as people experiencing temporary homelessness.
Nonresponse occurs when units selected to be in the sample fail to provide data. Figure 2-1 displays response rates from 2000–2022 for the major surveys discussed in this report. Response rates for both face-to-face surveys and telephone surveys have decreased since the early 1990s, with the rate of decrease accelerating since 2010 (Williams & Brick, 2018; Dutwin & Buskirk, 2021).
Undercoverage and low response rates are of concern because entities that cannot be selected for the sample or that fail to respond to a survey can differ systematically from entities that participate, causing survey estimates to be biased. Survey producers attempt to adjust for nonresponse through statistical modeling techniques involving weighting and imputation, but these methods are not guaranteed to remove nonresponse bias, especially that due to unobserved factors.6
___________________
6 The amount of bias in a survey estimate depends on (1) the rates of undercoverage and nonresponse; and (2) how much survey participants differ from nonrespondents and persons who are not in the sampling frame. If respondents are similar to nonrespondents, then estimates from a survey will be approximately “on target” even with a low response rate (Groves, 2006). Conversely, a survey with a 90 percent response rate may have high bias if the nonrespondents have large systematic differences from the respondents. Survey weighting adjustments attempt to reduce the bias by using information known about responding and nonresponding units to obtain better estimates of the probabilities that each responding unit
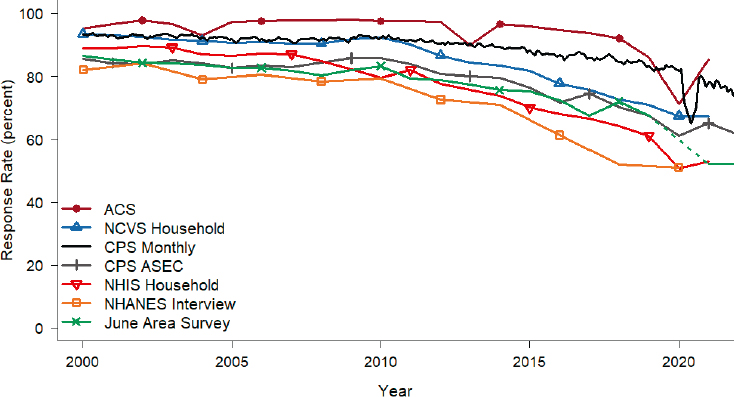
SOURCE: Panel generated.
NOTES: ACS = American Community Survey (Chapters 2, 3, 5); NCVS = National Crime Victimization Survey (Chapters 2, 7); CPS Monthly = Current Population Survey Monthly (Chapters 2, 5); CPS ASEC = Current Population Survey Annual Social and Economic Supplement (Chapter 5); NHIS = National Health Interview Survey (Chapter 6); NHANES = National Health and Nutrition Examination Survey (Chapters 1, 6)—NHANES data are released in two-year cycles; JAS = June Area Survey (Chapter 8).
For NCVS, NHIS, and NHANES, the graph displays household-level response rates. Additional nonresponse occurs when individual persons within households fail to provide data. NHANES response rates are for the interview component; response rates for the examination component are lower.a The dips in response rates in 2020 reflect the disruptions of in-person data collection from the COVID-19 pandemic. The JAS was not conducted in 2020.
aSources for response rates (including the response rate definitions used) are https://www.census.gov/acs/www/methodology/sample-size-and-data-quality/response-rates/ (ACS); https://bjs.ojp.gov/sites/g/files/xyckuh236/files/media/document/samplesize.xlsx (NCVS); https://beta.bls.gov/dataViewer/view/timeseries/LNU09300000 (CPS monthly); Czajka and Beyler (2016); and individual-year documents on “Source and Accuracy of Estimates for Income and Poverty in the United States,” for example, https://www2.census.gov/library/publications/2016/demo/p60-256sa.pdf (CPS ASEC); Survey Description Documents for individual years, available at https://www.cdc.gov/nchs/ (NHIS); https://wwwn.cdc.gov/nchs/nhanes/responserates.aspx (NHANES); https://www.nass.usda.gov/Publications/Methodology_and_Data_Quality/Land_Values/; Tran et al. (2010); and Linda Young, National Agricultural Statistics Service, personal communication (JAS).
-
Timeliness and frequency. The timeliness of a data product is the length of time between the events described in the data and the data product’s availability. Frequency relates to how often survey estimates are published. Timeliness and frequency vary among surveys—for example, the CPS produces monthly estimates of unemployment within four weeks of data collection; but the National Crime Victimization Survey (NCVS; see Chapter 7) publishes annual estimates of the number of violent and property crimes for a calendar year in September or October of the following year. Many statistics about health insurance coverage, transportation usage, education, agriculture, capital expenditures by businesses, and other topics are published once a year. Some surveys, such as those used in the Centers for Disease Control and Prevention’s (CDC) Youth Risk Behavior Surveillance System,7 are conducted every two or three years, and other data collections are conducted even less frequently.
Some surveys may have a tradeoff between timeliness and other aspects of quality, such as accuracy and coherence (see Figure 1-1). For example, the Household Pulse Survey, launched by the U.S. Census Bureau in April 2020, was designed to obtain low-cost, rapid information about social and economic effects of the COVID-19 pandemic, including such topics as child care, education, food security, health, and household spending. Because the survey was collected online with only a short period for following up with nonrespondents, statistics from the Household Pulse Survey could be published within a few weeks of data collection. But the speed and cost savings came at the expense of response rate and coverage. The sample was drawn from the set of Master Address File units for which at least one e-mail address or telephone number was known, thus excluding from the survey those housing units without an associated telephone number or e-mail address. Response rates for the Household Pulse Surveys conducted between April and July 2020 were less than five percent.8
___________________
will appear in the final sample. See Mercer, Lau, & Kennedy (2018) for a nontechnical description of how weighting methods work.
7 https://www.cdc.gov/healthyyouth/data/yrbs/index.htm
8 Information on the Household Pulse Survey can be found at https://www.census.gov/programs-surveys/household-pulse-survey.html. Technical documentation (see, for example, U.S. Census Bureau, 2022b, and Peterson et al., 2021) described the weighting procedures used to adjust for undercoverage and nonresponse and provided a nonresponse bias assessment. Bradley et al. (2021) performed additional examinations of nonresponse bias by comparing Household Pulse Survey estimates with statistics from other data sources.
-
Granularity. A high-quality probability survey of 60,000 households will give accurate estimates for the nation as a whole and for some population subgroups. But the sample size is too small for the survey, by itself, to give accurate estimates for smaller units of geography such as counties, or for demographic groups that account for a small percentage of the U.S. population. For cost and logistical reasons, surveys are often unable to meet the data demands for the high level of granularity needed to understand key population subgroups, which can result in data inequities (see Chapter 3).
For example, NCVS annual data files contain information from about 150,000 household interviews and 240,000 person interviews each year but, because most persons are not robbed during the year, the dataset contains only a small number of robbery victims. A larger probability survey can provide more accurate statistics for small population subgroups but can also be more expensive to conduct. In a typical year, a sample of about 3.5 million households is selected for the American Community Survey (ACS) and the large sample size allows annual estimates to be produced for geographic areas with populations of 65,000 or more. For areas with smaller populations, however, the survey sample size is still too small to produce accurate annual estimates. The U.S. Census Bureau takes two approaches to produce estimates for small-population areas. The first approach accumulates ACS data for a five-year period, thereby approximately quintupling the sample size in the area but at the cost of having older data. The second approach incorporates data from other sources such as tax records to estimate statistics for the current year (see Section 2.2).
Statistics computed from probability surveys typically rely on data provided by respondents. If respondents provide inaccurate information—for example, if a respondent to the ACS misreports a household member’s age, race, or income—those measurement errors affect the accuracy of statistics computed from the survey. Measurement errors, discussed in Groves et al. (2011), affect all the data sources discussed in this section.
Probability surveys have provided the nation with useful statistics on numerous topics for more than 80 years, and the panel anticipates that these surveys will continue to be used to produce statistics in many topic areas, particularly at the national level. Some statistics, such as the percentage of persons looking for work last week or the percentage of criminal victimizations reported to the police, rely on information that can only be provided by individuals in the population—a probability survey is often
still the best method for collecting information on such topics. The main advantages of probability surveys are their ability to represent the entire population (subject to undercoverage and nonresponse) and the statistical agency’s control over what information is collected and how concepts are measured. Probability surveys can also provide an independent check on other sources of information, such as data from private-sector sources or convenience samples, because the random selection process in a probability survey controls biases in sample selection.
Probability surveys are often costly, however, and provide data on a relatively small sample of the population. Decreasing response rates in recent years raise concern that estimates calculated from surveys might not represent characteristics of nonrespondents. In general, even a relatively large national probability survey will not be able, by itself, to provide accurate information about small subpopulations such as counties, school districts, or demographic groups that form small parts of the U.S. population. Alternative data sources may be able to improve the accuracy, timeliness, and granularity of statistics while reducing costs.
CONCLUSION 2-1: Probability surveys still have an important role to play in the production of official statistics but face challenges from nonresponse and high costs. Probability surveys by themselves may not be able to meet increasing societal demands for timely and granular data. For these reasons, alternative data sources are increasingly important to complement surveys.
Administrative Records Collected by Government Agencies
Administrative records are data collected by a federal, state, local, or tribal government agency for administrative purposes such as operating a program. Examples include income tax data, Social Security Administration (SSA) benefit records, health care claims data from the Centers for Medicare & Medicaid Services, student data collected by state departments of education, data on planted acreage from federal crop insurance programs, and data from food assistance and transfer programs such as the Supplemental Nutrition Assistance Program (SNAP).
Administrative records datasets are typically large and contain detailed information. Many are longstanding and collect data on a regular basis. This allows calculation of annual (or more frequent) statistics describing the population included in the administrative records. In addition, when the same units reappear at multiple time periods, it may be possible to create longitudinal datasets that follow the units over time. For example, longitudinal datasets created from corporate tax records can be used to study business formation and growth (see Section 4.1).
Due to their scope, administrative records datasets often contain large sample sizes for subpopulations that might be represented by only a few persons in a probability sample. For example, the NCVS public-use dataset typically contains fewer than 300 robbery victims each year. The Federal Bureau of Investigation’s (FBI) National Incident-Based Reporting System (NIBRS), which compiles data collected by law enforcement agencies, contains details on more than 100,000 robbery incidents that occurred in 2020.9 This sample size allows a researcher to study characteristics of robberies for population subgroups (for example, characteristics of robberies occurring at night with female victims) in a way that is not possible with one year of data from the NCVS.
However, NIBRS records include only crimes that are known to law enforcement agencies that submit data to the FBI (see Chapter 7). If statistics are desired on all robberies—those unreported to the police as well as those appearing in NIBRS—then an additional source of information is needed. Similarly, a researcher studying families experiencing food insecurity will find much valuable information in SNAP data. But many needy families do not participate in the program, and a separate source of information is needed to study nonparticipants.10
The information collected in administrative records is determined by the entity administering the program. In probability surveys, data collection is tailored to information needed to calculate statistics. Administrative records information might be fit for its intended purpose (administering a program) but might not contain the “right” variables to meet the statistical needs.
Another challenge is that the agency collecting the administrative records can change the information that is collected. For example, the 2017 Tax Cuts and Jobs Act removed (through -) the U.S. federal income tax deduction for civilians’ moving expenses, and subsequent individual tax returns collect moving-expense information only for members of the armed forces.
Moreover, as with surveys, information in administrative records may be inaccurate, inconsistent across sources, or subject to changes in definitions or processing procedures over time. A tax filer may misreport income or property values; a health care claim may contain incorrect treatment codes; a law enforcement agency may fail to record a crime or may misclassify the type of crime. Some administrative records information is verified from other sources, but some information, particularly information that is not needed for program administration, may be collected without verification. Judson and Popoff (2005, p. 20) commented: “There is considerable
___________________
9 U.S. Bureau of Justice Statistics (2021b); FBI Crime Data Explorer, https://cde.ucr.cjis.gov
10 Evidence that many needy families do not participate comes from probability surveys (see Chapters 3, 5).
evidence that, if a particular field is ‘important’ to the administrative agency (either because it ties directly to the agency’s funding or to its provision of services), then that field will likely be recorded with some care and some quality control. But if the field is an ‘add on’ or is otherwise superfluous to the agency’s mission, it should be used with caution.”
Some administrative datasets have continual data collection. That does not mean, however, that the dataset is in a form that is ready for statistical uses. It can take a lot of time to process and transfer data for statistical calculations. Some datasets may have duplicated records, with poor-quality information for identifying such duplicates. Sometimes administrative data records are updated as new information comes in, making it challenging to identify data from a fixed time point or to replicate statistics or analyses. Benzeval et al. (2020, p. 18) emphasized that “administrative data, like survey data, have data generating processes, errors can enter through those processes, and indeed, steps in those processes often include human actions.”
The federal government collects some administrative records datasets directly, such as federal income tax records. Other administrative records are compiled from information submitted by state and local governments—examples include NIBRS, SNAP, and the National Vital Statistics System, which collects information from the states on births and deaths. When records are collected from states, care must be taken to ensure that states collect the same information in the same way (see Section 4.3). In addition, some state-level administrative datasets (such as SNAP data) are available only for certain states, not for the entire country.
Administrative datasets may be accompanied by documentation that is relevant to their programmatic use. For use in producing official statistics, however, documentation is needed that describes how each data element is measured, which population units are included (and excluded) from the data, and the limitations of the dataset. This documentation could be produced by the agency collecting the data or by the data user in consultation with the agency.
Records Collected by Private-Sector Organizations
Many private-sector firms and organizations generate large amounts of data that may be relevant to major survey programs (NASEM, 2017c, 2023). Some of these data sources are similar in structure to administrative records: examples include credit card transactions, electronic health records, grocery store scanner data, point-of-sale retail sales data, and stock market transactions.
Studds (2021) and the U.S. Census Bureau (2021d) described the use of private-sector data for the U.S. Census Bureau’s Monthly State Retail Sales
estimates, launched in September 2020.11 Data users had been requesting more timely state-level data on retail sales; to meet that need, the U.S. Census Bureau combined data from three main sources: the Monthly Retail Trade Survey (a probability sample of retail businesses with paid employees), administrative data on gross payroll for retailers, and retailer point-of-sale data purchased from a private-sector firm. Studds (2021, slide 8) outlined challenges involved in working with private-sector data: although private-sector data products can be useful, they often do “not align to the federal statistical system and standards. A heavy lift is required to fully understand methodology, quality, and fitness for use.”
The U.S. Department of Agriculture uses grocery store scanner data and other private-sector data sources to study food access, health, and security.12 The U.S. Bureau of Labor Statistics has been exploring the use of scanner and other private-sector data to supplement or replace information for the Consumer Price Index that is currently collected through surveys (Konny, Williams, & Friedman, 2022; NASEM, 2022d). The first National Academies report in this series (NASEM, 2023) discussed additional examples of the use of private-sector data by federal statistical agencies.
As with administrative records, private-sector data are usually collected for a purpose other than producing official statistics, and they may have substantial undercoverage of the population of interest. Electronic health records contain information on medical conditions for persons who engage with the health care system, but persons without insurance or ready access to medical care will be underrepresented in the dataset. Similarly, persons who have no credit cards or loans might not appear in credit bureau data or in credit card companies’ transaction data. In addition, data may be available from only some insurers or some credit card providers, thus missing health claims or transactions processed by other companies.
If data are collected from multiple companies (for example, claims data from several health insurance companies), each company may measure different items, use different categories of measurement, and have its own data format. A company that initially participates in a data-sharing agreement may decide to end that participation at a later date or may change the data items that it collects. As with administrative records, data processing and standardization can be challenging.
Private-sector organizations may be reluctant to share data about individual persons or businesses out of concerns for privacy or competitive advantage. However, data combination does not necessarily require access to individual records (see Section 2.2). Summary statistics supplied by
___________________
11 https://www.census.gov/retail/state_retail_sales.html
12 https://www.ers.usda.gov/topics/food-markets-prices/food-prices-expenditures-and-establishments/using-proprietary-data/
third-party organizations can also be combined with data from probability surveys and censuses.
Satellite, Sensor, and Location Data
Satellite and earth observation data are a rich source of information for official statistics, particularly for agricultural and environmental statistics (Global Strategy to Improve Agricultural and Rural Statistics, 2017; United Nations Economic and Social Council, 2019). The National Agricultural Statistics Service’s Cropland Data Layer, a map of land cover in the continental United States, is created primarily from satellite imagery. These data provide preliminary acreage estimates for major agricultural commodities and are used to improve agricultural sampling frames (Boryan & Yang, 2021; see Chapter 8).
Sensor and location data can provide additional information without increasing respondent burden. Traffic sensors collect information about the amount of traffic on selected roads. Data from weather and pollution sensors can be linked with other spatially identified data sources. Cell phone location data were used to study the association between county-level travel patterns and infection rates during the early parts of the COVID-19 pandemic (e.g., see Sehra et al., 2020).
Wearable fitness trackers generate data about wearers’ heart-rate readings, sleep time, menstrual cycles, step counts, locations, and more. The Economist (2022) reported on the increasing use of data from wearable fitness trackers for disease surveillance and medical research. Traditional disease-surveillance methods rely on reports of symptoms from doctors and hospitals (e.g., see the influenza-surveillance system described by CDC, 2021b); by the time people seek medical care and the data are reported, an epidemic may already have progressed. Fitness trackers, by contrast, collect nearly continuous data from large numbers of people and may provide quicker warning of an outbreak.13 Fitness trackers also collect data from people in their natural surroundings—for example, they measure sleep at home instead of in a researcher’s sleep laboratory.
But The Economist (2022, p. 11) also warned that “disease-surveillance algorithms based on wearable devices might systematically miss what is happening with some types of people … [f]or example, algorithms might unwittingly be optimised for spotting outbreaks in wealthy areas where
___________________
13 Aggregating data from a convenience sample of about 50,000 Fitbit wearers in five states, Radin et al. (2020) reported that weekly measures of the proportions of persons with elevated resting heart rates and increased sleep durations (which can be signs of infection) correlated with rates of influenza-like illnesses from CDC’s influenza surveillance system—but fitness tracker data were available about 10 days earlier and might provide faster warning of an influenza outbreak.
people are more likely to have been using high-end wearables for longer.” Thus, these devices may be less likely to detect outbreaks in lower-income areas. Fitness trackers also produce data only when people wear them—there will be no sleep data from persons who charge their devices at night, for example.
As with other data sources, population coverage is a primary concern with sensor data. Cell phone location data exclude persons without phones, those who leave their phones at home, or those who turn off location tracking. Data from wearable fitness trackers are limited to persons who have them and remember to wear them—a group that may be more affluent or health conscious than the population at large.14 Environmental data might be available for only a limited number of locations or pollutants, and the placement of measurement devices might be driven by nonstatistical considerations. Traffic sensors might be placed only on major arteries. Placement of gunshot sensors might be driven by past criminal activity and therefore unable to track new developments, biasing a local jurisdiction’s view of “dangerous areas.”
Measurement error is also of concern. While a wearable fitness tracker may accurately measure steps, it may be less accurate for other types of activity. As with other private-sector data, companies may use different measurement protocols or algorithms for calculating outputs such as heart rate. Algorithms may be proprietary or may change in response to new technologies and market forces.
Datasets from sensors are typically enormous and usually require substantial cleaning, editing, and transformation to be useful for analyses (Leroux et al., 2019). Choices about how to process raw data can affect the statistics produced. If companies make only processed data available, other users may be unable to validate, verify, or replicate the resulting statistics.
Nonprobability or Convenience Samples
Technically speaking, any data collection that does not meet the criterion of being a probability sample can be classified as a nonprobability sample. For a convenience sample (a type of nonprobability sample), the primary consideration for inclusion of units in the sample is how easily those units can be recruited or located. Examples of convenience samples
___________________
14 One way to obtain fitness-device data that can be generalized to the population is to ask persons in a probability survey to wear the devices. If everyone agrees, then one has a probability sample of persons wearing fitness trackers. In some years, the National Health and Nutrition Examination Survey has asked a subsample of participants to wear accelerometers, to provide an objective measure of physical activity. Leroux et al. (2019) outlined challenges for working with the accelerometer data, but also noted the potential of these data for improving prediction of health outcomes.
include crowdsourced data (discussed in the next section), surveys in which participants are recruited through a website advertisement, and samples that consist of the investigator’s friends and neighbors.
Most low-quality convenience samples are unsuitable for the production of statistics that describe population characteristics because the respondents are not representative of the population of interest. In many cases, as in a “click on the link to participate” survey, the population of potential survey-takers is unknown. Kennedy et al. (2021, p. 1050) outlined reasons data from opt-in online surveys may be inaccurate, including “[r]espondents completing the same survey multiple times from different IP addresses, overseas workers posing as Americans, and algorithms designed to complete surveys.” Respondents may have a different race, gender, or age than they claim, or may give “bogus” responses to questions (Kennedy, 2022).
Kohler, Kreuter, & Stuart (2019) laid out the separate assumptions needed to use a convenience sample to (1) estimate population characteristics (e.g., unemployment rate) and (2) estimate relationships among variables (e.g., comparing age-adjusted heart attack rates for persons with differing activity levels).15 Researchers who estimate population characteristics from a convenience sample typically use statistical methods akin to nonresponse-adjustment methods for probability surveys, and they make the strong assumption that the methods remove any bias resulting from the volunteer nature of the sample (see Wu, 2022, and the literature referenced therein). But a convenience sample may still be useful for exploring relationships among variables even if it produces biased estimates of population characteristics. For example, an unrepresentative convenience sample might show an association between untreated hypertension and coronary artery disease, even though estimates of the population percentages having hypertension and coronary artery disease (and, perhaps, the degree of the association) are biased. Kohler, Kreuter, & Stuart (2019, p. 151) argued that the convenience nature of the sample is irrelevant “as long as the size of the causal effect is assumed to be some kind of a law of nature and is therefore the same for all research units, in all places, at all times.”
Some convenience samples may provide valuable information because of their sheer size and their inclusion of population groups that have small sample sizes in other datasets. For example, the National Institutes of Health’s All of Us research program is inviting more than one million people across the United States to “help build one of the most diverse health
___________________
15 These considerations also apply to low-response-rate probability surveys, which can have bias remaining after nonresponse adjustment methods. Mercer et al. (2017) and Meng (2018) discussed frameworks for evaluating bias in nonprobability surveys.
databases in history.”16 Participants sign up on the program website and are then asked to participate in surveys and to share their electronic health records. They may also give blood, saliva, and urine samples for laboratory and DNA tests, and may share data from wearable fitness-tracking devices.
The All of Us program provides a large database of detailed longitudinal medical information, with emphasis on obtaining data from persons who have been historically underrepresented in biomedical research (Mapes et al., 2020). But it is not a probability sample—instead, participants volunteer to submit data, and participants may have health characteristics different from those of persons with similar demographic profiles who do not participate.
Data from Social Media, Webscraping, and Crowdsourcing
Vast amounts of data are available on websites and from social media companies. Crowdsourcing involves soliciting data from a large group of persons (usually online). Webscraping software applications are programmed to search for web pages that are relevant for a topic of interest and to extract information from those pages. These data sources are usually not under the control of a government agency or single private company, and they may be of poor quality. Self-reports of activities or views from social media can be unreliable—persons or organizations may portray themselves as they would like to be seen, not as they actually are—and the population of participants is not well defined. In many social media datasets, a small number of users account for the majority of postings; most account holders have little activity. See Couper (2013) for discussions of these and other issues with social media data.
These data sources, like many other convenience samples, can also be manipulated by an outside actor, which would be of particular concern for data used to produce official statistics. A computer or automated system can generate a massive number of social media posts to reflect almost any viewpoint desired. As one example, Himelein-Wachowiak et al. (2021) discussed the role of bots (short for software robots) in spreading misinformation about COVID-19.
Crowdsourced or webscraped data may be useful, however, when joined with other data sources. One potential use involves identifying population members that are missed by other sources. For example, The Guardian investigated how many persons in the United States were killed
___________________
16 https://allofus.nih.gov/. Publications, statistics, and information on data collected are available from https://www.researchallofus.org/. As of June 16, 2022, the program had 501,000 participants, with 302,000 associated electronic health records and 368,000 bio-samples.
by law enforcement officers in the line of duty during 2015 and 2016. They performed web searches for news reports, gathered data from organizations that track law enforcement-related deaths, and asked readers to send information about fatalities they knew of. Recognizing that fatalities identified through crowdsourcing or web searches might not be caused by law enforcement (or might not even be real fatalities), The Guardian verified each fatality with law enforcement agencies and medical examiners’ offices. The Guardian’s database contained more than 1,000 fatalities resulting from encounters with law enforcement personnel for each of 2015 and 2016—about twice as many as reported in official statistics from the FBI (Swaine & McCarthy, 2016, 2017).
It may also be possible to make use of social media data together with a probability survey. For example, Hughes et al. (2021) asked participants in a probability survey to provide their Twitter handles, thus giving a representative sample of Twitter users (subject to nonresponse and nonconsent).
CONCLUSION 2-2: Numerous data sources, including probability samples, administrative records, and private-sector data, could be used to produce official statistics if they meet standards for quality. Each data source has specific tradeoffs in terms of timeliness, population coverage, amount of geographic or subgroup detail, concepts measured, accuracy, and continuing availability. Relying on multiple sources can take advantage of the strengths of each source while compensating for its weaknesses.
2.2 METHODS FOR COMBINING DATA
The data sources described in Section 2.1 have distinct strengths and weaknesses. Judicious use of statistical methods for combining data sources can exploit the strengths and overcome the weaknesses. This section outlines some of the methods that can be used to combine information from data sources, with special reference to combining information from a probability sample with that from another source. For detailed descriptions of a variety of possible approaches, see Citro (2014); the National Academies (2017a); Lohr & Raghunathan (2017); and Elliott, Raghunathan, & Schenker (2018).
Linking Records
Record linkage, sometimes called entity resolution, involves identifying records from two or more data sources that have information about the same entity. If the linkage procedure is accurate, then the information from the sources can be merged, allowing researchers to study relationships
among variables measured in the individual sources. One of the earliest large-scale linkage projects for income statistics linked survey records from the March 1973 CPS to administrative records from the SSA and tax records from the Internal Revenue Service. The linkage augmented the CPS information for each survey respondent with the respondent’s earnings and benefits information (where available) from the SSA and information on the respondent’s income subject to taxation from the tax records (Kilss & Scheuren, 1978).
Many methods exist for linking records and assessing the quality of the linkages. Historical overviews and descriptions of record-linkage methods are available in Harron, Goldstein, & Dibben (2016); Christen (2019); Asher et al. (2020); and Binette & Steorts (2022). Box 2-1 summarizes two popular methods: deterministic and probabilistic record linkage.
Record-linkage techniques can be used to:
- Add variables measured in other data sources to the variables measured in a primary data source. This was the goal of the 1973 CPS record-linkage project mentioned above, and linkage allows researchers to study relationships among variables measured on the same individuals in separate data sources.
Records of individuals in surveys can also be linked to characteristics of the areas where survey respondents live or groups to which they belong. For example, measures of environmental pollution can be linked to housing data, or a variable from the decennial census giving the percentage of Black Americans in the survey respondent’s census tract might be added to the respondent’s data record. See Chen (2015) for a discussion of issues to consider when linking “neighborhood” or “ecologic” variables.
- Merge two or more datasets that each contain part of the population, thereby augmenting the number of records in the dataset. Feldman et al. (2017) arranged for records from The Guardian’s database of deaths caused by law enforcement actions (see Section 2.1) to be linked with records in the National Death Index (NDI).17 By linking records, they could identify deaths that were present
___________________
17 The NDI is a comprehensive set of administrative records on deaths occurring in the United States since 1979. As of 2022, the NDI contains more than 100 million records, with information compiled by state registration areas from death certificates about day, location, and cause of death; age, sex, race, ethnicity, and marital status of the decedent; and additional information relating to the circumstances of the death. Its purpose is to “[p]rovide the public health and medical research community with an opportunity to obtain mortality follow-up information on their study participants” (NCHS, 2022a).
- in both datasets, and thus remove duplicated records from their estimate of the total number of deaths caused by law enforcement actions.18 They could also investigate characteristics of the records that were in The Guardian’s database but were not attributed to law enforcement actions in the NDI. They found that law enforcement-related deaths were more likely to be misclassified in the NDI if the death was not due to a gunshot wound or if it occurred in a county with lower median income, but there were no significant differences in misclassification by race or ethnicity of the decedent.
- Create longitudinal datasets by linking records belonging to the same person over time, for example, merging high school records with information on college completion.
- Check the accuracy of information in a data source by comparing it to other sources.
Two types of errors can occur when linking records (Doidge & Harron, 2019). First, an algorithm might declare a link between two records that in fact belong to different entities, which is called a false link. For example, a procedure that matches by name and location might link a record for Philadelphia resident Michael Smith from data source A with a record for Philadelphia resident Michael Smith from data source B—but, in reality, these records belong to two distinct persons who share the name Michael Smith. The second type of error, a missed link, occurs when a match exists in the data sources but is not found by the procedure—Michael Smith in source A is actually the same person as J. M. Smith in source B, but the procedure does not link the records.
Linkage errors may affect some population subgroups more than others and may lead to flawed conclusions from linked datasets. This issue is central to considerations of data equity (see Sections 3.6 and 6.4). Reviewing studies that compared characteristics of linked versus unlinked records, Bohensky et al. (2010) identified several characteristics associated with lower linkage rates, including lower socioeconomic status, lower educational
___________________
18 Feldman et al. (2017) identified 599 deaths reported in The Guardian’s database alone, 36 reported in the NDI alone, and 487 reported in both lists. By assuming that being listed in the NDI as a death caused by “legal intervention” was independent of presence in The Guardian’s database, they estimated that 44 deaths (with 95 percent confidence interval [31, 62]) were in neither source, and that 1,166 law enforcement-related deaths occurred in the United States in 2015. Banks et al. (2019) described a pilot program conducted by the U.S. Bureau of Justice Statistics to improve its census of arrest-related deaths by including deaths found from web searches of news outlets, law enforcement agency documents, and other publicly available sources.
attainment, and membership in a minority race or ethnicity group. Lower linkage rates for race or ethnicity groups may have systemic roots:
Accurate data linkage relies on accurately recorded identifying information and well designed linkage algorithms. However, ethnic minorities are more likely to have missing or incorrect information in their health records, which might reflect structural biases in health systems (eg, ethnic minorities are more likely to be treated at health facilities with poorer overall data quality). Data capture systems are also typically designed around Western name standards (ie, a first, middle, and last name) and do not account for cultural differences in name structures (eg, Hispanic groups can have multiple first or middle names, and often two surnames, and Asian names can follow different ordering norms; McGrath-Lone et al., 2021, p. e339).
CONCLUSION 2-3: Linking survey data with administrative records requires substantial expertise and investment. Decisions need to be made among reasonable alternative methods, and then periodically re-examined as data sources change or new linkage methods are developed. Documentation that assesses the quality of the linkages allows data users to evaluate the possible impact of linkage errors on analyses and to account for uncertainties in the linkage process.
Combining Statistics Calculated from Independent Data Sources
Many data sources will not contain sufficient information to allow individual records to be linked, but statistics from the sources can be combined to provide a more comprehensive picture than can be derived from any single data source. For example, Oronce et al. (2020) investigated the relationship between states’ numbers of deaths from COVID-19, obtained from Johns Hopkins University’s COVID-19 dashboard, and state-level measures of income inequality obtained from the ACS. This can be thought of as linking datasets at the state level. There is no linkage error for this example, but other statistical issues can arise from measurement errors, varying precision of state-level estimates, or misclassification.
Combining statistics can improve population coverage when data sources include information on different subsets of the population. For example, income tax records have detailed information about filing units (often, but not necessarily, households) that filed tax returns, but they exclude non-filers. Income statistics from a probability survey with information on non-tax-filers could be combined with income statistics from tax records to generate statistics for the entire population.
Multiple-frame probability surveys use this approach to improve population coverage and reduce data-collection costs (Lohr, 2021). Independent
probability samples are taken from two or more sampling frames that together are assumed to include the entire population. For example, the quarterly agricultural surveys conducted by the U.S. National Agricultural Statistics Service (see Chapter 8 and NASEM, 2017b, p. 45) select a sample of farm operators from a list frame—a list of known U.S. farm and ranch operations containing information about each operation’s size and the commodities it has produced in the past. Using the list frame allows the survey to be conducted in a cost-effective manner, but results in undercoverage because some farms are not on the list. Some of the quarterly agricultural surveys supplement the sample from the list frame with another sample from an area frame—a list of all parcels of land areas (Davies, 2009). A sample of land segments is drawn from the area frame, and farm operators with land in those segments are included in the area sample. The area sample thus includes farm operators who are not in the list frame and gives more complete coverage.
A multiple-frame approach does not require the ability to link individual records from data source A to specific records in source B, but it does require knowledge of whether a record in source A is also in source B, and vice versa. If supplementing statistics from tax records with information from a probability survey, one must know which persons in the survey are represented in the tax return records, and which tax records are from persons outside of the survey population. In addition, multiple-frame estimates may be biased if the sources measure the concepts of interest differently. In a multiple-frame probability survey, the same questionnaire is used for the respondents to each survey, to promote consistency of measurements. When statistics are combined from other data sources, however, measurement differences may affect the results—for example, a tax form may exclude some types of income that are included in a survey question. Even if the income definitions are the same, persons may report different amounts on a survey than they would report on a tax return.19 In these situations, it is important to define the population characteristics being estimated and how measurements from the various data sources relate to those characteristics.
Using Statistical Models to Combine Information
Record-linkage and multiple-frame survey approaches use data that have been collected directly from survey participants or in administrative or private-sector data. If a survey participant is accurately linked with an administrative record, the merged data can be analyzed as if all variables came from
___________________
19 Measurement errors can affect multiple-frame probability surveys, too. If list frame respondents provide data over the internet, and area frame respondents are interviewed in person, the differing modes of data collection may affect responses.
a single source. In a dual-frame agricultural survey, one sample is selected from a list frame and a second sample is selected from an area frame, but all the information about planted acreage comes from survey respondents.
In other situations, a data source may contain information related to a variable of interest, but not the variable itself—for example, health care claims data do not report whether a person has ever had a heart attack but will have information about some of the medical treatments received in the past year. Alternatively, the only available data source may have information on a variable of interest, but only for part of the population. In these situations, statistical models may be used to estimate the quantities of interest from the available information, but the accuracy of such estimates depends on how well the model describes the population. This section briefly describes two types of models that will be referenced later in this report. Many other types of statistical models have been developed and this is an area of ongoing research. Elliott & Valliant (2017); Lohr & Raghunathan (2017); Kohler, Kreuter, & Stuart (2019); Beaumont (2020); Rao (2021); and Wu (2022) reviewed methods that use statistical models to combine information from multiple data sources.
Small Area Estimation.
Consider a situation in which a probability sample measures a variable of interest such as household income, acres planted to corn, victimization by crime, or presence of a certain disease. The probability sample gives accurate estimates for the nation as a whole, but for some subpopulations (for example, states, counties, school districts, or demographic groups) the survey sample size is too small to give an accurate estimate using the survey data alone—because of their small sample sizes, these subpopulations are called small areas or small domains.
Small area estimation methods, described by Rao & Molina (2015), combine information from the probability sample with information from other data sources (such as administrative records and private-sector data) to estimate characteristics of interest for small areas. These methods supplement the small amount of data available in some of the areas with predictions based on model assumptions about relationships between the survey data and data from other sources. The application of small area estimation methods requires careful model validation because the accuracy of the statistics produced depends on the validity of the model assumptions, particularly for the smallest areas or subpopulations.
Box 2-2 describes the U.S. Census Bureau’s Small Area Income and Poverty Estimates program, which combines information from the ACS with data from administrative records to estimate the percentage of all persons, and the percentage of children, living in poverty for counties and school districts. Chapter 7 discusses small area models for estimating crime, and Chapter 8 discusses use of administrative and satellite data to calculate crop estimates.
Imputation.
Imputation methods predict values of missing data from other information. For example, some persons left questions blank or gave inconsistent information on the 2020 Census form. The U.S. Census Bureau filled in values for those missing items using other information available for that person or household if possible—for example, the respondent’s first name might be used to fill in a missing value for sex, and information from administrative records or tax assessor records might be used to fill in a missing value for the question on whether the home is owned or rented. If the missing information could not be determined from available information, then the U.S. Census Bureau assigned values based on information from similar nearby households (Ramirez & Borman, 2021).
Haziza (2009), van Buuren (2018), and Chen & Haziza (2019) described some of the statistical methods that can be used to impute missing data. These methods can be used to impute individual items (such as missing values for race or sex in a survey) or can be used to impute entire missing records (as for households that refuse to participate in the survey). The accuracy of imputed values depends on how well the statistical model describes the relationships between the observed data and the missing data.
Imputation can also combine information from multiple data sources. For example, Raghunathan et al. (2021) used imputation to estimate the prevalence of each of 107 health conditions in the population of Medicare
recipients. The Medicare Current Beneficiary Survey, conducted by the Centers for Medicare & Medicaid Services, contains a nationally representative sample of Medicare recipients (including persons residing in institutions, who are often excluded from other surveys). Although the survey collects self-reported information on only a few health conditions, it provides information on all of the health conditions of interest through linkage with Medicare claims data. But the claims data contain information only on persons who sought care during the billing year (and thus lack information on health conditions that occurred in the distant past, such as a heart attack six years ago); in addition, care for specific conditions may be grouped together and not reported separately, claims codes can be incorrect, and claims data lack information for persons enrolled in a Medicare Advantage program. Thus, prevalence estimates calculated solely based on claims data would likely be lower than the actual prevalence.
Raghunathan et al. (2021) derived a statistical model using data from the National Health and Nutrition Examination Survey (which asks for self-reports and conducts medical examinations for a wide range of conditions) to correct for the underreporting of chronic health conditions in Medicare claims data. They used this model to impute indicator variables for each of the 107 conditions for Medicare Current Beneficiary Survey respondents.
CONCLUSION 2-4: Statistical methods such as small area estimation, imputation, and combining statistics for subpopulations can integrate information from multiple data sources without requiring individual records to be linked.
2.3 OPPORTUNITIES AND CHALLENGES FOR COMBINING DATA FROM MULTIPLE SOURCES
As will be demonstrated in Chapters 4–8, multiple data sources can improve the timeliness, granularity, and usefulness of data for estimating statistics currently calculated from probability surveys. At the same time, using alternative data sources also presents challenges, as documented by the National Academies (2017a,c) and Bee & Rothbaum (2019). These challenges, and ways of addressing them, are discussed in the remainder of this report. Challenges include:
- Linkage errors. Record linkage, the most commonly used method for combining data, can greatly augment information from a single data source by incorporating variables from other sources. But linkage may have errors, and uncertainty about linkages propagates to statistics calculated from linked data. When linking with
- the NDI, for example, are unmatched records from persons who are still alive or are they missed links?
- Measurement errors. A survey respondent may provide incorrect information, such as an incorrect value for earnings or utility payments. Administrative records and private-sector data may have measurement errors, too. For example, voter registration files may have incorrect demographic information and medical claims data may miscode diagnoses or medical procedures.
- Missing data. Administrative records may be available only for some locations, some population subgroups, or some years. Information such as sociodemographic characteristics may be missing entirely if not needed for the purposes of administering the program.
- Concept alignment. Data sources may define concepts of interest differently. For example, the CPS Annual Social and Economic Supplement asks about income received during the previous calendar year from sources including earnings, unemployment benefits, Social Security benefits, veterans’ payments, and alimony (see Chapter 5).20 Administrative data may capture only some of these sources of income, may define them differently, or may include additional sources.
- Geographic alignment. Satellite and sensor data may be collected for geographic units that are difficult to align with survey data or administrative records. Geographic information may be inaccurate or unavailable in social media data or other data sources.
- Entity alignment. Data sources may measure different units. For example, one data source may measure household income, while another may measure income for individual persons. Or, one data source may look at sales by store, and another at sales by commodity. Sources that measure different units or entities can present challenges for linking records or combining statistics.
- Stability of data sources. The types of information collected in any data source can change, or data sources may disappear. An outside actor might even be able to manipulate some types of data if it became known these were being used to produce official statistics.
- Population coverage. The population intended to be represented by a probability survey does not necessarily match the population represented by a set of administrative records. In some cases, it may be possible to identify which units in the survey are missing from the administrative records population, but in other situations the overlap may be unknown.
___________________
20 https://www.census.gov/programs-surveys/cps/technical-documentation/subject-defini-tions.html
- Underrepresented population subgroups. Some population subgroups may be underrepresented in all data sources (see Chapter 3).
- Technical expertise. Many of the new data sources and methods for data combination require skill sets beyond those needed for conducting traditional probability surveys. These include expertise in record linkage, statistical modeling for combining data, machine learning, data quality assessment, computer science, information systems management, and remote sensing technology.
Additional challenges with using multiple data sources include obtaining access to the data (which can include paying for data), establishing an information technology infrastructure for processing and storing data, and protecting the privacy and confidentiality of people and businesses whose information is in the datasets. These issues will be addressed in later reports of this series.
This page intentionally left blank.


