
3
Using Multiple Data Sources to Enhance Data Equity
Chapter 1 discusses the commonly adopted definitions of data quality as “fitness for use” and “fitness for purpose.” But whose use, and what purposes? Guidelines leave these questions unanswered, to be determined for each particular data collection.
Every federal data collection is the result of conscious decisions—what parts of the population to include, how to locate and collect information about population members, what concepts to measure and how to measure them—and unintended consequences from undercoverage, nonresponse, measurement error, and events that disrupt data collection (such as government shutdowns or pandemics).
No single survey or other data collection can possibly gather all information that might be needed for all potential purposes. This report discusses the promise of using multiple data sources to augment information collected in federal surveys with data from government administrative records, private-sector data, and other data sources. But, as Giest & Samuels (2020, p. 560) argued, “the data used can have hidden data gaps that differ depending on how data was collected and analyzed as well as the kind of questions being asked.” Hand (2020), Naudé & Vinuesa (2021), Akee (2022), Brown (2022), and Kreuter (2022) have described how gaps or omissions in data sources affect the ability to measure differences among subpopulations.
This chapter examines how multiple data sources might be used to identify or correct overt or hidden gaps or misrepresentations. Data-equity issues were discussed in all the workshop sessions; this chapter draws on material from the entire workshop and in particular on presentations in
the session Issues in Data Equity. Section 3.1 defines equitable data and identifies aspects that are affected by the data-collection infrastructure. Sections 3.2–3.7 examine ways that using multiple data sources can promote data equity: by increasing the representation of population groups that, historically, have been underrepresented in the data record (Sections 3.2 and 3.3); by producing model-based estimates for small populations (Section 3.4); by providing information that can be used to improve measurement of concepts of interest (Section 3.5); and by enhancing the amount of information about individual records in a dataset (Sections 3.6 and 3.7). These sections also discuss possible harms that might arise from integrating data. Section 3.8 contains a discussion and outlines some steps for promoting data equity.
3.1 WHAT IS DATA EQUITY?
The 2021 Presidential Executive Order on Advancing Racial Equity and Support for Underserved Communities Through the Federal Government outlined the need for better data to measure equity:
Many Federal datasets are not disaggregated by race, ethnicity, gender, disability, income, veteran status, or other key demographic variables. This lack of data has cascading effects and impedes efforts to measure and advance equity. A first step to promoting equity in Government action is to gather the data necessary to inform that effort (Executive Order 13985, 2021, p. 7011).
The Equitable Data Working Group, formed pursuant to the Executive Order, defined equitable data as follows:
Equitable data are those that allow for rigorous assessment of the extent to which government programs and policies yield consistently fair, just, and impartial treatment of all individuals. Equitable data illuminate opportunities for targeted actions that will result in demonstrably improved outcomes for underserved communities (Equitable Data Working Group, 2022, p. 3).
The Equitable Data Working Group noted that disaggregated data offer “more precise statistical indicators of population well-being, as well as insight into who can and cannot access government programs and whether benefits and services are reaching underserved and underrepresented communities” (Equitable Data Working Group, 2022, p. 2).
The set of communities considered to be underserved in data sources, or for which disaggregated statistics are desired, depends on the purpose of the analysis and may change over time. Examples of the need to consider
subgroup variation include studies of location of services for persons experiencing homelessness, access to health care, and proximity to toxic waste sites. Identifying which characteristics to consider for evaluating data equity in representation requires attention to potential dimensions of inequality.
One way to identify characteristics on which data equity should be evaluated is to engage stakeholders in the data collection or analyses. Dimensions to be evaluated include stakeholders’ “race, gender, gender reassignment, sexual orientation, religion or belief, age, disability, marriage and civil partnership status, pregnancy” that “could increase their vulnerability to abuse, adverse impact, or discrimination” (Leslie et al., 2022, p. 40). The relevance of each dimension depends on the specific research questions and the context in which research questions are posed. For instance, studying whether subgroup differences in exposure to poor air quality are related to health disparities requires information about the ages of people exposed (because of developmental differences in vulnerability), underlying conditions, and socioeconomic and racial/ethnic characteristics. A concern with access to reproductive health care may require information about the locations of reproductive-care clinics as well as personal information about those seeking care, including marital and cohabiting partner status, sex and gender, and age. In these examples, definitions of race, ethnicity, and marital and cohabiting partner status may vary over time as societal norms change.
Jagadish, Stoyanovich, & Howe (2021b, p. 1) noted that “the manner in which data systems are built and used can compound and exacerbate inequities we have in society. It can also introduce inequities where there previously were none. Avoiding these harms results in data equity.” Jagadish, Stoyanovich, & Howe (2021a, 2021b) considered four aspects of data equity:
- Representation equity focuses on increasing the visibility of underrepresented groups in the data. A dataset that contains few members of an underserved community, or an unrepresentative sample from that community, will not be able to produce reliable statistics about that community.
- Feature equity focuses on the availability of variables needed to identify population subgroups or measure characteristics of interest. Federal income tax Form 1040 does not ask about race, ethnicity, disabilities (other than blindness), or gender—that information is not relevant for processing tax returns—and thus cannot be used to produce disaggregated statistics of income for those groups without additional information.1
___________________
- Access equity focuses on equitable access to data and data products. The Federal Data Strategy lays out guidelines for making data produced by federal government agencies accessible to users: “Promote equitable and appropriate access to data in open, machine-readable form and through multiple mechanisms, including through both federal and nonfederal providers, to meet stakeholder needs while protecting privacy, confidentiality, and proprietary interests” (OMB, 2019a, p. 7). Accessibility includes presenting statistics and other data products in a form that is easy to understand and interpret.
- Outcome equity focuses on the consequences for population groups affected by the data-collection and dissemination system. This includes algorithmic equity (Sikstrom et al., 2022), ensuring that automated decisionmaking tools used in health care, the criminal justice system, and other settings are fair (see Box 3-1). Outcome equity also includes effects of potential data disclosure, which may result in disproportionate harm to certain communities.
Aspects of data equity are inherent in several of the data-quality dimensions displayed in Figure 1-1. A data product with representation equity will produce accurate and reliable estimates for subpopulations of interest. Producing accurate estimates for a subpopulation requires having a representative sample from the subpopulation with adequate sample size (granularity), and ensuring that the data measurements reflect user needs and consistently measure the concepts of interest across subpopulations (relevance and coherence). Feature equity requires the ability to identify subpopulation members in the data (granularity) and measure appropriate variables (relevance). A data product with access equity will be accessible and easily used by subpopulation members, and will be available in a timely fashion. Outcome equity is related to the quality dimensions of scientific integrity, credibility, computer and physical security, and confidentiality—ensuring that individuals and communities are not harmed through the collection and dissemination of their data.
The use of combined data sources has consequences for all four aspects of data equity. This chapter concentrates on representation equity and feature equity because combining data sources can improve coverage, augment sample sizes, and add variables. As will be discussed in future reports, combining information from multiple sources raises new concerns about protecting privacy, which may affect decisions about data access. Linking or otherwise combining datasets may also have consequences for outcome equity.
Levenstein (2022) asked: “How can using non-survey data—administrative data, commercial data, social media data—increase both representation (what we know about people and who they are) and representativeness (the ability of a dataset to reflect the distributions of our population)?” She argued that there is an increasing lack of representativeness from survey data, as surveys obtain high response rates only from people who trust government data collectors; therefore, administrative records or commercial data may have better representativeness of the parts of the population they collect data about because they include people who refuse to answer surveys. However, administrative records and other sources may also include only part of the population of interest. Multiple data sources may be able to present a more complete picture than any single data source.
Sections 3.2–3.7 examine some of the ways that combining data sources can improve representation or feature equity. However, it is important to note that integrated data are not necessarily “better” data for all purposes, and upcoming sections also discuss areas in which caution is needed.
3.2 INVESTIGATE OR IMPROVE COVERAGE OF A SURVEY
The coverage of a probability survey’s sampling frame is the set of population members that could be selected for the sample. Units not in the frame have no chance of being included in the sample, so it is desirable for the sampling frame to have high coverage. External data sources are needed to investigate the coverage of a sampling frame. It has long been standard practice for federal agencies administering probability surveys to investigate potential undercoverage and nonresponse bias using other available data sources. U.S. Office of Management and Budget standards call for federal agencies to conduct a nonresponse bias analysis on surveys when the response rate is below 80 percent (OMB, 2006); one component of such an analysis involves comparing estimates calculated from survey respondents to known characteristics of the population obtained from an external source, such as administrative records or the decennial census.
Box 3-2 describes the use of an independent data source (the post-enumeration survey) to study characteristics of undercoverage in the 2020 Census. The representativeness of administrative records and other data sources can also be investigated through comparing summary statistics with estimates from high-quality data sources (when they exist).
Information from multiple sources can be used not only to diagnose undercoverage but also to improve coverage. Datasets that contain units missing from the main sampling frame can be used to improve or supplement that frame. One data source may contain population members that are not found in a different source, so that the combined data cover more of the population than each data source by itself. The U.S. Census Bureau’s Frames project (see Section 4.2) links records from several internal sampling frames and other sources, and the linkage can be used to identify areas of undercoverage and improve the frames.
Nontraditional data sources can also be used to improve coverage of sampling frames. For example, many agricultural surveys are conducted by taking a sample from a list of known agricultural operations, but these lists fail to include some smaller or transient operations. Coverage of list frames may be particularly low for sectors such as urban agriculture or local food farms (farms that distribute their products locally). Traditionally, the National Agricultural Statistics Service (NASS) has taken samples from an area frame to obtain full coverage, but using an area frame can be cost prohibitive in urban areas, where small agricultural operations may be scattered throughout the city (see Chapters 2, 8). Hyman, Sartore, & Young (2022) used webscraping to compile a list of operations that might be local food farms, and they linked the operations in the webscraped list with those in the NASS list frame. This gave three groups of potential local food farms: those in the webscraped list alone, those in the NASS frame
alone, and those in both lists. After taking samples from both lists (in which respondents were asked questions to establish their status as farms), Hyman, Sartore, & Young (2022) were able to assess the NASS list frame’s coverage of local food farms. They found that only about eight percent of the local food farms in the webscraped sample were missing from the NASS list frame, but that those were more likely to be small operations.2
Hyman, Sartore, & Young (2022) linked the records to assess the coverage of the two lists and increase the coverage of the combined samples, but multiple-frame surveys can also be used to improve coverage without explicitly linking data, as long as there is some way to identify entities that could appear in more than one of the samples (for example, telephone surveys that select landline and cell phone samples ask respondents about their landline and cell phone usage, thereby identifying the respondents who are in both frames).
Multiple-frame surveys can improve the coverage of population groups that are difficult to sample in traditional probability surveys. For example, Iachan & Dennis (1993) combined samples from shelters, soup kitchens, encampments, and street locations to increase coverage of persons experiencing homelessness (see also Peressini, McDonald, & Hulchanski, 2010). Bird & King (2018) discussed uses of multiple-frame surveys for obtaining larger and more diverse samples of people who inject heroin and of victims of human trafficking.
Beals et al. (2021) conducted a survey of clients who received services from social or health agencies in the state of Washington. They drew separate random samples of clients from each of 10 program areas, ensuring a minimum number of completed interviews from each program area. Clients were asked about the program they were sampled from, and about services from any other programs they used in the previous year, thus including broader representation of service experiences than a simple random sample. To account for clients who might be served by multiple programs, each client’s record in this multiple-frame sample was weighted according to the size of the population receiving that particular combination of program services.
Most of the examples in this section concern improving sampling frames used for selecting population members for probability surveys. However, linking survey data with data from an administrative data source can also be used to identify characteristics of people who might be eligible for a government program such as the Supplemental Nutrition Assistance Program (SNAP) but do not participate, and can provide insight into the
___________________
2 The study by Feldman et al. (2017) discussed in Chapter 2, which linked records from a webscraped list of deaths caused by law enforcement personnel with records from the National Death Index, used similar methods for estimating the number of people killed by law enforcement.
fitness of the dataset for producing official statistics or for conducting social or economic research. For example, Newman & Scherpf (2013) linked records from SNAP data in Texas to records from the American Community Survey (ACS). ACS income questions were used to estimate eligibility for the program and the SNAP records, which have full coverage of the population participating in the program, were used to determine participation. The authors estimated that overall, about 63 percent of eligible state residents participated in the program. Participation was lower for eligible residents who were aged 60 or older and living alone or with another person aged 60 or older, living in limited-English-speaking households, or non-U.S. citizens. These findings identified population subgroups that might be targeted by information campaigns to increase awareness of SNAP benefits, and helped define characteristics of the SNAP population for social science researchers analyzing the data.
3.3 ENABLE FINER DATA DISAGGREGATION
One of the challenges of producing disaggregated statistics from surveys—even high-coverage and high-response-rate surveys—is that the sample size often limits the population groups for which reliable statistics can be produced. Administrative data sources, by contrast, are often much larger (even though they might not contain everyone in the population of interest). By combining survey data with administrative records, or combining multiple administrative data sources, researchers can form a dataset that has larger sample sizes from small population subgroups.
Chen (2022) described activities of the United Nations Inter-Secretariat Working Group on Household Surveys toward promoting data integration. One focus is on using multiple data sources to measure progress toward the United Nations Sustainable Development Goals—work that is closely related to data equity.3 Key to the efforts for obtaining information at finer levels of aggregation is “[u]sing a common list of administrative units across censuses and surveys, and including identical census questions in subsequent household surveys” (United Nations Inter-Secretariat Working Group on Household Surveys, 2022, p. 7).
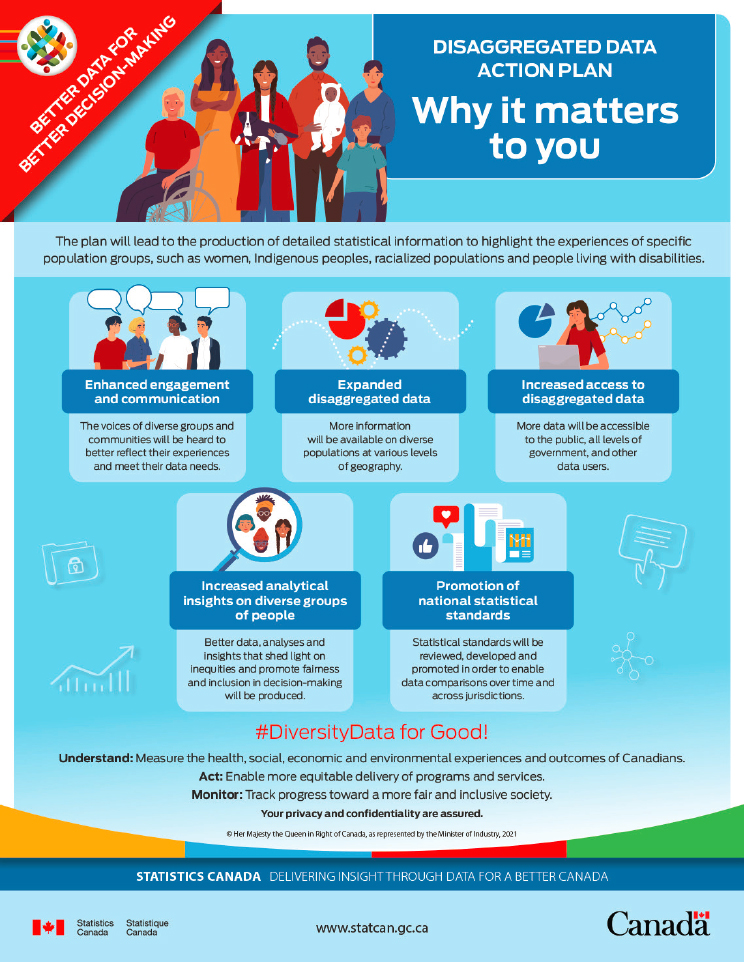
Arora (2022a,b) discussed Statistics Canada’s Disaggregated Data Action Plan, an initiative funded by the Canadian government in 2021 to
___________________
3 The 17 United Nations Sustainable Development Goals provide “a shared blueprint for peace and prosperity for people and the planet, now and into the future.” They include goals “to end poverty and hunger everywhere; to combat inequalities within and among countries; to build peaceful, just and inclusive societies; to protect human rights and promote gender equality and the empowerment of women and girls; and to ensure the lasting protection of the planet and its natural resources.” See https://sdgs.un.org/goals, https://sdgs.un.org/2030agenda, and https://sdgintegration.undp.org/human-rights-approach-data
produce timely, disaggregated data for population subgroups that have historically been less visible in probability samples, while maintaining accuracy and protecting confidentiality (see Figure 3-1). A large portion of the funding has been used to create new probability surveys or to increase the size of current probability surveys, to allow production of statistics at finer levels of aggregation. Questions aimed at identifying membership in specific subpopulations have also been added to existing probability surveys, allowing computation of statistics for those groups.4
The use of probability surveys alone is not sufficient to respond to information needs about the Canadian population. Indeed, in 2022, 40 percent of Statistics Canada’s programs relied, at least in part, on data from non-survey sources such as administrative records. Some programs, such as the Canadian Housing Statistics Program, have relied almost exclusively on administrative data. This program links data from existing administrative sources and the Canadian Census of Population to provide a comprehensive portrait of Canada’s housing market, with the goal of including all residential properties in Canada and their owners (Arora, 2022b, p. 25). Property-level data are obtained from land registries and property assessment files. Owner-level information is also derived from land registries and property assessment files, and a variety of owner characteristics are linked from tax data, the Business Register, the Canadian Census of Population, and the Longitudinal Immigration Database. Owner information is supplemented with indicators of residency in the economic territory of Canada, which are obtained by linkage to various data sources, including tax and census data. The linkage is done through a variety of deterministic and probabilistic linkage methods to maximize coverage of the target population.
Consequently, the Canadian Housing Statistics Program allows Statistics Canada to produce estimates for small subpopulations, which was not possible using probability surveys alone. Estimates have been produced for subgroups formed by cross-classifying region and property or owner characteristics, such as period of construction, residential property type, and immigration status.5 Moreover, those estimates can be produced faster and with less cost. For example, it could be difficult and costly to reach and obtain timely responses from foreign owners through a probability survey, but information about this subpopulation is readily available from the database.
Although they are not affected by sampling errors, statistics computed from the Canadian Housing Statistics Program are not error free. For
___________________
4 For example, a new question on gender was included in the 2021 Census of Population that allows all persons living in Canada to self-identify through the Census. See https://www.statcan.gc.ca/en/statistical-programs/instrument/3901_Q1_V7 for the census instrument.
5 For example, https://www150.statcan.gc.ca/t1/tbl1/en/tv.action?pid=4610005201
SOURCE: Statistics Canada, Catalogue no. 11-627-M, December 8, 2021 (https://www150.statcan.gc.ca/n1/pub/11-627-m/11-627-m2021092-eng.htm). Reproduced and distributed on an “as is” basis with the permission of Statistics Canada.
example, new construction may be missing from the database, and assessment values may fail to capture improvements performed without building permits. Linkage errors also exist, since some records have more accurate information for linkage than others. To evaluate the quality of the linkages, samples of linked records are manually reviewed and estimates of linkage error rates are calculated to ensure that linkages are of high quality.
Disaggregation can be temporal as well as spatial or demographic. Shapiro (2021) mentioned the lag in data availability from key data sources such as the ACS, and provided examples in which other data sources, though imperfect, provided more timely and more frequent data. For example, the Bureau of Transportation Statistics used cell phone location data to study travel patterns early in the COVID-19 pandemic.6
CONCLUSION 3-1: Many data sources include or represent only part of the population of interest. Multiple data sources can be used to assess and improve the coverage of underrepresented groups, and to enable the production of disaggregated statistics. It is important to examine the representativeness and coverage of combined data sources to ensure data equity.
3.4 PRODUCE MODEL-BASED ESTIMATES FOR SMALL SUBPOPULATIONS
Box 2-2 describes the U.S. Census Bureau’s Small Area Income and Poverty Estimates (SAIPE) program, which uses summary statistics from administrative data as inputs to a regression model that predicts income and poverty for each county and school district in the United States. Small area estimation can also produce estimates for subpopulations other than geographic areas. The U.S. Census Bureau’s Small Area Health Insurance Estimates program, which uses a model similar to that of SAIPE to estimate county-level health insurance coverage from the ACS and administrative records, also provides further breakdowns by demographic characteristics. Robinson & Willyard (2021) used a small area model to generate heat maps of county-level estimates of the uninsured rate for working-age adults living in poverty and children under the age of 19, and state-level estimates for Hispanic, non-Hispanic White, and non-Hispanic Black populations.
Subpopulation estimates produced by small area modeling programs are predictions based on statistical relationships between the predictor variables and the quantities of interest. Those relationships might not hold for all subpopulations being predicted (e.g., a county predicted by a small area model to have a high uninsured rate may actually have a low uninsured
___________________
rate because the county’s predominant employers provide health insurance). The only way to detect such outliers is to obtain direct data from another source.
As with the algorithms discussed in Box 3-1, the estimates from small area estimation procedures are predictions from a model fit to the areas that have survey data. A survey may be nationally representative (that is, accurate national estimates may be calculated from it) and yet have only a few data points for some subpopulations (for example, residents of small rural counties). If the relationship between the model inputs and the outcome of interest is different for certain small rural counties than for the counties that primarily determine the regression parameters, the small counties will be poorly predicted by the model. In general, though, having predictor variables in administrative data that are highly correlated with outcome variables will produce small area estimates that are more accurate, on average, than estimates calculated using the survey data alone.
3.5 ASSESS AND REDUCE MEASUREMENT ERROR
Record linkage can provide a cross-check on measurements of the same concept across data sources. Section 5.4 reviews studies in which records from surveys containing questions about income or transfer programs have been linked to administrative records data. By comparing the amount of wage earnings reported to surveys with that reported to the Internal Revenue Service (IRS) or Social Security Administration (SSA), or by comparing the response to the ACS question about receipt of SNAP benefits with SNAP administrative records, researchers can study patterns of measurement error in data sources and identify subpopulations for which better measurement methods are needed.
Whether and how individuals’ characteristics are measured varies across datasets. At the most basic level, a data source may have no information about a characteristic—for example, a health survey or administrative data source may contain no questions about sexual orientation. A recent National Academies of Sciences, Engineering, and Medicine report (NASEM, 2022c) noted the wide variety of survey questions used to ask about sex, gender identity, and sexual orientation, and provided guidance for asking about these characteristics.
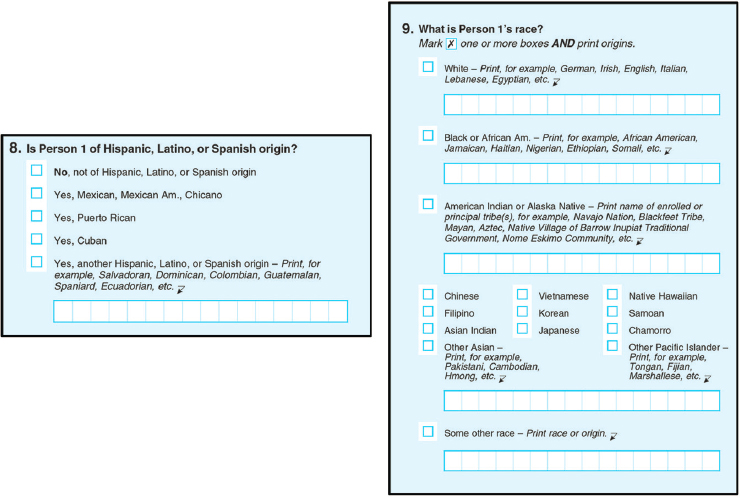
Similarly, measurement of race and ethnicity varies across data sources. Box 3-3 describes the race and ethnicity categories specified for federally sponsored data collections in the United States, and Figure 3-2 shows how these categories were implemented in the 2020 Census. Discrepancies across sources can be investigated by studying differences in race and ethnicity categories for records belonging to the same person, and such studies can point the way to methods that can improve measurement of those characteristics.
For example, participants in surveys and the decennial census are asked to select the race and ethnicity categories that best describe them. Information about age, sex, race, and ethnicity on death certificates, however, is not self-determined—it is usually entered by a funeral director based on observation or on information provided by an informant (often a relative).
Arias, Heron, & Hakes (2016) investigated how well race and ethnicity classifications from death certificates agreed with those from self-responses.
SOURCE: U.S. Census Bureau (2020a).
They could not, of course, ask the decedents to report their race and ethnicity. However, they could examine Current Population Survey (CPS) records that were linked to records for the same persons who subsequently appeared in the National Death Index (NDI), and compare self-reported race and ethnicity from the CPS to the race and ethnicity in the NDI.
Arias, Heron, and Hakes (2016) found that agreement was close to 100 percent for persons who self-identified on the CPS as White or as Black/African American for the three time periods studied (1979–1989, 1990–1998, and 1999–2011). But, over the three decades studied, only 51–55 percent of decedents who self-identified as American Indian or Alaska Native (AIAN) on the CPS had that same classification on the death certificate, and only 72–80 percent of decedents identified as AIAN on the death certificate had self-identified as such on CPS. For persons self-identifying as Hispanic/Latino(a) on the CPS, about 90 percent had the same identification on the death certificate; of decedents listed as Hispanic on the death certificate, 91–96 percent had self-identified as Hispanic on the CPS. A follow-up study (Arias et al., 2021), linking records from the 2010 Census to the NDI, found similar misclassification rates for non-Hispanic AIAN decedents. If misclassification were not corrected, mortality rates for the AIAN population would be underestimated in statistics calculated from death certificates.
Race and ethnicity are fluid concepts, and they are also used fluidly. Record linkage can be used to study consistency across data collections in which information is self-reported. Using linked decennial census data, Liebler et al. (2017) found that 9.8 million people listed a different race and/or ethnicity in 2010 than in 2000; the most common changes were from “Hispanic some other race” to “Hispanic White” and vice versa.7
3.6 ADD FEATURES TO THE DATA THROUGH DATA LINKAGE
In addition to providing information on how the measurement of concepts varies across data sources, record linkage can be used to merge information from different datasets. This use of data linkage is discussed further in Chapter 6.
Adding Variables to a Dataset from Records Linked in Another Source
Brown (2022, slide 5) emphasized the importance of having disaggregated data by race for the purpose of measuring racial disparities. One challenge is that “disaggregated data are strong in some areas (employment, education) and lacking in others (health, wealth).” One way to calculate disaggregated statistics from data sources that do not measure the disaggregation variables is to link the records with a source that has those variables.
Akee (2022) described the value of linking data from the IRS and the U.S. Census Bureau to study income inequality. Income tax data contain a great deal of information on various types of income, as well as adjustments used in calculating adjusted gross income, but the individual income tax form (Form 1040) does not collect information on race and ethnicity. The ACS and decennial censuses do collect information on race and ethnicity; by combining tax information with ACS and decennial census information for the matched records, Akee, Jones, and Porter (2019) could study trends in income inequality from 2000–2014 for relatively small race and ethnicity
___________________
7 There may also be discrepancies across self-reported data sources based on who fills out the information on race and ethnicity. For the decennial census, a household respondent (“Person 1” in Figure 3-2) usually supplies demographic information for all household members. If no one in the household supplies information, a proxy reporter (for example, a neighbor or building manager) may be asked. But race and ethnicity information supplied by a household respondent or proxy reporter may differ from information that household members might supply if they were filling out the form. In the 2020 Census, proxy responses were obtained for about seven million households (U.S. Government Accountability Office, 2020). Comparing linked census records in which information was provided by a household member in one census and a proxy reporter in the other, Porter, Liebler, & Noon (2016) found high agreement between household and proxy respondents for White and Black residents, but more disagreements for multiracial and “some other race” categories.
subgroups.8 The authors were thus able to look at income and within-group income inequality over time for population groups such as Pacific Islanders, whose sample size is small in a typical survey. One of the challenges for the study was that the decennial census and ACS ask the race and ethnicity of each person, while Form 1040 is for tax-filing units (usually households). Individuals within tax-filing units may have different races or ethnicities. Akee, Jones, & Porter (2019) linked ACS race information to the primary and secondary filers in the tax records. They then used income equivalency weights to assign shares of the tax-return income to the primary and secondary filers, and analyzed the data at the person level. Akee et al. (2020) used similar linkage procedures to compare income inequality over time for recent immigrants who identify as Asian, Hispanic, and non-Hispanic White.
Data linkage at the area level can attach state-, county-, or neighborhood-level variables to a dataset. The Urban Institute’s Spatial Equity Data Tool (Narayanan, Stern, & Macdonald, 2021; Urban Institute, 2021b; Brown, 2022) allows data users to upload their own data (e.g., locations of playgrounds or grocery stores) for comparison with estimates of community characteristics (e.g., percentage of residents who are under the poverty threshold) from the ACS. The Urban Institute (2021a) provided an example studying the characteristics of neighborhoods with electric vehicle charging stations.
Linkage Errors and Data Equity
Data linkage provides additional variables when the linkage is accurate. When a record from one data source is mistakenly linked to a record from another source that belongs to a different entity, however, the linked dataset record has erroneous information. Moreover, some records contain insufficient identifying information to enable linkage across datasets and, as discussed in Chapter 2, some subpopulations are more likely than others to have missed links. Akee, Jones, & Porter (2019, p. 1003) commented that “[t]he nonmatches between the IRS and the census race and ethnicity data likely occur among low-income individuals and minorities.”
Bond et al. (2014) described the Person Identification Validation System used by the U.S. Census Bureau to assign a Protected Identification Key (PIK) to each record. The PIK is then used to link records across sources.9 For some records, however, a PIK cannot be reliably assigned because there is insufficient identifying information or because the record does not
___________________
8 Records were linked at the U.S. Census Bureau under strict confidentiality protections; see Section 5.2.
9 https://www.census.gov/topics/research/stat-research/expertise/record-linkage.html
uniquely match any of the administrative records (mostly from the SSA, but other administrative records are also used). Bond et al. (2014) used ACS data to study characteristics associated with lower linkage scores (and hence lower likelihood of receiving a PIK); for 2010, these characteristics included recent movers, Hispanic persons and persons of “some other race,” non-U.S. citizens, immigrants, people who speak a language other than English at home, and people with low incomes or who are unemployed.
Reviewing studies on variation in linkage quality, Randall et al. (2018) found that most studies have been conducted on nested datasets, in which every record in dataset A was also expected to be in dataset B. In these studies, it could thus be assumed that any failure to link a record in dataset A with a record in dataset B is a missed link. When dataset A is not nested in dataset B, though, it may be difficult to determine whether failure to link an individual in A occurs because there is no record for that individual in B, or because a corresponding record exists but the link was missed. For example, health surveys or medical datasets can be linked with the NDI to study subsequent mortality of study participants. But a failure to find a link does not necessarily mean that the person is still alive; it could be the result of low-quality information in the variables used for the linkage. Section 6.4 discusses data-equity issues for linkages of health surveys.
Linkage decisions can affect results. For example, Parrish et al. (2017) studied how linkage decisions affected estimates of child maltreatment in Alaska. They linked records from a probability sample of live births in 2009 with administrative data sources such as death records, records from child protective services agencies, and records from the Anchorage Police Department. Estimates of the incidence of child maltreatment (defined as having at least one report of maltreatment from the multiple sources in the six-year follow-up period) were up to 43 percent lower when a more restrictive linkage (without manual review) was used. Accounting for out-of-state emigration in the longitudinal linkage also affected estimates.
There is often a tradeoff between coverage and linkage errors. For linkages using methods similar to those in Box 2-1, analyses could be restricted to records with high match scores. But that would leave many records unlinked, and the resulting dataset would not be representative of the population, with undercoverage of population subgroups with lower linkage scores. On the other hand, using a low match score cutoff can result in false links. For example, it would be possible for the Canadian Housing Statistics Program (see Section 3.3) to restrict analyses to the set of records thought highly likely to be true matches. However, this would leave many records unlinked, and the resulting database would not be representative of the population, raising equity issues. To avoid these representativity issues, attempts are made to maximize the coverage of the target population, but this results in linkage errors.
Additional Equity Considerations for Data Linkage
Randall, Stern, and Su (2021) noted that variables added during data linkage may increase the risk that individuals could be identified from the data. Box 3-4 discusses how record linkage may affect privacy and confidentiality. Zook et al. (2017, p. 3) commented that “[p]rivacy also goes beyond single individuals and extends to groups. This is particularly resonant for communities who have been on the receiving end of discriminatory data-driven policies historically, such as the practice of redlining.”
and Technology (2014, pp. 38–39) stated: “Anonymization of a data record might seem easy to implement” but “as the size and diversity of available data grows, the likelihood of being able to re-identify individuals (that is, re-associate their records with their names) grows substantially.”
Combining data sources, and particularly combining data through record linkage, can add information to datasets that could potentially be used to identify individuals in the data even if the original data are anonymized. Even if individuals are not identified, Randall, Stern, & Su (2021, p. 7) noted that information that is disclosed might cause harm to individuals and communities, thereby affecting outcome equity: “Linked credit bureau data, for example, could be used punitively to reinforce racially discriminatory lending practices or target predatory products.” Wardell (2022) mentioned possible unintended consequences of adding items to data-collection instruments, particularly if that information might be used to threaten the rights, safety, and security of people in specific communities (such as LGBTQIA+ individuals). Potential unintended negative consequences increase the need to protect confidentiality.
Confidentiality-protection methods attempt to minimize those risks while still allowing useful statistics to be produced. Pujol & Machanavajjhala (2021) observed that there is also a tradeoff between confidentiality and data equity, and that measures intended to protect individual privacy may end up erasing properties of small groups.
Combining data sources requires a careful balance between competing needs. On the one hand, record linkage may provide better coverage of smaller population groups, improving representation equity and feature equity for those groups. On the other hand, creating more granular information through data integration may increase concerns about privacy and confidentiality. Addressing privacy concerns through confidentiality-protection methods that add noise to data may distort statistics for small subpopulations (see NASEM, 2020).
__________________
a Examples of pledges of confidentiality can be found at https://www.bls.gov/bls/confidentiality.htm, https://www.census.gov/programs-surveys/ncvs.html, and https://www.cdc.gov/os/integrity/confidentiality/index.htm
b The Federal Committee on Statistical Methodology (2005) and the National Academies (2017a,c) described approaches to protecting confidentiality of data. The 2020 Census used a new method called “differential privacy” to protect confidentiality, in which noise was added to statistical tables and artificial microdata were generated from the noise-infused statistics in the tables (U.S. Census Bureau, 2021c).
In some administrative data collections, information about race, ethnicity, and other characteristics that might be desirable for data disaggregation is omitted by design. For example, because the Equal Credit Opportunity Act prohibits using characteristics such as race, religion, national origin, sex, and marital status in credit-scoring models, credit reports “generally may not include information on items such as race or ethnicity, religious or political preference, or medical history” (Cooper & Getter, 2020, p. 3).
The U.S. individual income tax form (Form 1040) does not ask about race, gender, or ethnicity. Adeyemo and Batchelder (2021) stated that current laws prohibit the IRS from acquiring that information from other agencies and that, in lieu of record linkage, the U.S. Department of the Treasury has been studying methods for imputing race and ethnicity onto tax data to study the “racial/ethnic equity implications of tax policy and tax administration questions, which could ultimately enable a better understanding of the effectiveness and equity of a variety of tax provisions.”10
Record linkage illustrates how a method that is promising for promoting data equity must be rigorously evaluated to identify unintended consequences both for measurement and for the communities being measured. Interventions to advance equity may reveal inequities or new challenges, requiring continual efforts to improve data equity involving researchers and the communities themselves.
CONCLUSION 3-2: Record linkage can merge information from separate data sources and add variables that are needed to produce disaggregated statistics. But linkage procedures may also introduce biases because linkage errors can disproportionately affect members of some population subgroups. It is important to assess data-equity implications of record-linkage methods.
3.7 ADD FEATURES TO THE DATA THROUGH IMPUTATION
As mentioned in Chapter 2, federal statistical agencies often impute (fill in) values for missing items on censuses or surveys. They may use a deductive rule for some missing values (e.g., imputing a sex of female for a person who listed giving birth in the last year), substitute values from linked administrative data, replace the missing values with values from another record in the dataset that has similar characteristics on the nonmissing items, or use a statistical model to predict the missing items. In some applications, the
___________________
10 Bearer-Friend (2019) discussed possible harms that might result if race and ethnicity information were collected on federal individual income tax forms, but also noted harms that can result when studies on implications of tax policies do not produce statistics that are disaggregated by race.
model for performing imputations is developed on a separate dataset that contains both the variables to be imputed and variables that can be used to predict the items of interest. Imputation can enhance feature equity by providing estimates of missing items (for example, if a survey respondent skips an income question) or information needed to define subgroup membership.
Imputing Information Needed for Disaggregation
The Institute of Medicine (2009, p. 7) argued that the first step toward addressing health care disparities is to collect information on the quality of health care that is disaggregated by race, ethnicity, and language, and recommended: “Where directly collected race and ethnicity data are not available, entities should use indirect estimation [imputation] to aid in the analysis of racial and ethnic disparities and in the development of targeted quality improvement strategies, recognizing the probabilistic and fallible nature of such indirectly estimated identifications.”
Administrative data sources can lack information that can be used to distinguish group membership. For example, one impediment to producing disaggregated data for Medicare beneficiaries has been the quality of race and ethnicity information in the administrative files, derived primarily from SSA records. The majority of current Medicare beneficiaries applied for a Social Security Number before 1980, when the application had only three response options for race and ethnicity: “White,” “Black,” and “Other.”11
Haas et al. (2019) investigated the performance of an imputation method that relies on surname and residential address data to refine race and ethnicity information for Medicare beneficiaries.12 Each person was assigned a set of six initial probabilities of being in each of six racial/ethnic groups (White, Black, Hispanic, Asian or Pacific Islander, American Indian or Alaska Native, or multiracial) based on U.S. Census Bureau data about the race and ethnicity distributions for that person’s surname. These probabilities were then refined with additional information about the race and ethnicity distribution for the census block group containing the person’s address, and with information from the administrative files, such as the person’s first name or preference for receiving materials in Spanish. Haas et al. (2019) checked the accuracy of the final set of probabilities by linking the administrative files with records from a survey of Medicare beneficiaries’ health care experiences, which contained self-reported race and ethnicity.
___________________
11 The categories were expanded in 1980, and Social Security application forms in 2022 (https://www.ssa.gov/forms/ss-5.pdf) have two ethnicity options and seven race options in accordance with U.S. Office of Management and Budget (1997) standards; however, the forms state that providing race and ethnicity is voluntary.
12 The Bayesian Improved Surname Geocoding method is described by Elliott et al. (2009). Comenetz (2016) described the production of the 2010 Census Surname Table.
Correlations between the predicted probabilities and the self-reported race were high for persons identifying as White (0.90), Black (0.95), Asian/Pacific Islander (0.92), and Hispanic (0.88); for persons identifying as American Indian or Alaska Native, however, the correlation was only 0.54; and for persons identifying as multiracial, the correlation was 0.12.13 Haas et al. (2019) recommended using the imputed probabilities to investigate health disparities among White, Black, Asian/Pacific Islander, and Hispanic Medicare beneficiaries. But because the probabilities were much less accurate for American Indian, Alaska Native, and multiracial beneficiaries, “the resulting probabilities for these groups are still not recommended for general use” (p. 21).
Equity Considerations for Imputation
Imputation methods fill in values for missing data using statistical models. But, as seen in the study by Haas et al. (2019) described in the preceding section, imputations can be less accurate for some population groups than for others. As with the prediction algorithms discussed in Box 3-1, imputation models are more accurate when developed on data for which the relationships among variables are similar to those in the data to be imputed.
Randall, Stern, & Su (2021) and Brown et al. (2021) considered potential harms that could result when race or ethnicity is imputed in a dataset. A flawed imputation can result in inaccurate estimates and conclusions, and in the misattribution of characteristics of one population subgroup to another. Jagadish, Stoyanovich, & Howe (2021b, p. 3) observed that “imputation of missing attribute values may involve an algorithm that depends on some model, which may itself be biased. For instance, zip code can be used to ‘determine’ race. Obviously, this cannot work at the individual level, because not everyone in a zip code is of the same race.”
Brown (2022, slide 20) advised weighing the benefits of imputing race and ethnicity against the risks, by looking at the opportunity cost of imputation. Would it be better to use resources devoted to imputation to instead improve the data collection, or to use the “next-best available data?” Brown also recommended examining whether the imputed data would be fit for purpose.
Surveys commonly rely on imputations to fill in values for questions that respondents did not answer. As discussed in Chapter 5, many respondents leave income questions blank, and the missing income data may be imputed from model predictions, from another record in the data with similar characteristics, or from a separate data source. However, respondents
___________________
13 Other researchers have found similar patterns of accuracy, validating the Bayesian Improved Surname Geocoding method (e.g., LeRoy et al., 2013).
may have left items blank because they did not want to share that information, and they might not have consented to participate in the survey had they known the information would be obtained from other sources. Box 3-5 discusses issues of informed consent regarding linkage and imputation.
3.8 DISCUSSION
As illustrated in this chapter, concepts of data equity, and the benefits that combining data sources can yield for equity, depend on context. The chapters that follow provide additional examples from the panel’s workshop and related literature in which combining data sources has advanced data equity.
Record linkage or imputation may be used to add information about characteristics such as race, ethnicity, sexual orientation, or disability to datasets that do not contain that information. These techniques can also add variables to surveys that can enhance insight into survey data, including information that the survey respondent might not know (for example, the respondent might not know the value of health care claims paid by Medicare). But both procedures can also introduce errors into the data. Those errors may propagate or amplify existing biases, and the data-equity implications of various linkage and imputation methods need more study. Small area estimation combines information from separate sources to produce estimates for small geographic units such as counties, but these
procedures also have implications for equity because some subpopulations might be poorly fit by the prediction models.
The panel views data equity as a core value to be considered when designing data-collection or data-integration systems and when evaluating quality of data products. Linkage errors can be reduced by including variables with high identification potential in data sources. The need for linkage or imputation can be obviated by data collections that include all variables of interest, but that may be impractical because of high respondent burden or privacy concerns. Similarly, small area estimation methods will not be needed if more data are collected (or an alternative data source is found that measures the concepts of interest). Changing major data collections, however, may not be desirable or economically feasible.
Many of the methods used for combining datasets are fairly new, and their equity implications have not been thoroughly studied. In the panel’s view, much more research is needed to better understand the effects of data-combination methods on equity, and documentation for data-linkage projects and other data-combination methods should include implications for equity.
Nelson et al. (2020) stressed the importance of transparency when integrating data and provided a toolkit for embedding questions of data equity throughout the data lifecycle—in planning, data collection, data access, development of algorithms or statistical methods, data analysis, and dissemination. They observed: “Building data infrastructure without a racial equity lens and understanding of historical context will exacerbate existing inequalities along the lines of race, gender, class, and ability” (p. i), but responsible use of data integration, together with community knowledge and skills, can “advance government transparency and accountability in data use, which is critical to building trust, community well-being, and improved outcomes” (p. 33).
CONCLUSION 3-3: Data equity is an essential aspect of any data system. Documentation of equity aspects, including a discussion of the decisions to include or exclude population subgroup information and an evaluation of data quality for subpopulations of interest, will promote transparency. Development of standards for data equity, and procedures for regularly reviewing equity implications of statistical programs, would enhance efforts to improve data equity across the federal statistical system.


