
5
Challenging Categories: Housing/Shelter
5.1. CONCEPTUAL MEASUREMENT GOAL
Housing is typically the largest component of a household’s spending. Harvard University’s Joint Center for Housing Studies estimated that, in 2020, 30 percent of U.S. households were cost burdened—that is, paying more than 30 percent of their incomes for housing. The figure for renters was even higher, with 46 percent cost burdened in 2019—down from 50 percent in 2011, but well up from the 40 percent estimated in 2001 (Joint Center for Housing Studies, 2020). Rent burdens vary considerably across the country, as shown in Figure 5-1. As depicted in Figure 5-2, housing costs subsume an even higher share of monthly income for households with low incomes.
Given its magnitude, the methodological choice for handling housing in a poverty measure—both in terms of establishing basic need and including housing in the estimate of resources—can have a major impact on who is counted as poor, on geographic variation in poverty rates, and on the overall poverty rate. Conceptually, a poverty measure should reflect whether households have adequate resources to obtain a basic level of shelter, month to month and year to year, while still being able to afford necessities such as food, clothing, transportation, and medical care. The most straightforward way to represent this basic need is to first establish the amount of money required, in a given location for a given family size, to rent a house or apartment deemed to be of acceptable quality. Next, to determine whether a family/household can meet this threshold for shelter (in addition to the other items in the basic needs bundle), income, and other available resources must be estimated. The calculation of available resources should include any government assistance received to pay for housing and any implicit rent earned by homeowners.
In the Supplemental Poverty Measure (SPM), housing costs are prominently reflected in the needs—food, clothing, shelter, utilities, telephone, and internet (FCSUti)—threshold. The shares of the threshold accounted for by out-of-pocket expenditures on shelter and utilities for the 2015 SPM reference unit (two adults with two children) were 50.5 percent for owners with mortgages, 41.1 percent for owners without mortgages, and 49.8 percent for renters (Renwick and Garner, 2020). In the panel’s assessment, the treatment of housing in the current SPM thresholds is less conceptually clear and transparent than it could be, and there are four primary concerns with the current calculation. First, the SPM does little to adjust housing costs for basic quality. Second, the SPM groups together all nonmetropolitan areas in a state, ignoring what may be large costs differentials across counties. Third, the shelter needs defined in the SPM do not draw on the U.S. Department of Housing and Urban Development’s (HUD’s) Fair Market Rents (FMRs), which are used for HUD’s programs and already provide a threshold cost
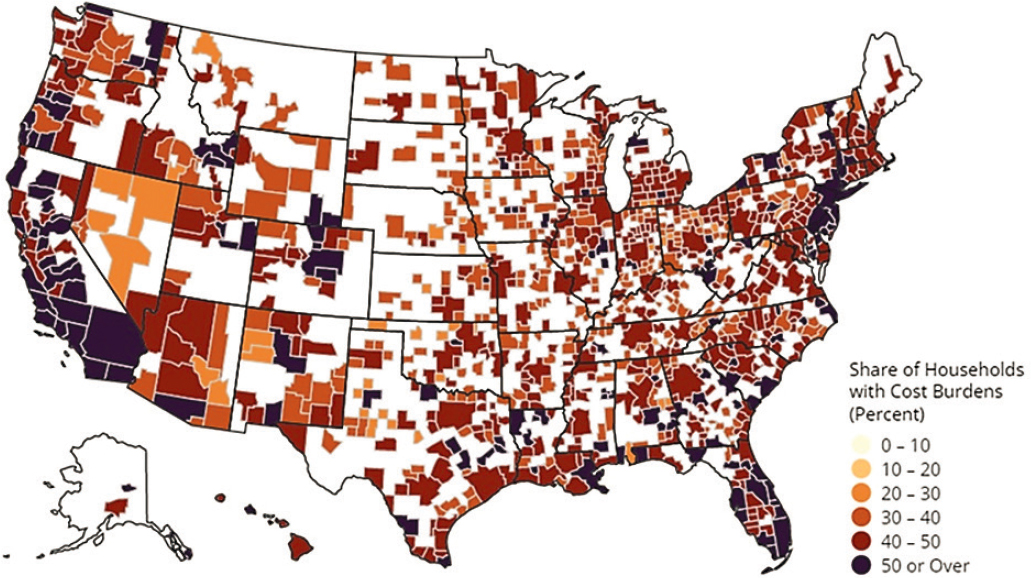
SOURCE: Harvard Joint Center for Housing Studies, based on American Community Survey 1-year estimates (www.jchs.harvard.edu/son-2019-cost-burdens-map).
of decent, affordable housing each year in every local market in the country. Finally, the SPM uses distinct needs thresholds for renters, homeowners with mortgages, and homeowners without mortgages—even though tenure choice is endogenous (at least to some extent) and all three groups face the same basic need for shelter.
While the basic need for shelter is the same for all households of the same size and composition, the resource calculation should ideally reflect the fact that homeowners have an asset (a home) that delivers a flow of rental
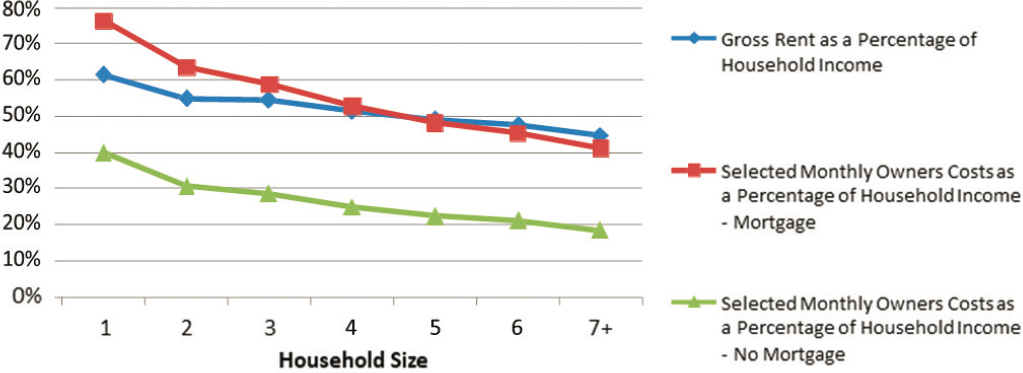
SOURCE: Renwick and Garner (2020), using 2014 American Community Survey 5-year data (www.census.gov/acs).
income, whether they are renting it out to someone else or to themselves. Imputed or implicit rent is an estimate of the amount of income that homeowners earn from effectively renting their residences to themselves. While this can be confusing, ignoring this implicit rent leads to inequitable treatment of households in a poverty measure. Imagine two households with the same incomes who own identical homes. One of them lives in their home, while the other rents their home to another family and then uses that rental income to rent a similar house nearby. These two households still have the same level of resources. But if implicit rent is not counted, then homeowners who choose to rent out their homes will appear to have an additional source of income—rental income—compared to homeowners who live in their own homes. However, the two households have the exact same level of resources to spend on nonhousing goods.
Incorporating implicit rent into resource calculations is not without precedent. Several European countries—including Iceland, Luxembourg, the Netherlands, Slovenia, and Switzerland—tax the flow of implicit rent for homeowners (as if they were paying themselves; Andrews et al., 2011). In the United States, the implicit rent that homeowners pay to themselves is already included in calculations of gross domestic product. In making this calculation, the Bureau of Economic Analysis (BEA) estimates the amount that homeowners would pay in rent—using the rent of comparable units in the same local market—if they were renting their homes instead. Any imputation of implicit rental income should also take into account and deduct the user costs incurred by home ownership (e.g., property taxes, maintenance and repairs, and mortgage interest).
In the current SPM, the threshold reflects expenditures on food, clothing, shelter, and utilities and is scaled (by family size) for each specific tenure type (homeowner without mortgage, homeowner with mortgage, and renter).1 Further adjustments are made to account for the multiplier—which accounts for other goods and services, such as personal care and nonwork transportation—and for geographic differences in housing costs.2 Resources available for a family include all sources of income, plus any government transfers, minus taxes paid, work-related costs, childcare, and/or medical out-of-pocket expenses.
Data permitting, the recommended SPM revision—which, for purposes of this report, is called the Principal Poverty Measure (PPM)—follows the approach introduced in Chapter 2. The cost estimate for area-specific basic rent is captured on the threshold side, as determined by HUD’s annual estimated FMRs in the local area for all households of the same size and composition (regardless of whether households own or rent). For homeowners, implicit rent is denoted on the income/resource side of the PPM as an additional income flow, based on an estimate of the rental equivalence of their home, or how much rent they would earn if they rented it out; out-of-pocket costs incurred by ownership are subtracted. Implicit rent (rental equivalence) is of course not included as income in the resources available to renters.
If conceptualized as described above (and as detailed in Appendix 2A), the three separate thresholds now used in the SPM for the three tenure modes (homeowner without mortgage, homeowner with mortgage, and renter) would no longer be required; the basic shelter need in a given location would be ascertained in the same way for all household types. The resource side of the PPM would capture differences (due to housing tenure type) in required monthly outlays for shelter. This simplification—the establishment of a single threshold—represents another advantage of adopting an implicit rental income approach.
5.2. DEFINING AND ESTIMATING HOUSING/SHELTER NEEDS
5.2.1. Setting Thresholds—Current Approach
The housing portion of the threshold in the SPM is calculated by the Bureau of Labor Statistics (BLS) using the Consumer Expenditure Survey (CE). First, BLS constructs the distribution of FCSUti for all consumer units (CUs) with at least one child.3 Then, using the subset of CUs within the 47th–53rd percentiles of the FCSUti
___________________
1 As described in Chapter 2, the threshold is estimated as 83 percent of the averages of the 47th–53rd percentile range of the FCSUti distribution.
2 Appendix 2A depicts the SPM and the PPM algebraically. Equations 2.1 and 2.2 show the SPM specification. Equations 2.3 through 2.5b show the PPM specification.
3 For 2021, the estimation sample was expanded from CUs with exactly two children to CUs with any number of children.
distribution, the housing portion of the threshold is determined by the share of the FCSUti expenditure around the median comprised by shelter and utilities (excluding phone and internet). Current practice sets the threshold at 83 percent of CUs’ average expenditures from this percentile range. For CUs living in metropolitan areas, the SPM’s measure of need is geographically adjusted based on local housing costs. For those living in nonmetropolitan areas, the geographic adjustment is based on housing costs for all nonmetropolitan counties within the state (Renwick and Garner, 2020).
As described above, the SPM thresholds are based on actual (surveyed) expenditures. Prior to geographic adjustments, the shelter and utilities portion of the SPM threshold for renters was, for 2020, approximately $13,400 per year (44.4% of the overall threshold of $30,150), or $1,117 per month.4 These levels are comparable to several calculations of housing costs based on alternative data sources. For example, the national median two-bedroom rent from the 5-year American Community Survey (ACS; 2016–2020) was $1,080 per month. This estimate uses the variable for “gross rent.” which includes utilities even if they are not included in rent.5
The shelter and utilities portion of the threshold is also used to determine the share that is geographically adjusted using ACS data. As part of the 2021 SPM revisions, the Census Bureau shifted from centering the thresholds at the 33rd percentile to 83 percent of the average expenditures of CUs within the 47th–53rd percentiles (Fox and Burns, 2021a).
5.2.2. Setting Thresholds—Proposed Approach
For low-income households, rental housing is typically a more attainable goal than is purchasing a home, as it requires a security deposit rather than a down payment. Not surprisingly, then, renting is the dominant tenure mode for families with low incomes. In this sense, renting represents the baseline housing need. The FMRs used by HUD for the housing choice voucher program are an obvious candidate to represent the cost of obtaining a basic unit in the rental market. FMRs are designed to capture the cost to rent a moderately priced, standard-quality dwelling in the local housing market. FMRs are estimated annually and become effective on October 1 for U.S. Office of Management and Budget (OMB)-defined metropolitan areas, some HUD-defined subdivisions of OMB metropolitan areas, and each nonmetropolitan county. The steps involved in calculating FMRs include:
- Calculating 40th percentile gross rents for standard-quality, two-bedroom rental units from the 5-year ACS;
- Adjusting to the recent year by multiplying benchmark rent by the recent mover factor, using recent in-mover rents from the 1-year ACS;
- Making additional inflation adjustments to get current-year two-bedroom rents;6 and
- Multiplying the two-bedroom rents by equivalence scale adjustments, to get FMRs for housing units with more/fewer bedrooms.
Additionally, HUD does not allow an area’s FMRs to decline by more than 10 percent annually. These steps are described in greater detail in HUD documentation.7
Among the advantages of the HUD approach to valuing the cost of basic housing are its simplicity, transparency, consistency, and feasibility. The FMR estimate is conceptually clear and simple, in that it is the baseline cost that
___________________
4 These are the revised figures: www.bls.gov/pir/spm/spm_2019re_changes.htm.
5 Data on gross rent were obtained from answers to Housing Questions 14a–d and 18a in the 2020 ACS. Gross rent is the contract rent plus the estimated average monthly cost of utilities (electricity, gas, and water/sewer) and fuels (oil, coal, kerosene, wood, etc.) if these are paid by the renter (or paid for the renter by someone else). Gross rent is intended to eliminate differentials that result from varying practices with respect to the inclusion of utilities and fuels as part of the rental payment. The estimated costs of water/sewer and fuels are reported on a 12-month basis but are converted to monthly figures for the tabulations. Rental units occupied without payment of rent are shown separately as “No rent paid” in the tabulations. Calculation is from ACS tables (www.census.gov/programs-surveys/acs/data/data-tables.html).
6 HUD is currently considering using other private-market data to adjust to recently rented units or to inflate to current year rents in areas where 1-year ACS and/or BLS metropolitan Consumer Price Index data are not available.
7 See www.huduser.gov/portal/sites/default/files/pdf/fmr-overview.pdf.
any household, family, or CU must be able to afford to obtain basic shelter. For these reasons, the PPM threshold calculation methodology would benefit from adopting the FMR approach to estimating the cost of obtaining basic housing in the rental market.
RECOMMENDATION 5.1: The Principal Poverty Measure housing thresholds should be set based on shelter costs for renters only. Rental levels should be based on the U.S. Department of Housing and Urban Development’s annual Fair Market Rent estimates for various shelter unit sizes, which are anchored to the 40th percentile of gross rent for a recently available “standard-quality” two-bedroom unit in a given local area (metropolitan area or nonmetropolitan county).
Transparency of the approach is enhanced by eliminating adjustment for housing tenure type, which is complicated. The FMR approach, based on the ACS—which is available from HUD on an annual basis for every county—is also feasible within the confines of the Census Bureau’s data-publication timelines.
The proposed approach lends consistency to the PPM in that it introduces a threshold that is already used by HUD to estimate local rents for those who receive housing assistance. Specifically, HUD uses FMRs to set subsidy levels for the housing choice voucher program, assuming that the measure captures the cost of renting a decent-quality, two-bedroom housing unit in the local area. The FMR-based approach to housing would also be conceptually similar to this report’s proposed approach to medical care (Chapter 3), in that it would use a preexisting standard of basic need and cost already used by the government for other purposes.
In terms of accuracy, the FMR measure standardizes unit quality to some extent (trimming both substandard units at the bottom and luxury units at the top before calculating the 40th percentile of rents) and attempts to exclude subsidized rental units. In this sense, the FMR measure should capture rents for decent-quality, private-market homes. HUD also adjusts FMRs for housing units with specific numbers of bedrooms and uses an inflator to try to capture current rental costs.
It is worth noting that FMRs are designed to measure rental housing costs for recent movers, not established renters. The rationale for HUD’s focus on recent movers is that a key purpose of the FMR measure is to estimate market rents for standard-quality units that would be paid by housing choice voucher holders. This focus is the key reason that HUD has not previously supported the use of FMRs for the SPM. The rents of recent movers are typically higher than those paid by established renters, and this difference is generally larger in more rapidly appreciating areas. However, an argument can be made that the rents paid by recent movers are a better measure of the available market rents in a local area, and thus more accurately capture housing costs for those actively seeking housing. Total rents paid include those paid by longstanding renters who may enjoy long-tenure discounts and are more likely to live in subsidized or rent-restricted homes.
The Census Bureau could also use an alternative, tailored version of the FMR measure that omits the adjustment for recent movers. Another option would be to use the median rent (or some other percentile of the full rent) of homes that housing choice voucher holders occupy, which must pass housing-quality inspections.
Recommendation 5.2: The Census Bureau should evaluate the impact of adjusting Fair Market Rent (FMR) values for recent movers and determine whether FMRs are an appropriate measure of housing need in the Principal Poverty Measure. It would be useful to compare the current Supplemental Poverty Measure housing component to the current FMRs as well as a measure of FMRs that omits the adjustment for recent movers across geographic areas.
5.2.3. Impacts of Shifting from Consumer Expenditure Survey-Based Expenditures to Fair Market Rents
The proposed method for including housing in the PPM differs from that currently used in the SPM in that the expenditure-based estimates of housing in the SPM threshold are replaced with the FMRs for particular geographic areas. For cases in which the FMR value is equal to the housing share estimated using the CE for a geographic area, there will be no impact on the threshold or the poverty rates for renters. In 2020, the national housing component of the SPM threshold for renters (with two adults and two children) was $1,117 per month. For the
250 metropolitan areas in the Current Population Survey Annual Social and Economic Supplement (CPS-ASEC), the average monthly housing components are almost identical to the average FMRs for two-bedroom rental units: $1,048 versus $1,043 in 2020. However, many metropolitan areas—about 70 percent—have FMRs that are lower than rent levels appearing in the housing component of the SPM. Many of the remaining 30 percent are large cities, where the higher FMRs could be due to the adjustments for recent movers or for the particular municipalities (Housing and Urban Development Department, 2020). For example, in New York City, the geographically adjusted housing component of the threshold for renters (with two adults and two children) is $1,585 (monthly), while the FMR for two-bedroom rental units is much higher, at $1,951. However, for Jackson, Mississippi, the SPM housing component is $932 and the FMR is similar, at $911. For homeowners, both with and without mortgages, the geographic impact will depend on the actual housing costs they incur. As these costs are currently built into the median calculations of FCSUti, the actual costs are expected to be similar, on average, to the current shares in the thresholds. For example, the SPM threshold for a homeowner without a mortgage in New York City is $28,805, while their new threshold using the FMR is $35,813. However, as described below, their housing costs will be subtracted from resources, which could be more or less than the difference of $7,008. Hence, while the thresholds are different, the difference in poverty status may be minimal.
5.2.4. Handling Housing Tenure Status
The current SPM specifies three separate sets of poverty thresholds based on owner/rental status or “tenure”—homeowners with a mortgage, homeowners without a mortgage, and renters. These separate thresholds reflect that housing expenditures, intuitively and as estimated from the CE, differ across these three groups. However, consistent with Recommendations 5.1 and 5.5, it will no longer be necessary to distinguish between renters and homeowners on the threshold side of the PPM.
Recommendation 5.3: The Principal Poverty Measure should discontinue the practice of maintaining separate thresholds for homeowners with a mortgage, homeowners without a mortgage, and renters. While owners without mortgages face lower monthly housing costs, these differences can be accounted for on the resource side.
The rationale for such a methodological switch again rests on simplicity and transparency, as well as on the belief that, in contrast to the number of children in the household, for example, tenure status should not be treated as a factor that changes the minimum cost of the basic shelter needed. Little difference is found in monthly costs between owners with mortgages and renters and, conceptually, the basic shelter need is the same regardless of renter or owner status. The PPM should control for cost-of-living differences, not householders’ consumption choices. Also, tenure status is not a fixed attribute—people transition into and out of home ownership.
5.3. ADJUSTING SHELTER AND UTILITY THRESHOLDS
5.3.1. For Housing Unit Size
The SPM currently assumes that all CUs, regardless of size, require the same fraction of the overall thresholds for shelter and utilities. Moving to the proposed method—using FMRs to adjust for differences in shelter and utility costs for CUs of varying sizes, and then creating a new equivalence scale specific to food and clothing—offers two key advantages. First, the current method implicitly assumes that economies of scale for housing are the same as economies of scale for FCSUti thresholds as a whole, which is likely inaccurate. One would expect greater economies of scale for shelter and utility costs than for food and clothing. In the past, the Census Bureau has deemed that separate equivalence scales would not materially change poverty estimates.8 Still, there are likely
___________________
8 Renwick and Garner (2018), investigating the potential impact of adjusting the housing portion of the thresholds independently, find that “the choice of housing share or the choice of equivalence scale (as estimated) has very little impact on the measure of the impact of housing assistance on overall poverty rates. Even the impact on the poverty rates of those reporting housing assistance is relatively small” (p. 17).
differences in the economies of scale for housing as compared with the other threshold needs categories and, given that the FMR measure has a built-in equivalence scale, it would be relatively simple and sensible for the Census Bureau to use this measure.
The second argument for using the equivalence scale built into the FMR measure is that it is specific to local markets. In its adjustments for housing and utility costs by number of bedrooms, HUD uses market-specific ratios of rents for two-bedroom units versus smaller units, as well as for two-bedroom units versus larger units. This may be important since it is possible that the marginal cost of an additional bedroom is significantly greater in some local markets than in others. Thus (as depicted in Equation 2.3, Appendix 2A), the Census Bureau would adjust the threshold for a CU of a given size and type using an equivalence scale that applies only to food, clothing, and internet/phone since, in its calculation of FMRs, HUD already adjusts for housing unit size, as proxied by number of bedrooms. The “scale” adjustments (on average) for additional bedrooms are:9
HUD goes on to state that the FMRs for units with more than four bedrooms increase by 15 percent for each bedroom—much smaller than the three-parameter scale suggests.10
A similar approach is used elsewhere. For example, the Economic Policy Institute’s (EPI’s) Family Budget Calculator consists of seven components: housing, food, transportation, childcare, medical care, taxes, and “other necessities.” The housing portion of the budget calculator is based on FMRs and adjusts for family size:
HUD makes rental rates available for studio apartments and one-bedroom through four-bedroom apartments. The EPI family budgets assume that a one-adult household occupies a studio apartment and that a two-adult household occupies a one-bedroom apartment. Families with one or two children occupy a two-bedroom unit. Families with three or four children occupy a three-bedroom unit. Rental costs include shelter plus all tenant-paid utilities, excluding telephone service, cable or satellite service, and Internet service. Telephone service costs are included in “other necessities” within the family budgets. (Gould et al., 2018)
One minor complication of using FMRs to adjust for economies of scale in shelter and utilities is that the HUD calculation is based on number of bedrooms, not household size. The Census Bureau will need to research and test approaches for mapping FMRs based on number of bedrooms needed into PPM shelter units based on household size. Although HUD allows local agencies to set allowable unit sizes, HUD’s documentation describes parameters for households with various numbers of members (e.g., households with three people should not live in homes with fewer than two bedrooms or more than three). HUD guidelines state that Public Housing Assistance Assessments may develop occupancy standards consistent with the following rules:11
- No more than two people would be required to occupy a bedroom;
- Persons of different generations, persons of the opposite sex, and unrelated adults should not be required to share a bedroom;
- Husband and wife share the same bedroom;
- Children of the same sex share a bedroom; and
- Children, with the possible exception of infants, would not be required to share a bedroom with persons of different generations, including their parents.
___________________
9 These are averages using 2019 FMR data: avg(FMR by size) / avg(FMR for studio).
10 See www.hudexchange.info/programs/home/home-rent-limits/.
11 Documentation of HUD adjustments for family size can be found at www.hud.gov/sites/documents/74651C5PIHH.PDF.
One potential mapping between household (or SPM unit) size and number of bedrooms, which is consistent with these guidelines, might be as follows:
| (Adults, Children) | Bedrooms |
| 1, 0 | 0 |
| 2, 0 | 1 |
| 2, 1 | 2 |
| 2, 2 | 2 |
| 2, 3 | 3 |
| 2, 4 | 3 |
| 2, 5 | 4 |
| 1, 1 | 2 |
| 1, 2 | 2 |
| 1, 3 | 3 |
Alternatively, the Census Bureau could assign CUs average FMRs based on the minimum and maximum number of bedrooms allowed by HUD.
Recommendation 5.4: The Census Bureau and Bureau of Labor Statistics should consider using Fair Market Rents (FMRs) to adjust for differences in shelter and utility costs for consumer units of varying sizes, and then create a new equivalence scale specific to food and clothing. The Census Bureau should research whether using separate equivalence scales for housing still makes little difference for a version of the Principal Poverty Measure using the geographically specific adjustments to consumer unit sizes embedded in the FMRs.
5.3.2. For Geographic Differences in Rental Prices
It makes sense to adjust SPM (and PPM) thresholds for differences in costs of living, and housing cost is the most important component of cross-area variation. Other budget categories such as food and medical care also vary, but typically by less than housing cost. The conceptual goal of these adjustments is to ensure all families, regardless of location, can purchase comparable basic bundles of necessities—food, shelter, clothing, and utilities. To some extent, cost-of-living differences across locations may reflect differences in underlying amenities. For example, people may pay more to live in parts of the country that offer more moderate climates or better transportation infrastructure. If differences in rent reflect amenity differences to some extent, this counsels against geographic adjustments for cost of living. But such amenities do not directly translate into household economic resources, and to the extent that they do, they are captured in regional differences in income. Finally, cross-regional moves are relatively rare; Child Protective Services’ annual mobility estimates indicate that only about 1.5 percent of households move across state lines each year (U.S. Census Bureau, 2021a).
Evidence suggests geographic adjustment also has a substantial effect on the spatial distribution of poverty, pushing it from the southern United States to the coasts. The adjustment also substantially decreases poverty rates for children living outside of metropolitan statistical areas and increases it for children living inside these areas (Renwick et al., 2017).
Current Method
The SPM method adjusts the housing portion of FCSUti to account for differences in living costs across 342 metropolitan and nonmetropolitan areas in the United States; the largest component of this adjustment depends crucially on the median rent of the area. Pacas and Rothwell (2020) find that, as currently estimated, most of the geographic adjustment in the SPM is explained by median rent differences as opposed to the housing tenure component. Geographic adjustments, which are estimated using ACS data, are based on a formula that accounts
for the percentage of residents within an area who are owners with a mortgage, owners without a mortgage, or renters (see Renwick, 2018, for full specifications of this calculation). As represented by SPM expenditure data, housing accounts for about 40 percent of a typical family’s budget. The SPM geographic adjustment therefore only applies to 40 percent (the SU) of the FCSU threshold. The assumption, driven in part by data constraints, is that cost of living for other categories (and thus the remaining 60% of the budget) is homogenous across regions.12
Proposed Changes/Additions
Geographic adjustment of shelter threshold amounts in the PPM should be consistent with the broader methodology proposed above, using FMRs to represent the basic housing need.
Recommendation 5.5: Principal Poverty Measure thresholds should continue to reflect geographic differences in housing costs. Geographic adjustments should apply to owners and renters based on official Fair Market Rents, which are set at the individual metropolitan area or nonmetropolitan county level.
Using FMRs to make geographic adjustments in cost of living offers several advantages. First, FMRs incorporate cost differences at the metropolitan area and nonmetropolitan county level, so the Census Bureau will not need to make further geographic adjustments. Second, FMRs offer more refined sub-state-level geographic adjustments, particularly for nonmetropolitan areas.13 One problem with the current approach is that the geographic adjustments are applied separately for geographies identified in the CPS Public Use Microdata Sample files (i.e., those with populations large enough to surpass current Census Bureau disclosure safeguards). This effectively means that, while adjustments are made for large metropolitan areas and an agglomeration of smaller metropolitan areas within a state, only a single adjustment is made for all nonmetropolitan areas within a state. However, housing costs may vary significantly within a state’s geographic units, despite the fact that they are currently treated homogenously. Mueller et al. (2021) demonstrate the wide variability between median rents of nonmetropolitan counties within the same state, a pattern that is not adequately captured in the current SPM geographic adjustment.
Ideally, then, the Census Bureau should aim to estimate the PPM at the county level for nonmetropolitan areas within a state and then explore ways to make data publicly available while meeting disclosure standards. Even with the shift to FMRs, the disclosure issue will remain for nonmetropolitan counties. To optimize data value, chosen disclosure procedures should minimize impacts on the resulting geographic distribution of poverty. For metropolitan areas, the Census Bureau could use FMRs at the level of core-based statistical areas;14 for nonmetropolitan areas, county-level FMRs could be used. If the FMR approach is not adopted, then the PPM could be estimated with county-level adjustments and the Census Bureau could explore how to generate publicly available data that meet disclosure standards while minimizing the effect on the resulting geographic distribution of poverty.
5.4. VALUING RESOURCES
While the basic housing need can be assumed to be similar for households (or SPM resource units) of a certain size living in a certain location, the kinds and amounts of resources that can be marshalled to meet this basic, monthly expense vary considerably by shelter type. Specifically, homeowners maintain an asset allowing them the means to shelter themselves. Some households receive resource enhancements toward meeting housing costs, in the form of government assistance. Properly accounting for these resources is crucial for accurate measurement of poverty.
___________________
12 This and other methodological issues having to do with geographic price adjustments are comprehensively addressed by Ziliak (2011).
13 It worth noting that the New York City poverty measure uses an FMR approach for making geographic cost adjustments (www.nyc.gov/assets/opportunity/pdf/NYCgovPoverty2020_Appendix_B.pdf), as do Fitzgerald and Moffit (2022). The SPM method (which compares median rents based on ACS data) would be problematic for the New York City poverty measure, due to the prevalence of housing-affordability programs in the city.
14 Core-based statistical areas are metropolitan or micropolitan statistical areas describing a group of counties (or sometimes just one county) around an urban core.
5.4.1. Rental Income for Homeowners
Alternatives to the Current SPM Method
The SPM does not currently account for implicit rental income in its calculation of resources. Key arguments against incorporating implicit rental income into a poverty measure are: (1) it is difficult for people to understand the concept; and (2) accurate calculation requires reliable data about the market rent that could be charged for any given home. Further, average or median measures of market rent may systematically overstate the implicit rental income for demographic groups that tend to own lower-valued properties, including Black households. However, there is a good argument to be made that homeowners’ resources should include the implicit rent they pay to themselves, as an annual flow of benefits from an owned asset. Homeowners receive a benefit from “renting to themselves,” or, perhaps more accurately stated, from not having to pay monthly rent, which frees up resources to cover other needs.
To be sure, incorporating implicit rent into resources is operationally challenging, as the rental value (or rental equivalence) of a home is not observed.15 The approach requires an estimate of the dollar amount that homeowners would pay for their home if they were renting it; this estimate is typically based on the rent charged for comparable units in the same local market. As such, the rental equivalence is potentially different for every homeowner, depending on the size, location, and features of each home.16 BEA takes this approach in estimating the valuation of shelter services provided through owner-occupied housing for calculation of gross domestic product. BEA imputes a value based on the rents charged for similar tenant-occupied housing, minus related expenses such as maintenance and repairs, property taxes, and mortgage interest.
Unfortunately, the current CPS-ASEC asks few questions about housing characteristics. The survey simply collects the self-reported market value of the owned home, the number of units in the structure, and the type of living quarters (e.g., house, apartment, mobile home, etc.). Given current data availability, the Census Bureau could take three specific approaches to estimate rental equivalence. The first and simplest option would be to use the FMRs for the local market and CU size. The second option would use the number of units in the structure, type of living quarters, and geographic location reported in the CPS-ASEC to estimate a rental equivalence based on gross rents charged for units in similarly sized buildings and in the same type of living quarters in the local market. A third option would use the ratio of market values self-reported by CPS-ASEC respondents to average prices in the area based on the ACS; this ratio would be used to inflate the local FMR to account for the quality/size of that owner’s home.
In addition to simplicity and ease of implementation, the first option has the advantage of consistency with the use of FMRs in calculating the threshold cost of renting an acceptable-quality home. Applying FMRs directly as the implicit rent would also have the virtue of consistency with the proposed approach to medical care described in Chapter 3, wherein the Affordable Care Act benchmark plan is assigned as the threshold need amount for everyone (except those covered by Medicare). Resources include a net value of any health insurance benefits received, calculated for everyone (including those with employer-sponsored insurance) as the basic plan minus a capped premium payment.
The downside of using the FMR approach is that it fails to take into account within-market differences in the size and quality of homes owned by similarly sized households. Given that the CPS-ASEC has no information about the size or number of bedrooms in a home, there is no way to know whether a family of six owns a five-bedroom home or a two-bedroom home. Estimating rental equivalence with FMRs could overstate the value of lower-quality houses (with lower rental values) and could lead to misclassification of CUs as not experiencing poverty. Alternatively, using FMRs as a proxy will understate rental equivalence and overstate poverty for households that own higher-quality homes. But if the Census Bureau were to pursue one of the two options that do not directly use FMRs, the panel recommends that rental equivalences be capped at FMRs, since the difference between the FMR value and the rental equivalence of a home may not easily convert into disposable income.
___________________
15 For discussion of the merits of a user cost/out-of-pocket approach versus rental equivalence, see Garner and Verbrugge (2009).
16 Garner and Short (2009) consider the strengths and weaknesses of different methods for valuing net implicit rental income.
So, households with larger and more expensive homes would still be credited only with a rental equivalence equal to the FMR value.17
Another possibility involves capping the net implicit rental income (that is, rental equivalence amount minus user or operating costs) at the FMR value. This would allow homeowners with larger and more expensive homes to be credited with higher gross rents while ensuring that the net implicit rents estimates do not exceed the FMR value. For consistency with the treatment of medical care, the panel recommends capping the rental equivalence at the FMR value for household size while acknowledging that the Census Bureau should research the implications of each approach.
In the longer run, the Census Bureau should consider adding questions to the CPS-ASEC that more accurately capture rental equivalence. One simple approach would be adding a question about the number of bedrooms in the home, which would allow homeowners to be credited with the FMR value applicable to the size of their home. (As noted below, if rental equivalence varies by number of bedrooms, out-of-pocket housing cost estimates should also then vary by number of bedrooms.)
RECOMMENDATION 5.6: For estimating Principal Poverty Measure unit resources, implicit rental income should be included for households that own homes. In the short run, this implicit rental income could be the local Fair Market Rent (FMR) value for the particular family size, minus user costs—implying that implicit rental income will automatically be capped at the housing cost threshold. The Census Bureau should also analyze how the estimated implicit rent would differ under the FMR approach compared with alternative approaches of estimating rental equivalence based on self-reported home value or average American Community Survey rents for units of the same structure type in the local market. For these alternatives, the panel recommends that implicit rent be capped at the FMR value for the relevant consumer unit size, but the Census Bureau should research the alternative of capping net implicit rent at the FMR value.
Recommendation 5.6 is consistent with the report of the Interagency Technical Working Group on Evaluating Alternative Measures of Poverty (BLS, 2020). This report advises that further research be undertaken to evaluate alternative methods of estimating the net value of shelter service flows from owner-occupied housing in the income resource measure, including the possibility of imputing such values using statistical methods and data from the CE. The working group noted that such research should consider the availability of data from the CPS-ASEC and ACS. The report also provides a detailed discussion of the conceptual reasons to include implicit rent in the estimation of SPM resource unit resources.18
Netting Out Homeowner User Costs
Costs associated with home ownership are real outlays and should be reflected in the estimate of resources. For people experiencing periods of low income, the costs of homeownership, such as property taxes, insurance, and mortgage interest payments, can threaten their ability to keep their homes. These are real costs, not paid (directly) by renters, and must be covered with homeowners’ available resources. These costs should thus be deducted from any estimate of implicit rent.19
RECOMMENDATION 5.7: Homeowners’ user costs in the local area—including mortgage interest payments, property taxes, insurance, and other maintenance expenses—should be netted out of the implicit rental income when estimating Principal Poverty Measure (PPM) unit resources. The PPM should continue estimating user costs separately for homeowners with and without mortgages, as is
___________________
17 This is a yet another example of a topic that could be revisited as research (and data) on measuring household assets progresses. See the discussion of alternative approaches to measuring resources in Chapter 2, section 2.5.
19 The CE includes questions about homeowner costs such as mortgage payments, homeowner’s insurance, property taxes, and maintenance and repairs. The CPS-ASEC does not ask about property-related expenditures.
currently done for the SPM. For consistency with FMRs, user costs could be estimated as the average of the 37th–43rd percentiles of costs for homeowners with and without mortgages. Also, if the Census Bureau accounts for within-market differences in the size and quality of homes in its estimates of rental equivalence, then it should similarly allow user costs to vary with home size and value. User costs should be capped at the value of the rental equivalence, so net implicit rental income cannot be negative.
Determining which user costs should be deducted and, in particular, whether to include the principal portion of mortgage payments when estimating homeowners’ user costs is a key question. On the one hand, principal and interest payments occur simultaneously, and the principal component (while essentially an investment) is not available for use by the homeowner in the short or medium term. Also, existing SPM thresholds treat mortgage payments as inclusive of both interest and principal components. On the other hand, the interest-only portion of mortgage payments represents a more accurate depiction of user cost. Principal payments are effectively a long-term investment into the equity of an asset—in this case, a home. Principal payments are essentially transfers from one savings vehicle to another and do not represent a true user cost of homeownership. Further, homeowners can obtain interest-only mortgages that only require them to pay interest for the first several years. Finally, homeowners with more equity in their homes may pay lower interest payments, and thus user cost may differ significantly between new homeowners and longer-term homeowners. Therefore, including the principal component of mortgage payments as a user cost may mask significant heterogeneity across homeowners with differing lengths of ownership.
The report of the Interagency Technical Working Group on Evaluating Alternative Measures of Poverty (BLS, 2020) states that, in calculating homeowners’ net implicit income, costs incurred should include only mortgage interest payments. While the majority of this panel’s members agree with subtracting interest-only payments, it was not unanimous—a few panelists support inclusion of principal payments. The panel thus recommends the Census Bureau conduct additional research on the efficacy of treating interest only or principal and interest as part of the user cost of homeownership. Note that, in the panel’s judgment, utility costs should not be included as part of homeowner user costs if benchmarking rental equivalence to FMRs, because FMRs are a measure of gross rents, or contract rents plus utility costs. In other words, the panel recommends that homeowners be credited with rents high enough to cover typical monthly utility costs.
In the short run, the Census Bureau could impute owner costs based on the costs reported by homeowners with and without mortgages in the CE. Given that the initial proceeds of home equity loans can be used for consumption, the Census Bureau may want to focus on first mortgages when calculating homeowners’ user costs. In the longer run, the Census Bureau could consider introducing questions into the CPS-ASEC that more accurately capture homeowners’ user costs and that would allow for separation of principal and interest payments.20 Because of the often hybrid tenure (e.g., renting land, owning structure) of owning manufactured homes, the Census Bureau is advised to carefully differentiate costs across various types of living quarters (e.g., mobile homes).
RECOMMENDATION 5.8: The Census Bureau should consider adding new questions to the Current Population Survey Annual Social and Economic Supplement—for example, questions about number of bedrooms—to better capture housing unit size and quality information needed to accurately estimate rental equivalence. The Census Bureau should also consider adding questions to capture homeowners’ user costs more accurately and with greater detail.
5.4.2. Housing Assistance
Current Practice
The housing subsidy valuation in the SPM is estimated as the difference between the “market rent” for the housing unit and the total tenant payment (Fox and Burns, 2021a). The CPS only asks respondents whether they
___________________
20 The Census Bureau could ask homeowners to report on the amount of outstanding debt, the interest rate, and the year the mortgage was originated, to estimate principal and interest payments.
live in public housing or receive rental assistance from the government. No information about rent is collected, so market rent is estimated using a statistical match to HUD data. Specifically, for households reporting a subsidy, market rent reported by HUD is used for households of the same size receiving vouchers or living in public housing. The SPM-estimated subsidy equals this market rent minus the expected out-of-pocket housing cost which, as proxied in HUD payment rules, is the greater of 30 percent of adjusted income or 10 percent of gross income (Renwick, 2018). The subsidy is capped at the housing portion of the SPM threshold, minus the household’s required rental payment.
The current practice is complicated and often delays the SPM because the Census Bureau must wait to receive data from HUD, which can take up to 2 years. Further, in practice, market rent is capped at the housing portion of the threshold for most (90%) of households; this means that, rather than market rent, the housing portion of the threshold is typically used.
Proposed Approach
In-kind housing assistance should continue to be accounted for in resource estimates for PPM units, but the approach should dovetail with the proposed approach of estimating shelter thresholds based on FMRs.
RECOMMENDATION 5.9: In assigning the value of in-kind housing assistance to Principal Poverty Measure unit resources, the calculation should be simplified by estimating the expected subsidy as Fair Market Rent value minus the greater of 30 percent of adjusted income or 10 percent of gross income.
This approach essentially mirrors that currently used by the Census Bureau, described by Renwick and Mitchel (2015), to calculate subsidies for the SPM. The only difference is that the PPM would use FMRs as opposed to estimated “market rents” from HUD (which are also anchored to FMRs). Using FMRs directly will be simpler and will streamline production of the PPM. While the Census Bureau could potentially perform a direct match to HUD data, this would be administratively difficult and would miss households receiving state and local subsidies.
Longer-Term Research
Beyond the PPM calculations proposed in this chapter, the issue of homelessness is an important future research topic. People experiencing homelessness are an important subset of the population living in poverty. Conceptually, in the panel’s judgment, this population should be included in PPM estimates; however, there are many practical challenges in measuring the status of people experiencing homelessness. Research should focus on which data could be used (or created) to include this population. How accurately can the homeless population (at least those in shelters) be enumerated in the ACS? Single-contact censuses—typically undertaken by teams of field workers in clearly defined areas where preliminary studies suggest large populations of unhoused individuals can be found—have been used by cities to estimate the sizes of populations experiencing homelessness (Institute of Medicine, 1988).
Once counted, a method would need to be developed to estimate the basic PPM elements. Presumably, the shelter need would be calculated based on FMRs, the same way it is calculated for other PPM units. Housing resources could be approximated as zero, since there is no home ownership and no subsidies. The research should estimate the potential impact on the PPM—that is, what percentage of those living in poverty does the homeless population (which people flow into and out of) account for?
This page intentionally left blank.


