
2
Conceptual Basis of the Supplemental Poverty Measure
This chapter outlines the key conceptual elements of the Supplemental Poverty Measure (SPM) and proposes options for improving and updating their measurement. First, the SPM, as currently specified, is reviewed. Next, the core measurement principles that guided the panel’s deliberations on potential changes to the SPM are identified, and arguments for maintaining multiple statistical poverty measures are considered. The chapter then addresses conceptual and practical issues in setting (and adjusting) need thresholds and in estimating household resources. To a large extent, the panel’s recommendations involve suggestions for a more intuitive and consistent characterization of both households’ basic needs and the resources available to them. The chapter concludes by considering alternative units of analysis, focusing on the relative strengths and weakness of the household and the current SPM resource unit.1
2.1. CURRENT SUPPLEMENTAL POVERTY MEASURE SPECIFICATIONS
2.1.1. Thresholds
The Official Poverty Measure (OPM) threshold is defined as three times the cost of a minimum food diet in 1963. The SPM threshold, in contrast, relies on a broader concept of material wellbeing. Since its inception, the basic categories in the SPM have been food, clothing, shelter, and utilities (FCSU, referred to throughout this chapter as the basic bundle), plus “a little more.” “A little more” has been set at 20 percent of the basic bundle since the introduction of the SPM. The use of a 0.2 multiplier represents the cost of other necessities, such as nonwork-related transportation, personal care, and household supplies.2 Beginning in 2021, internet service was added to the basic bundle and telephone service was pulled out of utilities and made a separate item. This updated categorization was renamed FCSUti.
The SPM threshold amount was originally estimated as the 33rd percentile of spending for families (or, more accurately, SPM resource units) with two children sampled in the Consumer Expenditure Survey (CE). In this sense, because the threshold is set based on the distribution of people’s expenditures on the set of included budget
___________________
1 The SPM “resource unit” is defined slightly differently than “household.” While the latter term is often used in this report to lend intuition and for ease of exposition, the strengths and limitations of various resource units are addressed in the final section of this chapter.
2 Details of the SPM specification are presented in Appendix A and can be found in Census Bureau documentation (www.census.gov/content/dam/Census/library/publications/2021/demo/p60-275.pdf). The basis of this threshold concept is described the National Academies’ 1995 report (NRC, 1995), Chapter 2.
items, the SPM is a quasi-relative poverty measure (NRC, 1995). The five most recent years (20 quarters) of CE data were used for the estimation, with dollar amounts for each quarter adjusted for inflation to the threshold year using the all-items Consumer Price Index for All Urban Consumers (CPI-U). So, for example, thresholds for 2021 were based on data collected in the CE interview from 2017 (Q2) through 2022 (Q1).
As of the September 2021 SPM release, estimation of the threshold base changed from using the 33rd percentile—as represented by CE units sampled from within the 30th–36th FCSU expenditure percentile range—to using estimates based on 83 percent of the averages of the 47th–53rd percentile range of the FCSUti distribution among households with children. This shift, recommended by the previous National Academies of Sciences, Engineering, and Medicine panel (NRC, 1995), is a sensible one given that median-based measures are better at preventing distortions at the lower end of the distribution.3 For example, using a median-based measure “lessens the impact of imputing in-kind benefits into the threshold, as fewer consumer units receive in-kind benefits at the median than at the 33rd percentile” (Fox and Garner, 2018, p. 16). In addition, the new estimation sampling procedure used in the SPM includes all consumer units with children, as opposed to only those with exactly two children, yielding a larger CE sample size. As of 2020, CE data used in the threshold base are lagged by one year, in this case using the 5 years (20 quarters) of CE data preceding the threshold year. With the new methodology, 2021 thresholds were based on data from 2016 (Q2) through 2021 (Q1) with each quarter of data adjusted using an annual average FCSUti price index.4 Once the SPM threshold is set, adjustments are made to reflect the impact of a range of factors—including family size and composition, geographic location and, currently, housing mode (renting versus owning)—on the level of resources needed to obtain a basic material standard of living.
Family Size
The thresholds in the SPM are adjusted to reflect that households’ needs typically increase with size. Equivalence scales adjust the basic two-adult, two-child family size to reflect that larger households require more income than smaller households to attain a similar standard of living. However, the equivalence scales are not linear; they build on the fact that economies of scale can be achieved as household size increases and that needs differ between children and adults—specifically, children are assumed to require less resources than adults. For example, to reach the poverty threshold, a two-parent, one-child family is assumed to require about 88 percent of the level of resources required by a two-parent, two-child family. Equivalence scales also attempt to reflect that the functional relationship between the number of household members and costs differs for specific basic needs. For example, economies of scale may be quite limited for food, while they are often substantial for shelter. Scale factors for numbers of SPM household members are currently set in the range recommended by the 1995 National Academies panel (NRC, 1995).5
Geographic Variation in Cost of Living
National-level SPM thresholds are adjusted to reflect differences in rental prices across areas; the geographic adjustment is only applied to the housing component (shelter plus utilities) of the threshold. The inter-area price adjustment is based on a median rent index estimated from the American Community Survey (ACS) (Garner and Munoz, 2021). Differences in housing costs are identified for 342 metropolitan and nonmetropolitan areas in the
___________________
3 The National Academies’ 1995 report (NRC, 1995) recommended that the starting threshold for a new measure be around the 33rd percentile, which would be turned into a percentage of the FCSUti median (around 80% at the time) and used to update the measure.
4 See www.bls.gov/pir/spm/spm_2019re_changes.htm for a description of SPM methodological changes that became effective in 2021. This site also shows comparisons between revised versions of the 2019 thresholds and 2019 published thresholds.
5 Census Bureau documentation (Fox, 2020) includes the full specification of the “three-parameter” equivalence scale—to account for units with one and two adults, with single parents, and for all other families. For example, the one- and two-adults scale = (adults)0.5; the single parent scale = adults + 0.8 * first child + 0.5 * additional children)0.7. The scale for all other families = (adults + 0.5 * children)0.7. As currently specified in the SPM, once geographic and housing tenure adjustments are factored in, there are, in effect, 46,170 thresholds—342 areas * 3 housing tenures * 45 equivalence scale categories. A detailed explanation of how equivalence scales are used in the SPM, and more generally in poverty measurement, can be found in National Academies of Sciences, Engineering, and Medicine (2019, Appendix D.2-4).
United States. For SPM resource units in metropolitan areas, the geographic adjustment is based on the characteristics of the metropolitan area; for those in nonmetropolitan areas, the adjustment considers the characteristics of all nonmetropolitan counties within the state. In both instances, the adjustment is based on the median gross rent (rent plus utilities) of a two-bedroom unit (Renwick, 2018). As detailed in Chapter 5, although likely interrelated with other factors (e.g., access to amenities, school quality, length of commutes), the justification for limiting the geographic adjustment to housing expenditures is that it is the most likely threshold category to differ substantially in terms of costs by area and, thus, to affect the level of resources needed to live in an area. The best way to estimate commuting and other transportation costs and factor them into geographic adjustments is an important issue for future research.
Stakeholders have long stressed the need for finer geographic detail to capture spatial variation of poverty. Urban and rural differentials and intrastate variation are of particular interest for some research and policy purposes (Pacas and Rothwell, 2020). As discussed in Chapter 5, the SPM methodology groups together all rural areas within a state, even when there may be sharp housing-price differentials across these areas. However, decisions to pursue additional geographic detail in the SPM may involve tradeoffs in terms of accuracy, transparency, and accessibility.
Owner/Renter Status
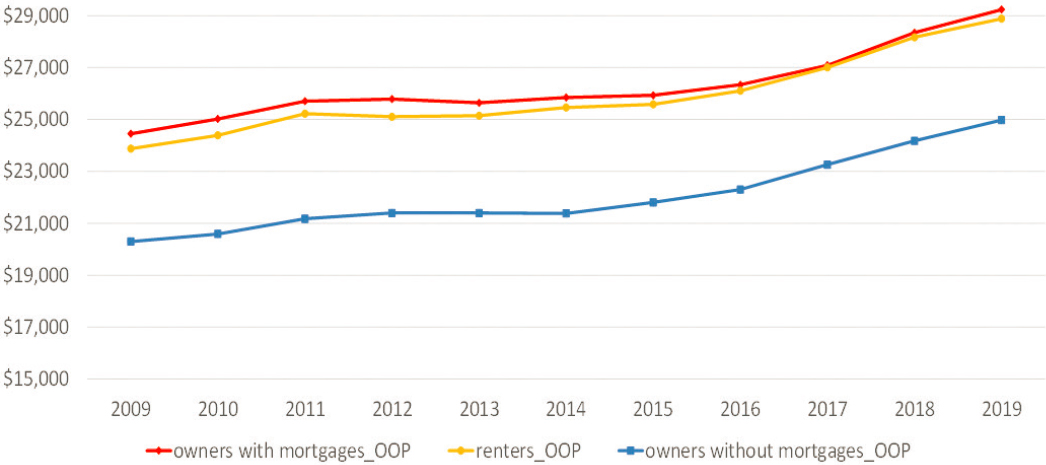
Currently, SPM thresholds are set separately for each housing “tenure” group—owners with mortgages, owners without mortgages, and renters. As illustrated in Figure 2-1, which uses the prior FCSU methodology based on CE data for respondents from the 33rd–36th percentiles, the relationships among the housing tenure groups have been fairly constant over time. Thresholds for owners without mortgages, for example, are typically about 85 percent of the thresholds for owners with mortgages or for renters.
Several methods have been explored to acknowledge differences in resource needs of homeowners and renters (Garner and Verbrugge, 2009; Törmälehto, 2017). Consumption-flow measures, such as those used to price housing services in the CPI, have been based on rental equivalence estimates for several decades (Garner, 2006). Chapter 5 explores alternative methods for considering the unique shelter-related spending needs of owners and renters in the SPM. That chapter raises a key point: homeowners incur costs in a way that affects the level of resources available to purchase other necessities.
SOURCE: www.bls.gov/pir/spmhome.htm.
Price Changes
In addition to the adjustments in base thresholds that reflect variation in “real factors” (such as the quantity of food or clothing purchased by CE respondents), expenditure estimates must be adjusted to account for price changes taking place over the data-collection period that factor into a given year’s SPM statistics. This procedure is needed because CE data are pooled over 3 (or 5) years, a standard practice in creating a multi-year estimate.6 As indicated above, FCSU expenditures were previously adjusted for inflation using the all-item CPI-U and are now adjusted using a more narrowly specified FCSUti CPI-U.7
2.1.2. Resources
The OPM resource concept is based on gross before-tax money income—meaning market income (wages and salaries, net self-employment income, net farm income, pensions, rent/interest/dividends), social insurance, cash welfare, education assistance, and financial assistance from relatives and others. In contrast, the SPM approach for estimating a family’s resources takes into account these sources of money income but also includes the cash value of some in-kind benefits and subsidies, as well as tax credits, that resource units can use to meet their needs. Some one-time additions to resources, such as the 2020 stimulus payments, are also counted. As detailed in Appendix 6B, most, but not all, of the data to estimate these resource additions comes from Current Population Survey—Annual Social and Economic Supplement (CPS-ASEC). Some resource estimates rely on imputations, administrative data, and other sources. In addition to the cash assistance programs captured in the OPM, the following programs are included in SPM resources:
- Supplemental Nutrition Assistance Program (SNAP);
- Special Supplemental Nutrition Program for Women, Infants, and Children (WIC);8
- National School Lunch Program (NSLP);9
- Subsidized housing;10 and
- Home energy assistance.11
Additionally, tax credits such as the Earned Income Tax Credit (EITC) and Child Tax Credit are added to estimates of available resources. One-time or transitory resource injections (and extractions)—such as capital gains and losses, withdrawals from savings, and intra-family in-kind transfers—are generally excluded from both the OPM and the SPM. Recently, the Census Bureau began counting withdrawals from defined contribution plans for people age 59 and older as resources in both the OPM and the SPM.12
Various adjustments are also made to the SPM to reflect expenditures that reduce the level of resources available to households. Taxes paid (federal, state, and payroll), work expenses (including child and dependent care), medical out-of-pocket (MOOP) expenses, and child support paid to another household are all subtracted from the estimation of resources. While CPS-ASEC income and demographic data are used to estimate the probability of
___________________
6 For example, ACS 12-month income is reported each month; a single-year income estimate is calculated by adjusting each month’s income to be in constant dollars for the calendar year. See www.census.gov/content/dam/Census/library/publications/2018/acs/acs_general_handbook_2018_ch10.pdf.
7 The Bureau of Labor Statistics has considered alternative price-adjustment formulas, including: (1) updating the 5 years of CE quarterly expenditures using within-area specific FCSU composite expenditure indexes (as opposed to the U.S. urban FCSUti composite price indexes); and (2) converting consumer unit-level expenditures in local dollars to “national” dollars before consumer unit-level reference unit FCSU expenditures are ranked to account for differences in interarea costs (spending patterns, prices, supply) for FCSU (or at least the SU component; Garner and Munoz, 2021).
8 CPS-ASEC does not ask respondents how much they received in WIC benefits, only whether they received benefits at all. To impute dollar amounts, the Census Bureau uses WIC program information from the U.S. Department of Agriculture on the value of WIC food packages.
9 CPS-ASEC asks whether children “usually” ate lunch at school, and whether it was free or reduced price. The costs of school lunches are obtained from the U.S. Department of Agriculture’s Food and Nutrition Service.
10 The Census Bureau sets the value of the housing subsidy by subtracting the estimated amount paid by the tenant from the market rent value for the housing unit (see Chapter 5 for details).
11 The CPS-ASEC asks about energy assistance received for the entire year through the Low Income Home Energy Assistance Program.
12 Full specification of the SPM resource unit resource calculation is detailed in Appendix A, Table A-2.
families’ filing statuses (e.g., married filing jointly or married filing separately), CPS-ASEC does not directly ask respondents about taxes paid. Instead, the Census Bureau estimates taxes using a model (for details of the model, see O’Hara, 2006). Subtraction of work expenses, including childcare, is capped at the amount of the work-related earnings of the lowest-earning family head (or spouse/partner). Work expenses other than childcare are imputed, and the amount is the same per week of work for all workers.13
While the SPM concept of resources is quite comprehensive, many transfers and benefits are underreported in surveys. As a result, estimates can often be improved using program administrative data and modeling methods (see Chapter 6). In recent decades, administrative microdata have been increasingly used by researchers and statistical agencies to supplement survey data in ways that expand what is known about family-level economic conditions. Microdata include government administrative data generated by the tax system and by Social Security and other programs,14 as well as private administrative data such as those generated by credit reporting agencies and organizations tracking housing market transactions. In some cases, administrative data may be of higher quality than survey data because they are less subject to sampling variability and respondent reporting errors. However, administrative data are also not free from errors and, perhaps more importantly, may not match the concepts used in surveys, as administrative data collection is tied to their purpose. For example, because cash and in-kind transfers are generally exempt from taxation, taxable income as defined by the Internal Revenue Service is more restrictive than the measure of income needed to comprehensively measure economic wellbeing.
2.2. GUIDING PRINCIPLES: DESIRABLE CHARACTERISTICS OF A POVERTY MEASURE
As succinctly stated by the National Academies’ report Measuring Poverty: A New Approach (NRC, 1995), “science alone cannot determine whether a person is or is not poor” (p. 37). Given this reality, some subjective expert judgment is required when specifying a poverty measure intended to serve a range of policy, research, and public information needs. Such judgments benefit from a process that is informed by a set of guiding principles.
In considering potential modifications to the SPM, this panel continually returned to at least four core principles—accuracy, consistency, transparency, and feasibility. While it is not possible to meaningfully weight and rank the importance of these guiding principles, the panel considered tradeoffs among them when assessing proposed changes to the SPM. In its recommendations to improve the SPM, the panel also considered specific attributes of each principle—for example, timeliness and completeness as attributes of accuracy, and accessibility (both in terms of the understandability of concepts and methods and the use of publicly available data) as an attribute of transparency—as well as operational feasibility.15
2.2.1. Accuracy
Perhaps the most obvious attribute needed for a poverty measure, or any economic statistic, is accuracy. Most importantly, the statistic must capture the intended, conceptual measurement objective. To achieve accuracy, the data used for measurement should have minimal bias and variance. For example, when surveys are used to estimate resources, household and item nonresponse should be low and accuracy of reported income should be high. The survey should also have sufficient sample size for reliable estimates—not just for national totals, but also for relevant population subgroups (e.g., those living in a given state or metropolitan area or specific groups defined
___________________
13 In other words, work-related expenses (which, beyond transportation and childcare, also include items such as uniform fees) are a fixed value for all workers. Estimates are calculated as a weekly amount (based on calculations from the Survey of Income and Program Participation) multiplied by the reported number of weeks worked.
14 E.g., Temporary Assistance for Needy Families, Unemployment Insurance, Workers’ Compensation, SNAP, WIC, Low Income Home Energy Assistance Program, NSLP, and housing subsidies.
15 The previous National Academies’ panel (NRC, 1995, p. 3) used a related set of guiding principles—public acceptability and understandability, statistical defensibility (including consistency between threshold and resource concepts), and feasibility. The principles of the current panel also relate to a data-quality framework developed by Biemer and Amaya (2018), which includes relevance, accuracy, timeliness and punctuality, accessibility and clarity, comparability (across time and geography), and coherence (consistent standards). Similar principles apply to development of other federal statistics; for example, see National Academies (2020) for a discussion of desirable characteristics of a consumer food data system—including comprehensiveness, representativeness, timeliness, openness, flexibility, accuracy, suitability, and fiscal responsibility.
by race).16 When other types of data are used, such as administrative records, appropriate tools must be in place to assess the quality of those data as well.17 For example, administrative records can provide a wealth of information on safety net program participation and payments, but they must be available for comparable measurement units, have sufficient coverage of geographic areas represented by the statistic, and be linkable to core survey data (see Chapter 6).
Timeliness
Timeliness is a dimension of accuracy, the importance of which depends on policy and research information needs. A statistic with short time lags between data collection and publication more accurately reflects the current poverty situation than does a statistic that uses outdated information. Never has this been more apparent for economic statistics than during the disruption (market and nonmarket) created by the COVID-19 pandemic. Job losses (and the resultant lost income) at the onset of the pandemic were concentrated in industries that pay below-average wages, such as leisure and hospitality services, education and health services, and retail trade (Bateman and Ross, 2021). At the same time, consumers changed expenditure patterns in response to public health measures such as social distancing (e.g., spending more on food at home and less at restaurants), and prices rose more quickly for some basic item categories that comprise large percentages of outlays for low-income households. Consequently, more households found it difficult to meet their basic needs. For example, using data from the first two waves of the Census Bureau’s Household Pulse Survey (April 23 and May 7, 2020), Schanzenbach and Pitts (2020) estimated that food insecurity increased significantly for most types of households over that period. The Federal Reserve Board’s 2019 and 2020 Surveys of Household Economics and Decisionmaking (SHED), fielded in November 2019 and 2020 with supplements fielded in April and July 2020, found short-term fluctuations in households’ financial resources during 2020. There was a five-percentage-point drop in respondents who reported they were “at least doing okay financially” from November 2019 to April 2020, followed by an increase as pandemic aid from the federal government kicked in (Lloro et al., 2022).
Related to timeliness is the frequency of an economic statistic—both in terms of release and reference period covered.18 The SPM ascertains poverty for a calendar year and releases estimates annually, about 6 months after data collection ends. In some instances, however, more frequent (e.g., monthly) statistics are valuable. In the context of poverty measurement, there are important policy concerns that must be addressed using higher-frequency statistics—for example, how households spread publicly provided benefits over time, and how households fare when they exhaust (or are close to exhausting) a benefit.
Pandemic-era dislocations underscored the value of high-frequency measurement and information on short-run variability in poverty. During extraordinary times, like the COVID-19 pandemic and subsequent period of policy responses (e.g., the Coronavirus Aid, Relief, and Economic Security Act), there are clear benefits of monthly poverty measures. The Federal Reserve Board’s supplements to the SHED in April and July 2020 helped provide intra-year measures of financial insecurity not normally available from the core annual survey. Directly addressing the need for monthly data, Columbia’s Center on Poverty and Social Policy launched a project tracking monthly poverty rates throughout the COVID-19 pandemic. Their measure includes all (simulated) taxes and transfers, and accounts for disbursement of federal pandemic relief efforts.19 Parolin et al. (2022) developed a framework
___________________
16 Biemer and Amaya (2018) decompose survey “accuracy” into sampling error and seven types of nonsampling error: (1) frame error (under- or over-coverage); (2) nonresponse error; (3) measurement error; (4) data-processing error; (5) modeling and estimation error; (6) revision error; and (7) specification error (the difference between the true, unobservable variable and the observed indicator).
17 National Academies (2020) states that, for most kinds of nonsurvey data, there is little in the way of “agreed-upon techniques for assessing the validity, reliability, and robustness of the inferences made” (p. 128). However, increased attention is being given to measuring the quality of administrative and commercial data. Statistical agencies are turning to quality-assessment approaches that broaden measures of error and focus on gaps in the coverage of the population of interest (e.g., BLS, 2020).
18 The Census Bureau has recognized the value of high-frequency data, particularly during the COVID-19 pandemic. In collaboration with other federal agencies, the Household Pulse Survey was developed to “deploy quickly and efficiently, collecting data to measure household experiences during the coronavirus pandemic” that could be disseminated in near real time “to inform federal and state response and recovery planning”: www.census.gov/data/experimental-data-products/household-pulse-survey.html.
19 See www.povertycenter.columbia.edu/forecasting-monthly-poverty-data.
for producing monthly estimates of the SPM and OPM “based on a family unit’s monthly income [and with only a two-week lag] … to [among other things] better account for intra-year income volatility” (p. 1). To study the effectiveness of pandemic relief programs during 2020, Han et al. (2020) used high-frequency (monthly) CPS data to produce short-lagged, previous 12-month estimates of income and poverty.20
Even before the COVID-19 pandemic underscored the need for frequent estimates of short-term variability in poverty, the Census Bureau investigated the possibility of producing a monthly poverty statistic.21 As discussed in Chapter 6, this work, which is important to continue, relies heavily on the ACS. The ACS maintains a sample size much larger than that of the CPS and therefore supports the needed estimates. Indeed, the Census Bureau pilot project involved developing methods by which ACS data could be used to support historical, sub-annual estimates of health insurance coverage or other elements of interest (Albright and Asiala, 2015).
Completeness
Completeness is another dimension of accuracy and includes which people and places are covered. A national statistic is expected to cover as many members of society as possible. For example, the SPM resource-sharing unit is an improvement over the OPM unit in that it includes foster children and other unrelated children under age 15. However, some groups—for example, people who are incarcerated or people experiencing homelessness—do not factor into the SPM (or the OPM).22 The lack of shelter among those experiencing homelessness is a severe form of economic hardship and should inarguably be considered in estimates of poverty but, given current survey and administrative data sources, cost is a roadblock to the inclusion of these individuals. Conceptually, should people living in prisons and other institutions be included as family members when determining a family’s poverty status?
It is also important for a complete poverty measure to be granular geographically, in a way that reflects political decision making at various levels (e.g., state, county, city). This feature poses challenges for statistical agencies, both due to limits regarding which data sources can be used and due to measures necessary to protect respondent confidentiality. Some state-level administrative records may provide relatively accurate information about income and program participation, for example, but if comparable data cannot be obtained from all states covered by the poverty statistic, such information may be of limited use in producing national-level estimates. The same may be true for various types of commercial data. Such data may, for example, provide accurate and detailed information about medical insurance policies, rental rates, or food prices for a subset of the population, but if they cannot be aligned to represent the full population of interest, such data are of less value (or must be combined creatively with other sources). Tracking severity levels of poverty (e.g., deep poverty, near poverty) is also needed. The Census Bureau tabulates income-to-poverty ratios (e.g., income less than 50% of the poverty threshold) for its SPM and OPM reports. Labeling the applicable ratios as “deep poverty,” “near poverty,” and the like could be useful to call attention to trends in and characteristics of people experiencing more or less severe poverty. These and related issues point toward the need for future poverty measurement research by statistical agencies and others (see Chapter 6).
2.2.2. Consistency
Consistency—in concepts, methodologies, and data—is an important guiding principle in poverty measurement. Consistency is particularly important for a statistical construct such as the SPM, which involves comparing threshold levels and household resources based on a range of data involving disparate measurement concepts. The National Academies’ 1995 report Measuring Poverty: A New Approach (NRC, 1995) highlights that relative resource measures, such as one-half median family income, are consistent with threshold measures if they are estimated from
___________________
20 Han et al. have continued to produce previous 12-months’ poverty estimates monthly. See www.povertymeasurement.org/covid-19-poverty-dashboard/.
21 The Census Bureau’s Survey of Income and Program Participation, which features an oversampling of a high-poverty stratum, has been used to produce “unofficial” average monthly poverty rates by selected demographic characteristics. See www.census.gov/library/publications/2019/demo/p70br-165.html.
22 Students living in college dormitories are supposed to be reported by their parents.
the same data source. When thresholds are estimated using data different from those used to estimate resources, the report notes that “explicit attention must be paid to achieving consistency between the two components” (p. 37). A poverty measure must, the report argued, “allow for reasonable comparative analyses (within the limits of available data) across time, across places, across types of families, and across population groups” (p. 38).
Census Bureau documentation emphasizes the consistency principle—particularly that, where possible, resources and thresholds are consistently defined in the construction of the SPM. The 2010 Interagency Technical Working Group on Developing a Supplemental Poverty Measure (Interagency Technical Working Group, 2011) valued consistency between threshold and resource definitions, data availability, simplicity in estimation, stability of the measure over time, and ease in explaining the methodology. One recently remedied inconsistency in the SPM resulted from the inclusion of in-kind benefits for food, rent, and energy in the estimate of resources, while the estimate of thresholds only accounted for spending on SNAP in-kind benefits—because the CE collects limited or no data on these programs. Beginning with the 2020 poverty estimates released in September 2021, the CE data used to estimate SPM thresholds include imputed values for the Low Income Home Energy Assistance Program, NSLP, WIC, and rental assistance from government sources.23
Among the many dimensions along which tradeoffs must be assessed, the value of statistical consistency must be weighed against accuracy criteria. Conditions and norms have changed since 1995, and even since 2011 when the SPM was instituted, so preserving the original specification indefinitely to prevent breaks in the series comes at a cost. For example, the changing budget shares of basic needs categories such as food, clothing, shelter, and utilities—relative to each other and to other expenditures—should be reflected in a poverty measure. The decision of the Census Bureau and BLS to include internet in the basic bundle beginning with the 2020 thresholds recognized important changes in the goods and services needed to participate in society and the economy.
In general, the panel weighs accuracy more heavily than avoiding series breaks. This view is consistent with that of the original guidance provided by the Interagency Technical Working Group (2011), which stressed that improved accuracy was a greater priority than historical consistency. In the panel’s opinion, a headline poverty measure should always use the best methods and data available, and then strive to create a historical series. The panel also notes that certain strategies can be used in producing statistical series (e.g., extending series backward, running old and new series concurrently for a time, or creating an “anchored” version in which thresholds at a point in time are adjusted only for price changes) to minimize the impact of changes and maintain usefulness for temporal comparisons.
2.2.3. Transparency
The value of an economic statistic depends in part on the ease with which it can be interpreted and the extent to which information sources used in its production can be understood. Transparency can be increased, by: (1) reducing the number of components in the estimation formula; (2) reducing reliance on imputations or use of other complex methodologies; and (3) including careful and clear documentation to explain the measure. The OPM is quite easy to understand since its calculation relies on comparatively few components—the cost of a food diet multiplied by three for thresholds is transparent, as is money income for resources. But this simplicity comes at a high cost—simple statistics may not accurately track populations experiencing economic hardship in ways that support the intended purposes of poverty statistics. Furthermore, even though the threshold-setting and resource-estimation methods in the SPM account for the impact of a much larger set of factors than does the OPM, a high degree of transparency can still be achieved through intuitive specification (e.g., including all major expenditure categories separately in the threshold equation) and careful documentation accompanying public release of the statistic.24
An important aspect of transparency is the ability of the public to understand and/or use the statistical measure, its data, and its methodologies. The SPM is based on data that are generally accessible in standard, publicly
___________________
23 See www.bls.gov/pir/spm/spm_2019re_changes.
24 The call for greater transparency in official poverty measures was a common theme in public comments to the panel and is clearly an important criterion for stakeholders. A summary of these public comments is provided in Appendix B.
available data sets, such as the CPS-ASEC and the ACS, which contributes to its transparency. Accessibility of statistical systems’ outputs and inputs has becoming increasingly important in a “big data” world, in which useful alternative data sources have emerged. For example, some commercial data sources may have more granular or timely data on rent payments or consumer purchases, but if those data are not accessible to policy analysts and others attempting to understand the statistics, accuracy or precision could be reduced.
Although beyond the scope of this panel, it is important to note that the Census Bureau’s adoption of more stringent protections against increased threats to data confidentiality will likely erode future access to accurate, publicly available micro- and tabular data on poverty and other topics. To date, the Census Bureau has taken steps in this direction, including dropping or masking variables deemed too disclosive and, for its 2020 data products, adopting protection algorithms that satisfy differential privacy concepts.25 These algorithms introduce noise into virtually every data point. For the ACS, the Census Bureau is researching construction of a synthetic public-use microdata file; this would likely require a validation server for analysts to ascertain whether their estimates from public-file data are sufficiently accurate or are too distorted for use.26 For poverty measurement, these methods could, in some cases, reduce the accuracy of estimates requiring subnational geographic detail or details of certain populations, such as smaller racial groups.
2.2.4. Feasibility
It is obvious but crucial that production of a statistical measure must be operationally feasible. In its discussion of criteria for a poverty measure, the National Academies’ 1995 report Measuring Poverty: A New Approach (NRC, 1995) emphasizes operational feasibility along with public acceptability and statistical defensibility. That report describes operational feasibility as occurring when “data can be collected that will in fact measure the prevalence of the conditions underlying the concept of poverty. Income and expenditures are concepts that are generally understood and can be measured and so these should be the core of the concept and measure of poverty” (p. 39).
For data to be incorporated in a statistical measure, barriers to data access must be reasonable. For example, a poverty measure would ideally include information on populations experiencing homelessness. However, official statistics are generally limited to including components for which information can be practically collected at the required frequency.27 Estimating basic medical care needs, as proposed in Chapter 3, provides an example of an approach that would not have been operationally feasible in 1995, or even at the inception of the SPM in 2011. However, such estimation has now become possible as data and analytic barriers have been overcome.
2.2.5. Tradeoffs
In developing its recommendations, the panel regularly confronted tradeoffs between accuracy on the one hand and consistency, transparency, or feasibility on the other. In some cases, a more accurate and comprehensive SPM may require an estimation procedure that is more complex, requires additional data, or is less transparent to stakeholders than the current estimation procedure. Likewise, changing the resource measure or threshold specifications may decrease the consistency of the historical poverty series over time, if data sufficient for revising past estimates are unavailable or infeasible to access. Moreover, the cost to a household of meeting basic needs, and the adequacy of resources available to do so, depends on many factors, including area-specific cost of living, household size and composition, and program availability, to name a few.
___________________
25 Census Bureau implementation of differential privacy is described here: www.census.gov/programs-surveys/decennial-census/de-cade/2020/planning-management/process/disclosure-avoidance/differential-privacy.html#:~:text=Differential%20privacy%2C%20first%20developed%20in,each%20release%20of%20confidential%20data.&text=By%20law%2C%20we%20must%20ensure,in%20the%20statistics%20we%20publish.
26 See www.census.gov/library/publications/2021/decennial/2020-census-disclosure-avoidance-handbook.html.
27 These boundaries are being pushed by research including that of Meyer et al. (2021), which combines survey data (ACS) and administrative data (from tax records and a number of benefits programs) to shed light on survey coverage of people experiencing homelessness and discusses how better to incorporate information about this hard-to-survey population into income and poverty estimates.
Attempting to consider all these factors in a more comprehensive way could quickly increase the complexity of the estimation procedure. Examples of increases in precision that could add to the complexity and data demands of the SPM include:
- Incorporating assets and debts in resource calculations;
- Seeking refined adjustments for household size, to account for scale costs that differ among needs categories (e.g., medical care, housing, food);
- Accounting for variation in the needs of households with specific characteristics, such as persons with disabilities;
- Adding granularity to housing-cost geographic adjustments, or adding dimensions to geographic adjustments (e.g., transportation or childcare); and
- Differentiating threshold costs for homeowners, as opposed to using rental rates to represent the universal basic shelter need.
In some instances, the panel has accepted a tradeoff to improve accuracy and conceptual clarity, even if the recommended approach creates new estimation and data demands. It is important to recognize that increasing complexity does not necessarily decrease transparency. For example, recommended updates to the SPM proposed in this report involve expanding the number of explicit basic needs categories represented in the measure’s threshold. While this increases complexity because additional estimates are required, a more complete accounting of basic needs in the poverty threshold can increase intuition about the measure’s meaning. In certain cases, added complexity in the threshold will reduce complexity on the resource side, and vice versa.
Tradeoffs also exist in terms of a measure’s specificity and its generalizability to a range of applications. A measure designed to perfectly serve one purpose may be less useful for other purposes. For example, a measure optimized to accurately monitor poverty at a highly aggregated (national) level may entail an approach quite different from that of a measure designed to detect metropolitan area versus nonmetropolitan area patterns of poverty within a state or county, or one designed to determine program eligibility at a local level.
As with other desirable statistical characteristics, timeliness and frequency are subject to tradeoffs in other dimensions. Compared with annual estimates, monthly estimates will typically be based on smaller sample sizes, which can reduce accuracy. And, while poverty effects associated with COVID-19 relief programs, for example, can be included in annual measures (e.g., as part of the tax component), policy makers would benefit from more timely and frequent warnings of increasing material hardships during fast-moving economic shocks like the COVID-19 pandemic. Some people lost income but had resources available to continue living in a similar fashion; such information would be useful for measuring poverty at high-frequency intervals.28 Given that geographic detail in poverty measurement is necessary for assessing policy variation among states for programs such as Medicaid, increasing temporal detail could compete with, and possibly deplete, resources for that important purpose. A question—relevant for a range of economic data including inflation and employment statistics—is whether the pandemic time period is an outlier, or whether greater volatility in economic conditions and household finances will become more common, increasing the need for and value of high-frequency statistics.
Tradeoffs also exist regarding the types of data used to underpin poverty estimates (see Chapter 6). For example, administrative data are often perceived to be more accurate than self-reported information on income or safety net program receipt amounts. However, for some SPM variables, administrative data would involve a longer lag, creating a potential accuracy-timeliness tradeoff. It is also important that administrative data reference the same (or a convertible) time period and population-grouping unit (household, individual, consumer unit [CU]) needed for the statistic being produced.
___________________
28 The JPMorgan Chase Institute uses banking data to study intra-year variations in cash balances, income, and spending; their reports have usefully documented the situations of various types of families during the COVID-19 pandemic. The JPMorgan Chase data are not ideal for tracking everyone, however; the unbanked are of course not included in these data and thus the data may exclude families with some of the lowest incomes in the population. See www.jpmorganchase.com/institute/research/household-income-spending.
2.3. PROPOSAL FOR A NEW “PRINCIPAL POVERTY MEASURE”
Multiple data sources and statistics are required to inform the full range of questions that arise regarding a population’s wellbeing and the policies designed to improve it. The OPM and the SPM are the two most prominent poverty measures in the United States. Although government safety net programs are not directed to use the OPM to establish eligibility criteria, almost two dozen federal programs (including Medicaid, WIC, NSLP, and Head Start) use a close variant of the OPM thresholds—the federal poverty guidelines—together with the OPM money income definition of resources, for this purpose.29 However, recognizing that the official poverty thresholds/guidelines are not updated to reflect changes in societal standards, Medicaid, WIC, and NSLP accord eligibility to families with incomes higher than thresholds/guidelines—as much as 150 percent higher for WIC, 185 percent higher for NSLP, and even 300 percent higher, in the case of Medicaid. This use of the OPM, while in no way endorsed in the U.S. Office of Management and Budget Statistical Policy Directive No. 14 (see Box 2-1, last paragraph), is criticized by groups that recommend the replacement of the OPM with a statistic more fit for this purpose (e.g., NRC, 1995).
___________________
29 The federal poverty guidelines, issued each year by the Assistant Secretary for Planning and Evaluation, U.S. Department of Health and Human Services, represent a modification of the OPM thresholds using a simple equivalence scale. See Congressional Research Service (2015) for a complete inventory of federal low-income support programs and their eligibility criteria.
Development of the SPM was motivated by the need of policy and research for a statistic that could more comprehensively incorporate information about household resources and that could also track and assess the impact of various sources of market and nonmarket income on poverty. Notwithstanding this compelling statistical motivation, the SPM was not intended for—and is not specifically designed for—establishing program eligibility; nor is the OPM, as noted in Box 2-1.30 Indeed, the OPM is outdated even for administrative purposes. The thresholds/guidelines are based on a 1955 survey at a time when food represented a larger portion of most family budgets than it does now.
The next iteration of the SPM, as specified in this report—and to which, because its role in economic statistics extends well beyond a “supplemental” one, will be referred to as the Principal Poverty Measure (PPM)—will continue to perform the essential statistical function of tracking the effects of public policies and programs on populations living in poverty. This function requires comprehensively accounting for all resources available to households, including government taxes and transfers, to compare with the cost of meeting basic needs. Due to the importance of this function, and because it is published by a federal statistical agency, the headline (flagship) measure should be the more comprehensive PPM, as opposed to the OPM. As such, the PPM is the poverty statistic that should feature most prominently in Census Bureau publications and announcements. While the language in OMB’s Statistical Policy Directive No. 14 is ambiguous, it appears that the Census Bureau could simply shift the emphasis in the way the OPM and PPM feature in its P-60 reports.31
RECOMMENDATION 2.1: Due to its vital role in tracking the effects of public policies and programs on the size and composition of the population living in or near poverty, and its resulting status as the preferred measure of many researchers and policy makers, the Supplemental Poverty Measure should be elevated to the nation’s headline poverty statistic and renamed accordingly (e.g., to the Principal Poverty Measure).
Changing the nomenclature from SPM to PPM will underscore its elevation in Census Bureau publications and, overall, help to provide clarity to users. The current OPM could become the Basic Poverty Measure, or Basic Income Poverty Measure. The various alternative constructs of the PPM being developed by the Census Bureau and BLS could be referred to as Experimental Poverty Measures.
A version of the new PPM threshold estimates could be useful for some program eligibility purposes. The Census Bureau already produces versions of the SPM to examine how poverty rates change when certain income sources are added to or subtracted from resources, and similar exercises can continue with the PPM. Even if a version of PPM threshold estimates is developed that provides a picture of poverty before government tax and transfer assistance, some government agencies will benefit from maintaining their standard operating procedures, which they can only do if the Census Bureau continues producing threshold statistics using its current methods. For this reason, it would be useful for the OPM (perhaps with the new name) to remain in the P-60 as an alternative measure. It may also be useful for BLS and the Census Bureau to be provided with the resources to create consistent measures that extend back prior to the start of the SPM (or before 2014), rather than simply creating a “series break” or relying on existing poverty researchers to create the backcasts.
2.4. MODERNIZING POVERTY THRESHOLDS
Specification of basic needs as conceptualized in the proposed PPM requires periodic reexamination of changes in the population’s consumption patterns, social and economic norms, perceptions of wellbeing, and goods and
___________________
30 If thresholds alone were used, however, the SPM could be used for program eligibility in poverty guidelines established by the U.S. Department of Health and Human Services. Currently, use of the OPM for eligibility relies mainly on threshold estimates, although the resource definition varies by program. For example, some programs subtract housing costs, some exclude other income, some subtract other expenses. Programs rarely use money income as estimated in the OPM.
31 The Census Bureau has already taken significant steps in this direction. The OPM and the SPM are now presented in the same report, and much more attention is given to the SPM in the report’s analyses, including presentation of historical poverty tables.
services needed for full participation in the labor market; this reexamination must take into account changes in poverty-reduction policies as well as the information available to evaluate those policies. The recent addition of internet service as a threshold component is evidence that Census Bureau measurement experts agree with this need to update poverty statistics. A good case can be made for further expansion of threshold categories, as the basic needs of most families today extend beyond FCSUti.
Explicit inclusion of high-expenditure family budget items in the threshold equation arguably makes a poverty measure more transparent.32 Currently, major household budget items—most notably medical care and work-related needs such as childcare and commuting—are accounted for by subtracting expenditures from estimates of resources available to the SPM resource unit to cover FCSUti expenses. Basically, according to the SPM, a family is considered to be living in poverty if its income after taxes and transfers, minus work expenses, childcare, and MOOP costs, is less than the FCSUti threshold (set based on housing tenure type, geographic location, and number of children and adults in the household). However, as discussed in later chapters, the impact of receipt (or nonreceipt) of program benefits on poverty can sometimes be most accurately estimated by accounting for the need in the poverty threshold.
RECOMMENDATION 2.2: For the Principal Poverty Measure, the set of threshold categories should be expanded beyond the current food, clothing, shelter, utilities, telephone, and internet (FCSUti) to explicitly recognize that the minimum basic needs—as well as policies designed to help households meet those needs—have evolved since the establishment of the Supplemental Poverty Measure.
Although a comparatively minor point, adding categories beyond FCSUti will necessitate a change in nomenclature. This report will refer to “FCSUti plus any added categories” as the “basic bundle threshold.”
It is important to consider the potential impact that transitioning from the SPM to the PPM will have on measurement complexity. While more will be said on this matter in terms of medical care, childcare, and housing in Chapters 3–5, respectively, it is worthwhile to distinguish between conceptual complexity and data/implementation complexity. In the panel’s view, including a more comprehensive set of basic needs categories in the threshold will improve transparency because it will eliminate the necessity to explain why major needs (such as medical care and childcare) are excluded from the threshold “because they are accounted for on the resource side.” A more comprehensive accounting may also allow the threshold number on its own to represent the budget level necessary to obtain all basic needs—that is, without additional information embedded on the resource side. Furthermore, as will become apparent in later chapters, the PPM approach advanced in this report also creates more consistency with the treatment of government programs in resource estimates. For example, the current SPM does not explicitly consider the substantial government subsidies used to purchase health insurance or childcare. Conceptual advantages notwithstanding, the PPM’s more transparent approach may, in some cases, create data needs and increased estimation complexity for the Census Bureau.
2.4.1. Medical Care and Childcare
Wimer et al. (2016) argued that a better reflection of whether minimum standards of medical care and childcare are being met is among the most needed improvements in poverty measurement. In line with this assessment, Chapters 3 and 4 make the case for adding medical care and eventually childcare to the set of basic needs categories. Transportation is a potential candidate as well but, as with childcare, more research and improved data are first required. In contrast, the state of research is such that the proposed approach to medical care is currently ready to be incorporated into the PPM.
___________________
32 As noted earlier, the initial designation of “FCSU” was not intended to suggest that there are no other important basic needs. These other items are included in the 0.2 multiplier (or accounted for on the resource side), and the SPM is transparent regarding the components in this multiplier.
Medical Care
The negative impact of medical care costs on the financial wellbeing of households and the positive impact of Medicaid on pulling people out of poverty are well established (Lin et al., 2021; Creamer, 2022). Even so, the current SPM does not directly value publicly or privately provided health insurance.
RECOMMENDATION 2.3: The basic needs categories of the Principal Poverty Measure should be expanded beyond food, clothing, shelter, utilities, telephone, and internet to include medical care as a separate threshold category, represented by the cost of insurance to cover that care.
Once the cost of a basic insurance plan is added as a basic need in the PPM threshold, the value of an insurance plan provided by an employer or by the government could be added to the household’s resources in a parallel manner. The state of research into development of a health-inclusive poverty measure (HIPM), which carefully details how the threshold need and insurance resources are valued, is sufficiently advanced such that the Census Bureau could immediately begin implementing this recommendation. A detailed description of the considerations involved in making this transition—based on methods and analyses from Korenman and Remler (2016) and Korenman et al. (2019)—is presented in Chapter 3. Additionally, the Census Bureau is already well along in its research investigating the practical implications (e.g., data needs) of moving toward a health-inclusive SPM (Creamer, 2022).
Childcare
As with medical care, childcare represents a large and rapidly growing component of family budgets. Among families that pay for childcare, this expense currently represents 16 percent of direct family expenditures, making it the third-largest component after housing (29%) and transportation (18%). Of course, childcare costs are even higher, and represent a larger share of the household budget, for families with preschool-aged children.
Childcare is also receiving increased attention in the policy arena. The welfare reforms of the 1990s saw a major expansion in childcare support for working parents and parents enrolled in education, as part of a work-based safety net. Policies that support universal, educationally oriented preschool and prekindergarten to promote child development and school readiness have also greatly expanded. If the goal of the PPM is to measure the wellbeing of households and the effects that government policies have on family wellbeing, then childcare would need to be included in the threshold.
RECOMMENDATION 2.4: The Census Bureau should recognize and initiate research on how to incorporate childcare needs—which are a basic and regular expense for many families—into the Principal Poverty Measure as an explicit threshold category for families with children.
Rather than being deducted from resources as a work expense as done currently, childcare would, under the PPM, ideally be treated more analogously to other threshold categories, particularly the new medical care component. Specifically, childcare would be recognized as a basic need for families with young children. Once a basic childcare need is added as a threshold category of the PPM, childcare subsidies received would be added to estimates of a family’s resources. The (ultimate) reorganization of SPM threshold and resource components in the PPM is summarized in Table 2-1. Moving toward this ideal will require considerable time and resources. Before the Census Bureau can incorporate a methodological modification to the treatment of childcare into the PPM, more research will be needed (see Chapter 4). For potential shorter-term modifications, this research will need to investigate options for estimating the basic need for paid childcare to be included in the threshold. Other difficult topics, such as how to value unpaid care in household resources and how to define childcare needs in families that do not use paid care, are longer-term projects. While several practical steps must be completed, as described in the HIPM literature for medical care, these data and conceptual challenges are surmountable.
TABLE 2-1 Comparison of OPM, SPM (Current), and PPM (Proposed)
| Concept | Official Poverty Measure (OPM) | Supplemental Poverty Measure (SPM) | Principal Poverty Measure (PPM) |
|---|---|---|---|
| Measurement Units | Families (individuals related by birth, marriage, or adoption) or unrelated individuals | Resource units (official family definition plus any coresident unrelated children [age 15 and under], foster children, and unmarried partners and their relatives) or unrelated individuals | Households, consisting of one or more resource units of related and unrelated individuals of all ages |
| Poverty Threshold | Three times the cost of a minimum food diet in 1963 | Based on 83% of median expenditures on food, clothing, shelter, housing utilities, other utilities (telephone and internet), multiplied by 1.2; using CUs with children | Basic needs budget using share of median expenditures on food, clothing, telephone/internet (using all CUs), times a multiplier, plus housing needs based on Fair Market Rents, health insurance needs based on basic insurance, and childcare based on service costs |
| Threshold Adjustments | Vary by family size, composition, and age of householder | Vary by resource unit size, composition, and housing tenure; with geographic adjustments for differences in housing costs | Vary by household size and composition; geographic adjustments are built into housing, medical care, and childcare needs |
| Updating Thresholds | Consumer Price Index for All Urban Consumers: all items | 5-year moving average of expenditures on FCSUti, lagged 1 year and adjusted by a FCSUti CPI-U price index | Update health, housing, and childcare with available data; spending updated using 3-year moving average of expenditures on FCti lagged 1 year and adjusted by a FCti CPI-U price index |
| Resource Measure | Gross before-tax regular cash income | Sum of cash income, plus noncash benefits that resource units can use to meet their FCSUti needs, minus tax payments net of refundable tax credits, work expenses, childcare expenses, nonpremium MOOP expenses, and child support paid to another household | Sum of cash income plus noncash benefits that households can use to meet their FCti needs, plus childcare subsidies, health insurance benefits and subsidies, and imputed rental income flow for homeowners; minus tax payments net of refundable tax credits, work expenses, nonpremium MOOP expenses, homeowner costs, and child support paid to another household |
SOURCE: Extended from Fox (2020).
Implementation
As indicated above, construction of the PPM will require substantial modifications to current SPM methods, particularly in the handling of medical care, housing, and potentially childcare. Appendix 2A summarizes, algebraically, how the two measures differ. Medical care and childcare are not ignored in the current SPM but, as depicted in the equations in Appendix 2A, these expenditures are not represented in the set of threshold needs; rather, MOOP expenses and out-of-pocket childcare are incorporated indirectly as subtractions from resources. For the ideal PPM (Equations 2.3, 2.4, and 2.5 in Appendix 2A), medical care (represented by a basic health insurance plan) and childcare explicitly appear as threshold needs.33 Subtracting these costs from resources is conceptually equivalent to increasing the thresholds for each individual household. While shifting aspects of the calculation from the resource side to the threshold side will raise threshold levels, other features of medical care and childcare revisions (such as adding health insurance benefits and childcare subsidies to estimates of households’ resources) mean that, on balance, these modifications to the SPM will not necessarily change measured poverty rates.34 However, these modifications are needed to show the impact of medical benefits and transfers on poverty.
___________________
33 This respecification of the threshold reflects the presumption that the barriers to including childcare, discussed in Chapter 4, can be overcome.
34 The rationale for incorporating housing into the threshold using Fair Market Rents is discussed later in this chapter and explained in detail in Chapter 5.
In both the SPM and the PPM, households experience poverty if the value of their calculated resources is less than that estimated for the threshold. Since some items (e.g., the basic health insurance plan; see Chapter 3) are included on both sides of the inequality, poverty status will be the same for family units with no out-of-pocket costs for housing and medical care under both the SPM and the PPM. For example, for renters with health insurance and a standard childcare expense, the PPM inequality is similar to the SPM inequality. Hence, even though the new PPM threshold will be higher than the SPM threshold, after adjusting for the differing treatment of resources, there will be no difference in poverty status in these cases. Family units that do not have sufficient health insurance or childcare subsidies, or that have substantial housing maintenance expenses, will be those most likely to experience poverty as measured by the PPM but not the SPM.
As an additional consideration, expanding the basic bundle threshold categories will impact the application of equivalence scales in the PPM and, potentially, the size of the threshold multiplier. The panel suggests that the Census Bureau reexamine the equivalence scales to reflect the respecification of the basic bundle—which, instead of applying to FCSUti as it currently does in the SPM, would apply to FCti (food, clothing, and telephone/internet) in the PPM (see Chapter 6). Similarly, changing the FCSUti to the “basic bundle threshold” will directly impact the contents of the catch-all multiplier, currently set at 0.2, which means that the multiplier will need to be updated to reflect the new specification.
Given the recommendations above, the threshold multiplier could be recalculated based on the new FCti bundle, and adjusted to account for new spending needs beyond those considered in the National Academies’ 1995 report (NRC, 1995). Originally, these needs included personal care, household supplies, education, reading, and nonwork-related transportation costs (50% of total transportation costs). Murphy et al. (2022) suggest that nonwork transportation needs differ for metropolitan and nonmetropolitan area households and could be higher than the costs used in 1995 calculations. The 1995 report recommended a multiplier between 15 and 25 percent. At that time, BLS and the Census Bureau decided to use the average of the recommendations—both for the share of the median (between 78% and 83% of the median) and the multiplier. More recent spending patterns may suggest a larger multiplier.
RECOMMENDATION 2.5: The Census Bureau and Bureau of Labor Statistics should conduct a review of the basis for the 20-percent multiplier. This review should include:
- Assessing whether a multiplier set at a different level better matches current spending patterns on the basket of goods currently included in the Supplemental Poverty Measure threshold;
- Evaluating the spending categories included in the threshold multiplier, specifically whether transportation should be a larger share and should vary by metropolitan and nonmetropolitan residence status;
- Recalculating the multiplier based on the new basic needs bundle; and
- Developing a plan for updating the multiplier for future changes in spending patterns.
The PPM threshold concept recommended by the panel involves a widened set of calculations for a larger number of components than exists in the current SPM, with implications for the multiplier for “a little more” and for the equivalence scale used to estimate comparable needs for families of various sizes and compositions. The end result should be a set of thresholds that more accurately reflect families’ differing needs for basic levels of food, clothing, housing, medical care, childcare, and other necessities in contemporary America.
2.4.2. Other Basic Needs?
In the future, other basic needs categories could be considered for explicit inclusion in the PPM threshold bundle, as opposed to being handled in the multiplier or exclusively on the resource estimate side. Transportation is an obvious candidate for explicit inclusion given its prominence in household expenditures, although additional methodological research and data development would be needed. In the current SPM, commuting costs are treated like childcare—they are subtracted from income/resources using a flat weekly deduction applied
SOURCE: Panel calculated using published Consumer Expenditure Survey crosstab tables (www.bls.gov/cex/tables.htm).
to all individuals based on the number of weeks of the year they worked, as reported in the CPS-ASEC. The deduction is calculated from Survey of Income and Program Participation (SIPP) data on commuting expenses and other miscellaneous work expenses. Nonwork-related transportation is currently included in the 20 percent multiplier added to FCSUti.
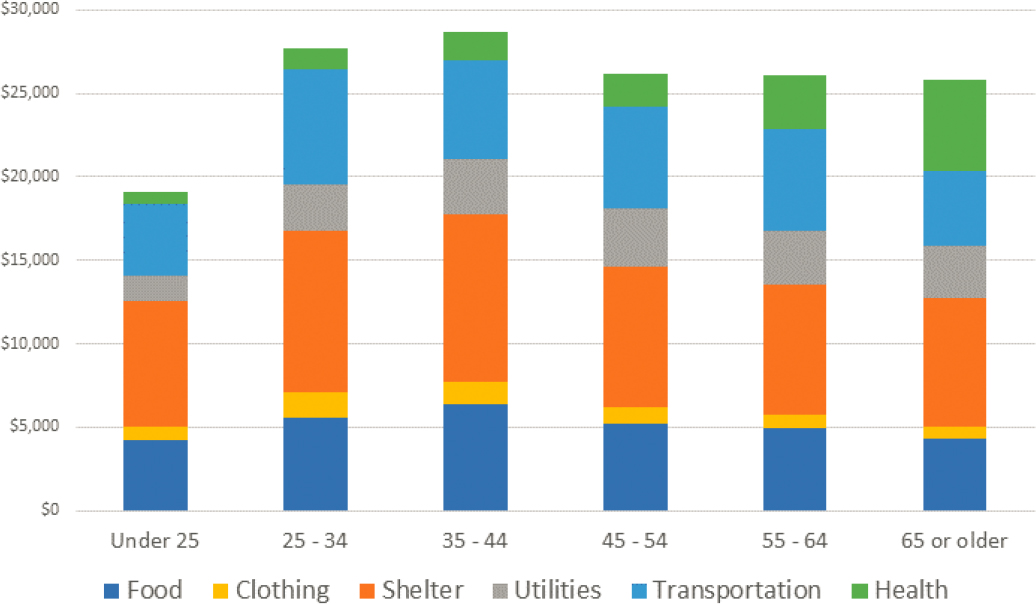
There are two relevant considerations related to treating transportation as a separate expenditure/budget category in the PPM bundle. First, as illustrated in Figure 2-2, transportation represents a much higher share of consumers’ expenditures than does clothing, which would argue for its inclusion as a separate category. Second, it is logical to distinguish between work- and nonwork-related transportation. People who do not work may, on average, have lower transportation costs, but the same is true for people who do not have to take their children to school every day.35
Additionally, families face money and time tradeoffs between housing and commuting—as illustrated by inexpensive but time-intensive options such as walking and biking—which may be captured by adding transportation as an explicit category of the threshold. To improve the accuracy of the PPM, variation in transportation costs faced by families across geographic locations, and across housing and job situations, could one day be
___________________
35 Murphy et al. 2022 find that commutes represent only a small proportion of total travel. The CE previously asked separate questions about work and nonwork transportation, but these questions are now combined.
incorporated. The Census Bureau is already conducting relevant research;36 and, while it is too early to incorporate this nascent research into the PPM, results already highlight the importance of transportation costs on families’ financial wellbeing.37
2.4.3. Alternatives to an Exclusively Expenditure-Based Approach to Thresholds
The method for estimating current SPM thresholds—the minimum level of resources required to cover basic needs—is primarily based on expenditures as reported in the CE. However, even the current approach is a hybrid of sorts, in that it relies on expert judgment in some important respects. For example, the appropriate subset of CE consumer units on which estimates are based must be determined, as well as the percentage of average expenditures chosen to represent basic needs levels. For housing, the method of establishing separate thresholds for renters and homeowners is also the byproduct of expert deliberations. The National Academies’ report Measuring Poverty: A New Approach (NRC, 1995) acknowledged expert judgment as an inherent characteristic of poverty measurement, stating “although judgment enters into nearly all aspects of the poverty measure—from how to value in-kind benefits to how to specify the particular form of an equivalence scale—questions of the threshold concept and level are more inherently matters of judgment than other aspects of a poverty measure” (p. 99). The report goes on to discuss concepts underlying expert budgets, relative thresholds, subjective thresholds, and other characteristics. The subjective elements of poverty measurement allow room for a wide range of statistical constructs; various countries, states, and cities have developed significantly different approaches. As just one example, New York City’s Center of Economic Opportunity reports that their alternative poverty threshold—which is grounded in analyses of the Self Sufficiency Standard and income adequacy developed by the Center for Women’s Welfare at the University of Washington—was about 127 percent greater than that of the SPM in 2018.38 In a process so dependent on judgment, the criteria for an authoritative poverty measure described above—consistency, transparency, and operationally feasibility—become crucial.
Incorporating a medical care need into PPM thresholds—as recommended above and detailed in Chapter 3—moves the approach further toward a hybrid model wherein a mix of survey-reported spending levels and nonsurvey information is used to estimate and set the cost of basic needs. The proposed PPM would reflect the cost of a basic health insurance plan in the threshold (see Chapter 3). For people with insurance benefits from an employer or the government, the value of the basic plan (adjusted for some types of premium expenditures) would be added to household resources. (As noted earlier, for those with health insurance plans from employers or the government, there would be no change in poverty status if less than the capped amount is spent on premiums and cost sharing.) For those without insurance or with direct-purchase insurance, the basic plan value is not included on the resource side, but any health insurance subsidy is included. The availability of community-rated premiums for benchmark plans from Affordable Care Act (ACA) Marketplaces enables the determination of each household’s health insurance need (in dollars), which is required for this revision of the PPM threshold. Thus, even though most threshold categories in the current SPM are calculated based on CE-reported values, medical care need would rely on market information and expert judgment about which insurance plan(s) should serve as the benchmark. It is worth noting that, by introducing medical care based on the ACA Silver plan, and possibly childcare—based on something like Child Care and Development Fund reimbursement rates—into the threshold, the PPM threshold will be estimated in part using programmatic changes and not directly linked to changes in the distribution of the population’s actual reported expenditures. As such, the hybrid methodology of the PPM could be viewed as less quasi-relative than the current SPM. The panel favors applying this hybrid approach on a case-by-case basis when the accuracy versus (methodological/data) consistency and complexity tradeoffs warrant it. While the bar should be
___________________
36 In his presentation to the panel, Burrows (2022) reported on research showing meaningful geographic variation in transportation costs. He also discussed pros and cons of various data sources (American Housing Survey, ACS, SIPP) that could be used to estimate commuting costs.
37 The Center for Neighborhood Technology has a tool to estimate local transportation expenses, which could be used to develop the poverty threshold (www.htaindex.cnt.org/). A growing body of research (e.g., Murphy et al., 2022) covers transportation insecurity and its correlation with poverty status, which could help justify accounting for transportation expenses in the poverty threshold rather than including them in the multiplier.
38 See www.fpwa.org/wp-content/uploads/2021/03/NY2021_SSS.pdf.
set high for approving a methodological shift of this kind—that is, for switching estimation of a threshold category away from the expenditure basis—the panel’s assessment is that medical care clearly meets the necessary criteria in terms of methodological development and data needs.
RECOMMENDATION 2.6: Due to both conceptual and data problems, the current Supplemental Poverty Measure approach that relies on subtracting medical out-of-pocket expenditures from resources does not adequately capture the medical care needs for most people. The current expenditure-based model should therefore be replaced by a cost-of-insurance approach, which comes closer to reflecting the basic needs of households.
It is reasonable to question whether increasing the methodological diversity in the way thresholds are established for specific needs categories might negatively affect PPM transparency. However, due to the paramount importance of accuracy, the cost-benefit assessment would also do well to consider problems with setting thresholds based on expenditure data, as currently practiced, and with defining a household’s “need” implicitly (via an expenditure subtraction from resources) as the amount the household spends on a good or service. Critics argue that this approach is logically flawed, in that it fails completely to identify unmet need, which is particularly glaring in the cases of childcare and medical care (e.g., Korenman and Remler, 2016). In some cases, using data on expenditures as in the SPM can embed the shortcoming that unmet needs—for example, for childcare or medical care—go unrecognized in the poverty measure threshold.
It should also be noted that the proposed PPM approach to establishing need is based on a low-cost plan available to a household of a particular age composition in a particular residential location. This approach reflects social norms embedded in policies regarding the meaning of “basic care.” The ACA defines essential care that must be covered by insurance; the ACA was designed to make insurance covering basic care affordable and accessible through either Medicaid or ACA premium subsidies for the purchase of a benchmark Marketplace plan. This makes the conceptual underpinnings of the HIPM basic need somewhat different from the expert judgment described in the National Academies’ 1995 report (NRC, 1995).
Including medical care need in the PPM as described above suggests a possible alternative estimation method for other needs categories, such as childcare or housing. As detailed in Chapter 4, the proposed PPM approach to the treatment of childcare includes basic-level costs on the threshold side. These costs could be approximated based on consumer expenditures; alternatively, if appropriate levels could be determined, a basic need for childcare could be used. One possibility could be based on market rate surveys conducted by each state as part of the Child Care and Development Fund—a federal program that helps low-income families obtain childcare so that they can work, seek education, or participate in training (see Chapter 4). As noted above, in either case, childcare subsidies, and possibly the value of various types of “free” childcare, would need to be accounted for in PPM household resource estimates.39
In addition to medical care and childcare, the method for obtaining the threshold cost of a basic unit of shelter should also be revisited. Currently, the housing portion of the FCSUti threshold is calculated using data from the CE. However, as developed in Chapter 5, a method based on the use of Fair Market Rents (FMRs), established by the U.S. Department of Housing and Urban Development for the housing choice voucher program, provides an alternative. FMRs are designed to capture the cost to rent a moderately priced, standard-quality dwelling unit in the local housing market. As with ACA insurance plans, it is an attractive feature that FMRs are linked to policy—e.g., subsidy caps for housing choice voucher recipients—in a way that reflects the cost of renting a basic (standard) housing unit in a given area.
For the foreseeable future, other elements of the PPM threshold—most notably the food component—will continue to be estimated based on survey estimates of expenditures. However, alternatives are worth exploring. There are no major conceptual difficulties with the current approach for estimating food expenditures based on actual budgets which, in some ways, makes the proposition for methodological revision less compelling than for the cases of medical care or childcare. Nonetheless, the Census Bureau could consider estimating the “F” in “FCSU”
___________________
39 The proposed PPM would ideally subtract net childcare costs from resources—the actual price minus any subsidy received by the family.
based on the U.S. Department of Agriculture’s (USDA’s) Thrifty Food Plan (TFP),40 for example. One advantage of this option is that it would create consistency with the proposed PPM approach to housing, health insurance, and childcare in that the TFP (like FMRs, the ACA benchmark plan, and federal childcare reimbursement rates) is established by the government and updated regularly.41 While the construction of the TFP is complex in practice, as a matter of interpretation the TFP is transparent in the sense that it indicates how much it would cost, based on observed food prices, for a household of a given size to eat a minimally nutritive diet on a low-income budget. The TFP also is available for various types of families (including gender and age of children), which helps to determine appropriate equivalence scales. The recently reevaluated TFP addresses many shortcomings of the previous TFP, reflecting the food consumption patterns of a broader set of Americans and taking some time-saving substitutions of prepared foods into account.42
While using the TFP to represent food needs for PPM thresholds is appealing due to its consistency with the approaches for measuring housing, health insurance, and childcare needs, there are potential drawbacks to this approach. Unlike the other needs-based approaches, the cost of the TFP is the same across the 48 contiguous states, and the only region-specific plans are for Alaska and Hawaii. (USDA is currently updating the TFPs for food costs and consumption patterns that differ in these two states.) Also, the TFP is based only on “at-home” food consumption, not foods purchased and consumed from restaurants or eating places—which account for roughly half of all food expenditures in the United States43—although the share is smaller for lower-income households (Saksena et al., 2018). The TFP uses the food consumption patterns and food prices for a sample of households with incomes below 350 percent of federal poverty levels. The current food portion of the FCSU is based on the food consumption patterns of a nationally representative sample and includes food expenditures from all food sources.
Further research could assess these tradeoffs in methods of accounting for food needs in a threshold. This research could compare the current thresholds to the revised TFP and potentially to the USDA’s Low- or Moderate-Cost Food Plans. The USDA’s Low-Cost Food Plan is used in the Economic Policy Institute’s Family Budget Calculator, which does not add money for food eaten outside the home.44 Currently, the complication of food eaten at home versus away is one issue that could complicate using the TFP in the PPM threshold. A potential way to address the critique that the TFP does not consider food from all sources (and thus does not completely represent common consumption patterns) would be to apply a multiplier to TFP levels to allow for slightly great costs.
2.5. ALTERNATIVE CONCEPTS OF RESOURCES
Respecification of the basic bundle threshold will necessitate updating the method of estimating household resources. Alternative conceptual frameworks for estimating resources available to households and families have been considered for poverty measurement. One contrasting characteristic of the various frameworks is their treatment of assets and debt, which may accumulate over very long periods of time and which can impact the ability of households to meet basic needs in the short run. For example, access to assets may allow a family to cover purchases of large-ticket items, particularly if the expenses are extraordinary and unexpected. Assets can help households to smooth consumption when income is erratic. Conversely, debt—perhaps most notably credit card debt—constrains the capacity of low-income families to cover their current basic expenditures (Fitzgerald and Moffit, 2022). For these reasons, multi-period resource measures that include assets (and their liquidity) and debts are important for understanding chronic poverty or intergenerational poverty.
___________________
40 The TFP estimates the cost of food needs for a representative family, balancing nutritional guidelines, caloric needs, and some food consumption patterns at a budget, or low-cost, level. The TFP is used as the base for setting SNAP maximum benefit levels. The TFP assumes food is prepared at home (as opposed to purchased at a restaurant or food service venue) and does not consider the time costs of preparing food (Ziliak, 2016).
41 The TFP is now updated every 5 years as specified by the Agricultural Improvement Act of 2018 (P.L. 115-334), www.ers.usda.gov/agriculture-improvement-act-of-2018-highlights-and-implications/.
42 See www.fns-prod.azureedge.us/sites/default/files/resource-files/TFP2021.pdf.
43 See www.ers.usda.gov/data-products/chart-gallery/gallery/chart-detail/?chartId=104043.
While these arguments are sound, this panel agrees with the recommendation of the National Academies’ 1995 panel not to expand the resource bundle to include additional assets and debts (NRC, 1995)—at least not for the flagship poverty measure. This decision was based mainly on issues of transparency and feasibility. More research is needed to establish whether the increased complexity of data collection required to expand the scope of the PPM in this way can be justified, and whether the accuracy of available asset data is sufficient. Moreover, there is little evidence that families with low incomes have sufficient capital gains (realized or unrealized) and savings to allow income smoothing to an extent necessary to impact the PPM. Among older people with low incomes, retirement savings and home equity are possible exceptions. Indeed, the CPS-ASEC, and therefore the current SPM, already captures retirement income (in the form of lump-sum payments) in addition to annuities.
These questions about treatment of assets and debt are important ones—particularly as they relate to the duration of family episodes in poverty—and they are worthy of attention in a longer-term, aspirational measurement program, perhaps for an experimental statistic. Fitzgerald and Moffit (2022) provide an example of this kind of research with their Supplemental Expenditure Poverty Measure, which uses BLS data supplemented with bank and credit card information to generate estimates of the actual and potential spending power available to households.
Research that comprehensively seeks to measure the intertemporal role of assets and debt in families with low incomes would also be valuable for understanding population flows into and out of poverty (within and across years). Such research would also be useful for studying the risk of experiencing material deprivation. The Census Bureau could perform research on measures of assets and debt that would, for example, elucidate hardships related to education loans, a topic currently of great interest to policy makers. The SPM and the OPM do not consider education loans as income, either as an addition when received or a subtraction when repaid.45
Using data from their Consumer Credit Panel, a recent report by the Federal Reserve Bank of New York (Mills et al., 2022) found that “Americans residing in low-income areas hold auto and student loan balances comparable to those residing in wealthier areas” (p. 2). This translates into considerably higher nonhousing debt-to-income ratios among low-income borrowers. Research could also tackle conceptual questions about treatment of interest payments. For example, should interest paid on certain categories of debt (e.g., medical, credit cards) be subtracted from income/resources? What about legal debt or child support debt—how can these forms of debt be consistently treated? Also, some debts, such as child support owed, may not always accrue interest but may be binding in terms of payment (i.e., wage garnishing).46 These questions suggest the need for a well-reasoned guiding principle regarding the types of assets and debts that should be included for resource estimates in an experimental poverty measure. Regularity of flows is one principle; the EITC would conform to this principle, albeit with a 1-year lag.
For its new poverty measure, the UK Social Metrics Commission (2020) concluded that assets that can be freely liquidated into cash should be included as an available resource, on the same weekly basis as income—by dividing the stock of assets by 52, to reflect the number of weeks in a year. Similarly, in the Commission’s view, obligated debt repayments should be considered an inescapable cost that reduces the overall level of a family’s available resources.47 However, practical data constraints also shape the scope of a poverty measure—a reality not lost on the Commission. Although the Commission had a comparatively broad view of which categories of debts and assets would ideally be included, data were not always of a level that allowed those inclusions, and the Commission strongly recommended updating the data infrastructure to allow robust measures to be added in the future.
___________________
45 The OPM and the SPM do include educational subsides and scholarships; the CPS-ASEC explicitly excludes loans.
46 Some states do allow for interest on child support arrears. Child support obtained through wage garnishing is already included in the SPM—assuming the person who pays the child support reports it as a payment in the CPS-ASEC, and the person who receives the child support reports it as income.
47 An overview of the UK Social Metrics Commission treatment of assets and debt in the determination of resources available for a new experimental poverty measure was provided in a presentation to the panel (Joyce, 2022).
2.6. UNIT OF ANALYSIS
2.6.1. Grouping Concepts/Definitions
In estimating a poverty measure, the total amount of resources and threshold needs hinges on the unit of analysis, which is defined as the group of “people whose economic resources are to be pooled in determining poverty status” (NRC, 1995, p. 301). The resource unit of the current SPM differs somewhat from other units commonly used in economic statistics such as consumer units (CUs), households, families, and individuals. The SPM resource unit is broader than the OPM resource unit—among other differences, the SPM’s single-family unit includes cohabitating partners and their children, as well as foster children.48 In addition, as discussed below, the SPM resource unit differs slightly from the CU in the CE used to calculate the thresholds.
The conceptually ideal measurement unit hinges on the extent and characteristics of resource sharing in the “household”—that is, how household members pool economic resources to meet their material needs as a unit. In some cases, the precise breakdown is less important. For example, as discussed in Chapter 3, incorporating health insurance into the PPM requires using CPS-ASEC information on health insurance coverage to form health insurance-sharing units. As demonstrated by Korenman et al. (2019), these (sometimes smaller) subunits can be aggregated up to the SPM resource unit to construct a HIPM based on the SPM resource unit.
Although more research on resource sharing is needed, relevant insights have already been gleaned in the literature. Short and Smeeding (2005), for example, used data from the SIPP to compare the SPM resource unit of analysis with that of the CE CU. They showed that cohabiting couples met the criteria established by the CE for CUs, defined as a family (related by blood, marriage, cohabitation, or adoption) or two or more individuals who share at least two of three major expenses: housing, food, or other living expenses. This important finding supported the use of the CE to estimate thresholds for the SPM (Provencher, 2011).
The poverty rates of people living in cohabitating families (particularly children) are the most affected by the differing unit definitions used by the OPM and the SPM. Studies by Bauman (1999), Carlson and Danziger (1999), Iceland (2000), and Short (2009) evaluated how the potential to share resources affects consumer behavior, such as decisions about housing arrangements. Mykyta and Macartney (2012) showed that the number of shared households in the United States increased by 11.4 percent between 2007 and 2010—the period that included the housing market crash and subsequent recession. Sharing residences lowered official poverty rates through the pooling of resources.49
2.6.2. Consumer Units versus Household Units
In revisiting the unit of analysis issue, the central question facing the Census Bureau is whether to maintain the current SPM approach or to switch to the household and to include additional unrelated people therein. Such a respecification offers several advantages. First, most international statistical organizations use the household as the poverty unit; this practice is also recommended by the Canberra Handbook on Household Income (UNECE, 2011). Second, the household is a more intuitive concept, improving transparency, and is more straightforward to implement across surveys (e.g., in the ACS). However, as mentioned above, the CE uses a CU to construct its thresholds which, as detailed in Chapter 6, complicates the construction of a household threshold. This is because about 3 percent of households contain multiple CUs—that is, those that do not share expenses for two of the categories of food, housing, and other goods—and the CE only collects data from one CU per household. In 2020, 4.3 percent of households had more than one SPM resource unit, and almost three-quarters of those were households with two SPM resource units. Similarly, in the CE in 2017, 2.5 percent of CUs were in multi-CU households; about half of those consisted of two CUs in the household, and 88 percent of the CUs were single-person CUs. Of the
___________________
48 The SPM followed the recommendation in NRC (1995) that the definition of the poverty measurement unit be broadened to include cohabitating couples and their children. That panel further recommended that additional research be conducted on the extent to which roommates and other household and family members share resources, in an effort to determine if the unit of analysis should be modified further.
49 The authors define a shared household as a household containing at least one resident adult who is not a student, spouse, or partner of the householder. In 2010, shared households accounted for 18.7 percent of all U.S. households.
CUs with children, only 0.4 percent were multi-CU households and, hence, using the household would have had a minimal impact on the SPM thresholds. For the PPM, however, all CUs (including singles) would be included in the household. One could assume that the other CUs in the household are the same single CUs, and hence adjust the total spending on food and clothing (which have fewer economies of scale than housing), which would likely have minimal impact on the median. In addition, the thresholds implicit in the FMR and the equivalence scale for FCti may need to be examined when there are other CUs in the household. Including unrelated individuals age 15–17 in the PPM unit will also bring the unit closer to the household concept.
In selecting the unit of analysis, the main issue is whether poverty is best reflected in multi-SPM units using a measure that pools their resources or one that separately calculates their resources. In 2020, the poverty rate was 9.1 percent. However, the poverty rate for people living in single-SPM households was 8.4 percent, and the poverty rates for people living in multi-member SPM households were much higher—21 percent for two-member households and 31 percent for 3-member households. Although only a small share of the population lives in multi-SPM households, these groups experience much higher poverty rates than the general population. A likely reason for this observation is that SPM units in multiple-unit households have low incomes, so they double up and share to economize on housing. This does not necessarily mean that these SPM units share resources other than housing.
Combining multi-household SPM units into household units may decrease the poverty rate. Perhaps the target measure of poverty is somewhere between the current measure and a household-based one; hence, additional research is needed to evaluate the economic deprivation faced by multi-SPM households, and whether they share resources and costs. This information becomes even more important for the proposed PPM, which may reflect a variety of arrangements within PPM units for sharing resources (such as housing and, in some cases, childcare).
RECOMMENDATION 2.7: The Bureau of Labor Statistics (BLS) and the Census Bureau should move toward using the household as the Principal Poverty Measure (PPM) unit. These agencies should study the impacts on measured poverty for people living in multi-PPM units, and BLS should determine the appropriate methods to calculate thresholds at the household level, including the possibility of using only single-consumer unit households in the estimation of FCti (food, clothing, and telephone/internet).
While additional research is needed to support expanding the current SPM resource unit to the entire household, the panel recommends that additional household members be included in the SPM resource unit. Currently, an SPM resource unit includes all related family members within a household plus resident cohabitors, unrelated children under age 15, and foster children under age 22. Unrelated adults are considered a separate SPM resource unit, as are unrelated children age 15–18. Since the CPS-ASEC collects income information for every household member age 15 and older, the poverty status of these older unrelated children can, in principle, be determined. However, when these children live in multi-SPM households, they likely share income and expenditures with the other SPM resource units. Given the inclusion of foster children over the age of 15, other categories of unrelated children should ideally be treated in a parallel fashion. Research should involve exploring various equivalence scales for multi-PPM households.
The Census Bureau could also research how a range of family or household arrangements (e.g., educational situations in which older children stay in school longer and live at home) might affect the status of individuals who potentially share resources within the SPM/PPM unit. Additionally, social programs differ in the age cutoffs used for determining the eligibility of young adults (e.g., health insurance for children under 26; EITC for full-time students up to age 23), which might dictate that a higher age threshold would more accurately capture these resource impacts.


