
6
Data and Statistical Issues
For a poverty measure to be most useful for policy, research, and public understanding, relevant, accurate, and timely data with geographic and demographic detail are needed. This chapter considers the adequacy of available data—from surveys, administrative records, and other sources—to support the panel’s recommended revisions to the Supplemental Poverty Measure (SPM). For reasons explained in Chapter 2, this report calls the updated SPM the Principal Poverty Measure (PPM). This chapter reviews the strengths and shortcomings of the current data infrastructure and the value of investing in that infrastructure; identifies additional data needs created by the new PPM specifications; examines opportunities for improving relevant data sources for the PPM; and discusses statistical issues in estimating the PPM thresholds and resources. Appendix 6A lists the data elements available for estimating thresholds for the current SPM and the new PPM from the Consumer Expenditure Survey (CE);1 Appendix 6B similarly lists the availability of data elements for estimating resources from the Current Population Survey Annual Social and Economic Supplement (CPS-ASEC) and the American Community Survey (ACS).
6.1. THE NEED FOR AND BENEFITS OF IMPROVING THE DATA INFRASTRUCTURE
Data needs for estimating thresholds and resources for the current SPM are orders of magnitude greater than for the Official Poverty Measure (OPM). The OPM thresholds were set in the 1960s and last revised in 1978, and only require an annual inflation adjustment, based on the Consumer Price Index (CPI).2 For resources, the OPM requires estimates of pretax money income, data that are not always easy to collect but have been readily available in surveys beginning with the income supplement to the CPS in 1948. The tradeoff for this relative simplicity is that the OPM does not appropriately capture the economic circumstances of many American households. For example, it does not account for the portion of earnings unavailable to workers’ households because it is spent on taxes and various work expenses, and it does not include some essential resources available to households, such as in-kind transfers.
The recommendations in a 1995 National Academies of Sciences, Engineering, and Medicine report that led to the SPM (NRC, 1995) added substantially to the data requirements for estimating poverty thresholds and
___________________
1 References to the CE are to the Interview Survey, unless otherwise noted.
2 As documented in National Academies (2022), and in many other review articles, the CPI has its own complex and challenging issues.
resources, and the current panel’s revisions recommend a few more. In response to the National Academies’ 1995 report, the Census Bureau added content to the CPS-ASEC. Recently, to supplement CE data, the Bureau of Labor Statistics (BLS) began imputating in-kind benefits for use in the estimation of SPM thresholds. Yet the current data infrastructure is not ideal even for the OPM, let alone the current SPM and recommended PPM. Significant improvements are needed to advance the accuracy and detail of data underlying poverty measurement.
As the methodology underlying the SPM is periodically updated to keep pace with changes in economic conditions, social norms, and the policy environment, the data infrastructure must likewise be modified to respond to challenges and leverage opportunities. In recent decades, economic statistics, whether produced by government or private-sector organizations, are being constructed from an ever-widening range of data sources. This “modernization” of statistics has accelerated in response to both decreased sustainability of data collection rooted in the 20th-century survey paradigm and the rise of alternative data sources.3
The move toward a multiple-data-source approach in the reengineering of key economic statistics is already well under way among federal statistical agencies and elsewhere. Use of satellite imagery to improve crop estimates (National Academies, 2017), use of transactions data to create high-frequency and high-detail geographic measures of consumer spending (Aladangady et al., 2022), and use of payroll data to produce employment statistics (Cajner et al., 2019) are just a few examples. Perhaps the most prominent example of this trend is in price measurement—statistical offices around the world are modernizing CPIs through use of alternative data sources, including point-of-sale and household-based scanner data, credit card payment information, web-scraped prices, and insurance claims data.4 Beyond government agencies, the Billion Prices Project, a joint initiative between Massachusetts Institute of Technology and Harvard University, has demonstrated the value of high-frequency price data collection to macroeconomic research—in this case, from hundreds of online retailers based in more than 70 countries.5 The SPM is already a “multiple-data-source” statistic, as it draws from several surveys (the CPS-ASEC, CE, Survey of Income and Program Participation [SIPP], and ACS) and, if guidance from this report is followed, will also incorporate information on Fair Market Rents (housing), Affordable Care Act (ACA) health plans (medical care), and possibly childcare reimbursement rates.
The real potential of alternative data—whether obtained by new types of surveys, greater use of administrative records, or tapping into commercial sources—is the capacity to generate more accurate, timely, and disaggregated estimates. In poverty measurement, as discussed in Chapter 2, researchers and policy makers clearly need more granular information for assessing differential wellbeing at substate—e.g., county, rural/urban, community-level—geographic areas. As the major driver of cross-area cost-of-living differences, geographic detail is especially important for revealing the high variation in rental and home prices across and within regions (Guerrieri et al., 2013).6 In the price-measurement context, a report by the National Academies (2022) describes how commercial data (e.g., from property management companies, which have access to rental data on millions of multifamily rental units) can be used to expand and increase the detail of BLS’s information on rent changes. Similarly, for poverty measurement, such data sources could be used to estimate rental-price differentials within a state’s nonmetropolitan areas, which are currently treated homogenously in the SPM.
The benefits of investing in the PPM data infrastructure extend well beyond improving the usefulness of the nation’s key poverty statistics. More accurate measurement of income and other resources will improve research on the effectiveness of anti poverty assistance programs and a range of other policies (e.g., increases
___________________
3 National Academies (2017) and Abraham (2022) are two of the many sources documenting fundamental changes that have occurred to the survey-centric foundation of federal statistics over the last decade or so. Paramount among these changes are the increasing costs of traditional modes of data collection and, relatedly, declining response rates. These trends have created a situation in which growing demands for more timely and detailed information (e.g., at state and local levels) cannot always be met.
4 National Academies (2022) provides an in-depth assessment—along with a series of recommendations to BLS—for expanding use of multiple data sources in the CPI to keep up with rapidly changing market conditions and consumer behavior patterns.
5 As documented in National Academies (2022), a number of statistical offices in the United States and elsewhere are collaborating with scholars from the Billion Prices Project (www.thebillionpricesproject.com/) and commercial data firms to advance price-measurement methods.
6 Research by Diamond and Moretti (2021) and Howard and Liebersohn (2021) is indicative of the growing interest in geographic variation in the price of housing.
in the minimum wage). For many purposes, establishing the source—not just the amount—of income and other resources is important. Data on income, other household resources, and expenditures that factor into the PPM are also important in the broader production of economic statistics and analyses of income and consumption inequality in the population.
The data ecosystem has changed considerably over the past two decades—in terms of both the availability and relative importance of surveys, government administrative records, and commercial data sources; and the data infrastructure for the PPM and other economic statistics should leverage new data sources where appropriate. The panel’s vision for the PPM data infrastructure, described in greater detail later in this chapter, includes:
- Enhanced content for the PPM, through added survey questions (as few as possible to minimize respondent burden) and imputations from other sources;
- Improved accuracy (reduced variance and bias) of income recipiency and amounts through combining survey and administrative records;
- Poverty estimates that are at least as timely as current estimates, achieved by developing models for projecting administrative records that lag in availability;
- Enhanced geographic detail of poverty estimates, made possible by utilizing the large sample size of the ACS;
- Quarterly or even monthly updates of selected PPM rates through use of ACS intra-year data, monthly CPS data, or both; and
- Comparable PPM estimates using other major surveys, such as the ACS and SIPP.
6.2. DATA NEEDS CREATED BY THE PROPOSED PRINCIPAL POVERTY MEASURE
For purposes of developing the PPM, the need for a flexible data-infrastructure approach is perhaps most evident for filling data gaps in the coverage of difficult-to-measure categories such as medical care, childcare, housing, and transportation, as discussed in previous chapters.7 As emphasized throughout this report, the PPM is designed to be more conceptually consistent and accurate than the SPM. However, the new data needs required for estimating the PPM add an element of complexity. Given the panel’s recommendation that the Census Bureau periodically update the conceptual approaches to estimating PPM needs and resources in the crucial measurement areas featured in Chapters 3–5, the Census Bureau should likewise take the opportunity to explore a range of accompanying data strategies.
6.2.1. Medical Care
In the current SPM methodology, the treatment of medical care is handled exclusively in the estimate of household resources, from which medical out-of-pocket (MOOP) spending—which includes insurance premiums, copayments, over-the-counter health-related products, deductibles, and other payments—is subtracted. These nondiscretionary expenses are, in effect, treated like taxes or work-related expenses. MOOP estimates are derived from self-reported amounts for the relevant categories in the CPS-ASEC (and from imputations, for those not reporting). The proposed PPM method of handling medical needs and resources requires additional information above and beyond that used in the current SPM (see Chapter 3). Most centrally, data are needed on insurance policies—specifically, ACA Marketplace premiums detailed by age, family type (size/composition), and geographic location—to account for medical care need on the threshold side of the PPM. For estimating needs thresholds, the panel recommends using the unsubsidized age- and region-specific cost of the ACA’s benchmark Silver plan. For resource estimates, data will continue to be needed on the value of health insurance benefits and subsidies provided to households by government or employers, as will data on MOOP costs and health insurance premiums.
___________________
7 See Appendix 6B for a summary of data needs generated by the panel’s recommended SPM/PPM components.
The Census Bureau (Creamer, 2022) has already begun testing the feasibility of integrating a health-inclusive concept into the SPM, as developed by Korenman and Remler (2016); a major aspect of the Census Bureau research involves assessing data options. Relevant findings from this work can be summarized as follows:
-
Survey updating. Information about MOOP spending is collected from CPS-ASEC respondents. The survey asks about: (1) premiums for comprehensive and supplemental health coverage (but not Medicare premiums); (2) expenditures on copays, prescriptions, and other medical care; and (3) expenditures for other over-the-counter spending. To capture information needed for a health-inclusive approach, the Census Bureau is researching the validity of new variables that may need to be added to the survey, testing updated questions and processing systems implemented in 2018, and assessing methods to account for sub-annual health insurance coverage (Creamer, 2022, p. 1). This testing does not address health insurance and medical care data needs for PPM estimates constructed from the ACS, which does not collect as much detail as the CPS-ASEC (see Appendix 6B).
The PPM will use much of the same CPS-ASEC data found in annual Census Bureau reports on health insurance coverage. Internal CPS-ASEC data would, where possible, be linked to external medical insurance plan data sources at the county level, followed by core-based statistical area, and then by state, with the second-lowest-cost Silver plans being chosen at each level. Note that linkage at the county level is not possible for all counties—the CPS-ASEC sample currently includes 1,385 of 3,143 counties (BLS, 2014). Linkage for all rating area county geographic units would, however, be possible for the ACS.
For data users to replicate the estimates within any data product, variables must be added to the CPS-ASEC or ACS data files. Specifically, information on health insurance units must be included if users are to understand the detailed relationships underlying the estimates; and, to set medical needs and benefits, a variable (or code to generate this variable) must be added to determine a “primary” insurance type. Together, these two pieces of information would allow data users to accurately recreate the medical benefits and needs added to PPM resources and thresholds.
- Broadening data sources. The Census Bureau is also exploring the potential use of other data sources identified in research by Korenman et al. (2019). Among the most important is cost-sharing information on the second-lowest-cost Silver plan from either Healthcare.gov or state-run health care exchanges. Collecting these data yearly from each state would be time intensive; however, as suggested by Creamer (2022), the Census Bureau could “follow the simplification in Hyson, Korenman et al. (2021) which sets caps for Medicaid premium and nonpremium expenditures to 5 percent of family income instead of gathering the state specific information” (p. 6).
- Timeliness considerations. Availability of data for valuing health insurance would need to conform with the annual production schedule of the PPM—essentially by September of each year. Fortunately, this is typically the case, as information on monthly plan premiums must be set before the open enrollment period. The same is true for the government’s average Medicare contribution (Creamer, 2022).
- Historical continuity. While the panel values accuracy more highly, work can be done to extend the consistency of the proposed PPM back in time. Most of the key data elements have been collected for some time. HIX Compare,8 a free service provided by the Robert Wood Johnson Foundation, collects and maintains data on the ACA Silver plan (proposed for benchmarking the basic medical care need in the PPM) and on households with private insurance or Medicaid, and includes out-of-pocket maximums for various plans. The data are available, albeit with some gaps, from 2014–2021 by rating area.
6.2.2. Childcare
Chapter 4 introduces the idea of incorporating childcare into the PPM in a way that improves consistency, by treating childcare as a basic need on the threshold side and accounting for childcare assistance on the resource side. The panel recommends initial implementation of these changes for families who use paid childcare, while also pursuing research to consider how childcare needs can be accounted for among all families with children,
___________________
8 See www.hixcompare.org/.
regardless of whether paid childcare is used. The current recommendations on childcare will require new data to be incorporated into the PPM, and future research may suggest additional expansions.
Currently, the SPM accounts for childcare as a work expense that is subtracted from the estimate of resources available to a family to reach the FCSUti threshold. The CPS-ASEC asks parents whether they pay for childcare and, if so, how much they spend. The amounts paid for any type of childcare while parents are at work are summed over all children (Fox, 2020). The ACS does not include childcare questions. To implement Recommendation 4.2—to add childcare need as a PPM threshold category—the panel recommends drawing on childcare reimbursement guidelines under the Child Care and Development Fund policy. Developing a basic childcare need portion of the PPM threshold would thus require a new approach but can rely on existing sources of information. The panel leaves the details on preferred approaches to the Census Bureau, although a number of current efforts to estimate basic childcare costs are referenced in Chapter 4.9
Recommendation 4.3 balances the inclusion of childcare in the threshold by including childcare assistance in resources. As discussed in Chapter 4, new survey questions and imputation methods would be required to ascertain this information and to develop a complete picture of childcare assistance. New questions on the CPS-ASEC and ACS covering the types of childcare respondents used for each child under age 13, and whether a government (or other) agency helped pay for that care, are needed to fully implement the recommendation. If government support was received, respondents would ideally be asked whether that support covered the full cost of care or a part of the cost. Households are best equipped to report on out-of-pocket expenses, rather than (unobserved) subsidies paid directly to providers, so it would make sense for the Census Bureau to impute the value of subsidies based on reported type of care used.
6.2.3. Housing
Like other components of FCSUti, the current SPM housing threshold is calculated by BLS using information reported in the CE and geographically adjusted using the ACS. As detailed in Chapter 5, separate thresholds are calculated for homeowners with a mortgage, homeowners without a mortgage, and renters. CE estimates of outlays on shelter are similar to those based on alternative data sources. For example, data from the 2018 ACS indicates that the national median two-bedroom gross rent (which includes utilities) was around $1,050 per month (Joint Center for Housing Studies, 2020). The shelter-and-utilities portion of the 2018 SPM threshold for renters was about $1,170 per month. Geographic differences in housing costs are applied to the SPM based on ACS estimates of rental rates for 343 areas. These areas can often be defined at the county level which, in many cases, is the smallest geographic unit that can reliably match housing-cost and ACS data.
On the resource side of the SPM, estimates of housing subsidies are based on administrative data on market rents from the U.S. Department of Housing and Urban Development (HUD). Amounts paid are estimated using HUD program rules and income information from the CPS-ASEC.10 The value of housing subsidies is estimated as the difference between the “market rent” for the housing unit and the total tenant payment; subsidies are capped at the housing portion of the threshold minus the household’s required rental payment.
Recommendation 5.1 states that PPM housing thresholds should be set based on the rental cost of housing; this would apply to renters as well as homeowners (who implicitly rent their homes to themselves). This standardized treatment reduces the complexity in the existing SPM which currently creates three separate housing thresholds by housing tenure type. In calculating thresholds, the panel recommends that rent levels be based on HUD’s annual Fair Market Rents (FMRs), which vary by location and number of bedrooms and include basic utilities except telephone and internet. Households would be matched to home size (number of bedrooms) based on the number and composition of household members, according to HUD guidelines. Thus, the data foundation for estimating shelter and utilities thresholds would shift from the CE to the ACS, on which FMRs are based.
HUD provides FMRs on an annual basis for metropolitan areas, which may comprise multiple counties; at the zip code level within metropolitan areas; and for all nonmetropolitan counties. An FMR-based approach to setting
___________________
9 See footnote 7 in Chapter 4 for details.
10 See Renwick and Mitchel (2015) for details about this estimation procedure.
needs thresholds would tend to yield slightly lower estimates than the current SPM method but, as explained in Chapter 5, this is not always the case. As noted above, HUD data are also used in determining housing assistance to families (e.g., standard payment amounts for the Housing Choice Voucher Program).
Recommendations 5.5 and 5.6 suggest accounting for differences in tenure and home ownership type on the resource side—specifically, by including implicit (or imputed) rental income for households that own homes. The implicit rental income estimate would subtract homeowners’ user costs such as mortgage interest payments, property taxes, insurance, and maintenance expenses; the resulting amount would be the net flow of income for homeowners from this asset. This recommendation creates new data needs for the PPM. Most of the data needed to estimate owners’ user costs and imputed rent are already captured in the ACS, including housing tenure, homeowners insurance, property taxes, mortgage payments (combined principal and interest), and the home’s market value. However, the CPS-ASEC lacks most of these variables, meaning questions would need to be added or the information imputed from other sources (e.g., the CE, ACS, or American Housing Survey11).
The CE or American Housing Survey could be used to impute rental income (often referred to as rental equivalence) minus operating expenses. Alternatively, the ACS could be used to impute rents minus expenses, although this survey does not include maintenance and repairs payments and mortgage interest payments (see Appendix 6B). The ACS is used by the Bureau of Economic Analysis (BEA) to impute rental income of homeowners (Aten and Heston, 2020) and to measure operating expenses including property taxes, insurance, mortgage payments, and condo fees. Additionally, just as income measurement can be improved through use of administrative data, administrative and commercial data sources have been used, including by HUD, to improve the measures of housing costs in the ACS and thereby in the CPS-ASEC (e.g., property taxes, property values, and other housing characteristics).12
6.3. THE CURRENT SURVEY-BASED DATA INFRASTRUCTURE
6.3.1. Features of Relevant Surveys
Four surveys—the CE, ACS, SIPP, and CPS-ASEC—factor prominently in the regularly published SPM estimates. The CPS-ASEC is the primary data source for estimating the components of resources; however, work-related expenses (other than childcare) are based on the SIPP. The thresholds that are compared to resources to determine poverty status are estimated from the CE, with geographic adjustments made to the housing and utilities component by a median rent index based on the ACS. Table 6-1 provides information on key features of the CPS-ASEC, CE, ACS, and SIPP.
Recently, the Census Bureau has implemented a version of the SPM using the ACS as the basis for estimates (Fox et al., 2020); and the Census Bureau explicitly recommends using the ACS for state-based poverty estimates. The panel strongly supports efforts to add the ACS to the CPS-ASEC as a major platform for the PPM (see Recommendation 6.1). The most compelling advantage of the ACS is the capability to produce local-area PPM rates due to its sample size (2.1 million interviews per year compared with approximately 78,000 for the CPS-ASEC). The most obvious downside of using the ACS is that it offers fewer details about the sources of respondents’ income and fewer details on program participation.
___________________
11 The American Housing Survey conducted by the Census Bureau provides information on the size, composition, and quality of the nation’s housing, and measures changes in housing stock over time. This longitudinal survey is conducted biennially in odd-numbered years and covers major U.S. metropolitan areas.
12 An example of such proposed alternative data use by HUD arose for fiscal year 2023 FMR estimates, in response to issues created by the COVID-19 pandemic. As a work-around to the lack of available 2020 ACS 1-year data, the agency proposed using private-sector rental data, which were demonstrated to more accurately reflect changes in local market rent inflation in the wake of the pandemic. Among the data sources evaluated were RealPage average effective rent per unit; Moody’s Analytics REIS average gross revenue per unit; CoStar Group average effective rent; CoreLogic, Inc. single-family combined three-bedroom rent index; ApartmentList rent estimates; and the Zillow Observed Rent Index (U.S. Housing and Urban Development Department, 2022).
TABLE 6-1 Survey Features: CPS-ASEC, ACS, SIPP, and CE
| Feature | CPS-ASEC | ACS | SIPP | CE (Interview Survey) |
|---|---|---|---|---|
| Universe | Household population plus people in noninstitutional group quarters (includes college students in dormitories if reported at home and Armed Forces members if living in a household with at least one civilian adult); excludes individuals experiencing homelessness and people in nursing homes, prisons, other institutions, and Armed Forces barracks | Total household and group quarters population except for individuals experiencing homelessness and residents of domestic violence shelters—college students in dormitories sampled at college | Same as CPS-ASEC | Same as CPS-ASEC |
| Content (Topics) | Detailed questions per topic: family/household composition, person demographics, marital status, educational attainment, health insurance coverage and costs, nativity, previous year’s income from all sources, work experience, receipt of noncash benefits, program participation, geographic mobility, childcare costs | 1–2 questions per topic: family/household composition, person demographics, ancestry, citizenship, nativity, commuting, place of work, disability status, education, employment, fertility, grandparents as caregivers, health insurance, income and earnings (6 categories), Supplemental Nutrition Assistance Program status, industry, occupation, class of worker, language spoken at home, marital history, residence 1 year ago, period of military service, undergraduate field of degree, veteran status, work status last year, housing characteristics, housing costs/value, computer/internet use, vehicles available | Detailed questions per topic: family/household composition, person demographics, language at home, citizenship, nativity (self and parents), veteran status, residences, marital history, education, employment, unemployment, commuting, medical care utilization, insurance and costs, program participation, income, assets, vehicles, child and dependent care, disability, fertility, adult and child wellbeing | Family/household characteristics, person demographics, stock of vehicles (1st interview) employment and earnings (1st and 4th interviews), income and assets (4th interview); detailed questions on 60–70% of expenditures (month of purchase and quarterly expenses), global questions on 20–25% of expenditures (e.g., food, and apparel); diary survey has detailed expenditures collected over 2 weeks, but is not used for SPM threshold production |
| Sample Design | Supplement to the monthly CPS, which has a multistage, stratified, clustered, rotational design (addresses are in sample for 4 months, out for 8 months, and in again for 4 months); CPS-ASEC has 100% oversample of Hispanic households; oversample for estimates of states’ children’s health insurance program; potential to link addresses for part of sample to previous year | Nonclustered sample every month (addresses can be in sample only once every 5 years); small governmental units oversampled, large census tracts undersampled; 5-year sampling rates range from 0.5% to 15%; nonrespondents (after mail follow-up) subsampled for field follow-up (one-third subsample on average, rates vary inversely by response rates) | Multistage, stratified, clustered design; low-income areas oversampled; panel (longitudinal) design; new panel selected every year (as of 2018); each panel with 4 annual waves (2019 panel had one wave; 2020 panel had response problems due to COVID-19)* | Multistage, stratified, clustered, rotational design; addresses are in sample for 4 quarters (treated independently for estimating SPM thresholds); new sample introduced each quarter |
| Feature | CPS-ASEC | ACS | SIPP | CE (Interview Survey) |
|---|---|---|---|---|
| Sample Size | 89,000 addresses in sample selected from 1,385 of nation’s 3,143 counties; 78,000 interviewed households (73,000 interviewed in 2020 due to COVID-19) | 295,000 addresses in sample every month; 3.54 million addresses per year; 2.1 million final interviews per year (due to COVID-19, the 2020 ACS had fewer sample addresses and fewer final interviews)** | 45,000 Wave 1 eligible households, 2018 panel; 24,500 Wave 1 eligible households, 2019 panel; 22,000 Wave 1 eligible households, 2020 panel; household members followed for later waves | 13,000 addresses contacted each quarter for interview and 18,000 addresses for Diary each year; 6,900 usable interviews obtained each quarter |
| Periodicity | Annual (ASEC interviews conducted in February–April) | Monthly (estimates are cumulated to calendar year) | Annual (interviews conducted in winter–spring of following year) | Monthly (each month, one-sixth of addresses are in 1st month, 2nd … 6th month) |
| Reference Period for Income/Expenditures | Prior calendar year | Prior 12 months | Month (most variables); year for some variables (e.g., income from assets) | For interview, prior 3 months for expenditures; prior 12 months from Interview for income; current value and value 12 months earlier for assets/liabilities |
| Unit(s) Available for Analysis | Household (all people at an address); family (related people at an address); unrelated individual (in group quarters or household); SPM resource unit (related people at an address plus cohabiting couples, foster children, and unrelated children under age 15) | Same as CPS-ASEC | Same as CPS-ASEC | Consumer unit (family members at an address, including foster children; unrelated people in a household who share major expenses; unrelated individuals who are financially independent) |
| Publications/Data Products | Income and Poverty [OPM] in the United States released mid-September (5 months after end of data collection); The Supplemental Poverty Measure released concurrently; additional tables and microdata file released concurrently | 1-year cumulative tables for areas with 65,000+ people in mid-September (7 months after end of data collection for December of publication year); reduced set of 1-year cumulative tables for areas with 20,000+ people and 1-year microdata file in mid-October; 5-year cumulative tables for all areas, tabulated down to block group, and 5-year microdata file in mid-December | Special national-level publications released sporadically; microdata files released by wave; latest waves available are Wave 1 of the 2020 Panel (income year 2019); Wave 1 (only wave) of the 2019 Panel (income year 2018); and Waves 1–3 of the 2018 Panel (income years 2017–2019) | Regular national-level publications on consumer expenditures (based on integration of the Interview and Diary Surveys) released every 6 months; integrated tables covering 12 months of data released twice a year (calendar 2020 tables released early September 2021; July 2019–June 2020 tables released late April 2021); microdata files available annually |
SOURCE: Compiled by panel staff from BLS and Census Bureau websites.
NOTES: * Design has changed substantially several times since SIPP began in 1984.
** The public-use file, however, includes only about 2 million households; to protect privacy the Census Bureau’s ACS SPM work uses the public-use microdata sample version of the data so that non-Census Bureau researchers can use the data.
6.3.2. Survey Strengths and Weaknesses
The survey-based infrastructure underlying the Census Bureau’s poverty statistics—including the SPM and the proposed PPM—has key advantages mainly due to the breadth of questions included in the surveys. Key strengths include:
- The CPS-ASEC has questions on almost all items needed to calculate SPM resources as currently defined (see Appendix 6B), although some questions would need to be added for the PPM. The ACS lacks the detail on income and in-kind benefits of the CPS-ASEC but does capture major income categories and has questions that would facilitate measurement of housing as a component of resources. It, too, would require additional questions for the PPM.
- The CPS-ASEC and ACS include a wealth of demographic information (e.g., household type, employment, race/ethnicity) for calculating SPM/PPM poverty rates for population groups of interest. Much of this demographic information (e.g., race and ethnicity) is not available from other administrative records.
- The CE includes questions on almost all expenditures needed to calculate SPM thresholds as currently defined for consumer units (CUs) with children. It also includes all the questions needed to calculate the food, clothing, and internet category thresholds in the PPM for all CUs.
Key weaknesses of the survey-based infrastructure include:
- The surveys that provide input to the SPM suffer from impaired data quality created by nonresponse, coverage error, and reporting error. In particular, underreporting is significant and imputation rates are high for many sources of income. These defects skew poverty rates and other economic measures for households (Hokayem et al., 2015; Meyer et al., 2015; Bollinger et al., 2019). There is also underreporting of income for high-income households. Data-quality deficits also increase the uncertainty (variance) in estimates of poverty and other economic measures. The use of administrative records could remedy these problems to a significant extent.
- The CPS-ASEC sample size is not ideal for PPM estimates of subnational geographic areas. While representative at the state level, the Census Bureau recommends 3-year averages for more reliable state estimates. However, such smoothing of estimates is not as timely as desirable for poverty statistics, particularly when households’ economic situations are in flux, as has been the case since the start of the COVID-19 pandemic. The ACS could provide the remedy for both drawbacks, although it lacks the detail on income components that the CPS-ASEC provides and requires imputation for receipt and amounts of in-kind benefits and other variables needed for poverty statistics. While the ACS provides additional geographic details, it is not clear how the Census Bureau’s newly proposed changes for privacy protection would impact the level of geographic detail publicly available.
- The CPS-ASEC is an address-based sample, and hence, excludes the homeless population (and any other people not living in housing units). The lack of including people experiencing homelessness in the poverty calculation can yield an underestimate of poverty (Meyer et al., 2021). As stated in Chapter 5, research is recommended to examine the possibility of estimating the size and poverty status of the homeless population.
Ideally, all relevant surveys (including CPS-ASEC, ACS, and SIPP) would allow production of the PPM. Of course, expanding the ACS to provide the new data that would be required for PPM calculations needs to be weighed against potential costs and drawbacks of increasing the number of questions on the survey. At present, data-quality problems complicate comparisons of the SPM and OPM among surveys. As noted above, the Census Bureau is exploring how the SPM can be estimated from ACS data,13 and demand for this exists among researchers and policy analysts as it allows for state and substate estimates using yearly data with high demographic detail. A number
___________________
13 See Fox et al. (2020) and www.census.gov/content/dam/Census/library/working-papers/2020/demo/SEHSD-WP2020-09.pdf.
of states, including New York, California, Wisconsin, and Virginia, produce their own SPM using the ACS, as do several cities, including New York City, which pioneered an ACS-based SPM, and San Francisco (e.g., Smeeding and Thornton, 2020; Bohn et al., 2021). The Urban Institute’s ATTIS microsimulation model also generates SPM estimates from the ACS, building on Census Bureau methods but with alternative methods for imputing benefits and calculating taxes.14
6.3.3. Survey Quality Concerns
Household surveys have been the flagship of federal statistics on income, poverty, expenditures, and many other topics for at least 75 years. Over the last 30 years, however, survey quality has deteriorated in many cases. Specifically, response rates (unit and item) have declined in recent decades and underreporting has increased, requiring a greater reliance on imputation and weighting adjustments. Other concerns include coverage error, reporting errors such as confusing Supplemental Security Income (SSI) with Social Security, and imputation bias. These concerns are well documented15 and include the examples that follow.
Household (Unit) Response Rates
Household (unit) response rates have been declining in nearly all surveys, in the United States and abroad. The Census Bureau obtains higher response rates in its surveys than do other organizations, but even Census Bureau surveys have not been immune to the problem. Figure 6-1 shows the decline in response rates to the basic CPS, CPS-ASEC, and CE surveys from 1984 to 2019. Based on findings (of an earlier version of a paper) by Sabelhaus et al. (2015), in 2014, BLS began using zip-code-level income estimates from the Internal Revenue Service (IRS) for nonresponse weighting adjustments; such adjustments are needed to correct for underrepresentation of high-income households and overrepresentation of low-income households in the CE. BLS is currently conducting research on using IRS data on income at the household level for nonresponse weighting adjustments (Steinberg et al., 2020). The Census Bureau is also doing this type of research for the CPS-ASEC and ACS.16
Borgschulte et al. (2022) examine whether partisanship can help explain the trend in unit nonresponse in the CPS, noting that the sharp increase in nonresponse in the CPS main survey and the ASEC after 2010 coincided with the emergence of the Tea Party, which espoused strong anti–federal government sentiments. Their analysis found evidence of a partisan cycle in survey response, but partisanship, and notably the growth of the Tea Party, did not explain the observed trend increase. Improving survey response rates, or at least stemming the growth in nonresponse, is and should continue to be a high priority for the Census Bureau.
Item Nonresponse to Income Questions
In addition to unit nonresponse, survey item nonresponse to income questions has increased. The CPS-ASEC is, as noted above, the primary source for resource measures used in the OPM and the SPM. Of those resources, labor-market earnings make up the dominant source of income among nonretired households, comprising at least 80 percent of personal income. The substantial increase in earnings nonresponse is a complicating factor of the CPS-ASEC in recent decades (Hokayem et al. 2015; Bollinger et al., 2019). This nonresponse can occur either from refusal to answer earnings questions (item nonresponse), or from refusal to respond to most or all of the ASEC (supplement nonresponse). Publicly available data from the CPS for the population of individuals age 16–64 indicates that earnings item nonresponse more than doubled from 1990 to 2004, then trended down for the next decade, only to jump several percentage points over the last 5 years. Even more striking is the increase in ASEC
___________________
14 See www.urban.org/research-methods/attis-microsimulation-model.
15 See, for example, Hirsch and Schumacher (2004); Bollinger and Hirsch (2006); Meyer et al. (2009, 2015); Bee et al. (2015); Hokayem et al. (2015); Rothbaum (2015); Bee and Rothbaum (2019); Bollinger et al. (2019); and Borgschulte et al. (2022).
16 See, for example, www.census.gov/library/working-papers/2020/demo/SEHSD-WP2020-10.html.
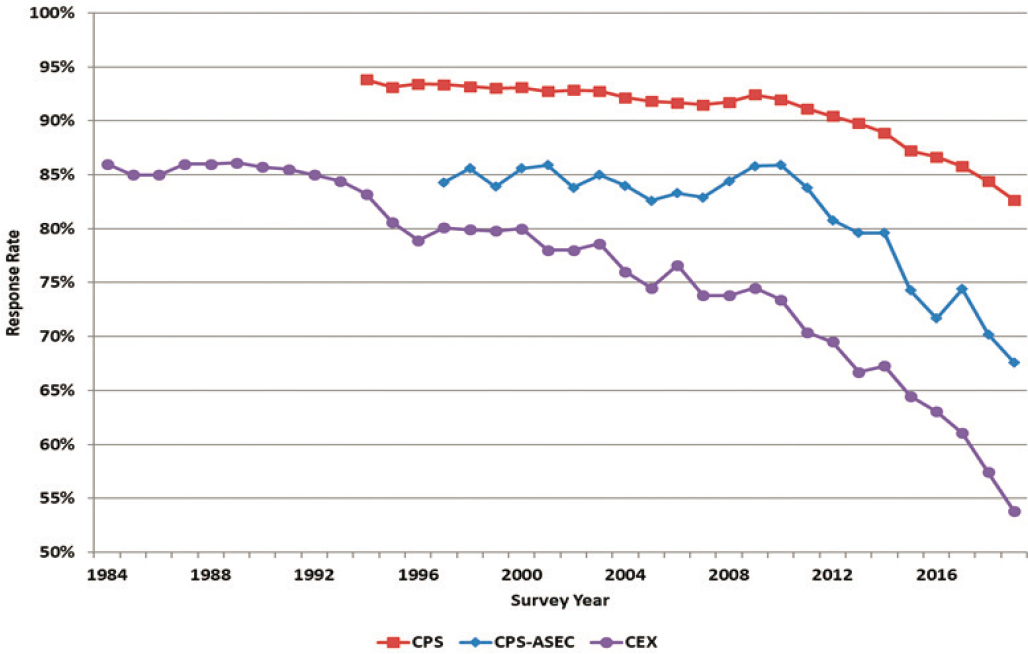
SOURCE: Abraham (2022, Figure 1).
NOTES: CPS = monthly Current Population Survey. CPS-ASEC = CPS Annual Social and Economic Supplement. CEX = Consumer Expenditure Interview Survey. Annual or annual average response rates reported.
nonresponse, which jumped from 10 percent in 2010 to 23 percent in 2021. Combined, this means that earnings are missing for at least 40 percent of potential prime-aged workers.
The Census Bureau does not drop observations with missing earnings or a missing supplement, but instead retains these observations and imputes values for the missing data. Depending on the questions being addressed and the reasons for nonresponse, use of imputed values can either have little effect or can produce severe bias (Hirsch and Schumacher, 2004; Bollinger and Hirsch, 2006; Hokayem et al., 2015; Bollinger et al., 2019). If earnings data are “missing completely at random,” then nonresponse is completely independent of earnings; if earnings are “missing at random” (MAR), then nonresponse is not dependent on earnings after conditioning on covariates; and if earnings are not MAR, then nonresponse depends on the value of missing earnings even after conditioning on covariates (Rubin, 1976; Little and Rubin, 2002). The last case is generally referred to as “nonresponse bias.” Both Census Bureau imputation procedures and common methods to deal with nonresponse assume that nonresponse is MAR; that is, those not reporting earnings have earnings similar to those with equivalent measured attributes. If this MAR assumption holds, there will be no bias in measures of poverty from the hot deck; however, if earnings are not missing randomly, there can be bias. Indeed, Bollinger et al. (2019) present evidence that missing earnings are not MAR; and Hokayem et al. (2015) show that the OPM is biased downward by about 10 percent in a typical year during the period 1998–2009, which was prior to the large runup in supplement nonresponse.
While explicit recommendations for improving response rates in the CPS-ASEC are beyond the scope of this report, the panel notes that long-running household panels like the Panel Study of Income Dynamics (PSID) have item nonresponse rates on earnings that are about one-third the level found in the CPS-ASEC. The Census
Bureau could usefully explore best practices from surveys like the PSID for improving CPS-ASEC nonresponse. The next section focuses on innovations in linking surveys to administrative records and on imputations as a means of improving data quality in the presence of nonresponse.
Item Nonresponse Rates to Expenditure Questions
In the CE, item response rates are not easily calculated. Since many questions ask only for the dollar amount and not the incidence of purchase, standard item response rates are not available. However, BLS produces a data-quality report that includes edit, allocation, and imputation rates (Armstrong et al., 2022). Many of these rates have not changed during the past decade. Some research suggests that the frequency of reporting zero expenditures in a 3-month period could indicate that respondents are less willing to report expenditures. Bee et al. (2015; Appendix Table 7.6) show that the percentage of CUs in the CE Interview Survey reporting zero expenditures on women’s and girls’ clothing, for example, increased from 35 percent in 1986 to 53 percent in 2010. Similarly, reporting of zeroes went from 48 to 62 percent for men’s and boys’ clothing, and from 50 to 67 percent for shoes and other footwear. Percentage increases in zeroes were smaller for other items (e.g., from 57 to 67%for off-premises alcoholic beverages) or showed no change (e.g., only about 1% of CUs reported zero expenditures for off-premises food and nonalcoholic beverages in 1986 and 2010).
Substantial and Increased Underreporting of Transfer Income
When comparing survey aggregate amounts to administrative records, substantial and increased underreporting of transfer income is well documented for many sources (see, e.g., Meyer et al., 2009, 2015). This research highlights two main impacts on poverty measurement caused by underreporting—specifically, poverty could be overstated and the impacts of government programs in reducing poverty could be understated. The growing problem of transfer income nonresponse and underreporting of in-kind transfers is not unique to the CPS-ASEC, nor to surveys in the United States (Brewer et al., 2017). The reasons for these developments are not well understood.
Imputation can make up for missing income amounts for respondents who report receipt and can add income for respondents who do not answer a receipt-related question and are imputed to receive the income source. This leaves income unaccounted for in instances in which respondents received an income source but reported that they did not, and when they reported a lower amount than they in fact received.
In the CPS-ASEC, ACS, and CE, Meyer et al. (2015, Tables 2, 3, 4, 7) find net underreporting of income from many transfer programs (both cash and in-kind) to be high and increasing up through 2005, and it is likely that reporting has not improved since these comparisons were made. For example, less than 50 percent of Aid to Families with Dependent Children/Temporary Assistance for Needy Families (AFDC/TANF) benefits were reported in the CPS-ASEC and ACS in 2004 (and only 25% of such benefits were reported in the CE). Reporting of Supplemental Nutrition Assistance Program (SNAP) benefits was not much better. Even Social Security benefits are somewhat underreported (90, 81, and 90% of benefits were reported in the CPS-ASEC, ACS, and CE, respectively, in 2005), while SSI benefits are somewhat worse reported (78, 84, and 66% of benefits were reported in the CPS-ASEC, ACS, and CE, respectively, in 2005).
Using samples linked to New York State administrative records, Meyer et al. (2015, Table 4) estimate the extent of net underreporting—in SNAP estimates in the CPS-ASEC and AFDC/TANF estimates in the CPS-ASEC and ACS—due to the combination of unit nonresponse, coverage error, and weighting; due to item nonresponse; and due to measurement error. They found measurement error to be the largest source of the discrepancy. Meyer and Mittag (2019) estimated the effect of net underreporting on estimates of deep poverty, poverty, and near poverty, using matched CPS-ASEC and administrative records for New York State for 2008–2011 for SNAP, TANF, General Assistance, and housing assistance. Using the administrative records, they found a reduction of 0.9, 2.5, and 3.1 percentage points (for people in deep poverty, poverty, and near poverty, respectively) compared with the survey estimates, and even larger reductions for certain types of households, such as those headed by single mothers.
It is worth noting that other government surveys, specifically SIPP and the U.S. Department of Agriculture’s (USDA’s) National Household Food Acquisition and Purchase Survey (FoodAPS)17—perform considerably better than the CPS in terms of income reporting. Kang and Moffitt (2019) matched administrative data from most of the states in the FoodAPS Primary Sampling Units to self-reported SNAP participation from the survey, and they found that FoodAPS showed little error in SNAP reporting. They also found that the minimal misreporting that did occur had little impact on estimates of SNAP’s influence on food security, food spending, or dietary quality of acquired foods. Similar results were found for National School Lunch/Breakfast Program reporting.18
Underreporting of Some Expenditures and Omissions of Others
In the CE Interview Survey, there is underreporting of some expenditures and omissions of others. The survey does not collect spending from in-kind benefits except for SNAP—in response, BLS recently decided to impute Special Supplemental Nutrition Program for Women, Infants, and Children (WIC), National School Lunch Program, Low Income Home Energy Assistance Program, and rental assistance into the CE data for developing SPM thresholds. Meyer et al. (2015, Table 7.1) find that, for comparable categories in 2010, CE aggregates generally fell short of Personal Consumption Expenditure (PCE) aggregates produced by BEA. The differences were modest for some items—the CE captured 86 percent of spending on food consumed at home and 80 percent of spending on communications. However, the CE captured much less of the PCE aggregate for food eaten away from home (53%) and clothing (32%). In contrast, the CE performed better compared to FoodAPS on total food spending and spending on food at home, and it was very close to FoodAPS on spending on food away from home (see Clay et al., 2016). For constructing SPM thresholds, it is likely that median expenditures on the SPM bundle are reasonably accurate, although means are underreported due to underreporting by CUs with high income and spending.
Coverage of Population Groups Varies
In household surveys, coverage of populations groups varies substantially. For example, even after weighting for nonresponse, surveys disproportionately miss such groups as African American men when compared with decennial Census counts. Use of census-based population estimates by age, sex, and race/ethnicity as a final stage in weighting rectifies the disparities on these basic demographic characteristics based on the MAR assumption. Yet, it is difficult to correct for disparities that may exist for socioeconomic groups (e.g., men experiencing periods of low income), which, in turn, may distort estimates of poverty, unemployment, and other measures of household wellbeing.19
6.4. ADMINISTRATIVE DATA FOR IMPROVING INCOME ESTIMATES
Administrative records have a long history of use within household survey methodology, to provide control totals for weighting adjustments. Specifically, to estimate internal migration, the Census Bureau uses birth, death, immigration, and IRS records to annually update population estimates by age, race and ethnicity, and sex. These estimates are used in the final weighting stage for the CPS-ASEC, ACS, CE, SIPP, and other household surveys, to correct for coverage errors and reduce variance in survey estimates. Elsewhere, BLS uses IRS zip-code-level income estimates to weight adjustments for unit nonresponse in the CE; and the Census Bureau uses administrative
___________________
17 FoodAPS is a nationally representative survey of U.S. households that collects comprehensive data about food purchases and acquisitions made by households. See www.ers.usda.gov/data-products/foodaps-national-household-food-acquisition-and-purchase-survey/. FoodAPS showed little error in SNAP reporting—perhaps because food is a significant concern for respondents and they are thus primed to remember the program, or perhaps the FoodAPS used recent SNAP recipients as a frame for finding people on SNAP.
18 A few caveats regarding FoodAPS should be noted. The data project acquired administrative records from only 23 of the 28 states in the survey. Also, respondents had to give consent to the match (only 122 of 4,826 did not give consent), so perhaps just knowing that survey responses would be matched to administrative records encouraged more accurate reporting. But it also seems clear that more could be done by surveys to improve reporting error, potentially with administrative record matches (see USDA, 2021, for some broad findings).
19 Bollinger et al. (2019) use a model applying copula-based process to correct for missing earnings values. That model could be modified to also address undercoverage of people.
records (SNAP and IRS records, specifically) to annually update small-area income and poverty (OPM) estimates for use by counties and school districts in allocating funds to schools serving populations with low incomes.20
Perhaps most crucial in the context of the PPM, administrative records offer the opportunity to considerably improve the accuracy of income estimates. To help offset inaccuracies in measurement of earnings due to nonresponse and underreporting of transfers, researchers have pursued linkages to administrative records, facilitated thorough cooperation with various agencies, and accessed via secure research data centers. Substantial progress has been made over the past two decades linking Census Bureau survey data to administrative tax records and transfer program data from the Social Security Administration (SSA), IRS, USDA, and numerous state agencies. SSA has provided information to the Census Bureau on individual earnings via the Detailed Earnings Records, as well as on transfer benefits from Social Security Retirement, Social Security Disability, and SSI. The IRS has provided access to 1040 tax returns, along with associated forms such as the W-2 wage statement, 1099s for self-employment and retirement income, and the Earned Income Tax Credit (EITC) (and recently the Child Tax Credit) recipient file. The USDA, with the cooperation of state agencies, has provided access to SNAP and WIC records for cooperating states, with some states also providing access to data on other programs such as TANF. The Census Bureau also has access to limited data from records for U.S. Department of Veterans Affairs benefits and other disability and survivor benefits. Table 6-2, adapted from Bee and Rothbaum (2019), summarizes the records currently available to the Census Bureau.
In these applications, the administrative records are linked to Census Bureau surveys such as the CPS-ASEC using a unique Protected Identification Key (PIK) produced within the agency. The PIK is a confidentiality-protected version of the Social Security Number (SSN). Since the Census Bureau does not currently ask respondents for SSNs as part of the CPS-ASEC, it uses its own record linkage software system, the Person Validation System, to assign SSNs from the SSA Numident file.21 This assignment relies on a probabilistic matching model based on name, address, date of birth, and gender. The SSN is then converted to a PIK to link data like the CPS-ASEC to “PIKed” SSNs in tax and other administrative records. On average, about 90 percent of respondents receive a PIK on the CPS-ASEC, but this rate drops considerably among the low-earning population. Bollinger et al. (2019) report that failure to PIK is highest among noncitizens of Hispanic ethnicity, and Jones and Ziliak (2022) report that the antipoverty effectiveness of programs like the EITC is attenuated because of missing PIKs among this population, which tends to be more disadvantaged. The authors also demonstrate the importance of using the tax data to measure the effectiveness of the EITC, which is currently computed in the SPM estimation. These linkages between tax data and the CPS are also important in evaluating the take-up rates for the EITC and other tax credits.
If administrative records were available on a timely basis, the replacement of survey values of transfer income with administrative records data would be a viable solution to the underreporting problem. Administrative data on transfer income capture the dollar amounts of transfers flowing through the economy. Missing earnings from surveys could also be replaced with SSA detailed earnings records and would likely be more timely for production of annual poverty estimates. In this case, however, it is not clear that administrative data on earnings should replace survey responses, in part because not all earnings are taxable, and some earnings go unreported to tax authorities. Indeed, Bollinger et al. (2019) show that earnings reported in the SSA detailed earnings records are too low in the left tail of the earnings distribution compared to earnings reported (not imputed) in the CPS-ASEC. Research (e.g., Hokayem et al., 2015) shows that, for estimating earnings, a mixed-data approach combining tax reports together with survey reports appears to be preferable to either source alone. One reason is that under-the-table earnings are reported, at least to some extent, in the CPS-ASEC but not in tax records.22
Despite some limitations, discussed below, administrative transfer records generally provide a much more complete portrait of the financial wellbeing of low-income families than do their survey counterparts (Meyer et al., 2015; Larrimore et al., 2017; Jones and Ziliak, 2022). For this reason, this panel concurs with Recommendation 22 of the recent Interagency Technical Working Group (ITWG) on Evaluating Alternative Measures of Poverty (BLS, 2020) that the Census Bureau should accelerate its examination of a variety of approaches for integrating administrative data into poverty measurement, including replacement, using both sources, and regression-based imputation.
___________________
20 See www.census.gov/programs-surveys/saipe.html.
21 The Numident file is a record of applications for Social Security cards and includes data elements for name, date and place of birth, parents’ names, and date of death (see McNabb et al., 2009).
22 See Hokayem et al. (2015) for an application of this mixed approach to the measurement of the OPM.
TABLE 6-2 Available or Potentially Available Administrative Data for Money Income, In-Kind Benefits, and Taxes
| Income Item | Data Source and Administrative Item (available to Census Bureau unless otherwise noted) | Notes |
|---|---|---|
| Wages and Salaries | IRS: Limited W-2 Information SSA (via IRS): Detailed Earnings Record (DER) States: Unemployment insurance data in Longitudinal Employer-Household Dynamics data |
Earnings net of employee deductions for health insurance, etc.; excludes unreported earnings (e.g., tips) The DER has W2 earnings as well as deferred wage contributions to 401(k), 403(b), 408(k), 457(b), and 501(c) plans |
| Self-Employment (Sole Proprietor/Independent Contractor) | SSA: DER IRS: 1040 Schedule C, SE; 1099-MISC; 1099-K; K-1—not available |
Underreported income not in tax data |
| Self-Employment (pass-through) | IRS: 1040, Schedules E, F; K-1—not available | Income from owners of C-corps not reported unless dividends taken |
| Unemployment Compensation | IRS: 1099-G; 1040—not available | |
| Workers’ Compensation | Not available | Mostly administered by private insurance firms |
| Social Security | SSA: Payment History Update System IRS: SSA 1099—not available |
CPS-ASEC and SIPP only |
| Supplemental Security Income (SSI) | SSA: Supplemental Security Record | CPS-ASEC and SIPP only; nontaxable, not on any IRS form |
| Public Assistance | States: DHHS: TANF | Not available for all states; not all cash assistance covered |
| Veterans’ Benefits | Veterans Administration: Administrative data (limited) | Some benefit data available for limited uses |
| Disability | IRS: 1099-R, limited data | Excludes Social Security and VA |
| Survivor Income | IRS: 1099-R, limited data | Excludes Social Security and VA |
| Interest | IRS: 1040 IRS: 1099-INT—not available |
Includes taxable and nontaxable; excludes tax-preferred |
| Dividends | IRS: 1040 IRS: 1099-DIV—not available |
Excludes tax-preferred |
| Rent and Royalty Income | IRS: 1040 IRS: 1040 Schedule E, K-1—not available |
Only gross rent Excludes depreciation |
| Educational Assistance | IRS: 1098-T, 1099-Q—not available | 1098-T covers financial aid; 1099-Q covers spending from tax-preferred education accounts (529, Coverdell) |
| Other Income | IRS: Capital gains, 1040, 1099-B, K-1—not available IRS: Alimony, 1040—not available IRS: Gambling Income, 2-2G—not available IRS: Alaska Dividend, 1099-MISC—not available |
|
| Noncash/Deferred Compensation from Employers | Firms: Retirement plan contributions, Form 550 public data IRS: Health insurance contributions, other benefits (e.g., moving expenses, etc.), W-2—not available |
Only available at aggregate firm level |
| Income Item | Data Source and Administrative Item (available to Census Bureau unless otherwise noted) | Notes |
|---|---|---|
| Government Taxes, Credits | IRS: EITC, other credits (e.g., child tax, education expense, etc.), 1040—not available IRS: Federal tax obligations, 1040—not available IRS: State, local, property tax obligations (for itemizers up to cap), 1040—not available |
Census Bureau models federal and state income taxes, including various credits |
| Near-Income Items | States: SNAP, WIC | Availability varies by year; not available for all states |
| Centers for Medicare & Medicaid Services (CMS)/DHHS: Medicare | Does not cover all possible sources of housing assistance | |
| CMS/DHHS: Medicaid | Available for one state for some years | |
| States: School Lunch—not available | ||
| HUD: Housing Assistance | ||
| States: Low Income Home Energy Assistance Program |
SOURCE: Adapted from Bee and Rothbaum (2019, Table 1).
The ITWG report supports its recommendation with a careful discussion of the advantages and disadvantages of incorporating administrative data into poverty statistics.
Their potential notwithstanding, there are practical factors slowing the incorporation of administrative records into economic statistics. For many transfer programs, data ownership resides with the states, and memoranda of understanding (MOUs) must be executed for each state and program so that data can be shared with the Census Bureau for linkages. To date, in part due to the complex legal agreements needed to include administrative records in the microrecords, fewer than half of U.S. states allow such sharing, and those that do provide data with a considerable time lag and incomplete coverage across years. Moreover, the MOUs that govern access to many records are, by design, regularly at risk of expiring and not being renewed by the custodial federal or state agency. The Foundations for Evidence-Based Policymaking Act of 2018 (Section 303)23 establishes a presumption that federal agency administrative records will be available to the Census Bureau and other federal statistical agencies, but implementation of the Act is a work in progress.
Drawing from their Census Bureau experience acquiring and linking administrative records to each other and to surveys, Bee and Rothbaum (2019, p. 4) identify additional challenges to using administrative records to improve income estimates. Among the challenges described are that populations (universes) intended to be represented in surveys do not necessarily match those contained in administrative records, and that administrative records can change for reasons unrelated to income changes. There are also practical considerations. The Census Bureau currently lacks access to some useful administrative records or is limited in how it may use certain records.
Even among the set of administrative records that the Census Bureau does access, not all are available nationwide on a recurring basis. Moreover, while the Census Bureau generally has greater latitude in using records for research and (indirectly) for the production of estimates (e.g., for improved imputations), use of records to substitute for responses to survey questions is generally less feasible due to lags in availability of records and restrictions on how some records may be used. As discussed by Bee and Rothbaum (2019), the Census Bureau only has access to states’ programmatic administrative data; currently, the Census Bureau has 19 states with WIC data, 15 states with SNAP data alone, and 15 with both SNAP and TANF data. For the food assistance programs, the fact that states choose whether and when to share their administrative data is problematic and makes incorporating the administrative data more challenging than it is with programs run by SSA.24
___________________
23 See https://www.govinfo.gov/app/details/PLAW-115publ435.
24 See National Academies (2020) for a discussion of progress made toward, and challenges of, coordinating state-level program data in the nation’s consumer food data sets.
6.5. DATA RECOMMENDATIONS FOR THE PRINCIPAL POVERTY MEASURE
The foundational data approach underlying the PPM can be improved by broadening the use of existing data sources. Specifically, the ACS offers data advantages—primarily a larger sample size, which enables smaller geographic and subgroup estimates, and proactive use of administrative records, which offers opportunities to improve income estimates in surveys. The panel notes the continued need for public-use microdata files that make it possible to recreate and evaluate the PPM, just as files are currently available for the SPM.
RECOMMENDATION 6.1: The Census Bureau should prioritize its work to improve poverty measurement using data from the American Community Survey (ACS) as a springboard to the development of an ACS-based Principal Poverty Measure (PPM) that is released, along with the 1-year ACS data, in September of each year. The Census Bureau should also develop guidance for comparing PPM measures in the Current Population Survey Annual Social and Economic Supplement and ACS.
RECOMMENDATION 6.2: The Census Bureau should expand the use of administrative data (income and program benefits) to improve estimates of resources in the Principal Poverty Measure (PPM). Methods should be developed to incorporate state-level administrative data to improve survey-based PPM estimates, and to extrapolate from currently available state data to other states. In particular, the Census Bureau should aggressively explore the strategy of using federal and state administrative records to improve models for imputation for item nonresponse, including nonreporting of receipt as well as amounts.
RECOMMENDATION 6.3: In developing a Principal Poverty Measure that integrates administrative data to the greatest extent possible, the Census Bureau should produce a historical series comparing an experimental Supplemental Poverty Measure (SPM) that aggressively links administrative data into estimates with the SPM produced using current methods. A key aspect of this research should be evaluating how lags associated with administrative data affect data quality. Work can begin immediately on state data for which agreements exist for Census Bureau use.
Several factors make it challenging to produce and release a public-use microdata file for researchers to use in evaluating the PPM. Challenges include the expanded use of administrative data, the depth of geographic adjustments for housing (see Chapter 5), and the utility of geographic and racial/ethnic detail. Currently, the Census Bureau releases all variables necessary to replicate SPM calculations on the CPS-ASEC. It is vitally important that the Census Bureau continue to release high-quality public-use data sets for the CPS-ASEC and the ACS, with all the variables necessary to replicate PPM calculations on the two data sets. Similar to the current public release data, it is essential that any new data sets include detailed thresholds for each household so that researchers can replicate the PPM. Although such thresholds are built on detailed geographic differences, the panel believes that, with the adjustments for medical care, shelter, and eventually childcare, identifying geographic areas using PPM thresholds will be more difficult and thus releasing them will be less risky. While some detailed information may need to be accessed within secure research data centers, the Census Bureau must assess the appropriate trade offs between new disclosure-avoidance methods and the usefulness of PPM data for researchers and other data users, such as mayors of small towns, minority advocates, and policy makers.
6.6. OPPORTUNITIES FOR IMPROVING ESTIMATION OF THRESHOLDS
6.6.1. Improving Reporting and Increasing Sample Size in the Consumer Expenditure Survey
As with income in the CPS, substantial underreporting of spending occurs in CE data. Bee et al. (2015) and Passero et al. (2015) document the spending components in the CE that are much lower than the comparable totals in the PCE series produced by BEA. While food at home is well reported, clothing is underreported in the CE. Issues with underreporting in spending data have been discussed in previous National Academies reports
(National Academies, 2022; NRC, 2013). Both reports recommended alternatives for estimating household spending, including using a household-based scanner recording program and commercial data—e.g., financial records, budgeting software, store loyalty card information—although the proprietary sources are not created to be nationally representative. This panel supports these previous recommendations and any research BLS can conduct to improve estimates of spending in the CE, especially for the components of the SPM basic needs bundle.
It is also critical to use the largest sample feasible for calculating the medians used in the thresholds, but there is a trade off between accuracy (sample size) and timeliness. Current SPM thresholds represent a sample of all CUs with children, which is an improvement on the previous method—which sampled only units with exactly two children—in that it yields a larger CE sample size. The data are equivalized to a common family of two adults and two children using a three-parameter equivalence scale. That is, BLS adjusts each CU’s threshold such that FCSUti is equivalized to two adults and two children. In this process, BLS uses 5 years of data (the panel recommends 3 years for the PPM), adjusting each year to the most recent year using an appropriate CPI for the threshold bundle, and then calculates the median (actually the mean of the 47th–53rd percentiles) spending level. This value is then used to determine the threshold for the two-adult, two-child CU (multiplied by 0.83 and increased by a multiplier of 1.2), which is adjusted by the equivalence scale to obtain the thresholds for the other CU sizes.
For the PPM, the food, clothing, telephone, and internet component of the basic bundle (FCti) could be calculated the same way using the pooled sample over a 3-year moving average and calculating the median and multiplying by 0.83. The motivation for using multiple years is that spending can fluctuate, as was illustrated in atypically dramatic fashion by the spending responses to the COVID-19 pandemic. However, 5 years may be too long a period to smooth spending, since recent fluctuations generally need to be accounted for in a timely manner. It is important to know, for example, the extent to which spiking used car and food prices have impacted family budgets. For these reasons, and because the National Academies’ 1995 report suggested using 3 years of data, this panel believes that the 3-year time frame strikes a reasonable balance between accuracy and timeliness.
RECOMMENDATION 6.4: For estimating the basic needs categories (FCti) in the Principal Poverty Measure (PPM), the Bureau of Labor Statistics should use 3 years of Consumer Expenditure Survey data instead of the current 5 years of data. Expenditures would continue to be inflation adjusted to threshold year dollars using a component-specific Consumer Price Index for All Urban Consumers (for FCti). The inflation adjustment should be consistent with the adjustments made to the other components of the PPM thresholds—housing, medical care, and (eventually) childcare.
6.6.2. Technical Issues—Consumer Unit Universe, Equivalence Scale, Multiplier
The broadest and most representative group of CUs for estimating thresholds for the PPM would include single persons, couples, and all other CU types in the common threshold calculation.25
RECOMMENDATION 6.5: For calculating Principal Poverty Measure thresholds, the Bureau of Labor Statistics should use all consumer units captured in the Consumer Expenditure Survey (CE) (not just those with children) to determine the median values for basic needs categories (e.g., food, clothing, internet). Equivalence scales should then be used to adjust each CE unit to the two-adult, two-child reference (as is done currently for consumer units with children).
Since the basic bundle proposed for the PPM only includes FCti, the economies of scale by family size will differ from those of the SPM. The SPM’s FCSUti bundle includes housing (shelter), which has larger economies of
___________________
25 Based on 5 years of CE Interview Data pooled from 2012 Q2–2017 Q1, Renwick and Garner (2020) presents the following figures indicating the large impact of expanding the types of households sampled:
scale than the other basic bundle categories. While it is unclear how large the economies of scale are for food and clothing (see Renwick and Garner, 2020), estimates suggest that the equivalence scale elasticity for food should be close to 1.0, suggesting the presence of little to no economies of scale.
In the short run, the equivalence scale for FCti can be selected such that the overall scale, including the average FMR housing need, yields a parameter equal to the current three-parameter scale for FCSUti. Alternatively, the FCti scale can be determined following the methods in Renwick and Garner (2020). In the long run, the appropriate equivalence scale will need to be determined individually for the new components of the PPM threshold—that is, for FCti, FMR housing, the basic health plan, and any childcare adjustment. In addition, these component-specific scale adjustments may interact with each other. For example, aggregating the individual adjustments for a single parent with two children who is renting, receives Medicaid, and uses childcare may yield an overall adjustment that suggests fewer economies of scale than would be estimated by considering the economies of scale for the entire spending bundle.
Comments from the call for public input to the panel (see Appendix B), along with other research (Bishop et al., 2018), suggest that the adjustments for adults and children in the current three-parameter scale should be reexamined. Renwick and Garner (2020) estimate alternative equivalence scales based on the idea that scale parameters should possibly differ depending on the ages of children in the household. The adjustments for the basic health plan will depend on the ages of children, and the eventual threshold component for childcare will also depend on the children’s ages. For example, the Child and Dependent Care Tax Credit expansion for 2021 provided a higher benefit to families with children under the age of 6, recognizing the higher cost of care, and USDA’s estimates differ for various age groupings. Additionally, a number of Australian studies have shown that the (nonchildcare) costs of children increase with the age of the child.26 Furthermore, USDA’s Cost of Raising a Child approach (Lino et al., 2017) shows the costs of food increasing with the ages of children. For the derivation of the Thrifty Food Plan (TFP), which is the basis for SNAP benefits, it is assumed that teenage males have a higher calorie requirement than male adults, and hence, households with teenage males have a higher TFP cost.
RECOMMENDATION 6.6: The Census Bureau and Bureau of Labor Statistics should reexamine the use of the three-parameter scale to respecify the basic needs bundle for the Principal Poverty Measure (PPM). This evaluation should include:
- Comparing an overall equivalence scale to component-specific scales for medical care, childcare, and housing, including the impact of using the household as the PPM unit;
- Evaluating whether interactions exist between the component-specific scales;
- Estimating scales for the basic needs bundle of FCti; and
- Evaluating spending patterns to determine whether the scales should reflect children’s ages and other special needs, such as children with disabilities.
This recommendation is very much consistent with one issued by the 2020 Interagency Technical Working Group (BLS, 2020, p. 65) suggesting that an expert panel reexamine the way equivalence scales are applied to income and resource estimates in the SPM.
___________________
26 See, for example, Lee (1989), Tran Nam and Whiteford (1990), Saunders et al. (1998), and Percival and Harding (2005).


