
G
Uncertainty Analysis
An uncertainty analysis of the power density measurements was performed to provide insight into the expected variations of the measurements. This includes the calibration of the instrumentation and also examines the method used to measure the power densities and the reproducibility, or expected variability, of the measurements based on the instrumentation and method employed. We examine Equation 6.7 in Chapter 6 used to determine the calibrated field power densities, Pd(f). The factors in this calibration that impact the uncertainty in the measurement include the accuracy of the instrument, the signal-to-noise ratio of the measurement, both associated with the instrument power measurement P8990B(f), the calibrated RF gain curve NGainrf#1(f), the probe to mast separation, the orientation of the probe, and the calibrated receiver gain curveGr(f).
The Keysight 8990B instrumentation has a NIST Certificate of Calibration number 4156455-49706568-1 for Keysight 8990B Serial Number MY51000300 for the unit owned by Electro-Rent, for a temperature of 23°C ±3°C using procedure ATM-09-E0147.1 The certificate is good for 1 year. All ProVision airport measurements were conducted between January and March of 2016. The stated measurement uncertainty of the instrument is ±0.1 dB (2.3 percent) across its entire operating band.
The signal-to-noise ratio depends on sensitivity of the instrumentation as well as the data collection mode and details of the experiment. The 8990B Peak Power
___________________
1 NIST Certificate of Calibration number 4156455-49706568-1 for Electro-Rent, Van Nuys, Calif., dated August 17, 2015.
Analyzer has a sensitivity limit of –35 dBm with a video bandwidth of 160 MHz that allows the chirp signal to be accurately captured. As shown in Figures 6.20 to 6.25, the typical maximum power measured was near –15 dBm near the beginning of the chirp and falls off to approximately –30 dBm at the upper end of the chirp, with the noise floor located at –35 dBm. This creates a signal-to-noise ratio that ranges from 20 dB (100) to 5 dB (7), which translates to an uncertainty ranging from ±0.043 dB (1 percent) to ±0.79 dB (20 percent).
Another significant factor in estimating the uncertainty is the calibrated net RF receiver power gain, NGainrf#1(f), given by Equation 6.4 in Chapter 6 and shown in Figure 6.17. This term is relatively flat in the 24 to 25 GHz range, decreases by ~5 dB from 25 to 28 GHz, and then more rapidly decreases by ~10 dB from 28 to 30 GHz. This leads to a fractional contribution to the uncertainty from ±0.79 dB (20 percent) below 28 GHz to ±1.76 dB (50 percent) and higher above 28 GHz.
Two additional terms relate to the position and alignment of receiver horn. Friis’ formula, Equation 6.1, depends on the inverse square of the distance between the horns. The uncertainty in the distance measurements leads to contributions of no greater than ±0.05 dB (1.2 percent). Offsets from the boresight or orientation
misalignments lead to small uncertainty contributions because the gain patterns of both horns are very broad and roll off very slowly from boresight in both azimuth and elevation angle for these antenna. These are estimated to be ±0.22 dB (5.2 percent).
The final term to consider in estimating the uncertainty is related to the Gain, Gr(f), that was used in the calibration process. Figure 6.16. shows the measured and calculated values of the antenna gain that were used to estimate the uncertainty to be ±0.26 dB (6.1 percent).
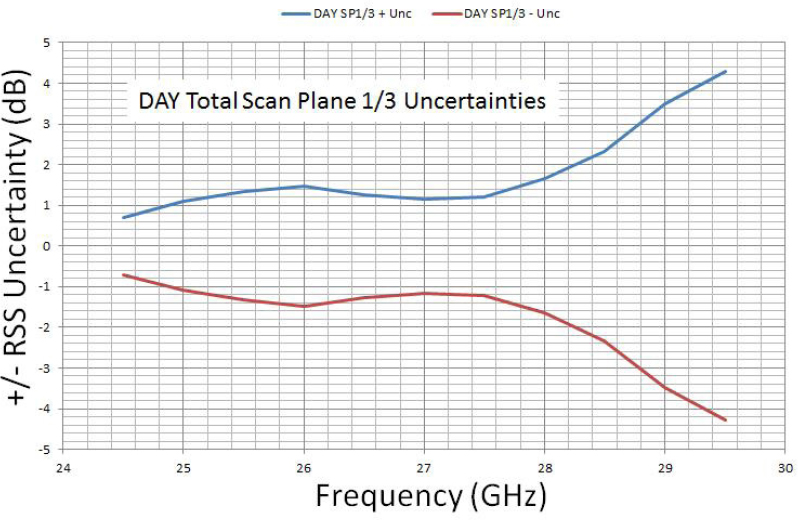
The combination of the above contributions into a total estimated uncertainty is represented in Figure G.1 for the DAY airport results for Scan Planes 1 and 3. This figure shows the envelope of the overall uncertainty in +/- limits as a function of frequency. The main contributions to the frequency dependence is the signal-to-noise ratio and the calibrated net RF receiver power gain, NGainrf#1(f). This analysis is applicable to a single frequency scan at one height, which incorporates five raw frequency averages per point. Near the midrange of a frequency (f ≈ 27 GHz), the uncertainty is ±1.2 dB (32 percent).
The DAY airport uncertainty is a “worse case” because (1) DAY airport used the fewest number of frequency samples per individual linear FM waveform, ~19, and (2) DAY airport’s net system gain, NGainrf#1(f), was the lowest. Therefore, the DAY airport measurement uncertainty estimate is a reasonable bound for all the data sets acquired.


