
2
Primary Sources and Reservoirs of Chemicals Indoors
Thousands of chemical compounds have been documented to exist at measurable levels in the indoor environment, including in air, particles, and settled dust, or on surfaces. These chemicals are emitted into the indoor environment from primary sources that can originate both indoors and outdoors. Primary sources are defined as those that directly emit or release chemicals into the indoor environment, as opposed to secondary sources, which create new chemicals based on reactions between primary precursors. Reservoirs are surfaces or materials that can act as both primary sources and sinks of chemicals in the indoor environment (see Chapter 3). For example, materials used to construct buildings (e.g., wood, insulation, wall coverings, flooring, and wiring) along with the products that are brought into those buildings (e.g., furniture, furnishings, electronics, personal care products, and food) are all indoor sources of chemicals. Cooking generates gases and particles, both from the heat source (e.g., combustion or electric coils) and the food preparation itself, which can differ based on the cooking style (e.g., frying or boiling) and ingredients (e.g., sauces, oils, spices, protein, and vegetables). Other occupant behaviors, such as the use of personal care (e.g., fragrances) and consumer products, as well as the occupants themselves (bioeffluents, which are chemicals of biological origin emitted from humans via breath, desquamation, skin, or other organs), generate chemicals in the indoor environment.
Figure 2-1 illustrates some of these primary emission sources and reservoirs that are considered important in the indoor environment. Primary source emission rates are driven by an array of factors, including human activities, building characteristics, physical parameters, environmental conditions, and spatial and temporal factors. Secondary source emission rates are dependent on some of these same factors, with the additional influences of complex and dynamic indoor chemistry (see Chapter 4).
This chapter first aims to provide an overview of the major types of continuous and episodic primary sources and reservoirs of chemicals in the indoor environment and to describe the dominant factors that affect their emission rates. Next, it summarizes the main classes of compounds emitted from primary sources and reservoirs, their typical concentration ranges if they have been reported in indoor air or dust, and key physicochemical properties that dictate their behavior and lifetime indoors within and across these matrices. The chapter continues by introducing various
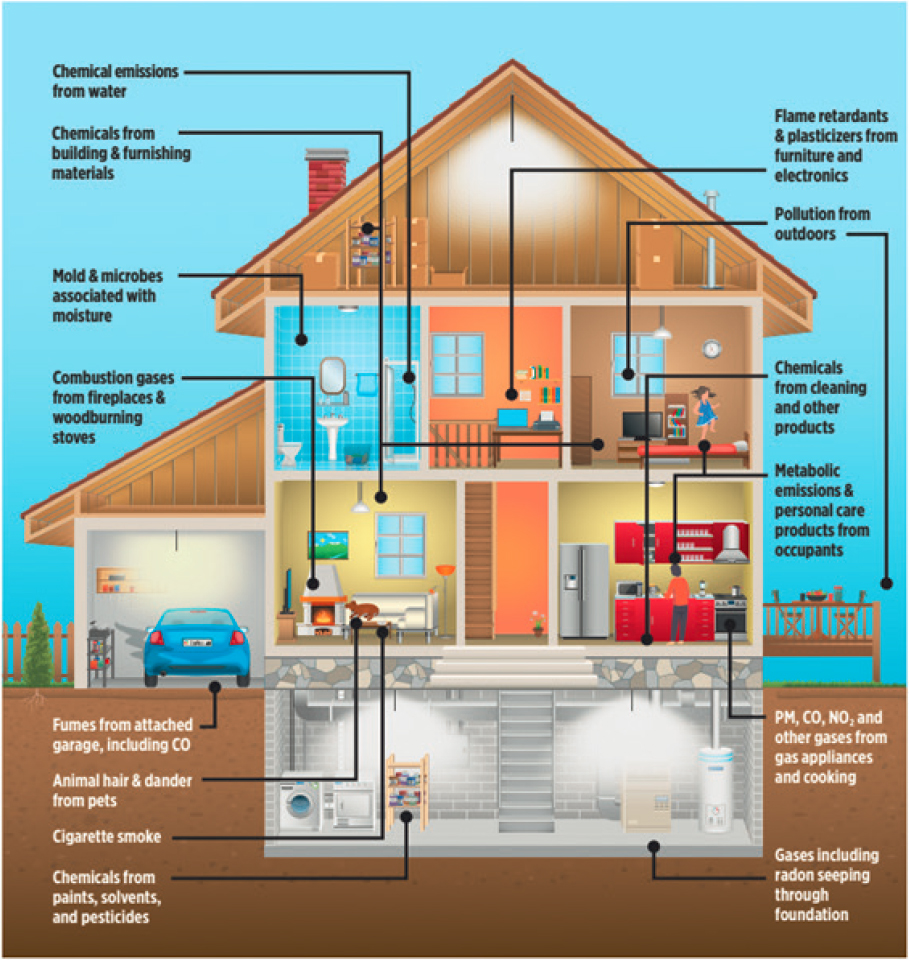
NOTE: CO = carbon monoxide; NO2 = nitrogen dioxide; PM = particulate matter.
approaches to chemical inventories, which are important because they enable more accurate chemical exposure estimates, followed by a discussion of the wide range of analytical approaches that can be used to measure the chemical contents of an indoor space. Finally, the chapter concludes by highlighting emerging chemicals of concern indoors, current sampling and measurement capabilities and limitations, and areas of research gaps and future directions. This chapter sets the stage for the committee’s subsequent discussions of how these primary emissions are redistributed in the indoor environment (Chapter 3) and chemically transformed into secondary sources (Chapter 4).
MAJOR PRIMARY SOURCES, RESERVOIRS, AND FACTORS THAT INFLUENCE EMISSION RATES
Primary sources and reservoirs of chemicals in the indoor environment are numerous and diverse in terms of their origin, chemical composition, and emission rates (EPA, 2021a). They range from continuous (or sustained) to episodic (or intermittent) and can originate indoors or outdoors. Emission rates can be highly variable and are driven or influenced by multiple factors, including human activities, building characteristics, physical parameters, environmental conditions, and spatial and/or temporal factors.
We define continuous sources as those constantly emitting chemicals into indoor environments at rates that may vary due to environmental conditions (e.g., temperature, humidity, and ventilation). When reservoirs (which can both emit and accumulate chemicals, depending on conditions) emit chemicals, they behave like continuous sources. Episodic sources are defined as sources that intermittently, not constantly, release chemicals as a result of discrete events (e.g., humans and human activities such as cooking, cleaning, or the use of products). Emission rates of episodic sources generally depend on operational conditions or occupancy-related and behavioral factors.
Factors that Influence Emission Rates
A wide range of variables influence emission rates of chemicals from primary indoor sources and reservoirs discussed in this chapter, from environmental to building- and human-related. This section introduces and defines major categories of these factors, recognizing that these terms (e.g., spatial and temporal) might be used interchangeably across different research and knowledge domains. Therefore, definitions are given below for the purposes of this chapter and in relation to primary source emission rates. This section intentionally excludes any discussion of absolute source strengths, defined as emission rates in mass per time (Ferro et al., 2004), because these are often modulated based on the scale and specific nature of the source or activity emitting chemicals (e.g., the number of people in a room at a certain time, amount and style of cooking). The subsequent two sections reference these factors as they relate to particular continuous or episodic sources and source categories.
Space (or spatial) factors refer to three-dimensional spatial factors that operate at multiple scales of relevance, starting from the microlevel within materials, to the surface area/volume of a room, the position of rooms relative to each other, the floor level, and the position of a residential unit relative to other units (e.g., in multi-unit apartment buildings). Space can also refer to factors such as the location of the building ventilation intake relative to outdoor sources or street-level emissions. Finally, space can refer to the proximity of major outdoor sources of chemicals and spatial gradients in outdoor (or underground) sources of chemicals that may infiltrate or enter the indoor environment.
Time (or temporal) factors refer to diurnal, daily, or seasonal patterns that may influence concentrations of outdoor pollutants (e.g., traffic emissions, photochemistry, and allergens) and their infiltration rate indoors (e.g., the seasonal operation of heating, ventilation, and air-conditioning [HVAC] systems or the opening of windows). Temporal factors may also relate to patterns of human occupancy or behaviors that occur indoors (e.g., diurnal patterns of waking time or cooking).
Building- and ventilation-related factors include different modes of operating buildings and their ventilation systems (e.g., window and door opening, HVAC systems, recirculation) that influence air change rates, pressure gradients, building age, infiltration rates from outdoors, and indoor emission (e.g., HVAC systems as sources of contaminants) and removal rates (e.g., operating fans, filters, and air cleaners). These can also correlate with weather (i.e., environmental factors) and may have temporal patterns or trends. Removal is discussed in more detail in Chapter 5 of this report.
Environmental factors include temperature and temperature gradients, relative humidity, water activity, and light (intensity and wavelength spectrum).
Human occupancy, activities, and behaviors refer to factors including the presence and number of humans in indoor environments and their activities and behaviors, including both passive (e.g., bioeffluents and dust resuspension due to movement) and active (e.g., smoking, cooking, cleaning, or use of products) impacts.
Having defined these terms, the sections below aim to provide a high-level overview of major categories of continuous and episodic primary sources and reservoirs of chemicals, examples of which are listed in Tables 2-1 and 2-2, and the main factors that influence or drive their emission rates. The categories of sources are not meant to be comprehensive or exhaustive. Emphasis is placed on newer sources or source categories of relevance to indoor chemical concentrations and human exposures and on emerging science within each category.
Continuous Sources and Reservoirs
Building materials are continuous sources of gas-phase emissions in indoor environments. Volatile organic compounds (VOCs) and semivolatile organic compounds (SVOCs) are emitted from many commonly used materials, including wood and wood composites, insulation, plastic piping used for water distribution, electrical cables and wiring, adhesives, paint, surface treatments and coatings, carpeting, and vinyl flooring. Primary emission rates for chemicals inherent to the materials or their production processes have been shown to be highest when new, then depend on the age of materials and environmental factors. Continuous emissions from building materials also occur as a result of reaction processes including ozone chemistry, photochemistry (e.g., in lacquers or paints), hydrolysis (e.g., in floorings), or metabolism (e.g., by microbes and fungi). These transformations are not considered primary sources and are discussed in more detail in Chapter 4. Additionally, legacy continuous emissions of concern from building materials include polychlorinated biphenyls (PCBs) in caulking/sealants, lead in paint, and asbestos. Mass-transfer models are used to estimate emission sources of VOCs and SVOCs from building materials under varying conditions, with emissions depending on the quantity of material, diffusion coefficients, air/material partition coefficients, rate constants for adsorption/desorption, and mass-transfer coefficients. Often these parameters are quantified experimentally, but they can also be estimated using modeling approaches.
Over the past few decades, the types of materials used in building construction have changed significantly, which can lead to differences in chemical emissions to the indoor environment. For instance, the market share of single-family homes built with crosslinked polyethylene plastic water pipes increased from 16 percent in 2002 to 63 percent in 2016 (USHUD, 2018). New or updated building codes and standards are sometimes the cause of changes in the chemical composition of building materials, while other changes are motivated by performance improvements to the materials themselves. For example, due to concerns about moisture accumulation and potential for fungal growth, wallboard is now treated with fungicides; however, new research suggests that some fungicides may be migrating out of the wallboard and accumulating in settled dust (Cooper et al., 2020). In addition, there are growing concerns about the use of recycled building materials, because they can be sources of chemicals that have been deliberately removed from production. For example, polyurethane foam from discarded furniture is sometimes recycled into bonded carpet padding. This practice may inadvertently perpetuate exposure to flame retardants that have been phased out from use due to their persistence and toxicity into the carpet pad (Clean and Healthy New York et al., 2015). In addition, some legacy contaminants that were phased out, such as PCBs, chlordane, and chlorpyrifos, are persistent in indoor environments and contribute to prolonged and chronic exposure in older buildings and apartments, which in some cases can lead to social justice issues.
TABLE 2-1 Primary Source Chemicals Present in Air (Gas and Particle) and Dust Phases in the Indoor Environmenta
| Major Category | Chemical Example or Chemical Class | VP Range (Pa, at 25 °C)b | BP Range (°C)b | Log10(Koa) Rangeb | Example Primary Sources | Concentration Range in Indoor Air (Gas and Particle Phase)c (ppb, mol/molvolume) | Concentration Range in Indoor Dust (ppb, mass/mass) | Concentration Range Referencesd |
|---|---|---|---|---|---|---|---|---|
| Highly Reactive Inorganics | Ozone (O3) | −112 | Outdoor air, electronic air cleaners | 10−1–102 | Nazaroff and Weschler, 2022; Salonen et al., 2018 | |||
| Nitrate Radical (NO3) | - | 10−3 | Arata et al., 2018; Nazaroff and Weschler, 2020 | |||||
| Hydroxyl Radical | - | 10−6–10−5 | Carslaw et al., 2017; Young et al., 2019 | |||||
| Other Inorganics | Carbon Monoxide (CO) | 5.5*105,e | −192 | 0.44e | Outdoor air, combustion | 102–104 | Mullen et al., 2016 | |
| Radon (Rn) | 5.2*104 | 483 | Soil gas | 100–103 Bq m−3 (10−2–101 pCi/L) | Cothern, 1987; Kitto, 2014; Zhukovsky et al., 2018 | |||
| Ammonia (NH3) | 4 | −33.3 | Breath, skin, combustion, concrete containing urea, cleaning agents, cooking | 100–103 | Ampollini et al., 2019; Nazaroff and Weschler, 2020 | |||
| Nitric Acid Nitrous Acid (HNO3, HONO) | 111–541e | Outdoor air, combustion | 10−2–101 | Nazaroff and Weschler, 2020 | ||||
| Nitrogen Dioxide Nitric Oxide (NO2, NO) | −152–21 | Outdoor air, combustion, gas cooking | 100–101 | Mullen et al., 2016; Nazaroff and Weschler, 2020; Zhou et al., 2018 | ||||
| Chloramines (NH2Cl, NHCl2, NCl3) | 486–501e | Treated water, bleach cleaning | 10−1–101 | Ampollini et al., 2019; Mattila et al., 2020 | ||||
| Hypochlorous Acid (HClO) | Cleaning agents | 100–102 | Mattila et al., 2020 |
| Major Category | Chemical Example or Chemical Class | VP Range (Pa, at 25 °C)b | BP Range (°C)b | Log10(Koa) Rangeb | Example Primary Sources | Concentration Range in Indoor Air (Gas and Particle Phase)c (ppb, mol/molvolume) | Concentration Range in Indoor Dust (ppb, mass/mass) | Concentration Range Referencesd |
|---|---|---|---|---|---|---|---|---|
| Organics | Carbonyls (CH2O–C10H20O) (e.g., formaldehyde) | 1.4*101–1.7*105,e | −20.1–208 | 5.1–6.1e | Wood, combustion, paints, carpets, cooking | 100–102 | CA Energy Commission, 2009; Hodgson et al., 2000; Hult et al., 2015; Mullen et al., 2016; Nirlo et al., 2014; Salthammer et al., 2010 | |
| Alkanes (C5H12–C16H34) (e.g., hexane) | 1.3*1021–6.7*104 | 40.9–287 | 2.0–7.5e | Vinyl flooring, wood, petroleum-based products, natural gas | 10−1–101 | CA Energy Commission, 2009; Hodgson and Levin, 2003; Hodgson et al., 2000 | ||
| Carboxylic Acids (CH2O2–CH3(CH2)8COOH) (e.g., formic acid) | 4.9*10−2–5.7*103 | 122–269 | 2.62–7.71e | Outdoor air, breath, wood, cooking, cleaning agents | 10−2–102 | Duncan et al., 2019; Nazaroff and Weschler, 2020 | ||
| Alcohols (C2H6O–C8H18O) (e.g., ethanol) | 4.9*100–7.9*103 | 78.4–194 | 3.25–6.03 | Cooking, solvents, wood, microbes | 100–101 | Hodgson et al., 2000; Licina and Langer, 2021 | ||
| Terpenes (C10H16–C10H16) (e.g., limonene) | 2.1*102–6.3*102 | 155–177 | 4.31–4.52e | Wood, cleaning agents, cooking, spices, citrus, fragrances | 100–102 | Hodgson et al., 2000 | ||
| Aromatics (C6H6–C10H8) (e.g., benzene) | 3.3*100–1.3*104 | 80–218 | 2.78–5.19 | Carpet, vinyl flooring, petroleum-based products | 10−1–101 | Hodgson et al., 2000 | ||
| Halogenated Flame Retardants (e.g., PBDEs) | 8.5*10−8–1.1*100 | 295–642 | 8.5–11.7f | Furniture, electronics, textiles | <10−1 ng/m3 | <105 | Kassotis et al., 2020; Venier et al., 2016 | |
| Organophosphate Ester Plasticizers/Flame Retardants (e.g., TCPP, TPhP) | 2.9*101–3.2*10−6 | 219–466 | 5.8–15 | Furniture, electronics, mattresses, insulation | <103 ng/m3 | <105 | Kassotis et al., 2020; Vykoukalova et al., 2017 | |
| Pesticides (e.g., permethrin, fipronil) | 1.3*10−3–4.3*10−9 | 312–487 | 8.4–11.7f | Wallboard, home treatments, flea and tick preventatives | <103 ng/m3 | 101–105 | Kassotis et al., 2020; Lucattini et al., 2018 | |
| Chlorinated Paraffins (e.g., C10H16Cl6) | 7.3*10−2 | 341 | 8.0 | Sealants, paints, adhesives, surface coatings and textiles | <102 ng/m3 | 104–106 | Fridén et al., 2011; He et al., 2019 |
| Organics | Stain/Water Repellents (e.g., PFAS)g | 2.1*103–2.3*10−5 | 121–325 | 3.5–9.8 | Carpeting/flooring, cosmetics, paint, upholstery | <101 ng/m3 | 101–103 | Hall et al., 2020; Padilla-Sanchez et al., 2017; Winkens et al., 2017 |
| Phthalates/Phthalate Alternatives (e.g., DEHP) | 5.6*10−1–4.7*10−5 | 272–422 | 5.7–11.7f | Flooring, electronics, furnishings | <104 ng/m3 | 102–107 | Kassotis et al., 2020; Lucattini et al., 2018; Lunderberg et al., 2019 | |
| Combustion Products (e.g., PAHs) | 1.3*101–5.9*10−9 | 226–533 | 5.2–11.7f | Smoking, cooking | <104 ng/m3 | 101–104 | Kassotis et al., 2020; Lucattini et al., 2018 | |
| Disperse Azo Dyes (e.g., Disperse Blue 373) | 1.5*10−7–1.3*10−9 | 52 2591 | 10.2–11.7f | Textiles | N/A | 101–103 | Dhungana et al., 2019 | |
| Phenols (e.g., triclosan, BPA) | 8.3*100–3.3*10−8 | 222–437 | 6.3–10.5 | Countertops, personal care products | 10−2–100 ng/m3 | 101–105 | Fan et al., 2019; Laborie et al., 2016; Levasseur et al., 2021 | |
| Antioxidants & UV Inhibitors (plastic additives) | 6.9*10−9–3.9*10−1 | 270–489 | 7.3–11.7f | Electronics, personal care products, lubricants, rubber products | N/A | 101–105 | Tan et al., 2021; Wang et al., 2013 | |
| Surfactants (e.g., octylphenol and nonylphenol ethoxylates) | N/A | N/A | N/A | Cleaning products, personal care products, pharmaceuticals, pesticides | 10−1–101 ng/m3 | 104–106 | Fan et al., 2019; Laborie et al., 2016 | |
| Organotins | N/A | N/A | N/A | PVC, silicone, polyurethane, glass coatings, pesticides | N/A | <103 | Kannan et al., 2010 | |
| Siloxanes | 2.3*1025–5.1*103 | 96–339 | 2.1–11.7f | Building materials, cosmetics, cookware, electrical devices | <103 ng/m3 | 102–105 | Katz et al., 2021b; Lucattini et al., 2018; Tran et al., 2015 |
a Chemicals and classes of compounds listed are not exhaustive. Chemical class properties generally represent the straight chain structures of the class, with ranges shown to represent what has been historically measured in indoor environments.
b Most chemical class properties are taken from EPA’s CompTox Chemicals Dashboard with noted values (a) being estimates rather than experimentally derived data.
c Gas and particle phase concentrations are not reported independently because many of the cited studies sampled bulk air.
d Concentration ranges listed are from referenced literature with household survey and review references prioritized.
e Predicted.
f The upper boundary is a reflection of the OPERA model used to predict log10(Koa), which has an upper boundary of 11.7.
g Values provided reflect the acid/neutral forms.
NOTE: BP = boiling point; BPA = bisphenol A; DEHP = di(2-ethylhexyl)phthalate; PAH = polycyclic aromatic hydrocarbon; PBDE = polybrominated diphenyl ether; PFAS = per- and polyfluoroalkyl substances; PVC = polyvinyl chloride; UV = ultraviolet; VP = vapor pressure; TCPP = tris (1-chloro-2-propyl) phosphate; TPhP = triphenyl phosphate.
TABLE 2-2 Primary Source Chemicals Present in the Particle Phase in Indoor Air
| MASS AND NUMBER CONCENTRATIONS OF PM IN VAROUS SIZE FRACTIONS | |||
|---|---|---|---|
| Size Distributions and Chemical Components of Aerosols | Example Primary Sources | Concentration Range in Indoor Air | References for Concentration Ranges |
| Ultrafine particles, or particulate matter with aerodynamic diameter (da) <100 nm (UFPs) | Cooking, candle burning, heating oiled surfaces, printers and photocopiers | 103–106 particles/cm3,a 103 particles/cm3,b | Bekö et al., 2013; Fuller et al., 2013; Morawska et al., 2017; Slezakova et al., 2018 |
| Particulate matter with aerodynamic diameter (da) <2.5 μm (PM2.5) | Smoking, incense and candle burning, cooking | 100–102 μg/m3 | Balasubramanian and Lee, 2007; Bekö et al., 2013; Habre et al., 2014; Lanki et al., 2007; Morawska et al., 2017; Patel et al., 2020; Polidori et al., 2006; Ryan et al., 2015 Slezakova et al., 2018; Vardoulakis et al., 2020; Zwoź dziak et al., 2013 |
| Particulate matter with aerodynamic diameter (da) <10 μm (PM10) | Dust re-suspension, vacuuming, mechanical abrasion, paint chipping, skin flakes | 101–103 μg/m3 | Chen et al., 2018; Morawska et al., 2017; Slezakova et al., 2018; Vardoulakis et al., 2020; Zwoź dziak et al., 2013 |
| ELEMENTAL COMPOSITION OF PM2.5 GROUPED BY TYPICAL SOURCE | |||
| Chemical Component | Example Primary Sources | Concentration Range in Indoor Air | References for Concentration Ranges |
| Organic Carbon (OC) | Cooking, candles | 100–102 μg/m3 | Brown et al., 2021; Habre et al., 2014; Price et al., 2019 |
| Elemental Carbon (EC) | Infiltration from outdoors, coal, wood, solid fuel combustion, some cooking | 100 μg/m3,c | Balasubramanian and Lee, 2007; Habre et al., 2014; Lanki et al., 2007; Polidori et al., 2006; Sankhyan et al., 2021 |
| Nitrogen (N) | Nicotine (smoking/vaping), nitrogenated compounds from bleach cleaning, particulate ammonium (pNH4) particulate nitrate (pNO3) | Nicotine (in PM10): 102 μg/m3,d pNH4: 10-2–101 μg/m3 pNO3: 10-3–102 μg/m3 |
Chen et al., 2018; DeCarlo et al., 2018; Johnson et al., 2017; NASEM, 2016; Wong et al., 2017 |
| Sulfur (S) | Infiltration from outdoors, aerosolization from water, mercaptans in natural gas | S: 102–103 ng/m3 | Habre et al., 2014; Ryan et al., 2015; Zwoź dziak et al., 2013 |
| Lead (Pb) | Infiltration from outdoors | Pb: 100–102 ng/m3 | Balasubramanian and Lee, 2007; Habre et al., 2014; Ryan et al., 2015; Zwoź dziak et al., 2013 |
| Nickel (Ni), Vanadium (V) | Infiltration from outdoors, residual fuel oil burning for residential building heating | Ni: 100–101 ng/m3 V: 100 ng/m3 |
Balasubramanian and Lee, 2007; Habre et al., 2014; Ryan et al., 2015; Zwoź dziak et al., 2013 |
| Aluminum (Al), Calcium (Ca), Silicon (Si), Iron (Fe) | Resuspended dust, crustal material, soil | Al: 101–102 ng/m3 Ca: 101–103 ng/m3 Si: 101–103 ng/m3 Fe: 101–103 ng/m3 |
Balasubramanian and Lee, 2007; Habre et al., 2014; Ryan et al., 2015; Zwoź dziak et al., 2013 |
| Potassium (K) | Biomass burning | K: 101–102 ng/m3 | Habre et al., 2014; Ryan et al., 2015; Zwoź dziak et al., 2013 |
| ELEMENTAL COMPOSITION OF PM2.5 GROUPED BY TYPICAL SOURCE | |||
| Chemical Component | Example Primary Sources | Concentration Range in Indoor Air | References for Concentration Ranges |
| Chlorine (Cl) | Cooking, cleaning with bleach | Cl: 101–103 ng/m3 | Habre et al., 2014; Mattila et al., 2020; Ryan et al., 2015; Wong et al., 2017; Zwoź dziak et al., 2013 |
| Zinc (Zn) | Infiltration from outdoors | Zn: 101–102 ng/m3 | Habre et al., 2014; Ryan et al., 2015; Zwoź dziak et al., 2013 |
a Secondary data reported in Morawska et al. (2017) based on review of studies using similar UFP measurement instruments in Bekö et al. (2013) and Isaxon et al. (2015).
b Median concentrations from 18 homes within 1,500 m of an interstate highway in Massachusetts in Fuller et al. (2013).
c Reported as absorbance, a proxy for elemental carbon, using an optical method in Lanki et al. (2007).
d Levels reported in PM10 indoors at a vaping conference on 2 separate days in Chen et al. (2018).
Chapter 5 discusses ways in which material substitution or improvements can be used to manage indoor chemistry in more detail, and Chapter 6 discusses exposure disparities.
Furnishings and other materials (e.g., furniture, mattresses, rugs, electronics, toys, and other household items) can contain and emit many of the same chemicals as building materials, with similar criteria affecting their emission rates. Furnishings or other household items often contain additional materials not typically found in the building structure itself such as fabrics and textiles, coatings, adhesives, surface treatments, microplastics, and electronics. The introduction of new chemicals in furnishings and other materials may be accompanied by novel emissions that are not yet well characterized or understood. One example of new chemicals found in the indoor environment is the identification of azo dyes in dust samples (Kutarna et al., 2021). Azo dyes are chemicals containing -N=N- bonds; some chemicals in this category are chlorinated and brominated, and many are toxic, carcinogenic, and can bioaccumulate (Berradi et al., 2019). Azo dyes are broadly used in the manufacture of clothing, furniture textiles, and rugs, constituting 70 percent of the world’s annual production of synthetic dyes, and have been identified in common children’s clothing and house dust (Ferguson and Stapleton, 2017; Overdahl et al., 2021). New research also shows that volatile neutral per- and polyfluoroalkyl substances (PFAS) can be elevated in indoor air in kindergartens and certain retail or commercial spaces like carpeting stores, suggesting that inhalation may be a more important exposure route than previously thought for PFAS and their breakdown products (Morales-McDevitt et al., 2021).
Dust is material that builds up on surfaces that can be mechanically removed (e.g., by wiping, vacuuming, or scrubbing) or resuspended in the air when disturbed. In addition to settled particles, dust can contain fibers (e.g., textiles, and pet and human hair), crustal and abrasion material, and biological material (e.g., bacteria and viruses, pollen, fungi, dust mites, endotoxins, and skin dander). Dust is a reservoir for a variety of metals, VOCs, and SVOCs, acting at times as a sink or a source. Dust generally can be considered a continuous reservoir because it emits chemicals at a rate that is dependent on environmental conditions, especially temperature and relative humidity. Concentrations of chemicals measured in dust can also be used to infer concentrations in other indoor compartments (e.g., air, surface films) if the system is in equilibrium (Parnis et al., 2020). When indoor human and pet movements resuspend dust, it can also be an episodic source of suspended particles, with rates dependent on occupancy, activities, and behaviors.
The migration of chemicals from buildings, materials, and consumer products into dust can mimic the pathways that lead to human exposure. This suggests that the chemical composition of dust can be representative of personal exposure to some chemicals in the indoor environment.
As an example, studies have shown that house dust concentrations of some chemicals, such as flame retardants and plasticizers, are correlated to internal dose for home occupants (Percy et al., 2020; Stapleton et al., 2012). Due to this association, there is increased focus and attention on house dust, including a push by researchers to characterize house dust using non-targeted mass spectrometry approaches to support identification of other chemicals that may be of concern for human exposure (Ouyang et al., 2017; Ulrich et al., 2019).
Biological materials such as microbes, endotoxins, and pests can also be considered continuous indoor sources of VOCs, allergens, and irritants. Their emission rates are largely dependent on environmental factors such as temperature and moisture, with warmer temperatures and wetter conditions leading to increased concentrations of fungi indoors. Emission rates of fungal spores can also be influenced by mechanical ventilation and vibration or disturbance by air currents as well as humidity. The abundance of dust mites in dust correlates with higher indoor humidity levels (D’Amato et al., 2020). Cockroaches, rodents, dust mites, and pets are known sources of allergens especially for individuals with asthma and in lower-income, urban homes (Ahluwalia et al., 2013; Eggleston, 2017). Exposure to dust mites and endotoxins in farming communities is also associated with shaping the innate immune response and conveying protective effects especially in terms of lowering asthma prevalence (Stein et al., 2016). Outdoor plant-based allergen concentrations such as weed, grass, or tree allergens can be driven by seasonal patterns, and these temporal patterns may also vary geographically (e.g., peak concentration season varies in timing, duration, and intensity by region) (Schmidt, 2016). Spatial factors, such as proximity to farming facilities and rural versus urban environments, are associated with greater concentrations of endotoxins in indoor dust (Barnig et al., 2013). Ventilation-related factors, such as window-opening, central air conditioning, and particle filtration, can significantly influence infiltration rates of these biologicals indoors. New analytical techniques allow the quantification of microbial VOC (mVOC) emissions in laboratory settings as a function of microbial respiration, life stage, and substrate (Misztal et al., 2018). Recent efforts have demonstrated mVOC composition from sinks and showers may be more stable than the underlying microbial communities, which can be highly variable in space and time in response to environmental conditions (Adams et al., 2017). The need to quantify the diversity of microbial species that influence indoor air across a variety of indoor environments and materials remains (Bekö et al., 2020; Prussin and Marr, 2015).
Infiltration from interstitial and buffer spaces within a residence, or from neighboring units in multi-unit residential or occupational settings, can be considered a continuous source of chemicals indoors. Emission rates in these spaces depend on temperature gradients between outdoor and indoor surfaces as well as proper sealing and mechanical ventilation. Attached garages (or parking structures in occupational settings) have been shown to introduce hydrocarbons and other pollutants in indoor air. Emission rates also depend on building ventilation and design, air change rates, and the relative position of air intakes to these sources (spatial factors). Wind shear and vertical temperature and pressure gradients create chimney or stack effects within multi-unit apartment buildings, especially high rises, and can also play a role in introducing chemicals indoors from underground or outdoor sources, transferring chemicals within and across units, and accumulating chemicals in elevated floor levels (Man et al., 2019). Connected central ventilation systems and structures can also act as sources of chemicals infiltrating from nearby residences, with secondhand environmental tobacco smoke being a well-known example (Snyder et al., 2016). Not all chemicals in indoor air come from visible spaces. Attics, crawl spaces, and dry wall cavities have been found to contain VOCs emitted from insulation materials, paint, and fungal growth into indoor spaces. Most building materials are porous to some extent, allowing the transport of VOCs through the materials (Xu and Zhang, 2011). Building envelope materials can be sources of chemicals that migrate into the indoor air. Aliphatic alkanes only found in a building envelope air barrier have been measured in the indoor air of a house (Poppendieck et al., 2015). The extent to which VOCs migrate through
building materials depends on the material, environmental factors, and the individual chemical. Studies investigating these three factors have been largely limited to wallboard, relative humidity and/or temperature, and a limited number of chemicals (e.g., formaldehyde) (Tran Le et al., 2021).
Outdoor air is a continuous source of particulate matter (PM), ozone, VOCs and SVOCs, and other chemicals. Entry rates depend on natural and mechanical ventilation by opening windows and doors, operating HVAC systems that bring in outdoor air, or infiltrating through small cracks and openings in building structures that, taken together, determine air change rates. Important spatial and temporal factors, including the proximity of the building air intake to outdoor sources of these chemicals (e.g., to street-level car exhaust) and the building’s location relative to nearby outdoor sources (e.g., roads and industrial facilities), also influence emission rates. Spatial gradients or patterns can also vary at regional or global scales (e.g., wildfire smoke, ozone, dust storms). Temporal factors influencing rates of chemicals infiltrating from outdoors into indoor environments include diurnal or weekday/weekend patterns (e.g., traffic-related nitrogen oxides [NOx] and ozone) and seasonal patterns (e.g., ozone or allergens). Climate change–related factors influencing infiltration of outdoor chemicals (e.g., increased wildfires, increased temperatures) could also operate at longer timescales of years and decades (Field, 2010; IOM, 2011; Lee et al., 2017; Liang et al., 2021).
The chemical composition and size distribution of aerosols changes as particles move from outdoors to indoors. During cool outdoor weather, chemicals on outdoor particles moving into warmer indoor spaces volatilize into the gas phase. During warmer outdoor weather, the opposite occurs, and indoor chemicals partition onto aerosols of outdoor origin (Avery et al., 2019b; Cummings et al., 2021). Recent measurements have shown that variation in partitioning onto outdoor aerosols migrating indoors is dependent upon the aerosol water liquid fraction, which is a function of temperature and relative humidity. Neglecting this phenomenon can result in errors on the order of 40 percent to 400 percent when modeling the chemical composition of aerosols (Cummings et al., 2021).
Intrusion of chemical vapors from underground sources is also a continuous source with significant spatial and geographic variability influencing its entry rates. Pesticides, solvents, chemicals from leaky underground storage tanks, contaminated soil and groundwater, and radon gas are some of the sources falling under this category. Examples include VOCs like toluene, trichloroethylene (TCE), perchloroethylene, formaldehyde, and petroleum products (Provoost et al., 2011). Temperature gradients, vertical space, and building design are important factors influencing emission rates (Ma et al., 2020; Unnithan et al., 2021). Stack effects in buildings can also enhance the intrusion rates of these chemicals indoors, depending on building envelope tightness and weatherization (Francisco et al., 2020; Pigg et al., 2018).
Chlorinated solvents, such as TCE, are increasingly recognized as potentially hazardous chemicals that can enter the indoor environment through vapor intrusion (Forand et al., 2012). In 2021, California issued new draft vapor screening guidance in an effort to provide more consistency in evaluating exposure and health risks despite the challenges of significant spatial and temporal variability in subsurface and indoor air concentrations. The lack of data and high degree of variability in space and time of both sources and concentrations in indoor air has been described as a challenge by both the U.S. Environmental Protection Agency (EPA) and California guidance documents and in the literature (Johnston and Gibson, 2015).
Radon gas concentrations are usually highest in underground levels and basements, with greater soil permeability and fractures in foundations of homes increasing intrusion rates indoors (Kellenbenz and Shakya, 2021). Although inconclusive, some studies have hypothesized that increased building weatherization and modern construction could potentially lead to higher radon exposure in North American indoor residential environments, despite wide geographic variability in the geologic distribution of radon and its precursor minerals, like uranium, thorium, and radium
(Stanley et al., 2019). Naturally present radon gas (222Rn) and its decay products, like lead and polonium, are widely recognized as an indoor air concern and a risk factor for lung cancer (Darby et al., 2005; Krewski et al., 2006). Recent work has shown that 222Rn progeny in the form of radioactive nuclides can react with water vapor and gases to form clusters. These clusters attach onto particle surfaces, emit high energy radiation, and get transported into the lungs and human body with inhaled PM, which essentially acts as a delivery vector (Liu et al., 2019). Several recent studies reported that radon gas exposure as a surrogate of gross α-, β-, and γ- particle radioactivity, or directly measured particle radioactivity on filters (Liu et al., 2020), might potentially explain differential toxicity of PM2.5 seen in health studies (Blomberg et al., 2019; Huang et al., 2020, 2021; Papatheodorou et al., 2021).
Episodic Sources
Humans and human activities, in terms of occupancy and behaviors, are an important episodic source of indoor chemicals. This category encompasses several classes of compounds in gas- and particle-phase emission processes, given the complexity of human activities and their interactions with the indoor environment. They are considered episodic, since emissions only occur when humans are present or performing certain activities. Types of sources falling under this category include metabolites excreted from skin (e.g., ammonia; see Li et al., 2020) and breath (e.g., carbon dioxide [CO2], VOCs; see Tang et al., 2015) or other human excretions; desquamation and hair; microbes (bacteria and viruses; see Yang et al., 2021); generation of chemicals through activities such as cooking, smoking (Wallace and Ott, 2011), and burning candles (Afshari and Ekberg, 2005); use or manufacture of illicit drugs (Kuhn et al., 2019); use of disinfectants and cleaning products (Afshari and Ekberg, 2005); use of personal care products (e.g., fragrances and lotions); application of pesticides and insecticides; use of air fresheners; operation of HVAC systems; and the act of vacuuming and moving around that might resuspend or re-entrain settled dust, its components, and larger PM size fractions (e.g., PM10) in indoor spaces.
Next, some of the major sources that fall under this category are discussed, recognizing that humans and human activities as an episodic source is too broad of a topic to cover comprehensively here. For example, cooking emits pollutants based on the fuel source, as well as the range of activities that contribute to food preparation, including CO, CO2, NO/NO2 (gas combustion or other high temperature combustion), organics, ultrafine particles (UFPs), and fine particles (Bhangar et al., 2011; Patel et al., 2020; Wallace et al., 2004; Wallace and Ott, 2011). Emission rates depend on fuel type (Wallace et al., 2008), cooking method (e.g., frying emits more UFPs than boiling or steaming), food types (e.g., oils or meats), temperature, duration of time, and cooking surface materials. Emission rates can exhibit diurnal or day of the week patterns that mimic typical human time-activity patterns (e.g., meal time peaks). Consumer products (e.g., cleaners, disinfectants, pesticide applications on pets or in the home/garden, and room air fresheners) and personal care products introduce chemicals to indoor environments episodically during and following their use. Near-field exposure depends on product formulations, which chemicals are released, how much, where the chemicals reside (e.g., dust or air), and human presence and activity level. Humans can also introduce “take-home” chemicals into the indoor environment on clothes—for example, lead, asbestos, and pesticides from occupational settings (Kalweit et al., 2020). A recent study in a German movie theater found that third-hand smoke is an important source of exposure in nonsmoking indoor environments, where VOCs, hazardous air pollutants (e.g., benzene and formaldehyde), and nicotine can off-gas from clothing of moviegoers and partition onto aerosols and dust (Sheu et al., 2020). Temporal factors (time of day and day of the week patterns corresponding to work schedules) and environmental factors (temperature, relative humidity) influence these emission rates. Home renovations and repairs can introduce new building materials and cause
novel emissions owing to the materials used. Considerations for emissions are similar to building materials as described above for continuous sources. HVAC operation may appear like a periodic source impacting indoor air chemical composition. Dust coated heating coils can act as a reservoir of SVOCs, taking up and releasing them as a function of temperature or moisture. Water condensing on cooling coils or other parts of the HVAC system can take up and release soluble gases. Wet surfaces in the HVAC system may also promote biological activity and thus act as a primary source of mVOCs or promote chemical transformations that take up some and release other chemicals. Temporal factors, like time of day, and environmental factors, like weather, influence these emission rates.
The personal cloud effect is a term referring to increased concentrations of chemicals found near or around humans in their immediate surroundings. The personal cloud is the result of several factors that include, but are not limited to, bioeffluents, personal care products, reactions with skin and clothes, and the thermal plume (air moved upward over the torso as adults release about 100 W of heat). Hence, human presence is a direct episodic source of indoor chemicals. While the personal cloud effect is well documented (Licina et al., 2017; Wallace, 2000; Weschler, 2016), several recent studies have characterized emission rates of human activities in indoor environments, including the effects of a crawling infant on dust resuspension (Hyytiäinen et al., 2018; Wu et al., 2021a) and the movement and heat from sleeping resulting in VOCs and SVOCs being released from the bedding environment (Boor et al., 2014, 2017). Recent work also shows that SVOCs adsorbed to the surfaces of cooking pans and burner coils can desorb and form UFPs when heated (Wallace et al., 2008, 2017).
Pets also emit chemicals into the indoor environment, though pets are considered a less significant episodic indoor source than humans. These emissions include biologicals (e.g., metabolites in breath or urine, dander, microbes) emitted directly from pets, chemicals applied to pets (e.g., flea and tick treatments), or chemicals brought indoors from the outdoor environment (e.g., allergens, pollen, metals, pesticides) on pet hair or feet, especially for animals that spend time indoors and outdoors. Pets and human occupants are known sources of ammonia (NH3) indoors (Ampollini et al., 2019; Ito et al., 1998), with one recent study showing a correlation between presence or number of pets indoors and NH3 concentrations, especially with warmer temperatures (Uchiyama et al., 2015). Cat litter boxes or other forms of indoor pet waste storage can be important sources. Pets’ urine contains urea, which decomposes anaerobically to release ammonia. Very few studies have measured emission rates of NH3 from pets indoors; however, these are now more feasible with recent developments in on-line ammonia analyzers. Agricultural environments and extreme environments (e.g., hoarding) can also have high concentrations of NH3.
Water-sourced chemicals released from domestic water use indoors in gas or aerosol form include brominated, chlorinated, and nitrogenated compounds; mineral aerosols; SVOCs; and biologicals. Chlorine and chloramines are disinfectants added during drinking water treatment. They can react with natural organic material to form trihalomethanes, which can be released into indoor air via showers, dishwashers, and washing machines (Gordon et al., 2006). Detergents used in dishwashers can release hypochlorous acid (Dawe et al., 2019) and react with organics to release further chemicals, including chloroform (Olson and Corsi, 2004). In addition, water delivery systems and source waters can become contaminated, delivering chemicals to the indoor environment, especially after forest fires (Omur-Ozbek et al., 2016; Proctor et al., 2020). Depending on geography and source water quality and contamination levels, emission rates can vary significantly between regions. Seasonal trends can also be at play (e.g., concentration of chemicals and dilution rates will depend on seasonal rain, area discharges and runoff, and surrounding land uses, such as agricultural spraying).
Recent studies have reported elevated concentrations of chemicals such as trace metals, elements, and VOCs in water supply systems following wildfires. These chemicals have been detected
in water bodies and water delivery systems in the immediate vicinity of wildfire-impacted areas, as well as further downstream, depending on the environmental transport pathways involved (Burton et al., 2016; Tecle and Neary, 2015). Chemicals detected in water systems post-wildfire also differ depending on the fuels involved, with wildland fires releasing lead, iron, cadmium, mercury, and other metals that have potentially deposited in mature trees over decades. Fires in the wildland-urban interface, on the other hand, can involve furniture, building materials, plastics, and other man-made products, releasing chemicals such as pyrolyzed organic carbon, benzene, and other new and potentially unknown chemicals (Bladon et al., 2014; Proctor et al., 2020). In turn, these chemicals can be aerosolized or volatilized after making their way indoors via the drinking water supply, influencing indoor chemistry in ways that are yet to be fully understood.
CLASSES OF COMPOUNDS IN INDOOR ENVIRONMENTS
While some chemicals are well characterized and studied in indoor environments from the perspective of understanding exposure (e.g., radon, ozone, CO, NO2, lead, and some VOCs), other chemical classes have only recently been identified in the indoor environment (e.g., disperse azo dyes and ultraviolet [UV] stabilizers). Tables 2-1 and 2-2 present a summary of several chemicals and chemical classes that have primary sources and reservoirs in the indoor environment, in the gas, dust (Table 2-1), and aerosol (Table 2-2) phases. This is not an exhaustive or complete list but rather a list to highlight examples of some of the more common or novel chemicals that stem from sources and/or reservoirs and are of concern for the indoor environment.
It is also important to note that some of the chemicals listed in the tables can have both primary and secondary sources, and the concentration ranges listed may reflect both primary and secondary sources. For instance, the primary source of hypochlorous acid is cleaning solutions, which can directly release, or in some cases react with the indoor environment to produce, chloroform, carbon tetrachloride, chloramines, nitrogen trichloride, and chlorine gas (Mattila et al., 2020; Odabasi, 2008; Wong et al., 2017). Surface reactions of nitrogen dioxide (NO2) are also considered important secondary sources of nitrous acid (HONO) indoors (Collins et al., 2018).
As shown by the information presented in Table 2-1, concentrations of some chemicals are abundant in indoor air, while others are abundant on surfaces and in indoor dust and airborne particles (refer to Table 2-2 for aerosol phase). These differences are attributable to their physicochemical properties and use patterns. In particular, chemicals with high vapor pressures are often more abundant in the gas phase of indoor air, and chemicals with lower vapor pressures (and thus higher log10(Koa) values) are more abundant in the condensed phase. The wide range in concentrations within many of these chemical classes is evident, even though most of the reported values are from time-averaged sampling of continuous sources. These concentration differences are related to a number of factors and indicate the high degree of variability observed in indoor environments.
Aerosols
An aerosol is defined as a stable suspension of solid or liquid particles in air. Aerosol particles, which are also known as PM, contain a variety of organic and inorganic chemicals (NASEM, 2016). PM also exhibits a wide size distribution in indoor environments, and some of its components, especially SVOCs, may shift from the particle phase to the gas phase and vice versa as they move indoors from outdoor environments or depending on changes in indoor environmental conditions.
While airborne PM occurs indoors in a wide range of sizes, with aerodynamic diameters ranging from a few nanometers (nm) to ~100 micrometers (μm), referred to as Total Suspended Particles, this section will focus on three size fractions of highest relevance to indoor aerosol exposures and associated health risks. For a more detailed discussion of indoor PM chemical composition,
size distributions, and health risks, refer to Health Risks of Indoor Exposure to Particulate Matter: A Workshop Summary (NASEM, 2016).
These size fractions are defined as follows:
- UFPs are most commonly defined as particles with an aerodynamic diameter ≤100 nm. However, the definition of UFPs can vary across fields and disciplines, with some referring to particles ≤10 nm (e.g., emissions standards) and others to particles ≤200 nm (e.g., health disciplines) as UFPs. These are emitted from primary combustion or formed by conversion indoors. They are similarly formed outdoors and can be transported indoors via infiltration and ventilation. Given their negligible mass, UFPs are usually reported in particle number concentrations (particles/cm3). They span a wide size range and tend to exhibit diffusion-driven behavior in the lungs especially in the smallest size range (<10 nm) (Oberdörster, 2001; Oberdörster and Utell, 2002). Larger UFPs (generally >10 nm) have a much higher surface-area-to-mass ratio compared to larger particles and are thus efficient at transporting chemicals adsorbed onto their surfaces into the alveolar region of the lungs. UFPs are also very efficient at crossing the alveolar epithelial tissue into systemic circulation and reaching other organs (Schraufnagel, 2020). Computational fluid dynamics simulations demonstrate that very small nanoparticles (1-2 nm) will deposit in the olfactory region of the human nose to a larger extent than larger UFPs (>10 nm) (Garcia et al., 2015). Some nanoparticles deposited in the olfactory region during inhalation might undergo direct transport along the olfactory nerve to the olfactory bulb (Elder et al., 2006) raising concern about possible neurological effects (Lucchini et al., 2012).
- Fine particles (PM2.5), or particles with an aerodynamic diameter ≤2.5 μm, are usually emitted from primary sources like combustion and secondary formation indoors and reported in mass concentrations (μg/m3). If inhaled, PM2.5 deposits in the tracheobronchial and alveolar regions of the lungs and has been associated with a multitude of adverse health outcomes (Dominici et al., 2006; Pope and Dockery, 2006).
- PM10, or particles ≤10 μm in aerodynamic diameter, are typically primary in nature, emitted from mechanical abrasion, natural sources (e.g., sea salt), and dust resuspension and are reported in μg/m3. Notably, PM10 is considered a subset of larger particles often referred to as “super-coarse” which can reach up to 100 μm in aerodynamic diameter. Coarse PM, typically defined as PM between 2.5 and 10 μm in aerodynamic diameter, primarily deposits in the upper nasopharyngeal region of the lungs and is cleared with mucociliary transport.
Organic compounds as a class usually make up a significant portion (~40–70 percent) of the mass concentration of indoor PM2.5 (Habre et al., 2014; Polidori et al., 2006; Turpin et al., 2007). Similarly, particulate sulfates, nitrates, ammonium, and water can be present in larger concentrations, as compared to elemental carbon (EC), trace elements, and metals such as nickel, vanadium, and iron, which are usually present at lower concentrations (NASEM, 2016).
The composition of PM will vary based on the source or process generating it (Habre et al., 2014). It is important to note that PM2.5 in itself is considered a mixture, and the concentration of species within PM2.5 will depend on the major sources contributing to indoor PM2.5 concentrations, including those of indoor and outdoor origin, which also vary based on spatial, temporal, and other factors, as described in the next section. For example, concentrations of lead and arsenic in indoor PM2.5 might be elevated in residences or schools near battery recycling and lead smelter facilities (Meyer et al., 1999). Similarly, concentrations of EC might be higher inside homes that burn solid fuels (e.g., coal or wood) for heating or cooking. Indoor concentrations of UFPs in homes located within 100 m of a major interstate highway in Massachusetts were higher than in homes
>1,000 m away (Fuller et al., 2013). See Chapter 6 for a discussion of the settings and determinants that correlate with higher exposure to indoor PM.
Table 2-2 contains typical mass (or number, in the case of UFPs) concentrations of indoor aerosols across size fractions and typical concentrations of organic and elemental components of PM2.5 as a more well-studied example of indoor aerosols. Elements and metals are grouped together where they are known to originate from a specific source or source category. Where available, the reported concentrations are for daily, 48-hour, or weekly time-averaged or integrated measurements primarily from studies of real indoor environments (versus laboratory or chamber experiments) and do not capture peak concentrations or episodic sources. References from the House Observations of Microbial and Environmental Chemistry (HOMEChem) study, which simulated a realistic indoor environment, are the one exception to this rule. These are also examples meant to illustrate the wide range of variability in indoor concentrations reported in the literature. They include data from residential, office, and school settings, and from the United States and international studies, but they are not meant to be comprehensive or representative of all types of indoor environments, geographies, or time periods.
As with Table 2-1, many of these aerosols and their components have both primary and secondary sources indoors; however, Table 2-2 does not include secondary organic aerosol (SOA). Formation of SOA indoors is covered in more detail in Chapter 4 of this report.
INDOOR CHEMICAL INVENTORIES
EPA’s Toxic Substances Control Act (TSCA) Chemical Substance Inventory contains more than 33,000 active (and more than 34,000 inactive) registered chemicals for use in the United States (EPA, n.d.). A recent study attempted to catalogue the regional and national chemical inventories for the first time (Wang et al., 2020). An interesting result from this study was that of the ~350,000 chemicals in the inventory, approximately 50,000 were classified as confidential, and about 20 percent (~70,000) were ambiguously described. Global chemical inventories for plastic production alone exceed 10,000 different chemicals (Wiesinger et al., 2021).
Thousands of chemicals are present in indoor environments that potentially can be released into indoor air. Inventorying chemicals and their concentrations in the indoor environment enables more accurate chemical exposure estimates, including for chemicals whose indoor source may be unknown. Cataloguing all the chemicals present in indoor air can theoretically be addressed by two major approaches: bottom-up inventories, which determine the chemical composition and/or emissions of every indoor object; or top-down inventories, which measure the total chemical composition of the gas, particle, dust, and surface phases.
Bottom-Up Inventories of Chemicals in Indoor Environments
A bottom-up approach determines the chemical composition of or emission from every material, item, or product found indoors, including the wide range of examples found in this chapter thus far. Two drivers currently exist for measuring emissions from building materials in a bottom-up manner. First, there are regulatory limits for the emission of certain chemicals in some countries—for example, EPA’s Formaldehyde Emission Standards for Composite Wood Products Act, which limits formaldehyde emission from composite wood products. Second, there are building product certification programs that can be regulatory or voluntary—for example, GREENGUARD, Blue Angel, AgBB, natureplus, and EU Eco Flower. However, these schemes are generally limited to building products, focused on more volatile chemicals, and tested under only one set of chamber parameters (e.g., ASTM International, 2016a), and they can limit reporting to summarizing parameters such as total VOC that lack the detail needed to fully inform indoor chemistry.
Ideally, the potential exposure and health risks could be evaluated in a bottom-up approach prior to use of a new product or chemical by, for example, requesting toxicity testing before production and marketing. Hundreds of chemicals are now submitted annually to EPA for screening-level assessments under the TSCA Premanufacture Notice (EPA, 2021b), some of which are used in building materials and furnishings. These screening-level assessments use manufacturer-supplied data, and often limited data are available to conduct a thorough assessment of risk. With the signing of the Lautenberg Chemical Safety Act in 2016, TSCA was amended to support more detailed risk assessments for chemicals of potential concern. As a consequence, 20 priority chemicals are selected from the TSCA inventory every 3 years to undergo a detailed risk assessment using the best-available science. However, chemicals in circulation prior to the TSCA being passed in 1976 are not necessarily assessed. In addition, many chemicals in the TSCA inventory are classified as confidential business information, often preventing disclosure of risk assessment information. Furthermore, companies are not required to disclose the chemical name or structure in a Safety Data Sheet (SDS), thus making it challenging to know what chemicals are in some materials and products. As a result, chemicals of concern are identified after their use, rather than prior to their use, in the United States.
PCBs are an early case study demonstrating how chemicals can migrate from the original products to become widespread and persistent in the indoor environment. In 1966, PCBs were first discovered in the environment after a Swedish chemist, Soren Jensen, accidentally discovered PCBs when he was analyzing bird tissues for dichloro-diphenyl-trichloroethane (DDT) (Jensen, 1972). PCBs had been on the market since 1929, yet it was not until this accidental discovery 37 years later that scientists became aware of their ubiquitous contamination in the environment. Production of PCBs was banned in the United States in the 1970s, and it was not until the 1990s that production finally ceased in other parts of the world; however, even today, these chemicals are still found in indoor air and dust in homes and schools (Andersen et al., 2020; Bannavti et al., 2021; Herrick et al., 2016; Marek et al., 2017). In addition to PCBs, a more recent discovery of this type was made about flame retardants (Box 2-1). These case examples suggest the need to use bottom-up inventories to understand chemicals present in indoor products and the risks they pose before they become common indoor pollutants.
This migration of chemicals from products into the indoor environment highlights how important it is to understand chemicals present in indoor products, and the risks they pose, before they become a common indoor contaminant. However, this bottom-up approach is often stymied by the lack of information about the composition of the building materials and consumer products that exist in the indoor environment. Even when products list their contents, trace or contaminated product chemical components may not be listed. New composition or emission testing requirements of indoor products could help mitigate health risks.
Top-Down Inventories of Chemicals in Indoor Environments
A top-down approach to determining the presence and abundance of chemicals in the indoor environment requires sampling the gas, particle, dust, and surface phases and conducting a comprehensive chemical analysis. Top-down analyses have two major limitations:
- Top-down analyses are limited by the representativeness of the environment that is sampled. Every indoor environment contains different materials, products, and people; furthermore, each indoor environment is operated differently with respect to heating, cooling, and ventilation and is affected differently by weather and geography. As discussed earlier in this chapter, all of these factors can impact the chemical identity and intensity of emissions. Indoor spaces will also vary by their function or intended use (e.g., chemicals present in residences, schools, and office buildings can vary based on products placed within them or occupancy and building operation characteristics). This means that effective top-down inventories need to sample large numbers and types of indoor environments over a wide range of conditions to obtain representativeness.
- Top-down analyses are also limited by the ability to detect specific chemicals at high spatial and temporal resolution in quickly changing or dynamic environments. Historically, targeted analyses (i.e., quantification of known chemicals determined a priori) of specific chemicals in the indoor environment were conducted but were limited in number and classes of chemicals due to feasibility. However, recent analytical and instrumental advances have led to greater sensitivity for detecting chemicals at lower concentrations (i.e., lower detection limits), and the increasing use of non-targeted analyses is revealing the presence of chemicals in indoor air, particulates, and dust that were unknown until recently. Box 2-2 discusses one such example.
ANALYTICAL METHODS AND CHALLENGES
Bottom-up and top-down inventories require quantification of chemicals present in consumer products and in gas, particle, dust, and surface phases. Chosen methods for analyzing indoor environments need to be fit for purpose. Fit-for-purpose considerations include sampling cost, detection limit, time resolution, duration, and ease of use. For instance, samples collected to inform average (e.g., daily or weekly) or long-term (e.g., monthly to annually) exposure modeling might include passive or time averaged sampling methods. Samples collected to understand indoor gas-phase chemical reaction and transformations (e.g., after a cleaning event) may require continuous, high temporal resolution (on the order of seconds) analytical techniques. Recent advances in analytical techniques and application of outdoor measurement technologies and methods to indoor air quality have decreased detection limits of known indoor compounds, increased the number of different chemicals detected in the indoor environment, and increased the time resolution of samples. The following sections briefly describe both traditional techniques and new approaches to chemical analysis in the gas, particle, dust, and surface phases.
Trace Gas Sampling
Traditional Techniques
Historically, inventories of airborne indoor chemicals have been accomplished using time-integrated averaging approaches such as canister, sorbent tube, derivatizing agent, passive sampler, and direct measurement (e.g., ozone) methods. The time-integrated averaging methods have been used to quantify indoor concentrations of alkanes, aromatic hydrocarbons, alcohols, ketones, alkenes, ethers, and esters (Hodgson et al., 2000). These established time-integrated averaging indoor air sampling methods have standardized consensus methods for application (ASTM International, 2015, 2016b, 2017, 2021) and are well suited for high-concentration environments, and the samples can typically be collected by personnel with minimal-to-moderate training. In addition, these methods produce time-integrated average concentrations (typically to an hour or more), making them useful for exposure modeling. Finally, individual samples from these methods can be analyzed by commercial laboratories at lower costs than the upfront cost of most direct measurement or continuous analyses with high temporal resolution.
However, canisters, sorption tubes, derivatizing agents, and passive samplers all have limitations. Polar and low-volatility chemicals may have low recovery rates from canisters (Woolfenden, 2010). Sorbent tube retention is dependent upon properties of the sorbent and chemicals being sampled (ASTM International, 2015), and labile chemicals may decompose in the thermal desorption process. Derivatizing agents can have stability and interference issues (ASTM International, 2016b). Passive samplers are prone to air flow and temperature fluctuations (ASTM International, 2017). While particle filters can be used with these techniques, these methods are sometimes used to sample the entire air phase, collecting both particles and gas.
Until recently, direct measurement of gas-phase indoor chemicals has been limited to a subset of individual chemicals (e.g., formaldehyde, ozone, carbon dioxide, nitric oxide, and nitrogen dioxide) for which instrumentation was available. Instruments directly measuring carbon dioxide, like nondispersive infrared sensors, now cost less than $500, allowing widespread use in field campaigns, in real-time building demand control ventilation management, and by the general public. However, instruments directly measuring continuous indoor relevant concentrations of formaldehyde, ozone, nitric oxide, and nitrogen dioxide have remained more costly, limiting use to a few locations in field campaigns.
New Analytical Approaches
Recent funding interest in the indoor environment has led to the application of new analytical equipment and techniques. Continuous, high temporal resolution VOC analysis, such as proton-transfer-reaction mass spectrometry (PTR-MS), has been applied in a limited number of indoor environments (e.g., movie theater, home, gym, classroom, office, and museum) (Brown et al., 2021; Finewax et al., 2021; Liu et al., 2019; Price et al., 2021; Schripp et al., 2014; Tang et al., 2015; Williams et al., 2016; Wu et al., 2021b). PTR-MS instruments have been used to measure aldehydes, aromatic hydrocarbons, amines, alcohols, ketones, phenols, thiols, terpenes, and siloxanes. The use of chemical ionization mass spectrometry (CIMS) in the indoor environment has been expanded beyond protons to use other ion sources, such as acetate (Liu et al., 2017), nitrate (Price et al., 2021), and iodide (Duncan et al., 2019; Finewax et al., 2021; Price et al., 2019). Ammonium could also be another useful ion source for chemicals found in indoor environments. Combining data from multiple ion sources using positive matrix factorization (PMF) can allow identification of source types (e.g., human or building materials) for various gas-phase chemicals (Price et al., 2021). CIMS methods have been used to measure carboxylic acids, inorganic chlorinated compounds, organic nitrogen compounds, and polar VOCs (Duncan et al., 2019; Liu et al., 2017; Price et al., 2021). These instruments can analyze chemicals at speeds relevant to dynamic indoor environments (seconds to minutes). CIMS instruments can be calibrated in novel ways that rely on reaction rates rather than via authentic standards (Farmer, 2019). In addition, these instruments can provide detection limits for 0.1-s duration samples that are equivalent to 1-h sample durations for historically used time-integrated analysis techniques (ASTM International, 2020).
While these instruments’ high-resolution time-of-flight mass spectrometers can determine chemical composition, they cannot distinguish structural isomers (Farmer, 2019). However, coupling CIMS instruments with chromatography has the potential to allow quantification of structural isomers with time resolution of minutes rather than hours (Claflin et al., 2021). With proper configuration, these instruments can perform non-targeted (or untargeted) analysis to start to identify the wide range of “unknown” chemicals present in indoor air. However, to date non-targeted analysis has not quantified the thousands of indoor chemicals that would be necessary for a comprehensive down inventory of indoor gas-phase chemicals.
Despite these advantages in quantifying indoor gas-phase concentrations, these instruments are expensive (typically costing much more than $100,000) and require highly trained personnel to operate and interpret the results. These factors prevent the application of these instruments to large numbers of homes or other indoor spaces in field campaigns. Since these instruments have not been used in a significant number of indoor environments, potential interference issues in high-concentration indoor environments are unknown. Facilitating the greater application of these instruments to a wide range of indoor spaces and environmental conditions could make top-down approaches to the inventory of indoor gas-phase constituents more robust and give a greater understanding of the dynamic nature of indoor sources.
Particulate Matter Sampling
Traditional Techniques
Indoor airborne PM has been commonly analyzed using techniques that quantify total mass, particle count, surface area, size distribution, and chemical composition. Commonly used techniques to count particles include optical sensors, condensation particle growth counters, diffusion chargers (Buonanno et al., 2014), and scanning mobility particle sizers (to count and size particles). Whereas reference methods for quantifying PM in outdoor air require active sampling followed by gravimetric analysis, these commonly used counting techniques estimate mass by assuming particle
shape and density. Direct optical sensors are most accurate when particle diameters are greater than the light wavelength (~100 nm to 300 nm). Systems that use particle growth can quantify particles down to 1 nm in diameter. These methods do not provide information about chemical composition.
Most commonly, PM needs to be captured on a filter first to determine its chemical constituents. Active or passive sampling methods have been employed to collect particles on filters for gravimetric and compositional analysis, with active size-selective samplers often used to collect 50 percent of particles below a specific cut-point in aerodynamic diameter, assuming spherical shape. The filter is extracted with a solvent, and that extract is then treated with a variety of techniques to purify and isolate chemical classes of concern (e.g., water-soluble metals). The final extract is then often evaporated, reconstituted, and analyzed using a variety of mass spectrometry techniques. Non-destructive methods such as X-ray fluorescence or thermal/optical reflectance/transmittance have also been used to characterize elemental composition and elemental versus organic carbon content based on thermal optical properties, respectively, directly on the filter media. Destructive methods like inductively coupled plasma-mass spectrometry have also been used to characterize chemical composition, and many other methods (e.g., radioactivity and scanning electron microscopy) have been used for morphological characterization and counting. However, these techniques only can capture chemical composition of stable particles. Volatilization (e.g., of low molecular weight organics and nitrates) and reactions (e.g., with ozone and nitrogen dioxide) can occur during sampling and storage prior to analysis (ASTM International, 2013). Chemicals are only analyzed if they are in the size range captured by the sampler.
New Analytical Approaches
One new analytical approach for PM sampling is the use of HVAC filters as a collection media for SVOCs associated with particles. HVAC systems move large volumes of air through filters, creating a lengthy, time-integrated sample of airborne particles. Dust on HVAC filters has been shown to have equivalent or higher concentrations of polybrominated diphenyl ethers (PBDEs), phthalates, and organophosphates than settled dust (Bi et al., 2018; He et al., 2016; Xu et al., 2015).
A wide range of instruments can be applied to determine continuous particle composition in outdoor PM, including mass spectrometry, chromatography, and particle-into-liquid sampling coupled to on- or off-line analysis (Farmer, 2019). To date, however, the limited indoor particle studies have relied on aerosol mass spectrometers (AMS) and thermal desorption aerosol gas chromatography (TAG). AMS instruments can provide elemental composition and oxygen/carbon and hydrogen/carbon ratio information (Farmer, 2019). PMF and other source apportionment models have also been used with chemical composition data to identify and apportion sources that contribute to indoor PM concentrations (Habre et al., 2014; Hasheminassab et al., 2014; Molnár et al., 2014). Using PMF, AMS data have been used to examine how particles change as they transport through the building envelope during varying seasons (Avery et al., 2019a,b) and change after cooking (Katz et al., 2021a), as well as the impact of particles on third-hand smoke transport in indoor air (DeCarlo et al., 2018). Yet, AMS is limited to analysis of non-refractory PM smaller than 1 micron; larger particles, metals, soot, and salts are not analyzed by AMS. TAG has been applied in residential studies to measure the dynamics and evolution of speciated organic chemicals under natural ventilation conditions (Fortenberry et al., 2019). Semivolatile TAG (SV-TAG) has been applied to study residential sources, dynamics, and gas/particle partitioning of SVOCs on an hourly basis (Kristensen et al., 2019), including analysis of phthalate partitioning dynamics (Lunderberg et al., 2019), and the role of surface emissions and re-partitioning of SVOCs to PM2.5 (Lunderberg et al., 2020). AMS and SV-TAG have been used together to study emissions and partitioning of siloxanes during cooking events (Katz et al., 2021b). Due to cost and complexity, the application of AMS, TAG, and similar instruments to the indoor environment has been limited. Other continuous particle composition
techniques have not been widely applied to the indoor environment (Farmer, 2019). These include mass spectrometry using soft ionization, extractive electrospray techniques, coupling rapid filter collection with CIMS, and single-particle techniques. Like for gas-phase sampling, facilitating the greater application of these instruments and methods to a wide range of indoor spaces and environmental conditions could make top-down approaches to inventorying indoor aerosols more robust.
Settled Dust Sampling
Traditional Techniques
The collection and analysis of dust has been occurring for decades and has been important to understanding this reservoir of indoor chemicals. Identifying and measuring chemical burdens in dust samples has provided insight into potential exposure to occupants, particularly as it relates to estimating exposure from hand-to-mouth activities, which is an important pathway not only for children but also for adults. Dust is often collected using a vacuum, although some studies have reported using brooms and brushes to collect settled dust in high-traffic areas. In some cases, clean sampling films are left in a horizontal position (e.g., on a bookshelf or countertop) to passively collect airborne dust that settles over time. The mass accumulating on these films can be quantified, and the films can be extracted and analyzed to characterize their chemical composition. Additionally, dust is often extracted and analyzed in a similar fashion to PM on filters.
Unfortunately, there is no standardization of sampling methods for dust, and the various methods currently used can lead to uncertainty in measurements and comparability among studies. For example, differences in the types of vacuums used by researchers vary considerably and are not standardized. EPA has recommended standardized methods and equipment such as the High Volume Surface Sampler; however, this instrument is heavy and expensive compared to commercial vacuums. Researchers have a tendency to use dust collected either by participants using their home vacuum cleaner or with a smaller vacuum or a handheld device that can be used by researchers from home to home. Differences in vacuums can potentially lead to differences in the size and type of dust particles collected and thus differences in the chemical concentrations reported in dust. Dust often needs to be sieved to remove large particles before chemical analysis; however, researchers typically use different sized sieves that result in different sized particles included in the final analyses and further contribute to differences in measurements across studies.
In addition, differences have been found based on the location (room) in the house where the dust is collected, or between settled dust on the floor and elevated dust (e.g., on a bookshelf). Factors that often influence chemical measurements of SVOCs in dust samples were recently highlighted in a meta-analysis in which flame retardants were used as a case example (Al-Omran et al., 2021). Box 2-3 discusses challenges related to assessing exposure to chemicals in dust.
New Analytical Approaches
Moving forward, it will be important to more thoroughly identify and characterize chemicals present in dust samples. Non-targeted approaches that utilize high-resolution mass spectrometry to identify unknown chemical features or responses are now being used to characterize dust samples (Ouyang et al., 2017; Rager et al., 2016; Rostkowski et al., 2019). For example, a recent study used a non-targeted method to identify brominated azo disperse dyes in house dust (Peng et al., 2016). These methods provide more insight into the complex and diverse suite of chemicals that are present in indoor environments, yet they are not currently at a point where every chemical in the thousands in a mass spectrum of an indoor air or dust sample can be identified—let alone quantified. Chemical space is vast, and the number of chemicals that are on the market and their potential
degradation products span tens of thousands of chemicals (EPA, n.d.). Investments in chemoinformatic approaches and non-targeted analyses may improve our ability to fully characterize complex chemical mixtures in indoor dust in the future.
Surface Sampling
Traditional Techniques
Surfaces in indoor environments, including windows, countertops, and walls, accumulate organic films and act as sinks, reaction sites, and reservoirs for SVOCs (Weschler and Nazaroff, 2008). The Occupational Safety and Health Administration’s Guidelines for Surface Sampling Methods are available and widely utilized (OSHA, 2007). Surfaces have traditionally been sampled by taking a clean wipe, often made of cotton or a similar material, and wiping down a specific surface area. Surface wipe samples can then be extracted and analyzed in a similar fashion to PM on filters and may experience similar issues like loss of volatile chemical species (Liu et al., 2003).
Growth of organic films on indoor surfaces has been modeled theoretically (Weschler and Nazaroff, 2017). In addition, many studies have been done to understand how specific chemicals react with different surfaces, including ozone oxidation reactions of organic chemicals present on surfaces (Shu and Morrison, 2011; Weschler and Nazaroff, 2017). Indoor surface films are also studied by placing clean substrates or coupons (made of materials commonly found indoors, such as glass, metal, or tile) indoors and allowing films to grow, followed by analysis in the laboratory by surface chemistry or extraction techniques.
New Analytical Approaches
A variety of new surface sampling techniques have been applied in the past decade. Some analytical advancements have focused on improving the chemical characterization of surface wipes to evaluate chemical residues using spectrophotometer techniques (Deming and Ziemann, 2020). Surface chemistry is also being probed by applying portable surface reactors to organic chemical reactions on surfaces (Algrim et al., 2020), flux chambers for emissions from surface films on
coupons (Adams et al., 2017) or surfaces (Wu et al., 2016), atomic force microscopy coupled to infrared spectroscopy to measure film coverage and functional group analysis (Or et al., 2018), and analysis of glass collection plates using Fourier Transform Ion Cyclotron Resonance Mass Spectrometry and off-line AMS (O’Brien et al., 2021). Application of more standard, advanced, and emerging techniques for surface chemistry analysis to relevant indoor surfaces holds significant promise for advancing understanding of surface films and their emissions and chemical interactions.
CONCLUSIONS
Chemical sources in the indoor environment are numerous and varied. Potential human exposure to these chemicals is dynamic owing to the complexities inherent not only in these sources but also in the environment and human behaviors. Chemical emissions and abundances are linked to both chronic and episodic sources and are modified by behavioral, environmental, and physical factors. Building materials, consumer products, infiltration of outdoor air, and human behavior (particularly cooking) can strongly influence the chemicals detected in the indoor environment. Dust and indoor surfaces also serve as a sink and reservoir of chemicals that are slowly released from primary sources, and they play a role in understanding human exposure, which is discussed further in Chapter 6. New research also suggests that clothing mediates our exposure to chemicals in the indoor environment, acting as a sink for chemicals present in indoor air (Licina et al., 2019).
Over the past few decades, new materials containing unique chemicals have emerged for use in the indoor environment—for example, new types of building insulation and greater use of electronics and smart devices in indoor environments, particularly in homes. These devices and materials can also be sources of chemicals to the indoor environment, such as plastics, plasticizers, antioxidants, UV stabilizers, and flame retardants. Recycling of materials could lead to increased exposure to hazardous chemicals that have been phased out due to concerns about human exposure. Increased use of cleaning and disinfection agents, particularly during the COVID-19 pandemic, is leading to an increase in the levels of some chemicals, such as quaternary ammonium compounds (Zheng et al., 2020), in the indoor environment. Little information is available on the health effects or distribution of these chemicals in the indoor environment. Over time, some chemicals that were emitted by primary sources in the indoor environment have been phased out of use owing to concerns about their elevated exposure and/or toxicity (e.g., PBDEs, benzyl butyl phthalate). These unfortunate chemical substitutions are often replaced with chemicals that have less data available on their emissions, exposure, and potential hazards.
A wide range of analytical techniques are currently being used to identify new chemicals, in both bottom-up and top-down approaches, that may be released into the indoor environment, but these approaches are costly and time-consuming. The lack of transparency in chemical use (i.e., confidential business information) and challenges in identifying chemical sources in the indoor environment will continue to be major obstacles to chemical management and risk evaluation.
RESEARCH NEEDS
Given its findings about the current state of the science, the committee has identified priority research areas to help drive future advances in understanding primary sources and reservoirs in indoor environments:
- Prioritize acquisition of actionable data and research to link sources with exposures and understand impacts of mixtures on health. Research is needed that provides greater resolution on spatial and temporal trends in chemical emissions indoors, and how these vary for both chronic and episodic sources. Specific needs include improved understanding of the combined influence of ventilation rates, humidity, and temperature on chemical
- emissions indoors, as well as the interaction of the indoor and outdoor environment and its influence on indoor sources and exposures, especially for SVOCs. Better understanding of sources would provide more actionable information to control sources and, consequently, exposures. In addition, the indoor environment, where humans spend the majority of their time, contains a highly complex chemical mixture found in multiple phases and originating from many sources.
- Increase transparency in chemical applications/use in building materials to minimize time and effort needed to establish evidence of exposure and health risks. New or improved analytical methods have helped to identify new chemicals in indoor environments and their transformation products. However, every year new materials are introduced to the market that may become new sources (new types of flooring, new surface treatments for water and grease repellency, etc.). More research is needed to evaluate chemical emissions, and thus potential human exposure, from new materials before they are broadly introduced to the market. Greater transparency would expedite the process of establishing evidence for potential harmful exposures.
- Improve analytical methods and non-targeted approaches to support discovery. In the past, a number of chemicals of human health concern have been identified in indoor settings using targeted or screening methods. Use of non-targeted methods has the potential to identify chemicals of concern earlier. Thus, the committee recommends that greater emphasis is placed on improving non-targeted approaches that utilize high-resolution mass spectrometry to identify previously unknown chemicals and characterize the complex chemical mixtures present in the indoor environment.
- Develop and maintain harmonized chemical information databases. Information databases now exist for a broad range of volatile chemical products and other consumer products (e.g., from SDSs and ingredient labels, and the Chemical and Products Database [CPDat]). These can support the use of non-targeted methods that are key to improving our understanding. However, maintaining and updating these databases requires resources. Those who develop and maintain databases (i.e., regulatory bodies, scientific research groups, or consumer and health protection agencies) would benefit from harmonization of terminology, tracking of data provenance, consistent identification of standard product categories, and consistent processes for data updates.
- Expand research further into nonresidential settings and underrepresented countries and contexts. The vast majority of the information presented in this chapter refers to research conducted in residential settings and in high-income countries. However, people spend time in other indoor environments, which may have different sources and emission rates. For example, less information is available on chemical sources in schools, hospitals, government buildings, retail stores, restaurants, and occupational and recreational buildings (hair and nail salons, rock-climbing gyms, trampoline parks, indoor pools, etc.) across a wide range of socioeconomic strata (Mandin et al., 2017). In addition, most research is conducted in high-income countries or in low-income countries with households that rely on solid fuels for indoor cooking and heating (typically termed “household air pollution” by the World Health Organization). Populations living in low- to middle-income countries likely experience widely variable chemistries indoors due to differences in regional activities, human behaviors, climates, fuels used in cooking and heating, and the use of different materials in building construction. Similarly, significant variability exists among developed countries based on social and economic factors (e.g., public housing, lower-income residences, or disadvantaged neighborhoods). Researchers could consider fostering community-based partnerships to increase the amount of information available and better incorporate local knowledge and context when investigating these understudied environments.
REFERENCES
Abrahamsson, D. P., J. R. Sobus, E. M. Ulrich, K. Isaacs, C. Moschet, T. M. Young, D. H. Bennett, and N. S. Tulve. 2021. A quest to identify suitable organic tracers for estimating children’s dust ingestion rates. Journal of Exposure Science & Environmental Epidemiology 31(1):70–81. https://doi.org/10.1038/s41370-020-0244-0.
Adams, R. I., D. S. Lymperopoulou, P. K. Misztal, R. De Cassia Pessotti, S. W. Behie, Y. Tian, A. H. Goldstein, S. E. Lindow, W. W. Nazaroff, J. W. Taylor, M. F. Traxler, and T. D. Bruns. 2017. Microbes and associated soluble and volatile chemicals on periodically wet household surfaces. Microbiome 5(1):128. https://doi.org/10.1186/s40168-017-0347-6.
Afshari, A. U. M., and L. E. Ekberg. 2005. Characterization of indoor sources of fine and ultrafine particles: A study conducted in a full-scale chamber. Indoor Air 15(2):141–150. https://doi.org/10.1111/j.1600-0668.2005.00332.x.
Ahluwalia, S. K., R. D. Peng, P. N. Breysse, G. B. Diette, J. Curtin-Brosnan, C. Aloe, and E. C. Matsui. 2013. Mouse allergen is the major allergen of public health relevance in Baltimore City. Journal of Allergy and Clinical Immunology 132(4):830–835.e2. https://doi.org/10.1016/j.jaci.2013.05.005.
Algrim, L. B., D. Pagonis, J. A. de Gouw, J. L. Jimenez, and P. J. Ziemann. 2020. Measurements and modeling of absorptive partitioning of volatile organic compounds to painted surfaces. Indoor Air 30(4):745–756. https://doi.org/10.1111/ina.12654.
Al-Omran, L. S., S. Harrad, and M. Abou-Elwafa Abdallah. 2021. A meta-analysis of factors influencing concentrations of brominated flame retardants and organophosphate esters in indoor dust. Environmental Pollution 285:117262. https://doi.org/10.1016/j.envpol.2021.117262.
Ampollini, L., E. F. Katz, S. Bourne, Y. Tian, A. Novoselac, A. H. Goldstein, G. Lucic, M. S. Waring, and P. F. DeCarlo. 2019. Observations and contributions of real-time indoor ammonia concentrations during HOMEChem. Environmental Science & Technology 53(15):8591–8598. https://doi.org/10.1021/acs.est.9b02157.
Andersen, H. V., L. Gunnarsen, L. E. Knudsen, and M. Frederiksen. 2020. PCB in air, dust and surface wipes in 73 Danish homes. International Journal of Hygiene and Environmental Health 229:113429. https://doi.org/10.1016/j.ijheh.2019.113429.
Arata, C., K. J. Zarzana, P. K. Misztal, Y. Liu, S. S. Brown, W. W. Nazaroff, and A. H. Goldstein. 2018. Measurement of NO3 and N2O5 in a residential kitchen. Environmental Science & Technology Letters 5(10):595–599. https://doi.org/10.1021/acs.estlett.8b00415.
ASTM International. 2013. ASTM D6209-13 Standard Test Method for Determination of Gaseous and Particulate Polycyclic Aromatic Hydrocarbons in Ambient Air (Collection on Sorbent-Backed Filters with Gas Chromatographic/Mass Spectrometric Analysis). https://doi.org/10.1520/D6209-13.
ASTM International. 2015. ASTM D6196-15 Standard Practice for Choosing Sorbents, Sampling Parameters and Thermal Desorption Analytical Conditions for Monitoring Volatile Organic Chemicals in Air. https://doi.org/10.1520/D6196-15.
ASTM International. 2016a. ASTM D6007-14 Standard Test Method for Determining Formaldehyde Concentrations in Air from Wood Products Using a Small-Scale Chamber.
ASTM International. 2016b. ASTM D5197-16 Standard Test Method for Determination of Formaldehyde and Other Carbonyl Compounds in Air (Active Sampler Methodology). https://doi.org/10.1520/D5197-16.
ASTM International. 2017. ASTM D6306-17 Standard Guide for Placement and Use of Diffusive Samplers for Gaseous Pollutants in Indoor Air.
ASTM International. 2020. ASTM WK71196 New Guide for Measurement Techniques for Formaldehyde in Air.
ASTM International. 2021. ASTM D5466-21: Standard Test Method for Determination of Volatile Organic Compounds in Atmospheres (Canister Sampling, Mass Spectrometry Analysis Methodology).
Avery, A. M., M. S. Waring, and P. F. DeCarlo. 2019a. Human occupant contribution to secondary aerosol mass in the indoor environment. Environmental Science: Processes & Impacts 21(8):1301–1312. https://doi.org/10.1039/C9EM00097F.
Avery, A. M., M. S. Waring, and P. F. DeCarlo. 2019b. Seasonal variation in aerosol composition and concentration upon transport from the outdoor to indoor environment. Environmental Science: Processes & Impacts 21(3):528–547. https://doi.org/10.1039/C8EM00471D.
Balasubramanian, R., and S. S. Lee. 2007. Characteristics of indoor aerosols in residential homes in urban locations: A case study in Singapore. Journal of the Air & Waste Management Association 57(8):981–990. https://doi.org/10.3155/1047-3289.57.8.981.
Bannavti, M. K., J. C. Jahnke, R. F. Marek, C. L. Just, and K. C. Hornbuckle. 2021. Room-to-room variability of airborne polychlorinated biphenyls in schools and the application of air sampling for targeted source evaluation. Environmental Science & Technology 55(14):9460–9468. https://doi.org/10.1021/acs.est.0c08149.
Barnig, C., G. Reboux, S. Roussel, A. Casset, C. Sohy, J.-C. Dalphin, and F. de Blay. 2013. Indoor dust and air concentrations of endotoxin in urban and rural environments. Letters in Applied Microbiology 56(3):161–167. https://doi.org/10.1111/lam.12024.
Bekö, G., N. Carslaw, P. Fauser, V. Kauneliene, S. Nehr, G. Phillips, D. Saraga, C. Schoemaecker, A. Wierzbicka, and X. Querol. 2020. The past, present, and future of indoor air chemistry. Indoor Air 30(3):373–376. https://doi.org/10.1111/ina.12634.
Bekö, G., C. J. Weschler, A. Wierzbicka, D. G. Karottki, J. Toftum, S. Loft, and G. Clausen. 2013. Ultrafine particles: Exposure and source apportionment in 56 Danish homes. Environmental Science & Technology 47(18):10240–10248.
Berradi, M., R. Hsissou, M. Khudhair, M. Assouag, O. Cherkaoui, A. El Bachiri, and A. El Harfi. 2019. Textile finishing dyes and their impact on aquatic environs. Heliyon 5(11):e02711. https://doi.org/10.1016/j.heliyon.2019.e02711.
Bhangar, S., N. A. Mullen, S. V. Hering, N. M. Kreisberg, and W. W. Nazaroff. 2011. Ultrafine particle concentrations and exposures in seven residences in northern California. Indoor Air 21(2):132–144. https://doi.org/10.1111/j.1600-0668.2010.00689.x.
Bi, C., J. P. Maestre, H. Li, G. Zhang, R. Givehchi, A. Mahdavi, K. A. Kinney, J. Siegel, S. D. Horner, and Y. Xu. 2018. Phthalates and organophosphates in settled dust and HVAC filter dust of U.S. low-income homes: Association with season, building characteristics, and childhood asthma. Environment International 121:916–930. https://doi.org/10.1016/j.envint.2018.09.013.
Bladon, K. D., M. B. Emelko, U. Silins, and M. Stone. 2014. Wildfire and the future of water supply. Environmental Science & Technology 48(16):8936–8943. https://doi.org/10.1021/es500130g.
Blomberg, A. J., B. A. Coull, I. Jhun, C. L. Z. Vieira, A. Zanobetti, E. Garshick, J. Schwartz, and P. Koutrakis. 2019. Effect modification of ambient particle mortality by radon: A time series analysis in 108 U.S. cities. Journal of the Air & Waste Management Association 69(3):266–276. https://doi.org/10.1080/10962247.2018.1523071.
Boor, B. E., H. Järnström, A. Novoselac, and Y. Xu. 2014. Infant exposure to emissions of volatile organic compounds from crib mattresses. Environmental Science & Technology 48(6):3541–3549. https://doi.org/10.1021/es405625q.
Boor, B. E., M. P. Spilak, J. Laverge, A. Novoselac, and Y. Xu. 2017. Human exposure to indoor air pollutants in sleep microenvironments: A literature review. Building and Environment 125:528–555. https://doi.org/10.1016/j.buildenv.2017.08.050.
Brown, W. L., D. A. Day, H. Stark, D. Pagonis, J. E. Krechmer, X. Liu, D. J. Price, E. F. Katz, P. F. DeCarlo, C. G. Masoud, D. S. Wang, L. Hildebrandt Ruiz, C. Arata, D. M. Lunderberg, A. H. Goldstein, D. K. Farmer, M. E. Vance, and J. L. Jimenez. 2021. Real-time organic aerosol chemical speciation in the indoor environment using extractive electrospray ionization mass spectrometry. Indoor Air 31(1):141–155. https://doi.org/10.1111/ina.12721.
Buonanno, G., R. E. Jayaratne, L. Morawska, and L. Stabile. 2014. Metrological performances of a diffusion charger particle counter for personal monitoring. Aerosol and Air Quality Research 14(1):156–167. https://doi.org/10.4209/aaqr.2013.05.0152.
Burton, C. A., T. M. Hoefen, G. S. Plumlee, K. L. Baumberger, A. R. Backlin, E. Gallegos, and R. N. Fisher. 2016. Trace elements in stormflow, ash, and burned soil following the 2009 station fire in Southern California. PLoS ONE 11(5):e0153372. https://doi.org/10.1371/journal.pone.0153372.
CA Energy Commission. 2009. Ventilation and indoor air quality in new homes. https://ww2.arb.ca.gov/sites/default/files/classic//research/apr/past/04-310.pdf.
Carslaw, N., L. Fletcher, D. Heard, T. Ingham, and H. Walker. 2017. Significant OH production under surface cleaning and air cleaning conditions: Impact on indoor air quality. Indoor Air 27(6):1091–1100. https://doi.org/10.1111/ina.12394.
Chen, R., A. Aherrera, C. Isichei, P. Olmedo, S. Jarmul, J. E. Cohen, A. Navas-Acien, and A. M. Rule. 2018. Assessment of indoor air quality at an electronic cigarette (vaping) convention. Journal of Exposure Science & Environmental Epidemiology 28(6):522–529. https://doi.org/10.1038/s41370-017-0005-x.
Claflin, M. S., D. Pagonis, Z. Finewax, A. V. Handschy, D. A. Day, W. L. Brown, J. T. Jayne, D. R. Worsnop, J. L. Jimenez, P. J. Ziemann, J. de Gouw, and B. M. Lerner. 2021. An in situ gas chromatograph with automatic detector switching between PTR- and EI-TOF-MS: isomer-resolved measurements of indoor air. Atmos. Meas. Tech. 14(1):133–152. https://doi.org/10.5194/amt-14-133-2021.
Clean and Healthy New York, Clean Water Action, and Conservation Minnesota. 2015. Flame Retardants in Furniture, Foam, Floors. https://static1.squarespace.com/static/5fa197d3a325783e2e6f7b89/t/6008a10ce402840fe7a01c90/1611178271769/Flame+Retardants+report+2015.
Collins, D. B., R. F. Hems, S. Zhou, C. Wang, E. Grignon, M. Alavy, J. A. Siegel, and J. P. D. Abbatt. 2018. Evidence for gas-surface equilibrium control of indoor nitrous acid. Environmental Science & Technology 52(21):12419–12427. https://doi.org/10.1021/acs.est.8b04512.
Cooper, E. M., R. Rushing, K. Hoffman, A. L. Phillips, S. C. Hammel, M. J. Zylka, and H. M. Stapleton. 2020. Strobilurin fungicides in house dust: Is wallboard a source? Journal of Exposure Science & Environmental Epidemiology 30(2):247–252.
Cothern, C. R. 1987. Environmental Radon. Edited by C. R. Cothern and J. E. Smith, Jr. New York: Plenum Press.
Cummings, B. E., A. M. Avery, P. F. DeCarlo, and M. S. Waring. 2021. Improving predictions of indoor aerosol concentrations of outdoor origin by considering the phase change of semivolatile material driven by temperature and mass-loading gradients. Environmental Science & Technology 55(13):9000–9011. https://doi.org/10.1021/acs.est.1c00417.
D’Amato, G., O. P. M. Ortega, I. Annesi-Maesano, and M. D’Amato. 2020. Prevention of allergic asthma with allergen avoidance measures and the role of exposure. Current Allergy and Asthma Reports 20(3):8. https://doi.org/10.1007/s11882-020-0901-3.
Darby, S., D. Hill, A. Auvinen, J. M. Barros-Dios, H. Baysson, F. Bochicchio, H. Deo, R. Falk, F. Forastiere, M. Hakama, I. Heid, L. Kreienbrock, M. Kreuzer, F. Lagarde, I. Mäkeläinen, C. Muirhead, W. Oberaigner, G. Pershagen, A. Ruano-Ravina, E. Ruosteenoja, A. S. Rosario, M. Tirmarche, L. Tomásek, E. Whitley, H.-E. Wichmann, and R. Doll. 2005. Radon in
homes and risk of lung cancer: Collaborative analysis of individual data from 13 European case-control studies. BMJ 330:223. https://doi.org/10.1136/bmj.38308.477650.63.
Dawe, K. E. R., T. C. Furlani, S. F. Kowal, T. F. Kahan, T. C. VandenBoer, and C. J. Young. 2019. Formation and emission of hydrogen chloride in indoor air. Indoor Air 29(1):70–78. https://doi.org/10.1111/ina.12509.
DeCarlo, P. F., A. M. Avery, and M. S. Waring. 2018. Thirdhand smoke uptake to aerosol particles in the indoor environment. Science Advances 4(5):eaap8368. https://doi.org/10.1126/sciadv.aap8368.
Deming, B. L., and P. J. Ziemann. 2020. Quantification of alkenes on indoor surfaces and implications for chemical sources and sinks. Indoor Air 30(5):914–924. https://doi.org/10.1111/ina.12662.
Dhungana, B., H. Peng, S. Kutarna, G. Umbuzeiro, S. Shrestha, J. Liu, P. D. Jones, B. Subedi, J. P. Giesy, and G. P. Cobb. 2019. Abundances and concentrations of brominated azo dyes detected in indoor dust. Environmental Pollution 252:784–793. https://doi.org/10.1016/j.envpol.2019.05.153.
Dominici, F., R. D. Peng, M. L. Bell, L. Pham, A. McDermott, S. L. Zeger, and J. M. Samet. 2006. Fine particulate air pollution and hospital admission for cardiovascular and respiratory diseases. JAMA 295(10):1127–1134. https://doi.org/10.1001/jama.295.10.1127.
Duncan, S. M., S. Tomaz, G. Morrison, M. Webb, J. Atkin, J. D. Surratt, and B. J. Turpin. 2019. Dynamics of residential water soluble organic gases: Insights into sources and sinks. Environmental Science & Technology 53(4):1812–1821. https://doi.org/10.1021/acs.est.8b05852.
Eggleston, P. A. 2017. Cockroach allergy and urban asthma. Journal of Allergy and Clinical Immunology 140(2):389–390. https://doi.org/10.1016/j.jaci.2017.04.033.
Elder, A., R. Gelein, V. Silva, T. Feikert, L. Opanashuk, J. Carter, R. Potter, A. Maynard, Y. Ito, J. Finkelstein, and G. Oberdörster. 2006. Translocation of inhaled ultrafine manganese oxide particles to the central nervous system. Environmental Health Perspectives 114(8):1172–1178. https://doi.org/10.1289/ehp.9030.
EPA (U.S. Environmental Protection Agency). n.d. Toxic Substances Control Act (TSCA) Chemical Substance Inventory. Accessed January 19, 2022. https://www.epa.gov/tsca-inventory.
EPA. 2017. Chapter 5: Soil and dust ingestion. Exposure Factors Handbook. https://www.epa.gov/expobox/exposure-factors-handbook-chapter-5.
EPA. 2021a. Controlling Pollutants and Sources: Indoor Air Quality Design Tools for Schools. https://www.epa.gov/iaq-schools/controlling-pollutants-and-sources-indoor-air-quality-design-tools-schools.
EPA. 2021b. Premanufacture Notices (PMNs) and Significant New Use Notices (SNUNs) Table. https://www.epa.gov/reviewing-new-chemicals-under-toxic-substances-control-act-tsca/premanufacture-notices-pmns-and.
Fan, X., C. Kubwabo, F. Wu, and P. E. Rasmussen. 2019. Analysis of bisphenol a, alkylphenols, and alkylphenol ethoxylates in NIST SRM 2585 and indoor house dust by gas chromatography-tandem mass spectrometry (GC/MS/MS). Journal of AOAC International 102(1):246–254. https://doi.org/10.5740/jaoacint.18-0071.
Farmer, D. K. 2019. Analytical challenges and opportunities for indoor air chemistry field studies. Analytical Chemistry 91(6):3761–3767. https://doi.org/10.1021/acs.analchem.9b00277.
Ferguson, P. L., and H. M. Stapleton. 2017. Comment on “Mutagenic azo dyes, rather than flame retardants, are the predominant brominated compounds in house dust.” Environmental Science & Technology 51(6):3588–3590. https://doi.org/10.1021/acs.est.7b00372.
Ferro, A. R., R. J. Kopperud, and L. M. Hildemann. 2004. Source strengths for indoor human activities that resuspend particulate matter. Environmental Science & Technology 38(6):1759–1764. https://doi.org/10.1021/es0263893.
Field, W. R. 2010. Climate change and indoor air quality. Contractor Report prepared for U.S. Environmental Protection Agency, Office of Radiation and Indoor Air. https://www.epa.gov/sites/default/files/2014-08/documents/field_climate_change_iaq.pdf.
Finewax, Z., D. Pagonis, M. S. Claflin, A. V. Handschy, W. L. Brown, O. Jenks, B. A. Nault, D. A. Day, B. M. Lerner, J. L. Jimenez, P. J. Ziemann, and J. A. de Gouw. 2021. Quantification and source characterization of volatile organic compounds from exercising and application of chlorine-based cleaning products in a university athletic center. Indoor Air 31(5):1323–1339. https://doi.org/10.1111/ina.12781.
Forand, S. P., E. L. Lewis-Michl, and M. I. Gomez. 2012. Adverse birth outcomes and maternal exposure to trichloroethylene and tetrachloroethylene through soil vapor intrusion in New York State. Environmental Health Perspectives 120(4):616–621. https://doi.org/10.1289/ehp.1103884.
Fortenberry, C., M. Walker, A. Dang, A. Loka, G. Date, K. Cysneiros de Carvalho, G. Morrison, and B. Williams. 2019. Analysis of indoor particles and gases and their evolution with natural ventilation. Indoor Air 29(5):761–779. https://doi.org/10.1111/ina.12584.
Francisco, P. W., S. Gloss, J. Wilson, W. Rose, Y. Sun, S. L. Dixon, J. Breysse, E. Tohn, and D. E. Jacobs. 2020. Radon and moisture impacts from interventions integrated with housing energy retrofits. Indoor Air 30(1):147–155. https://doi.org/10.1111/ina.12616.
Fridén, U. E., M. S. McLachlan, and U. Berger. 2011. Chlorinated paraffins in indoor air and dust: concentrations, congener patterns, and human exposure. Environment International 37(7):1169–1174. https://doi.org/10.1016/j.envint.2011.04.002.
Fuller, C. H., D. Brugge, P. L. Williams, M. A. Mittleman, K. Lane, J. L. Durant, and J. D. Spengler. 2013. Indoor and outdoor measurements of particle number concentration in near-highway homes. Journal of Exposure Science & Environmental Epidemiology 23(5):506–512. https://doi.org/10.1038/jes.2012.116.
Garcia, G. J., J. D. Schroeter, and J. S. Kimbell. 2015. Olfactory deposition of inhaled nanoparticles in humans. Inhalation Toxicology 27(8):394–403. https://doi.org/10.3109/08958378.2015.1066904.
Gordon, S. M., M. C. Brinkman, D. L. Ashley, B. C. Blount, C. Lyu, J. Masters, and P. C. Singer. 2006. Changes in breath trihalomethane levels resulting from household water-use activities. Environmental Health Perspectives 114(4):514–521. https://doi.org/10.1289/ehp.8171.
Habre, R., B. Coull, E. Moshier, J. Godbold, A. Grunin, A. Nath, W. Castro, N. Schachter, A. Rohr, M. Kattan, J. Spengler, and P. Koutrakis. 2014. Sources of indoor air pollution in New York City residences of asthmatic children. Journal of Exposure Science & Environmental Epidemiology 24(3):269–278. https://doi.org/10.1038/jes.2013.74.
Hall, S. M., S. Patton, M. Petreas, S. Zhang, A. L. Phillips, K. Hoffman, and H. M. Stapleton. 2020. Per- and Polyfluoroalkyl Substances in Dust Collected from Residential Homes and Fire Stations in North America. Environmental Science & Technology 54(22):14558–14567. https://doi.org/10.1021/acs.est.0c04869.
Hasheminassab, S., N. Daher, M. M. Shafer, J. J. Schauer, R. J. Delfino, and C. Sioutas. 2014. Chemical characterization and source apportionment of indoor and outdoor fine particulate matter (PM2.5) in retirement communities of the Los Angeles Basin. The Science of the Total Environment 490:528–537. https://doi.org/10.1016/j.scitotenv.2014.05.044.
He, R., Y. Li, P. Xiang, C. Li, C. Zhou, S. Zhang, X. Cui, and L. Q. Ma. 2016. Organophosphorus flame retardants and phthalate esters in indoor dust from different microenvironments: Bioaccessibility and risk assessment. Chemosphere 150:528–535. https://doi.org/10.1016/j.chemosphere.2015.10.087.
He, C., S. H. Brandsma, H. Jiang, J. W. O’Brien, L. M. van Mourik, A. P. Banks, X. Wang, P. K. Thai, and J. F. Mueller. 2019. Chlorinated paraffins in indoor dust from Australia: Levels, congener patterns and preliminary assessment of human exposure. Science of the Total Environment 682:318–323. https://doi.org/10.1016/j.scitotenv.2019.05.170.
Herrick, R. F., J. H. Stewart, and J. G. Allen. 2016. Review of PCBs in US schools: A brief history, an estimate of the number of impacted schools, and an approach for evaluating indoor air samples. Environmental Science and Pollution Research 23(3):1975–1985. https://doi.org/10.1007/s11356-015-4574-8.
Hodgson, A. T., and H. Levin. 2003. Volatile organic compounds in indoor air: A review of concentrations measured in North America since 1990. Lawrence Berkeley National Laboratory Report LBNL-51715.
Hodgson, A. T., A. F. Rudd, D. Beal, and S. Chandra. 2000. Volatile organic compound concentrations and emission rates in new manufactured and site-built houses. Indoor Air 10(3):178-192. https://doi.org/10.1034/j.1600-0668.2000.010003178.x.
Huang, S., E. Garshick, C. L. Z. Vieira, S. T. Grady, J. D. Schwartz, B. A. Coull, J. E. Hart, F. Laden, and P. Koutrakis. 2020. Short-term exposures to particulate matter gamma radiation activities and biomarkers of systemic inflammation and endothelial activation in COPD patients. Environmental Research 180:108841. https://doi.org/10.1016/j.envres.2019.108841.
Huang, S., P. Koutrakis, S. T. Grady, C. L. Z. Vieira, J. D. Schwartz, B. A. Coull, J. E. Hart, F. Laden, J. Zhang, and E. Garshick. 2021. Effects of particulate matter gamma radiation on oxidative stress biomarkers in COPD patients. Journal of Exposure Science & Environmental Epidemiology 31(4):727–735. https://doi.org/10.1038/s41370-020-0204-8.
Hult, E. L., H. Willem, P. N. Price, T. Hotchi, M. L. Russell, and B. C. Singer. 2015. Formaldehyde and acetaldehyde exposure mitigation in US residences: In-home measurements of ventilation control and source control. Indoor Air 25(5):523–535. https://doi.org/10.1111/ina.12160.
Hyytiäinen, H. K., B. Jayaprakash, P. V. Kirjavainen, S. E. Saari, R. Holopainen, J. Keskinen, K. Hämeri, A. Hyvärinen, B. E. Boor, and M. Täubel. 2018. Crawling-induced floor dust resuspension affects the microbiota of the infant breathing zone. Microbiome 6(1):25. https://doi.org/10.1186/s40168-018-0405-8.
IOM (Institute of Medicine). 2011. Climate Change, the Indoor Environment, and Health. Washington, DC: The National Academies Press.
Isaxon, C., A. Gudmundsson, E. Z. Nordin, L. Lönnblad, A. Dahl, G. Wieslander, M. Bohgard, and A. Wierzbicka. 2015. Contribution of indoor-generated particles to residential exposure. Atmospheric Environment 106:458–466. https://doi.org/10.1016/j.atmosenv.2014.07.053.
Ito, K., C. C. Chasteen, H.-K. Chung, S. K. Poruthoor, Z. Genfa, and P. K. Dasgupta. 1998. A continuous monitoring system for strong acidity in aerosols. Analytical Chemistry 70(14):2839–2847. https://doi.org/10.1021/ac980135b.
Jensen, S. 1972. The PCB story. Ambio 1(4): 123–131. http://www.jstor.org/stable/4311963.
Johnson, A. M., M. S. Waring, and P. F. DeCarlo. 2017. Real-time transformation of outdoor aerosol components upon transport indoors measured with aerosol mass spectrometry. Indoor Air 27(1):230–240. https://doi.org/10.1111/ina.12299.
Johnston, J., and J. MacDonald Gibson. 2015. Indoor air contamination from hazardous waste sites: Improving the evidence base for decision-making. International Journal of Environmental Research and Public Health 12(12):15040–15057. https://doi.org/10.3390/ijerph121214960.
Kalweit, A., R. F. Herrick, M. A. Flynn, J. D. Spengler, J. K. Berko, Jr, J. I. Levy, and D. M. Ceballos. 2020. Eliminating take-home exposures: Recognizing the role of occupational health and safety in broader community health. Annals of Work Exposures and Health 64(3):236-249. https://doi.org/10.1093/annweh/wxaa006.
Kannan, K., S. Takahashi, N. Fujiwara, H. Mizukawa, and S. Tanabe. 2010. Organotin compounds, including butyltins and octyltins, in house dust from Albany, New York, USA. Archives of Environmental Contamination and Toxicology 58(4):901-907. https://doi.org/10.1007/s00244-010-9513-6.
Kassotis, C. D., N. J. Herkert, S. C. Hammel, K. Hoffman, Q. Xia, S. W. Kullman, J. A. Sosa, and H. M. Stapleton. 2020. Thyroid receptor antagonism of chemicals extracted from personal silicone wristbands within a papillary thyroid cancer pilot study. Environmental science & technology 54(23):15296–15312. https://doi.org/10.1021/acs.est.0c05972.
Katz, E. F., H. Guo, P. Campuzano-Jost, D. A. Day, W. L. Brown, E. Boedicker, M. Pothier, D. M. Lunderberg, S. Patel, K. Patel, P. L. Hayes, A. Avery, L. Hildebrandt Ruiz, A. H. Goldstein, M. E. Vance, D. K. Farmer, J. L. Jimenez, and P. F. DeCarlo. 2021a. Quantification of cooking organic aerosol in the indoor environment using aerodyne aerosol mass spectrometers. Aerosol Science and Technology 55(10):1099–1114. https://doi.org/10.1080/02786826.2021.1931013.
Katz, E. F., D. M. Lunderberg, W. L. Brown, D. A. Day, J. L. Jimenez, W. W. Nazaroff, A. H. Goldstein, and P. F. DeCarlo. 2021b. Large emissions of low-volatility siloxanes during residential oven use. Environmental Science & Technology Letters 8(7):519–524. https://doi.org/10.1021/acs.estlett.1c00433.
Kellenbenz, K. R., and K. M. Shakya. 2021. Spatial and temporal variations in indoor radon concentrations in Pennsylvania, USA from 1988 to 2018. Journal of Environmental Radioactivity 233:106594. https://doi.org/10.1016/j.jenvrad.2021.106594.
Kitto, M. 2014. Radon testing in schools in New York State: A 20-year summary. Journal of Environmental Radioactivity 137:213–216. https://doi.org/10.1016/j.jenvrad.2014.07.020.
Krewski, D., J. H. Lubin, J. M. Zielinski, M. Alavanja, V. S. Catalan, R. W. Field, J. B. Klotz, E. G. Létourneau, C. F. Lynch, J. L. Lyon, D. P. Sandler, J. B. Schoenberg, D. J. Steck, J. A. Stolwijk, C. Weinberg, and H. B. Wilcox. 2006. A combined analysis of North American case-control studies of residential radon and lung cancer. Journal of Toxicology and Environmental Health, Part A 69(7-8):533–597. https://doi.org/10.1080/15287390500260945.
Kristensen, K., D. M. Lunderberg, Y. Liu, P. K. Misztal, Y. Tian, C. Arata, W. W. Nazaroff, and A. H. Goldstein. 2019. Sources and dynamics of semivolatile organic compounds in a single-family residence in northern California. Indoor Air 29(4):645–655. https://doi.org/10.1111/ina.12561.
Kuhn, E. J., G. S. Walker, H. Whiley, J. Wright, and K. E. Ross. 2019. Household contamination with methamphetamine: Knowledge and uncertainties. International Journal of Environmental Research and Public Health 16(23):4676. https://doi.org/10.3390/ijerph16234676.
Kutarna, S., S. Tang, X. Hu, and H. Peng. 2021. Enhanced nontarget screening algorithm reveals highly abundant chlorinated azo dye compounds in house dust. Environmental Science & Technology 55(8):4729–4739. https://doi.org/10.1021/acs.est.0c06382.
Laborie, S., E. Moreau-Guigon, F. Alliot, A. Desportes, L. Oziol, and M. Chevreuil. 2016. A new analytical protocol for the determination of 62 endocrine-disrupting compounds in indoor air. Talanta 147:132–141. https://doi.org/10.1016/j.talanta.2015.09.028.
Lanki, T., A. Ahokas, S. Alm, N. A. H. Janssen, G. Hoek, J. J. De Hartog, B. Brunekreef, and J. Pekkanen. 2007. Determinants of personal and indoor PM2.5 and absorbance among elderly subjects with coronary heart disease. Journal of Exposure Science & Environmental Epidemiology 17(2):124–133. https://doi.org/10.1038/sj.jes.7500470.
Lee, W.-C., L. Shen, P. J. Catalano, L. J. Mickley, and P. Koutrakis. 2017. Effects of future temperature change on PM2.5 infiltration in the Greater Boston area. Atmospheric Environment 150:98–105. https://doi.org/10.1016/j.atmosenv.2016.11.027.
Levasseur, J. L., S. C. Hammel, K. Hoffman, A. L. Phillips, S. Zhang, X. Ye, A. M. Calafat, T. F. Webster, and H. M. Stapleton. 2021. Young children’s exposure to phenols in the home: Associations between house dust, hand wipes, silicone wristbands, and urinary biomarkers. Environment International 147:106317. https://doi.org/10.1016/j.envint.2020.106317.
Li, M., C. J. Weschler, G. Beko, P. Wargocki, G. Lucic, and J. Williams. 2020. Human ammonia emission rates under various indoor environmental conditions. Environmental Science & Technology 54(9):5419–5428. https://doi.org/10.1021/acs.est.0c00094.
Liang, D., W.-C. Lee, J. Liao, J. Lawrence, J. M. Wolfson, S. T. Ebelt, C.-M. Kang, P. Koutrakis, and J. A. Sarnat. 2021. Estimating climate change-related impacts on outdoor air pollution infiltration. Environmental Research 196:110923. https://doi.org/10.1016/j.envres.2021.110923.
Licina, D., and S. Langer. 2021. Indoor air quality investigation before and after relocation to WELL-certified office buildings. Building and Environment 204:108182. https://doi.org/10.1016/j.buildenv.2021.108182.
Licina, D., G. C. Morrison, G. Beko, C. J. Weschler, and W. W. Nazaroff. 2019. Clothing-mediated exposures to chemicals and particles. Environmental Science & Technology 53:5559–5575.
Licina, D., Y. Tian, and W. W. Nazaroff. 2017. Emission rates and the personal cloud effect associated with particle release from the perihuman environment. Indoor Air 27:79–802. https://doi.org/10.1111/ina.12365.
Liu, M., C.-M. Kang, J. M. Wolfson, L. Li, B. Coull, J. Schwartz, and P. Koutrakis. 2020. Measurements of gross α- and β-activities of archived PM2.5 and PM10 Teflon filter samples. Environmental Science & Technology 54(19):11780–11788. https://doi.org/10.1021/acs.est.0c02284.
Liu, Q.-T., R. Chen, B. E. McCarry, M. L. Diamond, and B. Bahavar. 2003. Characterization of polar organic compounds in the organic film on indoor and outdoor glass windows. Environmental Science & Technology 37(11):2340–2349. https://doi.org/10.1021/es020848i.
Liu, S., S. L. Thompson, H. Stark, P. J. Ziemann, and J. L. Jimenez. 2017. Gas-phase carboxylic acids in a university classroom: Abundance, variability, and sources. Environmental Science & Technology 51(10):5454–5463. https://doi.org/10.1021/acs.est.7b01358.
Liu, Y., P. K. Misztal, J. Xiong, Y. Tian, C. Arata, R. J. Weber, W. W. Nazaroff, A. H. Goldstein. 2019. Characterizing sources and emissions of volatile organic compounds in a northern California residence using space- and time-resolved measurements. Indoor Air 29(4):630–644. https://doi.org/10.1111/ina.12562.
Lucattini, L., G. Poma, A. Covaci, J. de Boer, M. H. Lamoree, and P. E. G. Leonards. 2018. A review of semi-volatile organic compounds (SVOCs) in the indoor environment: occurrence in consumer products, indoor air and dust. Chemosphere 201:466–482. https://doi.org/10.1016/j.chemosphere.2018.02.161.
Lucchini, R. G., D. C. Dorman, A. Elder, and B. Veronesi. 2012. Neurological impacts from inhalation of pollutants and the nose-brain connection. Neurotoxicology 33(4):838–841. https://doi.org/10.1016/j.neuro.2011.12.001.
Lunderberg, D. M., K. Kristensen, Y. Liu, P. K. Misztal, Y. Tian, C. Arata, R. Wernis, N. Kreisberg, W. W. Nazaroff, and A. H. Goldstein. 2019. Characterizing airborne phthalate concentrations and dynamics in a normally occupied residence. Environmental Science & Technology 53(13):7337–7346. https://doi.org/10.1021/acs.est.9b02123.
Lunderberg, D. M., K. Kristensen, Y. Tian, C. Arata, P. K. Misztal, Y. Liu, N. Kreisberg, E. F. Katz, P. F. DeCarlo, S. Patel, M. E. Vance, W. W. Nazaroff, and A. H. Goldstein. 2020. Surface emissions modulate indoor SVOC concentrations through volatility-dependent partitioning. Environmental Science & Technology 54(11):6751–6760. https://doi.org/10.1021/acs.est.0c00966.
Ma, J., T. McHugh, L. Beckley, M. Lahvis, G. DeVaull, and L. Jiang. 2020. Vapor intrusion investigations and decision-making: A critical review. Environmental Science & Technology 54(12):7050–7069. https://doi.org/10.1021/acs.est.0c00225.
Man, X., Y. Lu, G. Li, Y. Wang, and J. Liu. 2019. A study on the stack effect of a super high-rise residential building in a severe cold region in China. Indoor and Built Environment 29(2):255–269. https://doi.org/10.1177/1420326X19856045.
Mandin, C., M. Trantallidi, A. Cattaneo, N. Canha, V. G. Mihucz, T. Szigeti, R. Mabilia, E. Perreca, A. Spinazzè, S. Fossati, Y. De Kluizenaar, E. Cornelissen, I. Sakellaris, D. Saraga, O. Hänninen, E. De Oliveira Fernandes, G. Ventura, P. Wolkoff, P. Carrer, and J. Bartzis. 2017. Assessment of indoor air quality in office buildings across Europe - The OFFICAIR study. Science of the Total Environment 579:169–178.
Marek, R. F., P. S. Thorne, N. J. Herkert, A. M. Awad, and K. C. Hornbuckle. 2017. Airborne PCBs and OH-PCBs inside and outside urban and rural U.S. schools. Environmental Science & Technology 51(14):7853–7860. https://doi.org/10.1021/acs.est.7b01910.
Mattila, J. M., P. S. J. Lakey, M. Shiraiwa, C. Wang, J. P. D. Abbatt, C. Arata, A. H. Goldstein, L. Ampollini, E. F. Katz, P. F. DeCarlo, S. Zhou, T. F. Kahan, F. J. Cardoso-Saldaña, L. H. Ruiz, A. Abeleira, E. K. Boedicker, M. E. Vance, and D. K. Farmer. 2020. Multiphase chemistry controls inorganic chlorinated and nitrogenated compounds in indoor air during bleach cleaning. Environmental Science & Technology 54(3):1730–1739. https://doi.org/10.1021/acs.est.9b05767.
Meyer, I., J. Heinrich, and U. Lippold. 1999. Factors affecting lead, cadmium, and arsenic levels in house dust in a smelter town in Eastern Germany. Environmental Research 81(1):32–44. https://doi.org/10.1006/enrs.1998.3950.
Misztal, P. K., D. S. Lymperopoulou, R. I. Adams, R. A. Scott, S. E. Lindow, T. Bruns, J. W. Taylor, J. Uehling, G. Bonito, R. Vilgalys, and A. H. Goldstein. 2018. Emission factors of microbial volatile organic compounds from environmental bacteria and fungi. Environmental Science & Technology 52(15):8272–8282. https://doi.org/10.1021/acs.est.8b00806.
Molnár, P., S. Johannesson, and U. Quass. 2014. Source apportionment of PM2.5 using positive matrix factorization (PMF) and PMF with factor selection. Aerosol and Air Quality Research 14(3):725–733. https://doi.org/10.4209/aaqr.2013.11.0335.
Morales-McDevitt, M. E., J. Becanova, A. Blum, T. A. Bruton, S. Vojta, M. Woodward, and R. Lohmann. 2021. The air that we breathe: Neutral and volatile PFAS in indoor air. Environmental Science & Technology Letters 8(10):897–902. https://doi.org/10.1021/acs.estlett.1c00481.
Morawska, L., G. A. Ayoko, G. N. Bae, G. Buonanno, C. Y. H. Chao, S. Clifford, S. C. Fu, O. Hänninen, C. He, C. Isaxon, M. Mazaheri, T. Salthammer, M. S. Waring, and A. Wierzbicka. 2017. Airborne particles in indoor environment of homes, schools, offices and aged care facilities: The main routes of exposure. Environment International 108:75–83. https://doi.org/10.1016/j.envint.2017.07.025.
Mullen, N. A., J. Li, M. L. Russell, M. Spears, B. D. Less, and B. C. Singer. 2016. Results of the California Healthy Homes Indoor Air Quality Study of 2011–2013: Impact of natural gas appliances on air pollutant concentrations. Indoor Air 26(2):231–245. https://doi.org/10.1111/ina.12190.
NASEM (National Academies of Sciences, Engineering, and Medicine). 2016. Health Risks of Indoor Exposure to Particulate Matter: Workshop Summary. Washington, DC: The National Academies Press.
Nazaroff, W. W., and C. J. Weschler. 2020. Indoor acids and bases. Indoor Air 30(4):559–644. https://doi.org/10.1111/ina.12670.
Nazaroff, W. W., and C. J. Weschler. 2022. Indoor ozone: Concentrations and influencing factors. Indoor Air 32:e12942.
Nirlo, E. L., N. Crain, R. L. Corsi, and J. A. Siegel. 2014. Volatile organic compounds in fourteen U.S. retail stores. Indoor Air 24(5):484–494. https://doi.org/10.1111/ina.12101.
Oberdörster, G. 2001. Pulmonary effects of inhaled ultrafine particles. International Archives of Occupational and Environmental Health 74(1):1–8. https://pubmed.ncbi.nlm.nih.gov/11196075/.
Oberdörster, G., and M. J. Utell. 2002. Ultrafine particles in the urban air: To the respiratory tract—and beyond? Environmental Health Perspectives 110(8):A440–441. https://pubmed.ncbi.nlm.nih.gov/12153769/.
O’Brien, R. E., Y. Li, K. J. Kiland, E. F. Katz, V. W. Or, E. Legaard, E. Q. Walhout, C. Thrasher, V. H. Grassian, P. F. DeCarlo, A. K. Bertram, and M. Shiraiwa. 2021. Emerging investigator series: Chemical and physical properties of organic mixtures on indoor surfaces during HOMEChem. Environmental Science: Processes & Impacts 23(4):559–568. https://doi.org/10.1039/D1EM00060H.
Odabasi, M. 2008. Halogenated volatile organic compounds from the use of chlorine-bleach-containing household products. Environmental Science & Technology 42(5):1445–1451. https://doi.org/10.1021/es702355u.
Olson, D. A., and R. L. Corsi. 2004. In-home formation and emissions of trihalomethanes: The role of residential dishwashers. Journal of Exposure Science & Environmental Epidemiology 14(2):109–119. https://doi.org/10.1038/sj.jea.7500295.
Omur-Ozbek, P., D. Akalp, and A. Whelton. 2016. Tap water and indoor air contamination due to an unintentional chemical spill in source water. In Proceedings of International Structural Engineering and Construction: Interaction between Theory and Practice in Civil Engineering and Construction 3(1), edited by R. Komurlu, A. P. Gurgun, A. Singh, and S. Yazdani. Fargo, ND: ISEC. https://www.isec-society.org/ISEC_PRESS/EURO_MED_SEC_01/html/AW-11.xml. Accessed May 13, 2022.
Or, V. W., M. R. Alves, M. Wade, S. Schwab, R. L. Corsi, and V. H. Grassian. 2018. Crystal clear? Microspectroscopic imaging and physicochemical characterization of indoor depositions on window glass. Environmental Science & Technology Letters 5(8):514–519. https://doi.org/10.1021/acs.estlett.8b00355.
OSHA (Occupational Safety and Health Administration). 2007. Evaluation Guidelines for Surface Sampling Methods. T-006-01-0104-M. Salt Lake City, UT: OSHA Salt Lake Technical Center.
Ouyang, X., J. M. Weiss, J. de Boer, M. H. Lamoree, and P. E. G. Leonards. 2017. Non-target analysis of household dust and laundry dryer lint using comprehensive two-dimensional liquid chromatography coupled with time-of-flight mass spectrometry. Chemosphere 166:431–437. https://doi.org/10.1016/j.chemosphere.2016.09.107.
Overdahl, K. E., D. Gooden, B. Bobay, G. J. Getzinger, H. M. Stapleton, and P. L. Ferguson. 2021. Characterizing azobenzene disperse dyes in commercial mixtures and children’s polyester clothing. Environmental Pollution 287:117299. https://doi.org/10.1016/j.envpol.2021.117299.
Padilla-Sánchez, J. A., E. Papadopoulou, S. Poothong, and L. S. Haug. 2017. Investigation of the Best Approach for Assessing Human Exposure to Poly- and Perfluoroalkyl Substances through Indoor Air. Environmental Science & Technology 51(21):12836–12843. https://doi.org/10.1021/acs.est.7b03516.
Papatheodorou, S., W. Yao, C. L. Z. Vieira, L. Li, B. J. Wylie, J. Schwartz, and P. Koutrakis. 2021. Residential radon exposure and hypertensive disorders of pregnancy in Massachusetts, USA: A cohort study. Environment International 146:106285. https://doi.org/10.1016/j.envint.2020.106285.
Parnis, J. M., T. Taskovic, A. K. D. Celsie, and D. Mackay. 2020. Indoor dust/air partitioning: Evidence for kinetic delay in equilibration for low-volatility SVOCs. Environmental Science & Technology 54(11):6723–6729. https://doi.org/10.1021/acs.est.0c00632.
Patel, S., S. Sankhyan, E. K. Boedicker, P. F. DeCarlo, D. K. Farmer, A. H. Goldstein, E. F. Katz, W. W. Nazaroff, Y. Tian, J. Vanhanen, and M. E. Vance. 2020. Indoor particulate matter during HOMEChem: Concentrations, size distributions, and exposures. Environmental Science & Technology 54(12):7107–7116. https://doi.org/10.1021/acs.est.0c00740.
Peng, H., D. M. V. Saunders, J. Sun, P. D. Jones, C. K. C. Wong, H. Liu, and J. P. Giesy. 2016. Mutagenic azo dyes, rather than flame retardants, are the predominant brominated compounds in house dust. Environmental Science & Technology 50(23):12669–12677. https://doi.org/10.1021/acs.est.6b03954.
Percy, Z., A. M. Vuong, M. Ospina, A. M. Calafat, M. J. La Guardia, Y. Xu, R. C. Hale, K. N. Dietrich, C. Xie, B. P. Lanphear, J. M. Braun, K. M. Cecil, K. Yolton, and A. Chen. 2020. Organophosphate esters in a cohort of pregnant women: Variability and predictors of exposure. Environmental Research 184:109255. https://doi.org/10.1016/j.envres.2020.109255.
Pigg, S., D. Cautley, and P. W. Francisco. 2018. Impacts of weatherization on indoor air quality: A field study of 514 homes. Indoor Air 28(2):307–317. https://doi.org/10.1111/ina.12438.
Polidori, A., B. Turpin, Q. Y. Meng, J. H. Lee, C. Weisel, M. Morandi, S. Colome, T. Stock, A. Winer, J. Zhang, J. Kwon, S. Alimokhtari, D. Shendell, J. Jones, C. Farrar, and S. Maberti. 2006. Fine organic particulate matter dominates indoor-generated PM2.5 in RIOPA homes. Journal of Exposure Science & Environmental Epidemiology 16(4):321–331. https://doi.org/10.1038/sj.jes.7500476.
Pope, C. A., and D. W. Dockery. 2006. Health effects of fine particulate air pollution: Lines that connect. Journal of the Air & Waste Management Association 56(6):709–742. https://doi.org/10.1080/10473289.2006.10464485.
Poppendieck, D. G., L. C. Ng, A. K. Persily, and A. T. Hodgson. 2015. Long term air quality monitoring in a net-zero energy residence designed with low emitting interior products. Building and Environment 94:33-42. https://doi.org/10.1016/j.buildenv.2015.07.001.
Price, D. J., D. A. Day, D. Pagonis, H. Stark, L. B. Algrim, A. V. Handschy, S. Liu, J. E. Krechmer, S. L. Miller, J. F. Hunter, J. A. de Gouw, P. J. Ziemann, and J. L. Jimenez. 2019. Budgets of organic carbon composition and oxidation in indoor air. Environmental Science & Technology 53(22):13053–13063. https://doi.org/10.1021/acs.est.9b04689.
Price, D. J., D. A. Day, D. Pagonis, H. Stark, A. V. Handschy, L. B. Algrim, S. L. Miller, J. A. de Gouw, P. J. Ziemann, and J. L. Jimenez. 2021. Sources of gas-phase species in an art museum from comprehensive real-time measurements. ACS Earth and Space Chemistry 5(9):2252–2267. https://doi.org/10.1021/acsearthspacechem.1c00229.
Proctor, C. R., J. Lee, D. Yu, A. D. Shah, and A. J. Whelton. 2020. Wildfire caused widespread drinking water distribution network contamination. AWWA Water Science 2(4):e1183. https://doi.org/10.1002/aws2.1183.
Provoost, J., R. Ottoy, L. Reijnders, J. Bronders, I. V. Keer, F. Swartjes, D. Wilczek, and D. Poelmans. 2011. Henry’s equilibrium partitioning between ground water and soil air: Predictions versus observations. Journal of Environmental Protection 2(7):9. https://doi.org/10.4236/jep.2011.27099.
Prussin, A. J., and L. C. Marr. 2015. Sources of airborne microorganisms in the built environment. Microbiome 3(1):78. https://doi.org/10.1186/s40168-015-0144-z.
Rager, J. E., M. J. Strynar, S. Liang, R. L. McMahen, A. M. Richard, C. M. Grulke, J. F. Wambaugh, K. K. Isaacs, R. Judson, A. J. Williams, and J. R. Sobus. 2016. Linking high resolution mass spectrometry data with exposure and toxicity forecasts to advance high-throughput environmental monitoring. Environment International 88:269–280. https://doi.org/10.1016/j.envint.2015.12.008.
Rostkowski, P., P. Haglund, R. Aalizadeh, N. Alygizakis, N. Thomaidis, J. B. Arandes, P. B. Nizzetto, P. Booij, H. Budzinski, P. Brunswick, A. Covaci, C. Gallampois, S. Grosse, R. Hindle, I. Ipolyi, K. Jobst, S. L. Kaserzon, P. Leonards, F. Lestremau, T. Letzel, J. Magnér, H. Matsukami, C. Moschet, P. Oswald, M. Plassmann, J. Slobodnik, and C. Yang. 2019. The strength in numbers: Comprehensive characterization of house dust using complementary mass spectrometric techniques. Analytical and Bioanalytical Chemistry 411(10):1957–1977. https://doi.org/10.1007/s00216-019-01615-6.
Ryan, P. H., C. Brokamp, Z.-H. Fan, and M. B. Rao. 2015. Analysis of personal and home characteristics associated with the elemental composition of PM2.5 in indoor, outdoor, and personal air in the RIOPA study. Research Report (Health Effects Institute) 185:3–40.
Salonen, H., T. Salthammer, and L. Morawska. 2018. Human exposure to ozone in school and office indoor environments. Environment International 119:503–514. https://doi.org/10.1016/j.envint.2018.07.012.
Salthammer, T., S. Mentese, and R. Marutzky. 2010. Formaldehyde in the indoor environment. Chemical Reviews 110(4):2536–2572. https://doi.org/10.1021/cr800399g.
Sankhyan, S., S. Patel, E. F. Katz, P. F. DeCarlo, D. K. Farmer, W. W. Nazaroff, and M. E. Vance. 2021. Indoor black carbon and brown carbon concentrations from cooking and outdoor penetration: Insights from the HOMEChem study. Environmental Science: Processes & Impacts 23(10):1476–1487. https://doi.org/10.1039/D1EM00283J.
Schmidt, C. W. 2016. Pollen overload: Seasonal allergies in a changing climate. Environmental Health Perspectives 124(4):A70–A75. https://doi.org/10.1289/ehp.124-A70.
Schraufnagel, D.E. 2020. The health effects of ultrafine particles. Experimental & Molecular Medicine 52:311–317. https://doi.org/10.1038/s12276-020-0403-3.
Schripp, T., S. Etienne, C. Fauck, F. Fuhrmann, L. Märk, and T. Salthammer. 2014. Application of proton-transfer-reaction-mass-spectrometry for Indoor Air Quality research. Indoor Air 24(2):178–189. https://doi.org/10.1111/ina.12061.
Sheu, R., C. Stönner, J. C. Ditto, T. Klüpfel, J. Williams, and D. R. Gentner. 2020. Human transport of thirdhand tobacco smoke: A prominent source of hazardous air pollutants into indoor nonsmoking environments. Science Advances 6(10):eaay4109. https://doi.org/10.1126/sciadv.aay4109.
Shu, S., and G. C. Morrison. 2011. Surface reaction rate and probability of ozone and alpha-terpineol on glass, polyvinyl chloride, and latex paint surfaces. Environmental Science & Technology 45(10):4285–4292. https://doi.org/10.1021/es200194e.
Slezakova, K., C. Peixoto, M. Oliveira, C. Delerue-Matos, M. d. C. Pereira, and S. Morais. 2018. Indoor particulate pollution in fitness centres with emphasis on ultrafine particles. Environmental Pollution 233:180–193. https://doi.org/10.1016/j.envpol.2017.10.050.
Snyder, K., J. H. Vick, and B. A. King. 2016. Smoke-free multiunit housing: A review of the scientific literature. Tobacco Control 25(1):9–20. https://doi.org/10.1136/tobaccocontrol-2014-051849.
Stanley, F. K. T., J. L. Irvine, W. R. Jacques, S. R. Salgia, D. G. Innes, B. D. Winquist, D. Torr, D. R. Brenner, and A. A. Goodarzi. 2019. Radon exposure is rising steadily within the modern North American residential environment, and is increasingly uniform across seasons. Scientific Reports 9(1):18472. https://doi.org/10.1038/s41598-019-54891-8.
Stapleton, H. M., J. G. Allen, S. M. Kelly, A. Konstantinov, S. Klosterhaus, D. Watkins, M. D. McClean, and T. F. Webster. 2008. Alternate and new brominated flame retardants detected in U.S. house dust. Environmental Science & Technology 42(18):6910–6916. https://doi.org/10.1021/es801070p.
Stapleton, H. M., S. Eagle, A. Sjödin, and T. F. Webster. 2012. Serum PBDEs in a North Carolina toddler cohort: Associations with handwipes, house dust, and socioeconomic variables. Environmental Health Perspectives 120(7): 1049–1054. https://doi.org/10.1289/ehp.1104802.
Stein, M. M., C. L. Hrusch, J. Gozdz, C. Igartua, V. Pivniouk, S. E. Murray, J. G. Ledford, M. Marques dos Santos, R. L. Anderson, N. Metwali, J. W. Neilson, R. M. Maier, J. A. Gilbert, M. Holbreich, P. S. Thorne, F. D. Martinez,
E. von Mutius, D. Vercelli, C. Ober, and A. I. Sperling. 2016. Innate immunity and asthma risk in Amish and Hutterite farm children. New England Journal of Medicine 375(5):411–421. https://doi.org/10.1056/NEJMoa1508749.
Tan, H., L. Yang, Y. Huang, L. Tao, and D. Chen. 2021. “Novel” Synthetic Antioxidants in House Dust from Multiple Locations in the Asia-Pacific Region and the United States. Environmental Science & Technology 55(13):8675–8682. https://doi.org/10.1021/acs.est.1c00195.
Tang, X., P. K. Misztal, W. W. Nazaroff, and A. H. Goldstein. 2015. Siloxanes are the most abundant volatile organic compound emitted from engineering students in a classroom. Environmental Science & Technology Letters 2(11):303–307. https://doi.org/10.1021/acs.estlett.5b00256.
Tecle, A., and D. G. Neary. 2015. Water quality impacts of forest fires. Journal of Pollution Effects and Control 3:1–7. https://doi.org/10.4172/2375-4397.1000140.
Tran, T. M., K. O. Abualnaja, A. G. Asimakopoulos, A. Covaci, B. Gevao, B. Johnson-Restrepo, T. A. Kumosani, G. Malarvannan, T. B. Minh, H.-B. Moon, H. Nakata, R. K. Sinha, and K. Kannan. 2015. A survey of cyclic and linear siloxanes in indoor dust and their implications for human exposures in twelve countries. Environment International 78:39–44. https://doi.org/10.1016/j.envint.2015.02.011.
Tran Le, A. D., J. S. Zhang, and Z. Liu. 2021. Impact of humidity on formaldehyde and moisture buffering capacity of porous building material. Journal of Building Engineering 36:102114. https://doi.org/10.1016/j.jobe.2020.102114.
Turpin, B., C. Weisel, M. Morandi, S. Colome, T. Stock, S. Eisenreich, and B. Buckley. 2007. Relationships of Indoor, Outdoor, and Personal Air (RIOPA): Part II. Analyses of concentrations of particulate matter species. Research Report (Health Effects Institute) 130:1–77.
Uchiyama, S., T. Tomizawa, A. Tokoro, M. Aoki, M. Hishiki, T. Yamada, R. Tanaka, H. Sakamoto, T. Yoshida, K. Bekki, Y. Inaba, H. Nakagome, and N. Kunugita. 2015. Gaseous chemical compounds in indoor and outdoor air of 602 houses throughout Japan in winter and summer. Environmental Research 137:364–372. https://doi.org/10.1016/j.envres.2014.12.005.
Ulrich, E. M., J. R. Sobus, C. M. Grulke, A. M. Richard, S. R. Newton, M. J. Strynar, K. Mansouri, and A. J. Williams. 2019. EPA’s non-targeted analysis collaborative trial (ENTACT): Genesis, design, and initial findings. Analytical and Bioanalytical Chemistry 411(4):853–866. https://doi.org/10.1007/s00216-018-1435-6.
Unnithan, A., D. N. Bekele, S. Chadalavada, and R. Naidu. 2021. Insights into vapour intrusion phenomena: Current outlook and preferential pathway scenario. Science of the Total Environment 796:148885. https://doi.org/10.1016/j.scitotenv.2021.148885.
USHUD. 2018. Water Piping in the Home. https://www.huduser.gov/portal/pdredge/pdr-edge-trending-091018.html. Accessed May 13, 2022.
Vardoulakis, S., E. Giagloglou, S. Steinle, A. Davis, A. Sleeuwenhoek, K. Galea, K. Dixon, and J. Crawford. 2020. Indoor exposure to selected air pollutants in the home environment: A systematic review. International Journal of Environmental Research and Public Health 17(23):8972. https://doi.org/10.3390/ijerph17238972.
Venier, M., O. Audy, Š. Vojta, J. Bečanová, K. Romanak, L. Melymuk, M. Krátká, P. Kukučka, J. Okeme, A. Saini, M. L. Diamond, and J. Klánová. 2016. Brominated flame retardants in the indoor environment - Comparative study of indoor contamination from three countries. Environ Int 94:150–160. https://doi.org/10.1016/j.envint.2016.04.029.
Vykoukalová, M., M. Venier, Š. Vojta, L. Melymuk, J. Bečanová, K. Romanak, R. Prokeš, J. O. Okeme, A. Saini, M. L. Diamond, and J. Klánová. 2017. Organophosphate esters flame retardants in the indoor environment. Environ Int 106:97–104. https://doi.org/10.1016/j.envint.2017.05.020.
Wallace, L. 2000. Correlations of personal exposure to particles with outdoor air measurements: A review of recent studies. Aerosol Science and Technology 32(1):15–25. https://doi.org/10.1080/027868200303894.
Wallace, L., and W. Ott. 2011. Personal exposure to ultrafine particles. Journal of Exposure Science & Environmental Epidemiology 21(1):20–30. https://doi.org/10.1038/jes.2009.59.
Wallace, L., F. Wang, C. Howard-Reed, and A. Persily. 2008. Contribution of gas and electric stoves to residential ultrafine particle concentration between 2 and 64 nm: Size distributions and emission and coagulation rates. Environmental Science & Technology 42(23):8641–8647. https://doi.org/10.1021/es801402v.
Wallace, L. A., S. J. Emmerich, and C. Howard-Reed. 2004. Source strengths of ultrafine and fine particles due to cooking with a gas stove. Environmental Science & Technology 38(8):2304–2311. https://doi.org/10.1021/es0306260.
Wallace, L. A., W. R. Ott, C. J. Weschler, and A. C. K. Lai. 2017. Desorption of SVOCs from heated surfaces in the form of ultrafine particles. Environmental Science & Technology 51(3):1140–1146. https://doi.org/10.1021/acs.est.6b03248.
Wang, L., A. G. Asimakopoulos, H.-B. Moon, H. Nakata, and K. Kannan. 2013. Benzotriazole, benzothiazole, and benzophe-none compounds in indoor dust from the United States and East Asian countries. Environmental Science & Technology 47(9):4752–4759. https://doi.org/10.1021/es305000d.
Wang, Z., G. W. Walker, D. C. G. Muir, and K. Nagatani-Yoshida. 2020. Toward a global understanding of chemical pollution: A first comprehensive analysis of national and regional chemical inventories. Environmental Science & Technology 54(5):2575–2584. https://doi.org/10.1021/acs.est.9b06379.
Weschler, C. J. 2016. Roles of the human occupant in indoor chemistry. Indoor Air 26:6–24.
Weschler, C. J., and W. W. Nazaroff. 2008. Semivolatile organic compounds in indoor environments. Atmospheric Environment 42(40): 9018–9040. https://doi.org/10.1016/j.atmosenv.2008.09.052.
Weschler, C. J., and W. W. Nazaroff. 2017. Growth of organic films on indoor surfaces. Indoor Air 27(6):1101–1112. https://doi.org/10.1111/ina.12396.
Wiesinger, H., Z. Wang, and S. Hellweg. 2021. Deep dive into plastic monomers, additives, and processing aids. Environmental Science & Technology 55(13):9339–9351. https://doi.org/10.1021/acs.est.1c00976.
Williams, J., C. Stönner, J. Wicker, N. Krauter, B. Derstroff, E. Bourtsoukidis, T. Klüpfel, and S. Kramer. 2016. Cinema audiences reproducibly vary the chemical composition of air during films, by broadcasting scene specific emissions on breath. Scientific Reports 6(1):25464. https://doi.org/10.1038/srep25464.
Winkens, K., J. Koponen, J. Schuster, M. Shoeib, R. Vestergren, U. Berger, A. M. Karvonen, J. Pekkanen, H. Kiviranta, and I. T. Cousins. 2017. Perfluoroalkyl acids and their precursors in indoor air sampled in children’s bedrooms. Environmental Pollution 222:423–432. https://doi.org/10.1016/j.envpol.2016.12.010.
Wong, J. P. S., N. Carslaw, R. Zhao, S. Zhou, and J. P. D. Abbatt. 2017. Observations and impacts of bleach washing on indoor chlorine chemistry. Indoor Air 27(6):1082–1090. https://doi.org/10.1111/ina.12402.
Woolfenden, E. 2010. Sorbent-based sampling methods for volatile and semi-volatile organic compounds in air: Part 1: Sorbent-based air monitoring options. Journal of Chromatography A 1217(16):2674–2684. https://doi.org/10.1016/j.chroma.2009.12.042.
Wu, T., M. Fu, M. Valkonen, M. Täubel, Y. Xu, and B. E. Boor. 2021a. Particle resuspension dynamics in the infant near-floor microenvironment. Environmental Science & Technology 55(3):1864–1875. https://doi.org/10.1021/acs.est.0c06157.
Wu, T., A. Tasoglou, H. Huber, P. S. Stevens, and B. E. Boor. 2021b. Influence of mechanical ventilation systems and human occupancy on time-resolved source rates of volatile skin oil ozonolysis products in a LEED-certified office building. Environmental Science & Technology 55:16477–16488.
Wu, Y., S. S. Cox, Y. Xu, Y. Liang, D. Won, X. Liu, P. A. Clausen, L. Rosell, J. L. Benning, and Y. Zhang. 2016. A reference method for measuring emissions of SVOCs in small chambers. Building and Environment 95:126–132. https://doi.org/10.1016/j.buildenv.2015.08.025.
Xu, J., and J. S. Zhang. 2011. An experimental study of relative humidity effect on VOCs’ effective diffusion coefficient and partition coefficient in a porous medium. Building and Environment 46(9):1785–1796. https://doi.org/10.1016/j.buildenv.2011.02.007.
Xu, Y., Y. Liang, J. R. Urquidi, and J. A. Siegel. 2015. Semi-volatile organic compounds in heating, ventilation, and air-conditioning filter dust in retail stores. Indoor Air 25(1):79–92. https://doi.org/10.1111/ina.12123.
Yang, S., G. Beko, P. Wargocki, J. Williams, and D. Licina. 2021. Human emissions of size-resolved fluorescent-aerosol particles: Influence of personal and environmental factors. Environmental Science & Technology 55(1):509–518. https://doi.org/10.1021/acs.est.0c06304.
Young, C. J., S. Zhou, J. A. Siegel, and T. F. Kahan. 2019. Illuminating the dark side of indoor oxidants. Environmental Science: Processes & Impacts 21(8):1229–1239. https://doi.org/10.1039/C9EM00111E.
Zheng, G., G. M. Filippelli, and A. Salamova. 2020. Increased indoor exposure to commonly used disinfectants during the COVID-19 pandemic. Environmental Science & Technology Letters 7(10):760–765. https://doi.org/10.1021/acs.estlett.0c00587.
Zhou, S., C. J. Young, T. C. VandenBoer, S. F. Kowal, and T. F. Kahan. 2018. Time-resolved measurements of nitric oxide, nitrogen dioxide, and nitrous acid in an occupied New York home. Environmental Science & Technology 52(15):8355–8364. https://doi.org/10.1021/acs.est.8b01792.
Zhukovsky, M., A. Vasilyev, A. Onishchenko, and I. Yarmoshenko. 2018. Review of indoor radon concentrations in schools and kindergartens. Radiation Protection Dosimetry 181(1):6–10. https://doi.org/10.1093/rpd/ncy092.
Zwoź dziak, A., I. Sówka, B. Krupiń ska, J. Zwoź dziak, and A. Nych. 2013. Infiltration or indoor sources as determinants of the elemental composition of particulate matter inside a school in Wrocław, Poland? Building and Environment 66:173.


