
10
International Leadership
This report presents a U.S.-based perspective on the field of chemical engineering, but like most areas of science and engineering, chemical engineering is a globally connected enterprise both commercially and academically. Assigning advances within the field to an individual country is difficult, particularly for commercial innovations developed by multinational companies, but some measures of national scientific (mainly academic) output can be measured quantitatively. To that end, the committee used a methodology developed during a previous National Academies study for benchmarking the competitiveness of U.S. chemical engineering (NRC, 2007). Applying this methodology, the committee examined scientific outputs, defined as papers published in peer-reviewed journals, over 5-year intervals from 1981 to 2020—a period encompassing that covered by the previous study and extending it through the most recent complete calendar year. The committee also estimated the quality and impact of those papers across geographic regions by comparing the field-weighted citation impact of the top 100 papers and the number of highly cited papers.
This chapter provides a perspective on U.S. leadership in chemical engineering that is focused on publications and research output. It should be noted that that the emphases and directions of chemical engineering as a discipline and a profession vary across countries and regions. These variations can result from differences in resource availability, political and economic systems, and chemical engineering education. A more comprehensive view considering national investments in chemical engineering research and development (R&D), training curricula, and impact on gross domestic product, for example, could provide a more nuanced and valuable perspective. Such data, however, are difficult to obtain and are often not disaggregated by field or discipline. Furthermore, such an extensive data analysis was beyond the committee’s charge. In many areas of chemical engineering, moreover, there are clear examples in which national or regional challenges, such as water scarcity, have driven research and technology development at a high level, as well as cases in which existing infrastructure, such as refineries, is well matched to such challenges and therefore enables regional advances.
PUBLICATION RATES AND CITATION ANALYSIS
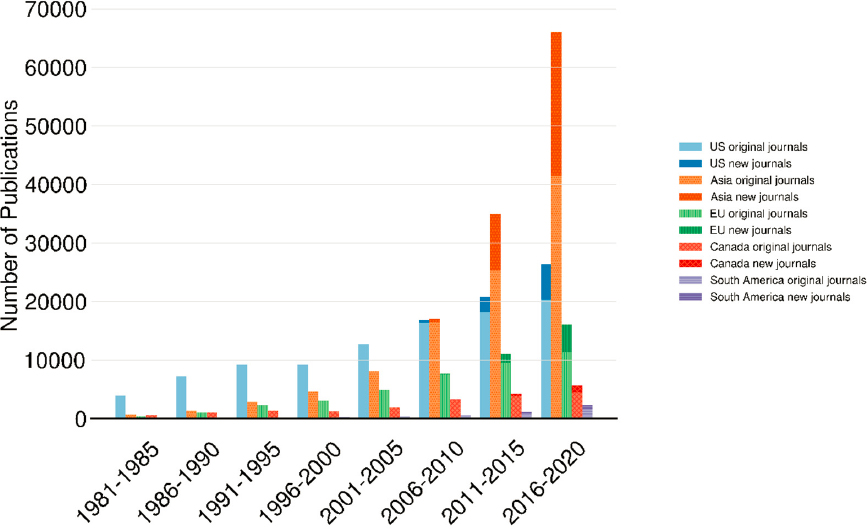
The methodology of the 2007 study was based on analysis of a large base of scientific journals (listed in Appendix 3B of NRC, 2007). For the present analysis, journals on the original list that are no longer being published were removed, and those whose publication began in 2007 or thereafter were incorporated (Appendix B). The total number of papers published was found by searching Scopus for all publications for which any author or coauthor had a chemical engineering affiliation in the address field in each of these journals over each time interval. As indicated in the 2007 report, a chemical engineering affiliation is a reliable measure of a researcher’s being involved in chemical engineering in the United States, but likely undercounts authors in other regions where department names do not necessarily include the term “chemical engineering.” These data include all countries affiliated with each paper. Over the entire 40-year period, 1,250 papers were published with coauthors from the United States, Asia, and the European Union (EU); 6,619 with coauthors from the EU and Asia; 9,722 with coauthors from the United States and the EU; and 16,153 papers were published with coauthors from the United States and Asia. Note that Asia comprises China, Korea, Taiwan, India, and Japan, and the EU includes the current membership and England.
Publishing by U.S. chemical engineers has continued to grow since 2007, but as was already seen in 2007, the rate of growth of the other regions dramatically exceeds that of the United States. Some of this growth was previously attributed to the increased number of researchers in those other regions rather than increased publication rates by individual chemical engineers; indeed, while China currently has a low number of researchers per capita (Heney, 2020), a larger share of their undergraduates is awarded STEM (science, technology, engineering, and mathematics) degrees (49 percent) relative to the share in the United States (33 percent; NSF, 2016). Publications from Asia have grown nearly 100-fold since 1981, eclipsing other regions and making up 57 percent of the total papers published between 2016 and 2020, compared with 23 percent for the United States (Figure 10-1).
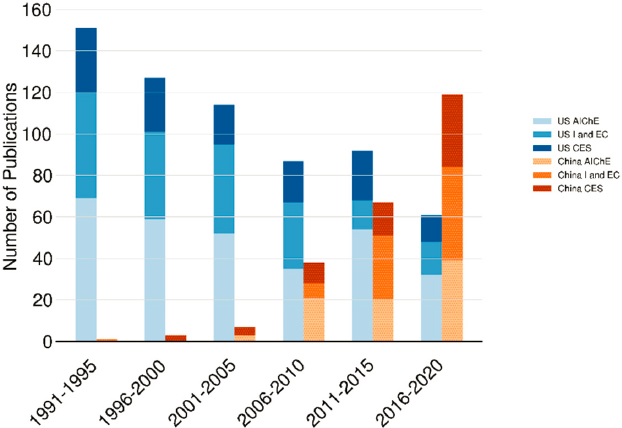
The same trend is visible in the regional shifts in publication in those journals identified as core to chemical engineering in the 2007 study—the AIChE Journal, Industrial & Engineering Chemistry Research, and Chemical Engineering Science (Table 10-1). For these journals, a similar search was performed without specifying chemical engineering affiliation. In the last 5 years for all three journals, Asia has become the dominant source of publications, with 50 percent of the total, while the U.S. share has declined from 42 percent in 1991–1995 to 20 percent in the last 5 years.
While the quantity of articles is easy to determine, their quality and impact are more difficult to ascertain. In the short term, a measure of the impact of a publication is the number of times it is cited (Table 10-2). Asia has recently accounted for the largest share of the 100 most cited articles in the three core chemical engineering journals. For the list of top 100 cited articles, countries within a geographic region that were not included in the original 2007 region search list were binned with that region; for example, Singapore was included in the count for Asia.
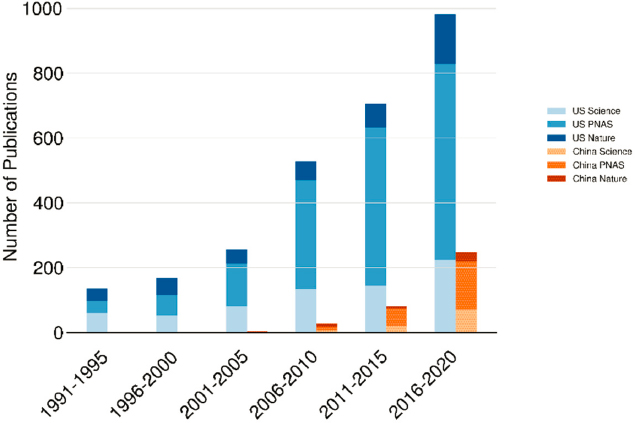
Arguably, the work published by chemical engineers that has the most impact is published in journals whose scope is much broader than chemical engineering. Such journals include Science, Proceedings of the National Academy of Sciences, and Nature. Indeed, the fraction of publications in these three journals with a coauthor having a chemical engineering affiliation has grown over time (Table 10-3), which speaks to a general broadening of the scope and impact of chemical engineering research (or at least research done by chemical engineers). As is the case for the three narrower chemical engineering journals discussed above, contributions from Asia have increased substantially, but in the broader three journals, papers authored by chemical engineers are still primarily of U.S. origin. Interestingly, the number of papers resulting from collaborations across regions has increased substantially in recent decades.
TABLE 10-1 Allocation of All Articles in AIChE Journal, Industrial & Engineering Chemistry (I&EC) Research, and Chemical Engineering Science Published within Previously Defined Regions and Percentages over 5-Year Periods from 1991 to 2020
| Total Articles | 1991–1995 | 1996–2000 | 2001–2005 | 2006–2010 | 2011–2015 | 2016–2020 | |
|---|---|---|---|---|---|---|---|
| AIChE Journal | United States | 716 (66%) | 749 (52%) | 666 (47%) | 504 (31%) | 637 (35%) | 672 (35%) |
| Europe | 180 (16%) | 308 (21%) | 409 (29%) | 448 (28%) | 426 (23%) | 382 (20%) | |
| Asia | 117 (11%) | 190 (13%) | 224 (16%) | 429 (26%) | 587 (32%) | 741 (39%) | |
| Canada | 75 (7%) | 80 (6%) | 83 (6%) | 108 (7%) | 146 (8%) | 138 (7%) | |
| S. Am | 14 (1%) | 23 (2%) | 28 (2%) | 45 (3%) | 24 (1%) | 49 (3%) | |
| Total | 1,091 | 1,440 | 1,431 | 1,619 | 1,825 | 1,922 | |
| I&EC Research | United States | 1,049 (45%) | 1,183 (38%) | 1,463 (33%) | 1,489 (24%) | 1,604 (18%) | 1,615 (19%) |
| Europe | 495 (21%) | 782 (25%) | 1,245 (28%) | 1,526 (25%) | 1,756 (20%) | 1,515 (17%) | |
| Asia | 486 (21%) | 658 (21%) | 1,010 (23%) | 2,083 (34%) | 4,304 (49%) | 4,832 (56%) | |
| Canada | 125 (5%) | 206 (7%) | 266 (6%) | 372 (6%) | 434 (5%) | 447 (5%) | |
| S. Am | 49 (2%) | 86 (3%) | 174 (4%) | 230 (4%) | 316 (4%) | 330 (4%) | |
| Total | 2,317 | 3,094 | 4,410 | 6,114 | 8,765 | 8,698 | |
| Chemical Engineering Science | United States | 587 (27%) | 553 (23%) | 512 (19%) | 599 (19%) | 541 (17%) | 441 (14%) |
| Europe | 757 (35%) | 954 (40%) | 990 (37%) | 1092 (35%) | 1164 (36%) | 969 (30%) | |
| Asia | 262 (12%) | 362 (15%) | 536 (20%) | 724 (23%) | 938 (29%) | 1403 (43%) | |
| Canada | 140 (6%) | 153 (6%) | 168 (6%) | 256 (8%) | 208 (6%) | 201 (6%) | |
| S. Am | 23 (1%) | 65 (3%) | 78 (3%) | 78 (2%) | 60 (2%) | 112 (3%) | |
| Total | 2,159 | 2,377 | 2,686 | 3,135 | 3,232 | 3,265 | |
TABLE 10-2 Region of Authors of the Top 100 Most Cited Articles Published in a Given 5-Year Period between 1991 and 2020 in Selected Core Chemical Engineering Journals: AIChE Journal, Industrial & Engineering Chemistry Research, and Chemical Engineering Science
| 100 most cited | 1991–1995 | 1996–2000 | 2001–2005 | 2006–2010 | 2011–2015 | 2016–2020 | |
|---|---|---|---|---|---|---|---|
| AIChE Journal | United States | 69 | 59 | 52 | 35 | 54 | 32 |
| Europe | 14 | 20 | 28 | 24 | 12 | 15 | |
| Asia | 5 | 9 | 15 | 30 | 27 | 45 | |
| Canada | 10 | 6 | 1 | 8 | 3 | 2 | |
| S. Am | 1 | 1 | 0 | 0 | 0 | 2 | |
| Australia | 1 | 4 | 1 | 2 | 4 | 2 | |
| Other | 0 | 1 | 3 | 1 | 0 | 2 | |
| I&EC Research | United States | 51 | 41 | 43 | 32 | 14 | 16 |
| Europe | 22 | 27 | 30 | 25 | 12 | 13 | |
| Asia | 14 | 19 | 17 | 20 | 56 | 57 | |
| Canada | 3 | 5 | 4 | 10 | 7 | 2 | |
| S. Am | 1 | 0 | 1 | 3 | 0 | 2 | |
| Australia | 4 | 6 | 3 | 9 | 2 | 2 | |
| Other | 5 | 2 | 2 | 1 | 9 | 8 | |
| Chemical Engineering Science | United States | 30 | 26 | 19 | 20 | 24 | 13 |
| Europe | 53 | 51 | 48 | 37 | 34 | 19 | |
| Asia | 4 | 14 | 24 | 22 | 24 | 49 | |
| Canada | 10 | 7 | 4 | 11 | 6 | 7 | |
| S. Am | 0 | 0 | 0 | 2 | 1 | 1 | |
| Australia | 1 | 2 | 3 | 7 | 10 | 5 | |
| Other | 2 | 0 | 2 | 1 | 1 | 6 |
NOTE: Individual articles may be attributed to more than one country.
TABLE 10-3 Number and Percentage by Region of Articles in Science, Proceedings of the National Academy of Sciences (PNAS), and Nature with At Least One Author with a Chemical Engineering Department Affiliation
| 1991–1995 | 1996–2000 | 2001–2005 | 2006–2010 | 2011–2015 | 2016–2020 | ||
|---|---|---|---|---|---|---|---|
| Science | Total Papers | 11,834 | 12,816 | 11,922 | 11,005 | 10,347 | 12,488 |
| Total ChemE | 76 (1%) | 56 (0%) | 84 (1%) | 143 (1%) | 174 (2%) | 277 (2%) | |
| U.S. ChemE | 60 (79%) | 53 (95%) | 81 (96%) | 134 (94%) | 145 (83%) | 225 (81%) | |
| EU ChemE | 12 (16%) | 5 (9%) | 15 (18%) | 26 (18%) | 41 (24%) | 64 (23%) | |
| Asia ChemE | 4 (5%) | 3 (5%) | 6 (7%) | 23 (16%) | 37 (21%) | 101 (36%) | |
| Canada ChemE | 0 (0%) | 0 (0%) | 1 (1%) | 3 (2%) | 5 (3%) | 20 (7%) | |
| S. Am ChemE | 0 (0%) | 0 (0%) | 0 (0%) | 2 (1%) | 1 (1%) | 9 (3%) | |
| Internationalization | 0% | 9% | 23% | 31% | 32% | 51% | |
| PNAS | Total Papers | 12,889 | 13,994 | 15,642 | 19,697 | 21,065 | 19,683 |
| Total ChemE | 40 (0%) | 66 (0%) | 138 (1%) | 377 (2%) | 528 (3%) | 719 (4%) | |
| U.S. ChemE | 38 (95%) | 63 (95%) | 131 (95%) | 336 (89%) | 486 (92%) | 604 (84%) | |
| EU ChemE | 3 (8%) | 2 (3%) | 19 (14%) | 57 (15%) | 100 (19%) | 142 (20%) | |
| Asia ChemE | 1 (3%) | 3 (5%) | 13 (9%) | 40 (11%) | 109 (21%) | 219 (30%) | |
| Canada ChemE | 0 (0%) | 2 (3%) | 4 (3%) | 19 (5%) | 22 (4%) | 43 (6%) | |
| S. Am ChemE | 0 (0%) | 0 (0%) | 1 (1%) | 2 (1%) | 5 (1%) | 9 (1%) | |
| Internationalization | 5% | 6% | 22% | 20% | 37% | 41% | |
| Nature | Total Papers | 15,048 | 14,067 | 12,871 | 12,156 | 12,294 | 11,938 |
| Total ChemE | 48 (0%) | 61 (0%) | 51 (0%) | 73 (1%) | 97 (1%) | 186 (2%) | |
| U.S. ChemE | 38 (79%) | 52 (85%) | 45 (88%) | 58 (79%) | 76 (78%) | 153 (82%) | |
| EU ChemE | 7 (15%) | 4 (7%) | 10 (20%) | 14 (19%) | 28 (29%) | 58 (31%) | |
| Asia ChemE | 5 (10%) | 3 (5%) | 4 (8%) | 6 (8%) | 19 (20%) | 75 (40%) | |
| Canada ChemE | 0 (0%) | 0 (0%) | 2 (4%) | 2 (3%) | 6 (6%) | 17 (9%) | |
| S. Am ChemE | 0 (0%) | 0 (0%) | 0 (0%) | 0 (0%) | 4 (4%) | 3 (2%) | |
| Internationalization | 4% | –3% | 20% | 10% | 37% | 65% | |
NOTES: “Internationalization” indicates the minimum percentage overlap across regions. Not all countries are included in the defined regions, so this is only an approximate measure of international collaboration.
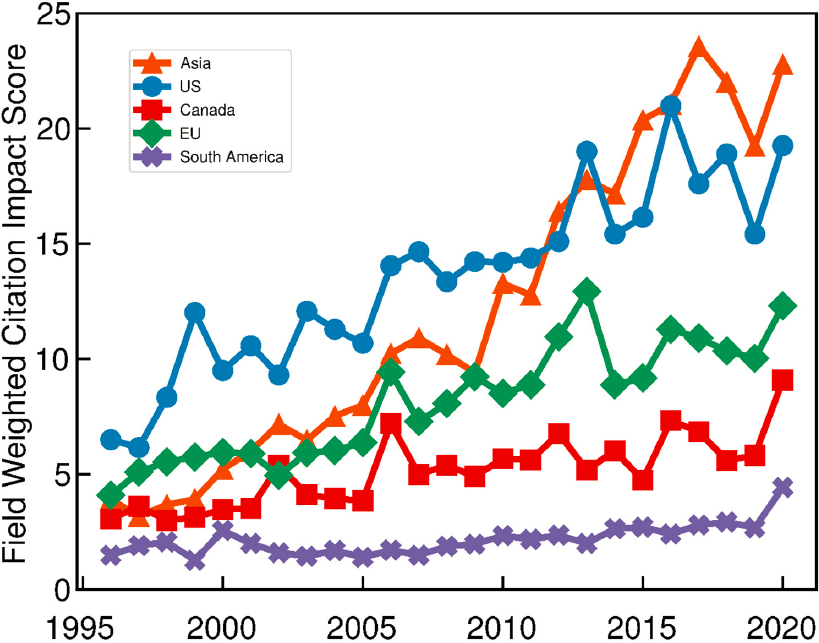
The committee also made use of the Elsevier SciVal tool,1 particularly field-weighted citation impact,2 which indicates how the number of citations of publications from a region compares with the average number of citations of all other similar publications in the data universe, or how the citations of a particular publication compare with the world average. Field-weighted citation impact was averaged for the 100 most cited papers with an author having a chemical engineering affiliation published in each year from each country or region within the comprehensive publication list described in Appendix C (Figure 10-2). In parallel with the other publication metrics reported above, Asia, driven primarily by China, has surpassed other regions and countries in recent years.
___________________
1 See https://www.elsevier.com/solutions/scival.
2 See https://service.elsevier.com/app/answers/detail/a_id/28192/supporthub/scival/p/10961/28192/.
OBSERVATIONS
Beyond the above publication trends, the committee noted differences in chemical engineering advances across specific areas of the world. In energy, for example, the United States is behind both China and Brazil in demonstrating large-scale technologies. The United States remains the leader in catalysis research, which is usually found in chemistry departments in other countries. In the water–energy–food nexus, countries with water scarcity (e.g., Australia, Israel, Saudi Arabia) have advanced R&D much further than has the United States; in fact, in many places in the United States, aspects of the nexus have been used as if they were not independent limited resources.
In the pharmaceutical space, threats from offshore manufacturing include both challenges to the supply chain and concerns about quality control. While the United States still leads the world in the invention and innovation of new therapeutic molecules, India, China, and Singapore are leading the way in the economical production of biosimilar molecules.
In the area of advanced recycling of plastics, the pyrolysis pathway has seen more R&D in Europe than in the United States, a reflection of the difference in refinery capabilities in the two regions. This regional difference has resulted in two trends: many more pyrolysis companies are at pilot and demonstration scales in Europe than in the United States, and more companies in the United States and Canada than in Europe are developing gasification recycling technologies.
In the area of plastics end-of-life management generally, the EU is ahead of the United States in terms of policy drivers toward end-of-life management, as well as such advances in waste conversion as anaerobic digestion and the use of municipal solid waste for energy and other applications. Although there has been a recent increase in funding for and interest in process intensification in the United States, progress in this area has for an extended period been led largely by efforts in Europe.
With respect to the development of tools for future use, the United States leads the world in high-performance computing and the development of new computer architectures. Most codes for molecular simulation were developed in the United States and are open source. The United States also leads in the development of sensors. U.S. leadership is clear as well in the development of tools for medicine (e.g., organs-on-chips), while early work on in vitro models was done in Europe, driven mainly by the region’s ban on animal testing of cosmetics.
CONCLUSION
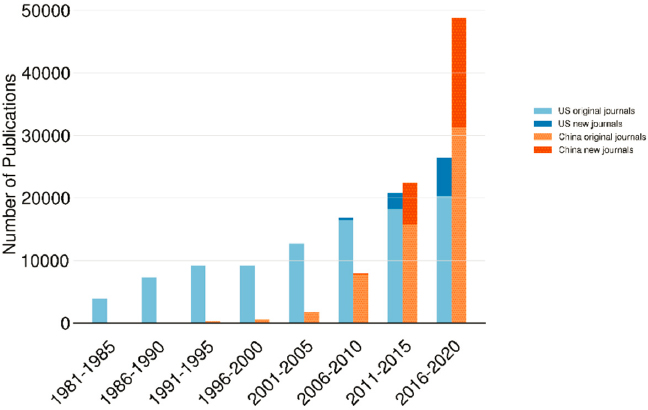
The growth of research output from Asia has been driven mainly by the explosive growth of publications from China (Figure 10-3). This growth reflects a dramatic increase in that country’s research intensity and productivity, which was easy to anticipate simply by extrapolating the 2007 study. More concerning for U.S. leadership in chemical engineering and U.S. security is the quality of the work from China as measured both by citations (Figure 10-4) and by its appearance in elite journals (Figure 10-5). Likewise concerning is patent analysis demonstrating that while the United States currently holds an
above-average revealed technological advantage in chemical engineering and adjacent industries, that advantage shrank over the period analyzed (2012–2014 compared with 2010–2012; Daiko et al., 2017).
There is little doubt regarding China’s commitment to research in areas central to chemical engineering. Even a casual review of China’s Made in China 2025 plan (McBride and Chatzky, 2019) shows a sharp focus on expanding technology and advanced manufacturing—in particular, electric and other alternative-energy vehicles, next-generation information technology, artificial intelligence, new materials, and biomedicine. China also emphasizes semiconductor development and manufacturing. All of these research areas are discussed at various levels of detail in previous chapters of this report. It is clear that anything less than vigorous and sustained investment in these and other areas by the United States will by default cede leadership in technology to China in the next 20 years (Mozur and Myers, 2021).
The increased research output from China is a result of large investments in technology areas, many of which are either central or highly relevant to chemical engineering, investments that are approaching the gross expenditures on R&D of the United States (Heney, 2020).
Similar levels of investment in the U.S. research enterprise are imperative. The committee acknowledges that issues of international leadership are complex, and it is extremely challenging to find a balance between a healthy competitive national aim to lead in a field and national security–driven aspirations of technological superiority, especially given that national needs and priorities differ and can evolve with changing political leadership.
Previous chapters outline the numerous opportunities for chemical engineers to contribute in the areas of energy; food, water, and air; health and medicine; manufacturing; materials; and tools. Without a sustained investment by federal research agencies
across these areas, it will be impossible for the United States to maintain leadership in chemical engineering. At the same time, U.S. chemical engineering will be strengthened through increased coordination and collaboration across disciplines, sectors, and political boundaries. Almost all of the areas of research discussed in this report are multidisciplinary in nature, and close collaboration will be required among researchers in academia and government laboratories and industry practitioners to develop applications that are economically viable and scalable. Such collaborations, as recommended throughout this report, will have additional benefits for graduate education and faculty member development while still satisfying the need of industry to achieve fast results.
International collaborations will continue to yield benefits in all the areas discussed herein. A good example of a format for collaboration is the Global Grand Challenges Summits organized by the National Academy of Engineering, the Chinese Academy of Engineering, and the Royal Academy of Engineering.3 This series of conferences brings together professionals and students to explore solutions to the Grand Challenges for Engineering, and could serve as a venue for creating and sustaining such collaborations.
Recommendation 10-1: Across all areas of chemical engineering, in addition to advancing fundamental understanding, research investments should be set aside for support of interdisciplinary, cross-sector, and international collaborations in the areas of energy; water, food, and air; health and medicine; manufacturing; materials research; tools development; and beyond, with the goal of connecting U.S. research to points of strength in other countries.
___________________


