
3
Input of Oil to the Sea
The life cycle of “oil in the sea” starts with the input of petroleum hydrocarbons, referred to throughout this report as “oil,” to the marine environment. Oil enters the sea from natural seepages and from anthropogenic sources that can originate from routine human activity or from accidental releases. Estimating the volumes of oil inputs is subject to a degree of uncertainty but the relative orders of magnitude and general trends can be established. The rate of discharge of oil must also be considered. Natural seepage—as well as runoff and atmospheric deposition from land-based activity—typically takes place at a low rate, either continuously or intermittently. These chronic or continuous inputs have very different effects on the environments than do accidental spills. Accidental releases garner the most attention when they occur at higher volumes in a relatively short time frame; however, they can also occur at a range of volumes and time frames, and in some instances the releases can continue for months or even years. The volume and the rate of discharge, as well as other factors, are important for the fate and the effects of the oil, as will be discussed in detail in later chapters in this report.
As illustrated in Figure 3.1, this chapter discusses inputs and provides estimates (as possible) from the following sources:
- natural oil and gas seeps
- land-based runoff and atmospheric deposition
- operational discharges from
- extraction of hydrocarbons
- marine transportation
- recreational vessels
- aircraft fuel jettison
- accidental spills from
- extraction of hydrocarbons
- aging infrastructure and decommissioning
- marine transportation by ships and pipelines
- coastal storage facilities
- sunken wrecks
In this report, operational discharges refers to water produced as a by-product from oil extraction and to discharges occurring in a controlled manner during routine machinery and cargo operations on ships. These discharges are governed by international and domestic regulations. Spills refers to all other discharges from marine operations and offshore oil extraction, accidental or intentional, not covered by the controlled routine discharges. For example, discharge of oily water in areas where discharges are prohibited or in quantities exceeding allowable limits, are considered illegal spills in this report. Natural seeps as well as runoff and atmospheric deposition from land-based activity are considered in a category of their own and are not included in the spill volumes.
The objective of this chapter is to provide an update of estimates from the previous Oil in the Sea reports. Therefore, the inputs are estimated using the same basis as in the NRC 2003 report, as much as is practical, to provide a comparison of the relative input volumes and to identify trends since Oil in the Sea III.
- The Oil in the Sea III accidental spill statistics covered a 10-year period from 1990 to 1999. This report covers the period of 10 years from 2010 to 2019.
- The geographic zones used are the same as in the Oil in the Sea III report and they are described in Appendix A.
- The input magnitudes are provided in metric tonnes (MT) for consistency with the previous report.
This report has added sources of oil not included in Oil in the Sea III. Natural gas seeps are estimated in addition to oil seeps. Potential spills from aging infrastructure, decommissioning leakage, and sunken wrecks are evaluated. Oil spills caused by extreme weather events have become a concern, which is covered in this chapter as well.
As described in Chapter 1, to the extent possible with available data, the analysis is of North American waters, which includes the economic exclusive zones (or out to the
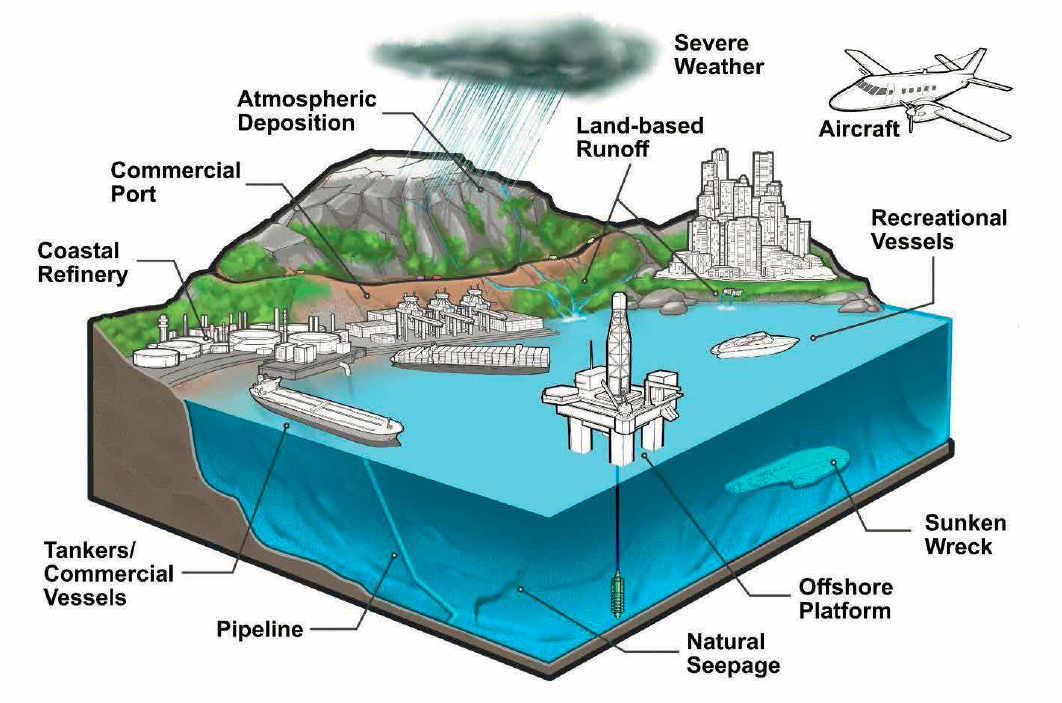
SOURCE: Image provided courtesy of the American Petroleum Institute, produced by Iron Octopus Productions, Inc.
continental shelf, whichever is further offshore) surrounding the United States, Canada, and Mexico.
The past 20 years have brought many changes to how oil is extracted, transported, and consumed. The North American energy landscape has changed with the production of shale oil and gas both in the United States and Canada. In the past, the United States was an importer of oil and gas, but now, because of the increased production and changes in legislation allowing export of crude, the United States has become an exporter of oil and gas. This, as well as Arctic ice melt, has had an impact on terminals and on shipping routes and the frequency of oil movement.
Increase in urban populations in coastal areas, consumer behavior, improved fuel efficiency of vehicles, and introduction of electric cars are all changes impacting land-based consumption and, although more difficult to quantify, inputs of oil into the sea.
The past two decades have been marked by a warming climate and associated extreme weather (NASEM, 2016). This introduces new potential for accidents and also, as sea ice cover continues to decrease, opens up more of the Arctic region for exploration, production, and transportation of oil as well as shipping and tourism (see Box 3.1). Other major changes since the Oil in the Sea III include new regulations on design and operation of ships carrying oil as cargo or as fuel, and on engines used on recreational vessels. Following the Deepwater Horizon (DWH) incident, major changes were introduced to the regulations governing offshore oil and gas operations (some of which vary in the United States from one administration to another). New performance measures and enforcement mechanisms have been introduced to improve pipeline safety. In general, there is an overall recognition of the importance of human factors and human error in the safety across sectors and there has consequently been increased focus on improving the safety culture in the oil and gas exploration, production, and transportation industries.
This chapter begins with an overview of the committee’s findings regarding magnitude and trends of oil volumes entering the sea.1 The following sections then provide detail on each type of input, describing the changes since the Oil in the Sea III report (many of which are regulatory in nature), the data and methodology used for the estimates, and a summary and a comparison of the input volumes. The chapter provides the best estimate and discusses the uncertainty associated with each type of input. However, because the available data does not support rigorous statistical analysis, the chapter does not use statistical approaches to provide the
___________________
1 It should be noted that the Oil in the Sea IV committee’s analysis incorporated information available through 2021.
upper, lower, and most probable values for each category of inputs. The estimates provide insight into the order of magnitude and general trends of the inputs as well as their relative contribution to oil in the sea.
The chapter concludes with a discussion of future predictions on spills based on the current spillage rates and the assumption that the current energy usage trend will continue. It should be noted that the predictions do not account for potential changes in transportation and extraction practices, and they do not assume a future energy transition from oil to a mix of energy sources. They also do not take account for world events that have occurred since the start of the study.
3.1 OVERVIEW OF OIL INPUTS
Although data are lacking for accurately estimating many inputs of oil into North American waters, enough data do exist to at least understand the trends, and in many cases to provide more precise estimations of annual volumes. Overall, looking at oil input to the sea from 2010–2019, as compared to previous reported estimates from 1990–1999, if excluding the DWH event from the 10-year annualized statistics, it is evident that regulatory changes, advances in science and technology, and (for the most part) attention to safety would have helped to make North American waters less polluted with oil, if the DWH event did not happen. Although this trend is likely to continue, there is also the risk of a “black swan” type event, a failure of a system, as seen in 2010 with the DWH: a low-probability occurrence with detrimental effects and consequently, with volumes of oil that dwarf other sources. There are also new potential sources for oil pollution in North American and global waters, such as those related to the aging infrastructure in the sea and along the coasts; sea-level rise; increased intensification and frequency of storms; use and transport of new types of oil; changes in shipping routes including travel through arctic regions; shifts in workforce, expertise and asset ownership in the energy industry; warfare; and others.
Figure 3.3 shows the total inputs of oil in the sea, by geographic region, according to natural inputs (see Section 3.2), land-based sources (see Section 3.3), operational discharges (see Section 3.4), and accidental spills (see Section 3.5). The annual estimates of land-based sources, by far, outweigh other sources; this includes using the DWH oil spill and the worst-case projection for the Mississippi Canyon 20 oil spill in the estimates. Land-based sources include only land-based runoff; the committee did not include estimates for atmospheric deposition. Land-based runoff was calculated using the same approach as Oil in the Sea III and is based on several assumptions. The increase in estimates compared to Oil in the Sea III is within the range of uncertainty, and it is therefore not possible to determine if there has been a quantitative increase. These estimates are in line with global estimates (which are closer to 30 times as high as those reported in Oil in the Sea III), and it is plausible that there has been an increase in land-based runoff over the past two decades corresponding to an increase in the number of vehicles being used.
The second highest input is from natural seeps. These estimations were derived using more advanced techniques, such as satellite data, than in previous Oil in the Sea studies. The committee’s estimates of natural seeps are roughly one-third lower than reported in Oil in the Sea III, and reflect updated estimates for the Gulf of Mexico; new data was not available for other North American regions.
Operational discharges presented in this report include produced water and discharges from machinery operations on commercial vessels. In the absence of non-compliance data, full compliance of oily discharges from tank vessels and non-tank vessels is assumed and illegal discharges are regarded as spills. Regulations prohibit discharges of oily water from cargo areas in tank vessels in North American waters, and therefore there is no discharge to report. Assuming full compliance, all discharges from commercial vessel operations are small, less than 10 MT per year. Because Oil in the Sea III discharge amounts assumed non-compliance, a direct comparison is not meaningful. Although it can be safely assumed that discharges from recreational boating greatly decreased with regulatory actions to ban sales of two-stroke engines, there is no data available for estimating actual discharges of oil in the marine environment from this source. Estimates are also not included for aircraft fuel jettison, as (1) the fuel volumes are not reported and (2) more research is needed to understand how much (if any) fuel jettisoned enters the sea. Produced water estimates are higher in total than they were 20 years ago, reflective of increased oil production.
Annualized estimates of spills represent the third highest input even if one includes a 10-year annualized estimate from the DWH spill. It should be noted, the estimates of annual input from the Mississippi Canyon-20 spill vary greatly and the estimates for the time period of 2000–2019 will more accurately reflect annual spillage if and when this volume is published. Spills occurred more frequently in offshore waters than nearshore waters and predominantly occurred in the Gulf of Mexico. Over 20 years, the volume of spills decreased significantly for pipelines, tank vessels, non-tank vessels, and coastal refineries.
Table 3.1 includes the total oil inputs broken down by natural, extraction, transportation, and consumption for direct comparison with estimates reported in Oil in the Sea III. Estimates of natural sources are roughly one-third lower than reported in Oil in the Sea III. Amounts of oil entering the marine environment by extraction have more than doubled but still remain relatively low, except when the DWH oil spill is annualized and included in the statistics. Spills and discharges related to transportation of petroleum are more than 10 times lower than they were 20 years ago. Then there is the category of consumption: oil entering the sea through consumption of oil has potentially increased significantly over the past 20 years; however, this estimation
is heavily weighted by an estimate of land-based runoff that is largely based on assumptions (similar to Oil in the Sea III calculations), as appropriate measurements do not exist for providing data-based estimates for land-based runoff. The same is true for other input sources. An important factor in calculating land-based runoff for a region is number of vehicles; however, trends such as increased fuel efficiency, increased use of electric or hybrid vehicles, and motor oil recycling are not factored in; therefore, estimates are likely higher than actuals. If including estimates of land-based runoff, overall, the inputs of oil into the marine environment are estimated to have been five times as high from 2010–2019 as they were from 1990–1991. If excluding the category of consumption, which includes inputs in Oil in the Sea III that were not estimated in Oil in the Sea IV and therefore skew comparison, annual inputs are roughly 35% lower in the 2010s than they were in the 1990s.
3.2 NATURAL SEEPS
Natural seepage is a significant source of gaseous and liquid fossil fuel hydrocarbons introduced into the marine environment without human interference (Kvenvolden and Cooper, 2003). Oil and gas from deep subsea reservoirs move through faults and cracks in the seafloor or through sediments into the water column. In the water column, oil and gas compounds are subjected to dissolution and biodegradation according to their solubility, bioavailability and the environmental conditions (temperature, salinity, nutrient availability; refer to Chapter 5).
Natural oil seeps have been reported worldwide and their locations continue to be explored to determine locations that might be feasible for oil extraction. Regions with considerable inputs of oil from natural seepage, such as the Gulf of Mexico, have persistent surface slicks (Johansen et al., 2017), some of which are visible from space and are routinely detected through remote sensing methodologies such as satellite imagery (MacDonald et al., 1993; Garcia-Pineda et al., 2010). Other seeps may be more challenging to detect due to their low flux, the episodic nature of their releases, co-location with other oil sources, or the lack of a surface slick due to a wide range of reasons, including weather, sea state, flow rate, and subsea fate. Current estimates of the number of natural oil seeps are thought to be underestimated due to the remoteness and difficulty in accessing potential seep locations in the Southern Ocean, the Arctic Ocean, and the deep sea (Byrnes et al., 2017, for a detailed discussion of these limitations in the Gulf of Mexico).
Natural gas seeps are also ubiquitous along the North American continental margins (Ruppel and Kessler, 2017). Natural gas seeps release only gaseous hydrocarbons, whereas oil seeps may release a mixture of both gaseous and liquid hydrocarbons. Because of the large density difference between gas and water, natural gas bubbles are visible in images of acoustic backscatter from low-frequency (18 to 74 kHz), long-range (1,000 to 500 m) sonar (Weber et al., 2012). As a result, recent advances such as using water-column backscatter in acoustic multibeam data have significantly improved our ability to identify natural gas seeps and have led to many new discoveries (Römer et al., 2012; Skarke et al., 2014; Wang et al., 2016). These recent advances enabled gas seep flux to be included as a new hydrocarbon input in the Oil in the Sea IV analysis.
Total estimates of fossil fuel hydrocarbon inputs from oil and gas seeps in North American waters are discussed in the following subsections.
3.2.1 Oil
Estimates of the input of oil via natural seepage have varied considerably over time, primarily due to changes in the methods of estimation. Data from a limited number of seeps combined with a comprehensive survey of potential seep locations were first used to make the first estimates of oil inputs from natural seepage (NRC, 1975). This estimate was later revised to include consideration of the amount of crude oil known that could seep into the ocean over periods of time (NRC, 1985). Advances in remote sensing techniques, natural seep detection and assessment in regions including the Gulf of Mexico, offshore southern California, and offshore Alaska have enabled seepage rates to be calculated more accurately and recently be included as a component of the estimates of inputs of oil from natural seepage. The best estimate of the annual input of oil into North American waters from natural seeps in Oil in the Sea III was based on the available technology of the time and was determined to be 1.1 million barrels (160,000 tonnes)—the largest source of oil inputs to U.S. waters (NRC, 2003). The Oil in the Sea III global estimate of annual natural seeps was determined to be 4.2 million barrels (600,000 tonnes). Subsequently, an international assessment of oil inputs into the sea estimated the range of annual inputs of oil from natural seepage to be 0.14–14.0 million barrels (20,000–2,000,000 tonnes) annually (GESAMP, 2007).
Since these previous estimates were made, remote sensing and hindcasting methodologies, as well as our understanding of oceanographic constraints on natural seeps, have expanded. A recent estimate for the Gulf of Mexico was made between 1991 and 2019 (2021 report to the National Academies from MacDonald2), consisting of data collected from satellites using synthetic aperture radar that can detect oil slicks under all sunlight and cloud conditions (Brekke and Solberg, 2005; Leifer et al., 2012; Fingas and Brown, 2014; MacDonald et al., 2015). Synthetic aperture radar imaging was used to identify over 32,000 natural seep oil slick origins (as in Garcia-Pineda et al., 2010), which can be determined when the oil slick elongates and the flow
___________________
2 Copy of report can be provided upon request from the National Academies Public Access Records Office.
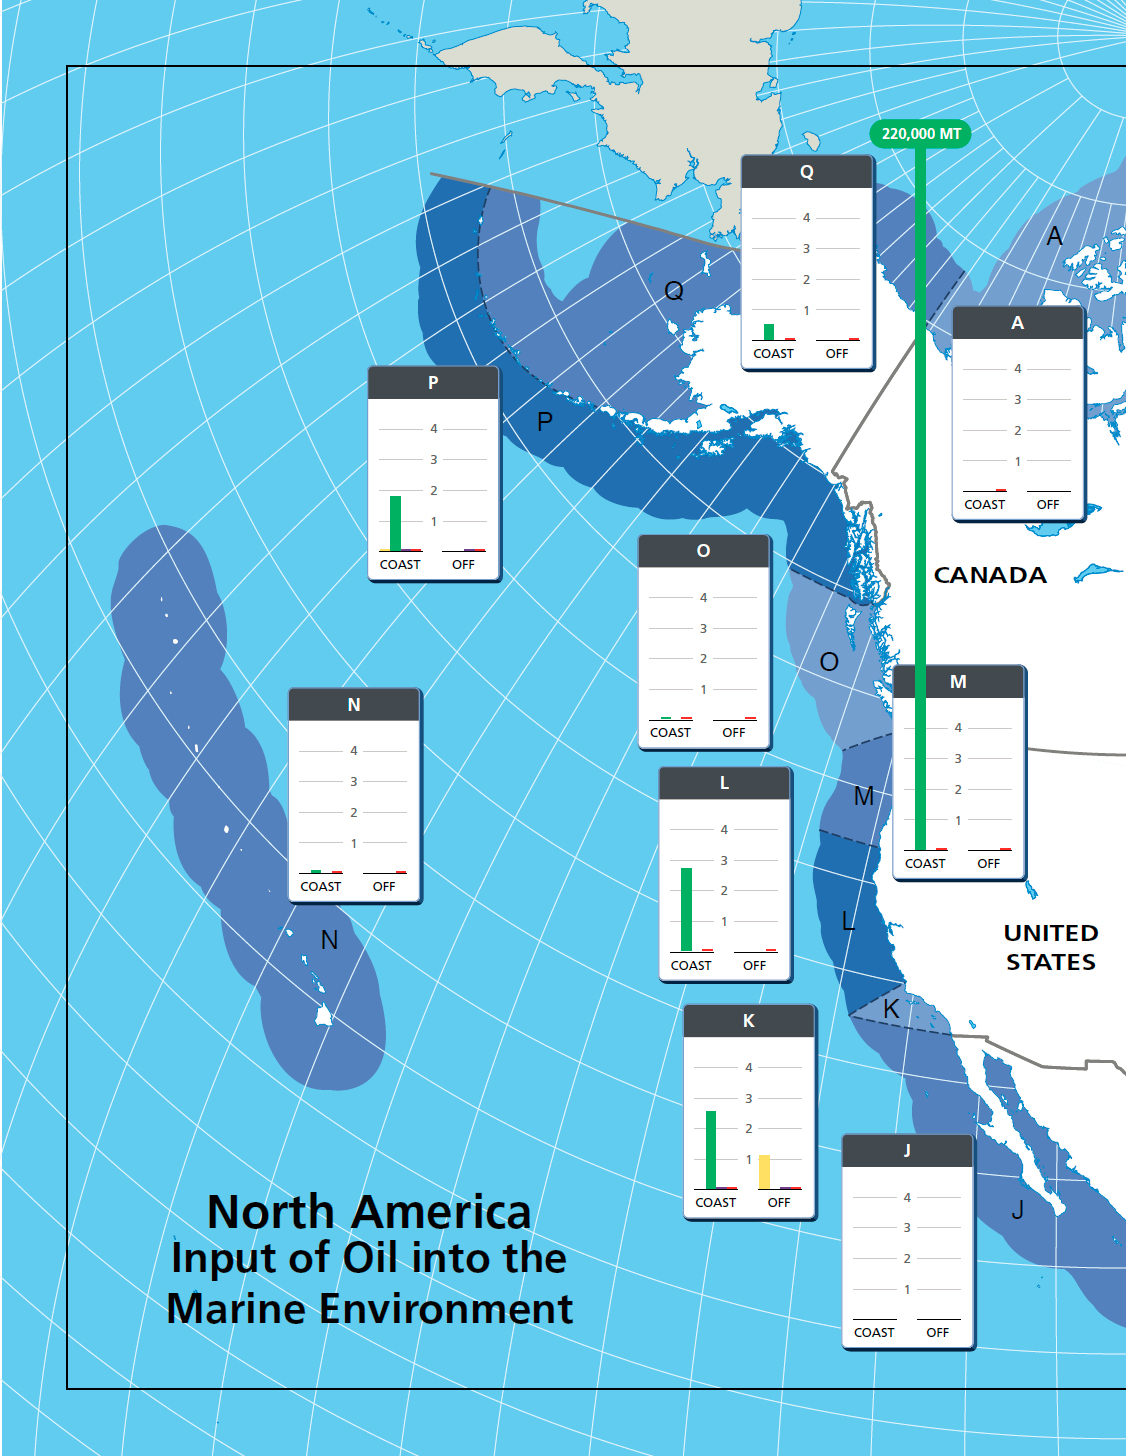
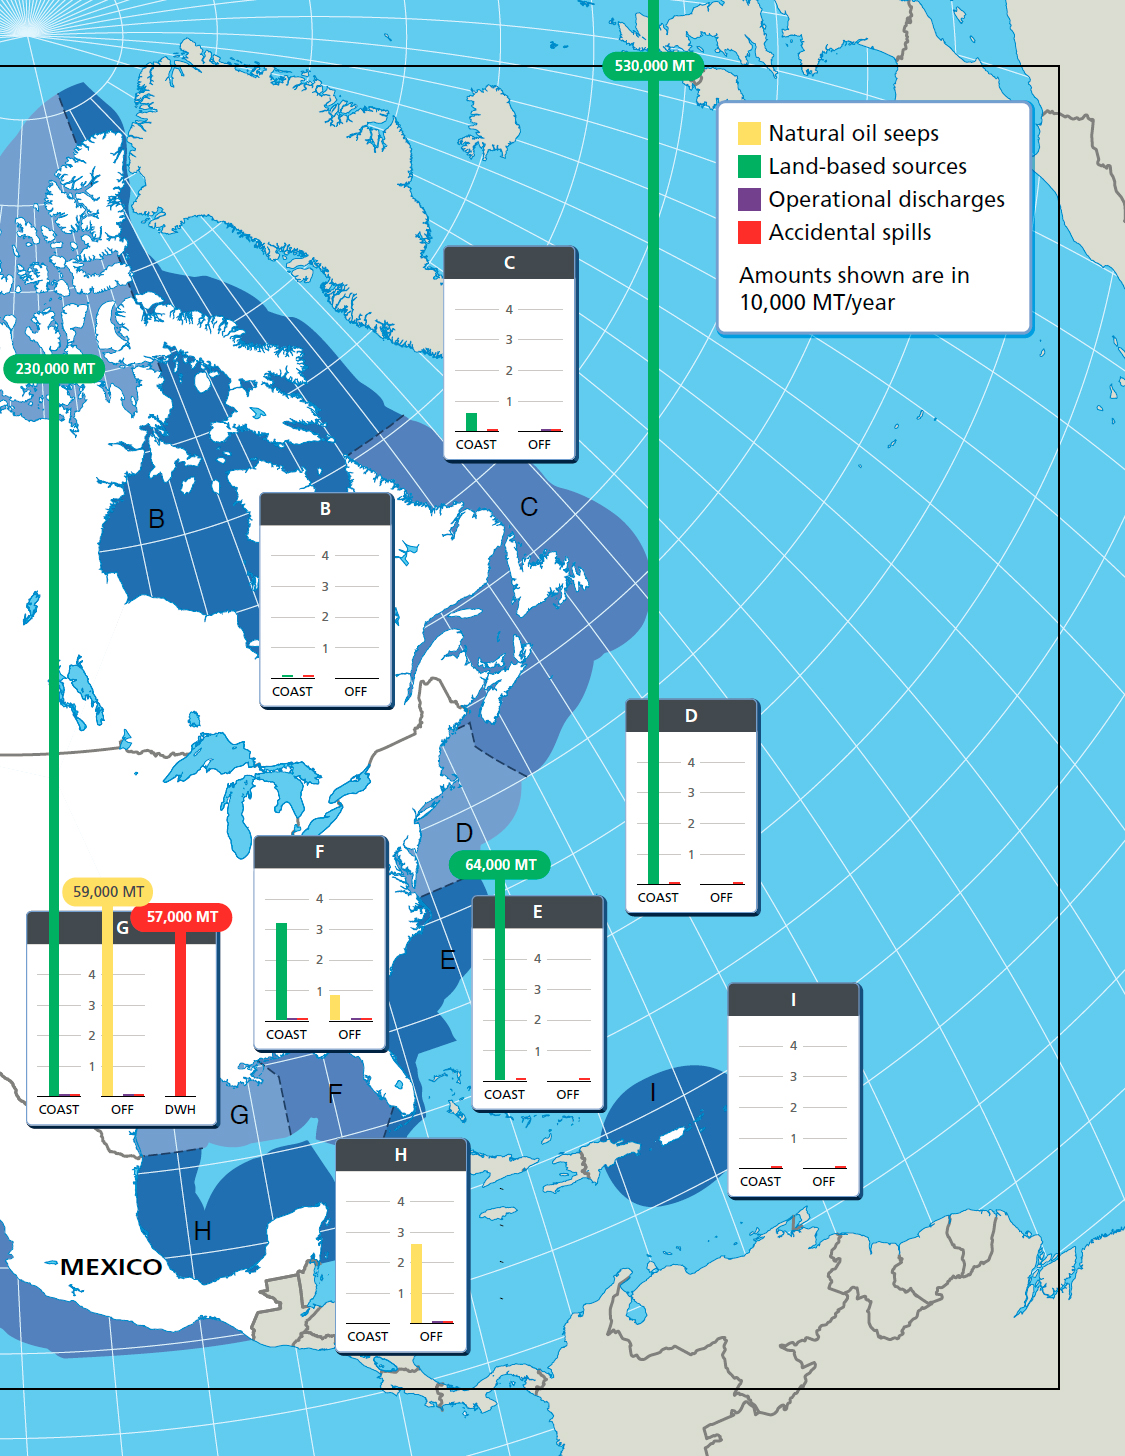
TABLE 3.1 Estimates of Oil Inputs as Reported in Oil in the Sea IV with Oil in the Sea III Estimates for Comparison
| Oil in the Sea IV (2010–2019) (MT/yr) | Oil in the Sea IIIa (1990–1999) (MT/yr) | |
|---|---|---|
| Natural Sources (total not including natural gas) | 100,000 | 160,000 |
| Oil Seeps | 100,000 | 160,000 |
| Gas Seeps | 2–9 Tgb | Not reported |
| Extraction of Petroleum | 2,980 | |
| excluding DWH | 9,500 | |
| including DWH | 66,500 | |
| Platforms | 1,100 | 160 |
| MC-20 | 1,600c | |
| DWH | 57,000 | |
| Atmospheric Deposition | Not reported | 120 |
| Produced Waters | 6,800 | 2,700 |
| Transportation of Petroleum | 818 | 9,209 |
| Pipeline Spills | 380 | 1,900 |
| Tank Vessel Spills | 200 | 5,300 |
| Commercial Vessel Spills | 8 | 99 |
| Coastal Terminal Spills | 220 | 1,900 |
| Coastal Refinery Spills | 10 | Included with terminal spills |
| Atmospheric Deposition | Not reported | 10 |
| Consumption of Petroleum | 1,200,399 | 83,520 |
| Land-based Runoff | 1,200,000 | 54,000 |
| Recreational Marine Vessels | Not reported | 5,600 |
| Spills (non-tank vessels) | 390 | 1,200 |
| Op. Discharges (Vessels >100 GT) | 9d | 100 |
| Op. Discharges (Vessels <100 GT) | 0d | 120 |
| Atmospheric Deposition | Not reported | 21,000 |
| Aircraft Jettison | Not reported | 1,500 |
| Totale | 1,400,000 | 260,000 |
| Totale | 110,000 | 170,000 |
| (Excluding Consumption and DWH) |
a Oil in the Sea III’s “Best Estimate” is shown in this column—the numbers vary from the totals shown by summing the regional inputs shown in the later tables within this chapter.
b Gas volumes reported in teragrams (Tg).
c Value shown reflects value of 1,600 MT/yr (30 bbls/day)—the amount oil collected from the site since April 2019. This value may be over- or underestimate of annual discharge for the full 2010–2019 timeframe. See Table 3.5 for range of published estimates.
d Assuming full compliance with discharge regulations.
e Reported values and Totals rounded to 2 significant figures.
is guided away from the origin by winds and surface currents (De Beukelaer et al., 2003; MacDonald et al., 2015). This comprehensive dataset was used in combination with hindcast methodologies to determine spatial and temporal trends in abundance and location of seep zones, and to estimate the fluxes of oil from seeps that had been detected in the Gulf of Mexico. Uncertainties in previous and present estimates of natural seep fluxes from satellite data are directly proportional to the assumed slick thickness, which cannot be directly inferred from the satellite data. Uncertainties in slick intermittency and residence times are improving with more satellite coverage and with ongoing efforts to identify slick signatures in the wealth of SAR satellite data (NOAA, 1996). The annual flux of oil from natural seepage in the Gulf of Mexico was estimated to be 0.2–0.7 million barrels (0.03–0.1 million tonnes), which agrees with previous annual flux estimates of MacDonald et al. (2015). These estimates are constrained by the accuracy of the estimated value of the average oil thickness and by the ability of satellite methods to identify all natural seeps, which may be influenced by anthropogenic sources from oil and gas exploration and production in the Gulf of Mexico. Table 3.2 summarizes oil seep input estimates developed for Oil in the Sea IV by geographic region for comparison. The total estimated annual inputs from natural seeps is roughly 35% lower than estimated in Oil in the Sea III.
TABLE 3.2 Annual Flux Estimates of Oil Seeps in North American Waters
| Oil in the Sea Geographic Zone | Seep Annual Flux Estimate (MT) |
|---|---|
| F: Eastern GoM | 8,000 |
| G: Western GoM | 60,000 |
| H: Mexican GoM | 30,000 |
| K: California Pacific | 10,000 |
| P: South Alaska | 1,000 |
| Total | 109,000 |
3.2.2 Methane
Methane is the dominant gaseous hydrocarbon that is emitted from seafloor hydrocarbon seeps. Methane may be released in dissolved form with emitted natural seep fluids and/or as gaseous bubbles. Depending on the depth, some of the released methane may contribute to seafloor hydrate formations, and released gas bubbles may form hydrate skins (Warzinski et al., 2014b). The majority of methane released as gas bubbles dissolves into the ocean water column (Ruppel and Kessler, 2017). Methane released from shallow seeps that reaches the sea surface either as gas bubbles or dissolved methane is emitted to the atmosphere.
Methane inputs to the ocean and atmosphere are quantified by two general approaches known as bottom-up or top-down methods (described in Kessler and Weber, 2021). Bottom-up approaches are useful for providing accurate flux estimates for a specific area at a specific time, whereas top-down approaches are preferable when estimating emissions of methane over larger areas and longer timescales. Top-down approaches consider the input as the amount of methane required to maintain the seawater inventory of methane while accounting for the loss of methane to the environment. Thus, for estimates of methane inputs made by this approach, information regarding methane concentration, aerobic methane oxidation, sea-to-air gas exchange, advection from the coastal environment, and other processes are required. This presents a variety of challenges to the top-down approach primarily due to the sparsity of data regarding the sinks of methane as well as the ability to determine seep versus non-seep sources of methane.
To estimate the emission of methane (all phases) from seafloor seeps into the coastal waters (not including emissions to the atmosphere) of North America, a top-down approach with novel methods was used to overcome the challenges of sparse datasets and source determination of methane (Kessler and Weber, 2021). Briefly, the fate of methane (sink) was estimated from datasets using artificial neural network models, and radiocarbon constraints were employed to estimate the seep contribution (source) of methane. Estimates were obtained for three case studies (Gulf of Mexico, North American Pacific margin, North American Arctic margin), which were then extrapolated to all North American regions. The case studies revealed that the Gulf of Mexico had significantly higher seepage rates than the North American Pacific and Arctic margins, which were relatively similar to one another. Given this, the North American Pacific and Arctic margin seepage rates were used to define a “low” methane source range and the Gulf of Mexico seepage rate defined a “high” source range. The regionally average seafloor methane seepage fluxes determined by this approach were 0.0042–0.087 moles of methane per meter squared per year, consistent with previous estimates (Kessler and Weber, 2021, and references therein). A range for the total methane source in North American coastal waters was determined to be 4–20 Tg/yr, with 2–9 Tg/yr coming from seafloor seepage. Estimates of methane inputs to the sea provided by Kessler and Weber (2021) were not previously described in Oil in the Sea III (NRC, 2003); thus, this represents a new input term.
3.3 LAND-BASED SOURCES
This section examines both runoff and atmospheric depositions as land-based sources of oil in the sea.
3.3.1 Runoff
Runoff describes excess water, typically from stormwater or melting snow, that flows across land into receiving water bodies such as lakes, rivers, and groundwater. Runoff can carry particles and dissolved chemicals that have been deposited on land surfaces together with airborne particulates and volatile organic compounds (VOCs) that are redeposited with the rainwater. Runoff contains suspended solids (Westerlund and Viklander, 2006), excess fertilizers, pesticides, oil, grease, salts, biochemical oxygen demand (BOD), and chemical oxygen demand (COD), as well as trace metals in both solid and liquid fractions (Huber et al., 2016; Pitt et al., 2018). Particles (or suspended solids) transported with stormwater also carry pollutants (e.g., fuel oil). Depending on the flow and particle characteristics, particles can remain in suspension or be deposited in the receiving water bodies.
Seasonal changes can influence the amounts of chemicals present in runoff including fertilizer chemicals (e.g., nitrates and phosphates) used in agriculture during growing seasons, as well as salt and deicing compounds (e.g., ethylene glycol) used on roads, parking lots, driveways, and vehicles during winter months and during snowmelt in early spring. Seasonal flooding can cause trash and debris to be washed from land. This trash and debris may contain petroleum-based contaminants either by sorption or as part of their composition (e.g., printing ink). During warmer months, roads and other impervious surfaces heated by sunlight may increase solubility and mobilization of some petroleum-derived compounds present in asphalt.
The primary sources of oil in runoff are derived from urban environments and automotive or transportation-related activities (Klimaszewska et al., 2007; Müller et al., 2020). Oils, grease, and other hydrocarbons are frequently found in
highway runoff, and a prior estimate indicated that approximately 50% of solids and 70% of the polycyclic aromatic hydrocarbons (PAHs) found in receiving waters can be attributed to highway runoff sources (Ellis, 1986). Transportation-related sources such as automotive fluid leakages (Markiewicz et al., 2017), tire wear (Muschak, 1990), vehicle washing (Sörme et al., 2001; Björklund, 2010), and road abrasion (Hvitved-Jacobson and Yousef, 1991) are common inputs of petroleum hydrocarbons to stormwater (Brinkmann, 1985; Müller et al., 2020). Vehicle exhaust emissions from internal combustion engines also contribute particulate matter (e.g., soot), PAHs (Markiewicz et al., 2017), and benzene, toluene, ethylbenzene and xylene (BTEX) compounds (Liu et al., 2018), although some of the chemical components of vehicle exhaust pollution are partly controlled by catalytic converters (Rauch et al., 2005). Strong correlation exists between increased urbanization and traffic density and the levels of PAHs and n-alkanes detected in urban runoff (Hewitt and Rashed, 1990; Bomboi and Hernandez, 1991; Moilleron et al., 2002). A review of stormwater runoff quality monitoring data from industrial facilities has shown that PAHs are the most common in roof runoff (due to asphalt coating), parking area runoff, and vehicle service area runoff (Pitt et al., 1995).
Quantifying the inputs of oil to the sea from land-based runoff continues to present a significant challenge due to the absence of the data spanning both geographic and temporal scales that is needed for this purpose. A review of oil and grease and petroleum hydrocarbon data available in the Water Quality Portal3 (WQP) sponsored by the U.S. Geological Survey (USGS), the U.S. Environmental Protection Agency (U.S. EPA), and the National Water Quality Monitoring Council (NWQMC) indicates that while a large amount of data have been collected, data from major inland river basins and coastal cities is limited, and there continues to be no data collected in the 2000s for the Alabama-Tombigbee, Altamaha, Brazos, Colorado (Texas), Copper (Alaska), Rio Grande, St. Lawrence, Santee, or Yukon river basins. The water data collected for the major inland rivers during the 2000s and reported in the WQP are still primarily oil and grease data, with some petroleum hydrocarbon data, and no PAH data (see Appendix C). It is evident that the recommendations presented in Oil in the Sea III to comprehensively quantify the concentration of petroleum hydrocarbons (oil) and PAHs from major river outflows, harbors, urban runoff, and municipal wastewater effluents and streams in urban coastal cities have not been acted upon.
Previous estimates of the inputs of petroleum hydrocarbons from land-based sources for the United States and Canada reported in Oil in the Sea III were based on 1990s oil and grease data for the Delaware and Mississippi Rivers. For estimates between 2010 and 2020, data from the Potomac River were used instead of the Mississippi River, which only has four total observations (see Appendix C). In the 2000s, the largest datasets are for the Columbia, Potomac, and Savannah River basins, but the data from these locations correspond to individual projects with associated research objectives that vary from one another and are not generalizable. The data from the Columbia river basin, for example, is from a storm sewer in the Portland Harbor Superfund Site4; the data from the Potomac River basin are from a stream being monitored to assess changes in water quality associated with the construction of a nearby planned unit development5; and the data from the Savannah River basin are being collected to compare structural devices for managing highway runoff (Conlon and Journey, 2008). Although these datasets are important in relation to specific projects, they cannot be used to either update or refine estimates using the same methodology as that previously presented, and due to the specificity of the projects to which they are related, were the types of studies that were excluded from Oil in the Sea III estimates.
Given the absence of oil, grease, and petroleum hydrocarbon concentration measurements in rivers, inputs of oil to the sea from land-based sources must be estimated using proxies such as changes in urban land area, population, and petroleum consumption via the numbers of vehicles per capita (as in Oil in the Sea III). This assumes that inputs from land are from predominantly urban areas and that vehicle operation and maintenance are the primary inputs of oil and grease to the land (as previously described). While this does not consider differences from changes in fuel efficiency, the use of all-electric vehicles, or distances traveled, it can provide some understanding of changes to land-based inputs and worldwide estimates of oil inputs to the sea.
Land-use patterns and river flows also affect land-based runoff inputs of petroleum hydrocarbons, both of which have seen changes over the past 20 years. An overall increase of 15% is calculated for major inland rivers in North America, but there are large differences between different rivers ranging from a 37% decrease in flow for 1980–1999 compared to 2000–2020 for the San Joaquin River to a 40% increase from 1980–1994 to 2000–2020 for the Mississippi River (see Appendix C). With respect to land use, both urban land area and populations for major inland rivers have increased with the exception of Trinity River, which has seen a 5% decrease in its urban land area (see Appendix C). Increases in urban land area between the 1990s and the 2010s range from 1% for the Susquehanna River to 560% for the Potomac River, echoed by changes in the range of population increases of 10% to 700% for the Susquehanna and Potomac Rivers respectively (see Appendix C).
In order to evaluate changes and to compare findings to Oil in the Sea III, the same approach was used to determine
___________________
3 See https://www.waterqualitydata.us.
4 See https://cumulis.epa.gov/supercpad/SiteProfiles/index.cfm?fuseaction=second.docdata&id=1002155.
5 See https://frederickcountymd.gov/DocumentCenter/View/327149/FINAL-Peter-Pan-Run-Report-2019.
the average annual loads of oil and grease, petroleum hydrocarbons, and PAH to the sea. A reasonable estimate of the low and high ranges of the calculated oil and grease and PAH values was also calculated (methodological details and tables are provided in Appendix C).
The annual loading of oil and grease to the sea for North America is estimated to have increased to 5.8 million tonne/yr, and globally to 20.1 million tonne/yr (see Appendix C). The best estimate of land-based petroleum hydrocarbon to the sea was 1.2 million tonne/yr for North America and 4.0 million tonne/yr globally. This global estimate is about 28 times as large as Oil in the Sea III (NRC, 2003; see Appendix C) and is primarily due to an increase in the number of vehicles being used in North America, Europe and Asia.
The estimates provided here are based on the methods used in Oil in the Sea III, and therefore have the same range of uncertainty of four orders of magnitude. This uncertainty is primarily due to (1) the lack of available data; (2) the differences in methods used for measuring and reporting the data; and (3) the fact that the proportion of petroleum hydrocarbons and PAH calculated from oil and grease measurements is only an estimate. The increases described previously with respect to the inputs of petroleum hydrocarbons are within this range of uncertainty and thus it is not possible to determine whether there are any quantitative changes to these inputs. Given that there have been increases in urban land area, population and vehicle ownership, it is plausible that land-based inputs of petroleum hydrocarbons (“oil”) have increased over this time, but it is unclear by how much. In addition, any estimate provided should be considered an upper limit as reductions due to personal choices and behaviors are not accounted for. Smaller inputs would arise from reductions in vehicle usage (e.g., due to car pooling, increased use of public transportation), improvements in fuel efficiency, and increased usage of electric vehicles, as well as improvements to care, maintenance, and the replacement of older vehicles.
3.3.2 Atmospheric Deposition
Land-based inputs of oil can be transported via the atmosphere and deposited in the ocean via wet deposition, dry particle deposition, and air–water gas exchange (dissolution, degassing) as summarized in Figure 3.4. The primary inputs of fossil fuel hydrocarbons are not in the form of liquid oil, but are combustion-derived products from combustion engines (vehicles), fossil fuel burning power plants, industrial
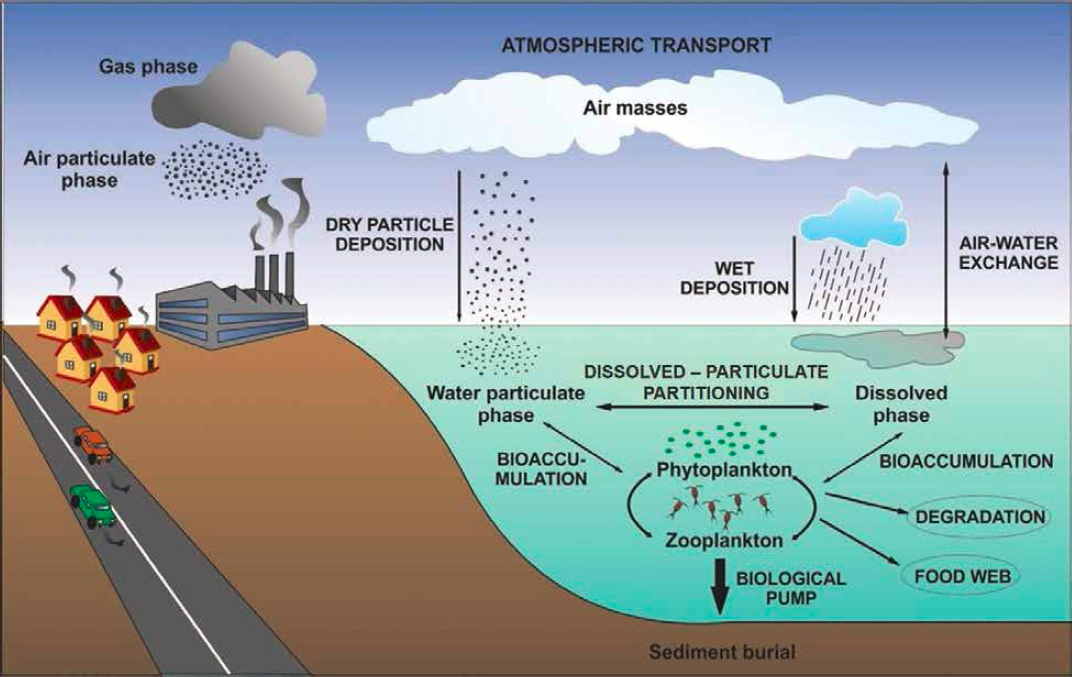
SOURCE: Jordi Dachs; presented to the National Academies committee on March 11, 2021.
manufacturing facilities, the domestic burning of coal, and other urban emissions. Once deposited from the land to the ocean, several processes influence their transport and fate (refer to Chapter 5), including interactions with the ocean carbon cycle and food webs (see Figure 3.4).
Atmospheric deposition of oil from land-based sources was estimated in Oil in the Sea III to be 4.2% of the total input of oil to the sea and was therefore considered to be a significant input of petroleum, especially PAHs, to the marine environment (NRC, 2003). When considering land-based atmospheric inputs, it is important to remember that these oil inputs are applied over large surface areas of the global ocean.
To estimate the atmospheric inputs of petroleum hydrocarbons (“oil”), n-alkanes with carbon lengths C10–C33, and PAH compounds are typically examined. These compounds make up a large fraction of petroleum, and information about their concentrations in marine atmospheres and surface waters, as well as their physical properties, is available. Prior estimates of total inputs of these compounds made in Oil in the Sea III acknowledge that focusing on these compounds alone underestimates the total mass of inputs, and this bias is considered to be less than two-fold. The aforementioned hydrocarbon compounds fall under the definition of oil if they are derived from sources such as petroleum, and coal. These hydrocarbon compounds could also originate from non-fossil inputs such as marine plankton, volcanic eruptions, plant waxes, wood burning, and wildfires and these other sources must be carefully considered in any quantitative estimates of input to the sea. It is possible to estimate the relative percentages of n-alkanes and PAHs that are derived from petrogenic, pyrogenic, and biogenic inputs. This is especially important in inputs from certain regions of the world where biomass burning can contribute up to two-thirds of combustion-derived carbon to the atmosphere (Xu et al., 2012). Stable carbon isotopic composition and natural radiocarbon abundance have been measured to apportion the source of PAHs in the following studies: Mandalakis et al., 2005; Gocht et al., 2007; Zencak et al., 2007; and Gustafsson et al., 2009. Other methods for source apportionment of PAHs include examining wind trajectories, individual PAH compounds as source markers (e.g., Ma et al., 2013), or organic and elemental carbon and sulfate and potassium ions (Crimmins et al., 2004).
There have been numerous sampling campaigns to measure petroleum hydrocarbons, specifically PAHs, in marine atmospheres and surface waters in recent years. This increase in data covers a broad geographic area and provides insights into the inputs and sources of PAH compounds to marine surface waters (see Appendix C). Prior to the early 2000s, data on quantities of atmospheric hydrocarbons in the marine atmosphere that are deposited and present in surface waters were sparse, and geographic locations used for prior estimates instead included data from an urbanized North American coast (California), a less-impacted urbanized coast (Denver as proxy), a rural coastline (east and west coasts), and an offshore rural coastline. Data represented conditions in the early to mid-1990s. The influx of new studies and the associated data present an opportunity to re-examine the atmospheric deposition of oil from land-based sources, as well as to improve understanding of the fates of these hydrocarbon compounds via net air-water flux calculations.
Net air-water fluxes of PAHs are calculated from concentrations of PAHs in marine atmospheres and surface waters to determine which regions of the ocean exhibit overall volatilization of PAHs (e.g., Nizzetto et al., 2008; Lohmann et al., 2011), compared to others where deposition and absorption of PAHs into surface waters are occurring (Jernelöv, 2010; Castro-Jiménez et al., 2012; Lohmann et al., 2013; González-Gaya et al., 2016). Volatilization versus deposition of individual PAH compounds varies according to their chemical and physical properties as well as seasonally (Cabrerizo et al., 2014; Casal et al., 2018). By calculating air-water fluxes for the sum of all PAH compounds, estimates of the overall global atmospheric input of PAHs to the oceans can be made. The global atmospheric input of PAHs calculated from measuring the sum of 64 individual PAHs input to the oceans is estimated to be 0.9 Tg C y−1 (González-Gaya et al., 2016). Assuming that a maximum of 65% of these PAH is from biomass burning, this estimate would be ~0.5 Tg C y−1 or ~550,000 tons C y−1, which is approximately 10 times over previous estimates (NRC, 2003). Global emission estimates of the 16 U.S. EPA priority PAHs for the year 2004 are 520,000 tonnes y−1 (Zhang and Tao, 2009), with the most significant contributions from biofuel (56.7%), wildfire (17.0%) and consumer product usage (6.9%). Power plants, open biomass burning, road transport (mostly diesel), industrial processes, and air and sea transport also contribute (Keyte et al., 2013, and references therein).
3.4 OPERATIONAL DISCHARGES
Operational discharges include oil discharges as a result of extraction of oil and gas, transportation of oil and gas, recreational vessels, and aircraft.
3.4.1 Extraction of Oil and Gas
3.4.1.1 Emissions
Emissions of fossil fuel hydrocarbons during the extraction of oil and gas were previously considered to be small in quantity and only significant in the context of the local air quality (NRC, 2003). There are no new studies or data to suggest that this has changed and that these operations should be considered as an input of oil to the oceans. We note that oil production is sometimes associated with a large amount of waste hydrocarbon gas, especially in regions that
lack a subsea pipeline system that could bring the gas to market. Current practice is either to pump the gas back into the oil reservoir, use the gas to produce power, or burn the gas in a flare.
3.4.1.2 Produced Water
Produced water can be brought to the surface along with hydrocarbons and may include formation water from the reservoir, condensation water, and/or water that was injected into the reservoir to enhance oil recovery. Offshore, produced water is typically reinjected back into a formation to improve production, injected into a disposal well, or treated to remove excessive oil and discharged into the sea. Produced water management techniques include produced water minimization, treatment, reuse, recycling, and disposal (Veil et al., 2004; Abdulredha et al., 2018; Liang et al., 2018; Veil, 2020). To minimize the collection of produced water, various mechanical and well construction techniques can be used to block the water from entering the well including the use of dual completion wells to separate production of oil and water, the injection of gel-like materials to stop water migration, and the use of downhole or subsea oil/water and gas/water separators.
Produced water must be treated to remove harmful components before being discharged into the environment. Several studies provide an overview of produced water treatment options (Fakhru’l-Razi et al., 2009; Igunnu and Chen, 2012; Zheng et al., 2016; Jimenez et al., 2018; GWPC, 2019; Liu et al., 2021). Produced water treatment strategies for offshore platforms may require different approaches compared to onshore facilities due to space and weight constraints, which necessitate the use of more compact physical and chemical systems. Offshore locations also have limited options for the beneficial use of treated produced water. Reservoir fluids first go through a bulk separation where oil, gas, and water streams are separated. Next, the water undergoes primary treatment to remove free oil and larger oil droplets via gravity separators, skimmers, hydrocyclones, corrugated plate separators, or centrifuges. Primary treatment typically achieves concentrations of less than 100 mg/l of dispersed oil and 50–100 mg/l of total suspended solids (TSS). Secondary treatment to remove dispersed/dissolved oil and suspended solids may consist of flotation cells, centrifuges, filters, adsorption units, ion exchange, or organic extraction. Secondary water treatment typically achieves dispersed oil concentrations of less than 50 mg/l and less than 25 mg/l of TSS. Secondary water treatment is usually sufficient to reduce oil content to the regulatory required offshore discharge levels. If necessary, tertiary or polishing techniques could be used. These may include filtration with different media, adsorption/absorption or coalescing units, liquid-liquid solvent extraction, ultrafiltration membranes, advanced oxidation, and others. Depending on the technique, the tertiary treatment could achieve 1–10 mg/l of dispersed oil and 1–10 mg/l of TSS. After a desired level of treatment is achieved, produced water is discharged into the marine environment.
Regulatory Regimes
Several approaches are implemented globally to regulate produced water discharges into the marine environment. Most commonly used is the application of discharge standards for oil-in-water concentrations, total petroleum hydrocarbons, oil and grease, or dispersed oil. The United States and Canada use a risk-based approach based on Whole Effluent Toxicity (WET) testing. This establishes a field-specific dilution factor which should be achieved after discharge in order to minimize the risk of potential negative effects. In Europe, in the North-East Atlantic, a combination of oil-in-water standards and risk-based approaches is used. However, within the European risk-based approach there is a greater emphasis on chemical characterization of individual produced water constituents.
Operational discharges from exploration and production operations in Canada are regulated by the Offshore Waste Treatment Guidelines (National Energy Board, 2010). For produced water, a 30-day volume weighted average oil-in-water (or “oil and grease”) concentration, the maximum allowable concentration is 30 mg/L. The maximum 24-hour average oil-in-water concentration, as calculated at least twice per day, is 44 mg/L. The deck drainage, ballast, bilge, and storage displacement water should not have a residual oil concentration that exceeds 15 mg/L.
In the United States, produced water discharges offshore are regulated by the Clean Water Act established by Congress in 1972 and managed through effluent limitations guidelines published in the Code of Federal Regulations (C.F.R.) at 40 C.F.R. Part 435. For the offshore installations, “oil and grease” effluent reduction attainable by the application of the best available technology economically achievable (BAT) is “the maximum for any one day shall not exceed 42 mg/l; the average of daily values for 30 consecutive days shall not exceed 29 mg/l.” Effluent reduction attainable by the best practicable control technology currently available (BPT) and the best conventional pollutant control technology (BCT) is “72 mg/l maximum for any 1 day and 48 mg/l for 30 consecutive days.” In coastal areas, produced water is not allowed for discharge except for Cook Inlet, Alaska, which has the same limits as offshore wells.
Factors Affecting Produced Water Inputs into Marine Environments
Produced water typically represents the largest byproduct by volume in oil and gas extraction operations, and its quantities tend to increase over time as the reservoir depletes (Reynolds and Kiker, 2003; Veil, 2020). While there is a notion that global rates for produced water discharges generally increase (Dal Ferro and Smith, 2007), local trends
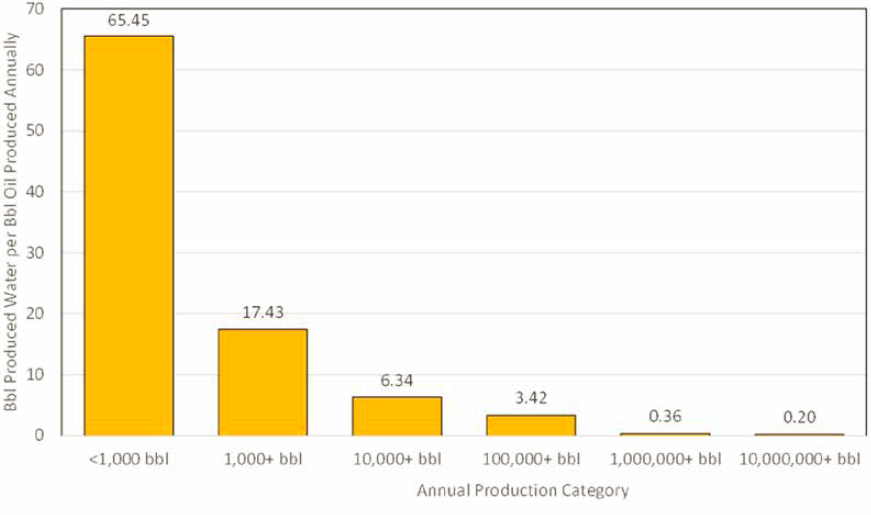
NOTE: The water-to-oil ratio (WOR) is highlighted at the top of the bar for each category.
in recent years in the United States and Canada indicate reduction of produced water volumes even with increased oil production,6 which is most likely due to better produced water management practices and addition of new prolific oil fields that produce significantly less volumes of water. If global oil production rates continue to decline, so will the volumes of discharged produced water.
The total volume of oil entering the marine environment depends on:
- Total volume of oil and gas production in the area and either measured or estimated volume of total produced water volumes generated along with oil and gas.
- Final concentration of dissolved and dispersed oil in produced water after all the treatment techniques.
Produced Water as a Function of Total Oil Production The ratio of produced water to produced oil equivalents (water-to-oil ratio; WOR) and ratio of produced water to produced gas equivalents (water-to-gas ratio; WGR) depends on many factors and varies significantly. Some of the factors affecting produced water volumes are overall oil production volumes, type, age, properties and integrity of the reservoir, type of well (horizontal versus vertical), location of a well within the reservoir structure, type of well completion, type of produced water management techniques implemented, whether water injection is used to enhance oil recovery, etc. (Reynolds and Kiker, 2003; Veil et al., 2004; Clark and Veil, 2009; Veil, 2015, 2020).
Figure 3.5 illustrates the dependency of produced water volume on volume of produced oil.
Appendix D illustrates the variability among regional values for WORs in study regions calculated as the average, the mean of all the data as well as the mean with the outliers removed. This is due to great variability in the WORs among individual wells. Despite this variability, the “average worldwide” WOR was historically estimated to be around 2 to 3 (Khatib and Verbeek, 2003; Veil et al., 2004; Clark and Veil, 2009; Neff et al., 2011; Liang et al., 2018). Individual reported values range from zero for new reservoirs to more than 100 for depleted fields (Veil et al., 2004; Neff et al., 2011; Veil, 2015; BOEM/BSEE database). Veil conducted a systematic analysis of produced water generated in the United States, both onshore and offshore, and published comprehensive reports in 2009, 2015, and 2020. He also highlighted the challenges related to collection and interpretation of these data. Using 2017 data for the United States, Veil (2020) reported WORs ranging from 6.5 bbl/Mmcf to 5,490 bbl/Mmcf, with the weighted average being 76.4 bbl/Mmcf. He reported that the WOR ranges between 0.25 and 57.7 with weighted average 4.8, although he highlighted that due to dataset limitations, this weighted average may not be representative. He offered an alternative expression for WOR, which incorporates natural gas volumes converted to barrels of oil equivalents (BOEs) and combined with oil volumes. In this case this parameter was equal to 2.76 for the 2017 data. This is lower than a value of 3.4 calculated using 2007 data, indicating a reduction of generated produced water volumes (Veil, 2020).
___________________
6 BSEE: www.data.bsee.gov; Canada-Newfound and Labrador Offshore Petroleum Board: https://www.cnlopb.ca; Canada-Nova Scotia Offshore Petroleum Board: https://www.cnsopb.ns.ca.
Table 3.3 summarizes the annual oil and gas production as well as produced water volumes generated in 2020 in the United States, Mexico, and Canada. 61,037,08 bbl of produced waters have been generated by the offshore facilities in Eastern Canada, 535,637,088 bbl in offshore and nearshore U.S. waters, and estimated 1,551,250,000 bbl in Mexican waters of the Gulf of Mexico. Because no data were available for the exact volume of produced water generated in Mexican waters, available data for oil production were used, with 2.5 WOR recommended by Veil (2011).
International Association of Oil & Gas Producers (IOGP) member companies in North America reported that less than 7% of produced water from offshore assets was reinjected back into the reservoir rather than released into water (IOGP, 2020b). This is comparable to the numbers reported by Clark and Veil (2009) and IOGP (2009). Veil (2020) suggested that it may be due to a risk of produced water injection resulting in hydrogen sulfide creation in the formation. Hence, when water injection is required to support production of offshore fields, the use of seawater treated to remove elements that may cause corrosion may be preferable.
General trends indicate a reduction of produced water generated per unit of oil for offshore United States and Canada in recent years, even at a time of increasing
TABLE 3.3 Estimates of Produced Water for Oil and Gas Operationsa
| Oil in the Sea Geographic Zone | Annual Productionb | Annual Oil Input in Metric Tonnes (MT/yr) | ||||
|---|---|---|---|---|---|---|
| Oil (bbl) | Gas (mcf) | Produced Water (bbl) | Assuming 20 mg/L (best estimate) | Assuming 15 mg/L (minimum estimate) | Assuming 29 mg/L (maximum estimate) | |
| C: E Canada | 104,005,970 | 1,615,773 | 61,037,083 | 194 | 146 | 281 |
| Offshore | ||||||
| F: E GOM | 25,884 | 48,541,716 | 1,280,832 | 4 | 3 | 6 |
| Nearshorec | ||||||
| F: E GOM Offshore | 34,991,045 | 78,403,905 | 11,811,098 | 38 | 28 | 54 |
| G: W GOM | 3,847,596 | 11,299,809 | 9,618,990e | 31 | 23 | 44 |
| Nearshored | ||||||
| G: W GOM Offshore | 626,892,869 | 831,100,299 | 398,644,277 | 1,267 | 951 | 1,838 |
| H: Mexican GOMf | 620,500,000 | 73,000,000 | No datag | 4,932 | 3,699 | 7,151 |
| Offshore | ||||||
| K: CA Pacific | 1,496,500 | 393,470,000 | 16,242,500 | 52 | 39 | 75 |
| Nearshoreh | ||||||
| K: CA Pacific | 4,383,418 | 2,702,654 | 42,233,459 | 134 | 101 | 195 |
| Offshorei | ||||||
| P: South Alaskaj | 3,253,102 | 23,610,069 | 35,371,703 | 112 | 84 | 163 |
| Nearshore | ||||||
| P: South Alaska | 0 | 5,915,233 | 42,926 | 0 | 0 | 0 |
| Offshore | ||||||
| Q: North Alaska | 11,580,775 | 256,693,367 | 20,391,303 | 65 | 49 | 94 |
| Nearshore | ||||||
| Totalk | 1,410,977,159 | 1,726,352,825 | 587,055,181 | 1,866 | 1,400 | 2,706 |
| Totall | 1,410,977,159 | 1,726,352,825 | 2,147,924,171 | 6,829 | 5,122 | 9,902 |
a Based on data available for 2020. Note that only nearshore (but not inland) and offshore oil and gas operations were included. Inland operations are outside of the scope of the Oil in the Sea IV study.
b U.S. estimates calculated based on publicly available data from BSEE (available at www.data.bsee.gov). Eastern Canada estimates for produced water for gas production based on value for exclusive gas production in Nova Scotia coupled with produced water data from the same area. (Data from Canada-Newfoundland and Labrador Offshore Petroleum Board and Canada-Nova Scotia Offshore Petroleum Board.) Estimates for Alaska based on State of Alaska data on well gas and oil production and associated produced water. Calculations conducted for gas production wells and oil production wells. Oil production wells generally also produce some gas.
c Alabama nearshore: https://www.gsa.state.al.us/ogb/production.
d Louisiana data from Louisiana Department of Natural Resources Office of Conservation (data for 2020). Texas data from Texas Railroad Commission (data for 2020) (http://webapps.rrc.texas.gov/PDQ/generalReportAction.do).
e Estimated based on 2.5 bbl water per bbl oil per Veil (2011).
f Mexican production data from U.S. Energy Information Administration (https://www.eia.gov/international/analysis/country/MEX).
g Estimated based on 2.5 bbl water per bbl oil per Veil (2011).
h California nearshore (state waters) data for Platforms Eva, Emmy, and Esther from California State Lands Commission. The water:oil ratios are relatively high because the production rates are now relatively low, totaling less than 1.5 million bbl per year for all three platforms.
i Data from BSEE Pacific. The water:oil ratios are relatively high because the production rates are now relatively low, totaling less than 4.4 million bbl per year for 11 leases.
j Data for Cook Inlet offshore production from State of Alaska (http://aogweb.state.ak.us/DataMiner3/Forms/Production.aspx).
k Totals for produced water without Mexico and Western GOM Nearshore because no data are available.
l Totals for produced water including estimates for produced water for Mexico and Western GOM Nearshore based on an estimate of 2.5 bbl water per bbl oil per Veil (2011).
oil production. Condensate-producing wells and wells with low-volume oil production (less than 1,000 bbl per year) tend to generate larger volumes of produced water than wells with higher oil production. Wells in deep waters tend to generate less produced water than wells in shallow waters. This is not related to the reservoir conditions per se, but instead is most likely driven by the production economics, which makes deep-water operations profitable if they are focused on producing oil from prolific non-depleted reservoirs not requiring water injection to facilitate oil recovery and do not generate significant produced water volumes.
Concentration of Oil in Produced Water Produced water physical and chemical properties vary significantly depending on the age, depth, and type of the reservoir, as well as chemicals added during production. Typically, produced water contains salts, dissolved and dispersed oil and other organic substances, residues from production chemicals (biocides, corrosion inhibitors, H2S scavengers, clarifiers, emulsion breakers, hydrate inhibitors, etc.), and low levels of naturally occurring radioactive materials and heavy metals. (Neff, 2002; Lee et al., 2005; Veil et al., 2005; Burridge et al., 2011; Neff et al., 2011). Dissolved components in produced water typically include BTEX, phenols, aliphatic hydrocarbons, carboxylic acid, and low molecular weight aromatic compounds. Dispersed components typically include PAHs and alkyl phenols (Henderson et al., 1999; Røe Utvik, 1999; Veil et al., 2004; Neff, 2011; Liang et al., 2018). Reported concentrations of total saturated hydrocarbons in produced water range from 17 to 30 mg/L, total BTEX from 0.068 to 578 mg/L, and total PAH from 0.04 to 3 mg/L and consist primarily of the 2- and 3-ring PAHs, such as naphthalene, phenanthrene, and their alkylated homologs (Neff, 2002; Faksness et al., 2004; Johnsen et al., 2004; Neff et al., 2011). Factors that affect the concentration of oil in produced water include physical and chemical properties of extracted oil and type and efficiency of chemical treatment, as well as type and efficiency of the physical separation equipment (Veil, 2011).
Based on reports by IOGP member companies for North America, the quantity of oil discharged per unit of oil production offshore ranged from 13.7 mg/L in 2017 to 17.6 mg/L in 2019 (IOGP, 2020).
In Canada, monthly concentrations of oil in produced water in recent years have ranged between 18 mg/L and 30 mg/L (Stantec, 2018; Amec Foster Wheeler, 2019; Husky Energy, 2019).
In Oil in the Sea III, 29 mg/L was used as the default value (maximum), 20 mg/L was used as the best estimate and 15 mg/L was used as the minimum estimate. For consistency and comparability, the same values were used in this study for calculations of oil volumes discharged through produced water into marine environments. Table 3.3 summarizes the annual estimated input of oil into the marine environment in different study regions.
3.4.2 Transportation
3.4.2.1 Marine Transportation
Regulatory Framework Specific to Marine Transportation
The International Convention for the Prevention of Pollution from Ships, MARPOL 73/78, regulates ship-generated pollution through the six Annexes of the Convention. Parties to the Convention consist of 160 of the current 174 International Maritime Organization (IMO) Member States, including the United States, Canada, and Mexico, covering 98.8% of the world tonnage. Enforcement of the Convention is the responsibility of the governments of Member Parties.
Routine machinery operations on ships generate oily residues, which are discharged either to shore-based facilities or to the sea. MARPOL prohibits any discharge of oily mixtures from ships into the sea except when all of the following conditions are satisfied (MARPOL Annex I Reg. 15):
- The ship is proceeding en route (the vessel is under way between ports);
- The oily mixture is processed through approved oil filtering equipment;
- The oil content of the effluent without dilution does not exceed 15 parts per million (ppm, mg/L);
- The oily mixture does not originate from cargo pump-room bilges on oil tankers; and
- The oily mixture, in the case of oil tankers, is not mixed with oil cargo residues.
The United States has implemented MARPOL 73/78 by the Act to Prevent Pollution from Ships and by U.S. Coast Guard (USCG) regulations found in 33 C.F.R. 151.09. The Vessel General Permit for Discharges Incidental to the Normal Operation of Vessels (VGP) is a permit issued by the U.S. EPA first in 2008 and reissued in 2013 under the Clean Water Act National Pollutant Discharge Elimination System (NPDES) that provides authority for discharges incidental to the normal operation of non-military and non-recreational vessels. All discharges of oil, including oily mixtures, from ships subject to Annex I of the MARPOL 73/78 must have concentrations of oil less than 15 mg/L before discharge. The discharge of motor gasoline and compensating effluent must not have oil in quantities that may be harmful as defined in 40 C.F.R. 110.3, which includes discharges resulting in a visible sheen, or an oil concentration that exceeds 15 mg/L.
Tankers carrying oil can have additional oily residues from pump-room bilges and from cargo tank cleaning operations. Discharges of oily waters from the cargo area of an oil tanker are allowed provided that the tanker has a slop tank and an oil discharge monitoring and control system (MARPOL Annex I Reg. 14). Additionally, the discharges are allowed only if the tanker is under way between ports outside of 50 nautical miles from the nearest land, and the instantaneous rate of discharge of oil content does not exceed
30 liters per nautical mile (MARPOL Annex I Reg. 34). However, these discharges are not allowed in Special Areas as defined in the Annex.
There are no legal discharges of oily waters from the cargo area of tankers within the North American territorial waters or in the zone contiguous to the territorial waters. Any accidental or intentional discharges would be classified as spills.
Oil residues and oily mixtures that cannot be discharged in compliance with the regulations shall be retained on board for subsequent discharge to reception facilities. Ports and terminals in which ships have oily residues to discharge are required to have reception facilities with adequate capacity to receive and process the oily waste generated by the vessels calling in the facility. In January 2021, the IMO GISIS Port Reception Facility database7 listed 2,179 reception facilities in the United States, 2,273 in Canada, and 591 in Mexico. The enforcement of the requirements in the United States and Canadian waters is rigorous but a few cases of illegal discharges still occur annually; when identified, the USCG refers them to the Department of Justice.
As a result of the regulatory changes, as discussed later, the amount of oily water discharges resulting from tank vessel cargo operations has been reduced significantly worldwide. In 2014, Peters and Siuda (2014) reported on the decreased incidence of tar balls in the Sargasso Sea in the North Atlantic Ocean since the 1960s and 1970s, which they recognized as a long-term result of the implementation of international conventions that reduced inputs from oil tanker cargo tank cleaning and discharges of tank washings along with the continuation of floating tar removal process (Peters and Siuda, 2014).
The reduction of operational discharges is closely connected with the evolution of the regulatory requirements for the operation, design, and construction of tankers, which has gradually reduced or eliminated mixing of water with cargo.
The first significant operational change was crude oil washing of cargo tanks. Crude oil washing (COW) is a system whereby the oil tanks on a tanker are cleaned out between voyages not with water but with crude oil (the cargo). It is discharged with the rest of the cargo (any remaining sludge must be disposed of to a shore facility). Crude oil washing was made mandatory for new crude oil tankers in 1978 and for all crude oil tankers delivered after 1 June 1982.
In October 1983, MARPOL added a requirement for new oil tankers to be fitted with segregated ballast tanks to eliminate the need to carry ballast water in cargo tanks. This was followed by the requirements for double-hull tankers, the second significant operational change resulting in decreased operational discharge. The final year to operate single-hull tankers was 2010, with some exceptions that allowed operation until 2015.
In 2020, the U.S. EPA, under the authority of the Vessel Incidental Discharge Act (VIDA), proposed to establish national standards for discharges incidental to the normal operation of primarily non-military and non-recreational vessels 79 feet in length and above into the waters of the United States or the waters of the contiguous zone. The proposed rule covering oil management reflects the acceptability of the currently permitted discharges (40 C.F.R. 139).
Tank Vessels This section covers operational discharges associated with tank vessel cargo operations. Operational discharges from machinery operations on tankers and other commercial vessels are basically the same, and they are discussed under the following section on commercial vessels.
In the Oil in the Sea III report, estimates of operational discharges included assumptions on the level of MARPOL compliance. Because there is no quantitative data available on the current non-compliance levels, the estimates in this report are based on full compliance acknowledging that even with rigorous enforcement illegal discharges still occur. The objective is to demonstrate the order of magnitude of discharges if full compliance is achieved. Illegal discharges are counted as spills, if they are reported.
In 2003 there were still pre-MARPOL tankers without segregated ballast tanks in operation. These vessels have now been phased out and all ballast water is segregated from the cargo, consequently the estimated oily discharges from the cargo area of tankers worldwide in 2020 is less than in 2003.
If the non-compliant discharges are excluded, the worldwide 2003 cargo oil discharge from tankers was estimated at 7,400 tonnes per year; the estimate for 2020 is 1,730 tonnes per year, more than a 75% decrease. The estimate is based on the discharge estimates for double hull and segregated ballast tank tankers in the 2003 study extrapolated to account for the fleet size of 16,978 tankers greater than 100 gross tons (GT) in 2020 (UNCTAD, 2020). These estimates are assumed to be higher than actuals because they are based on the full slop discharge into the sea at the maximum allowed concentrations whereas product tankers often discharge slops into shore-based facilities.
The regulations do not allow any discharges of oily waters from the cargo area of tankers within the North American territorial waters or in the zone contiguous to the territorial waters.
Sludge is discharged to shore-based facilities or incinerated. No sludge is allowed to be discharged into the sea.
VOCs, discussed in Chapter 2, are released from tankers during loading operations and during the voyage. At loading, the pressure in the cargo tank increases with the rising cargo level and VOCs are vented into the atmosphere unless the terminal and the vessel have a vapor control system in place. During the voyage evaporation from the cargo surface increases the pressure and VOCs may be released to the atmosphere. VOC releases from tankers are characterized as methane and non-methane (NMVOC). Methane and other
___________________
7 See https://www.imo.org/en/OurWork/Environment/Pages/Portreception-facilities-database.aspx.
lighter components contribute to the greenhouse effect, whereas the heavier components are pollutants (Oil Companies International Maritime Forum [OCIMF]).
Factors impacting VOC emissions from crude oil include (MEPC.1/Circ.680):
- Vapor pressure of the crude oil
- Temperature of the liquid and gas phases of the crude oil tank
- Pressure setting or control of the vapor phase within the cargo tank
- Size or volume of the vapor phase within the cargo tank
Since 2010, MARPOL (MARPOL Annex VI Reg. 15.6) has required crude oil tankers to implement a VOC management plan to prevent or minimize the release of VOC emissions by operational procedures and technical measures. Operational measures include using optimum loading procedures and target operating pressures for cargo tanks. Technical measures include vapor emission control systems (VECS), which are not mandatory. Ports and terminals can implement requirements for VECS. Various VOC emission control methods and control systems have recovery rates from 30% to 99% (OCIMF).
The NRC Oil in the Sea III estimated the atmospheric deposition of VOC from tankers in North American waters at 5 tonnes per year based on conservative assumptions on the VOC emissions and the report concluded that the input is significant only in terms of its impact on local air quality. No studies are available on the impact of the IMO regulations on the VOC emissions, but a reduction since 2010 can be assumed. Therefore, although VOC emissions from ships remain a concern, the input into the sea is not considered significant.
Commercial Vessels This section covers operational discharges from machinery operations on commercial vessels including tankers.
As with the discharges from cargo tank operations this report assumes full compliance while acknowledging that even with rigorous enforcement, illegal discharges still occur. Illegal discharges are counted as spills, if they are reported.
If the non-compliant discharges are excluded, the 2003 worldwide estimate for machinery bilge oil discharges is 240 tonnes per year corresponding to a total of 86,817 vessels greater than 100 gross tonnes (GT). The estimate for the North American waters is 8 tonnes per year for vessels greater than 100 GT.
By extrapolation, the machinery bilge oil discharges in 2020 are estimated at 270 tonnes per year corresponding to the total of 98,140 vessels greater than 100 GT (UNCTAD, 2020). At the same rate of increase, the estimate for machinery bilge oil discharges in the North American waters is 9 tonnes per year, slightly higher than in 2003. These are approximate estimates, accurate within an order of magnitude of the operational discharges, assuming full compliance.
Another operational oil leakage can occur from oil-lubricated stern tubes and other lubricated equipment with oil-to-sea interfaces, such as controllable pitch propellers, rudder bearings, and on-deck equipment water interfaces. A study by D. S. Etkin (2010) estimated that daily stern tube lubricant consumption rates can range up to 20 liters per day, and the operational lubricating oil discharges from vessels are estimated between 37 million liters and 61 million liters of lubricating oil into the marine port waters annually. Today these discharges are treated as oil pollution and all vessels operating in the United States, covered under the VGP, must use environmentally acceptable lubricants (EALs)8 in all oil-to-sea interfaces unless technically infeasible.9
3.4.2.2 Recreational Vessels
The Oil in the Sea III report (NRC, 2003) emphasized how oil inputs from recreational engines had been unintentionally overlooked in previous editions of this publication and recommended that emissions from the then ubiquitous conventional two-stroke outboard engines operating in coastal waters were considerable and deserved to be accounted for in the calculations for total inputs of oil into the sea. The 2003 report concluded that the numbers of recreational two-stroke outboards (the predominant propulsion system on small gasoline-powered boats operating within the marine environment) had increased significantly within the previous decades and that the amount of fuel, lubricating oil, and additives was contributing an estimated 5,600 tonnes per year, approximately 6% of the total load of petroleum into North American waters. These figures suggest that inputs from recreational marine engines were the second highest contribution to oil in the sea within the “Consumption of Petroleum” category, behind land-based and river runoff, and the fourth highest contributor of total oil contribution when all categories were compared.
The original two-stroke engine designs allowed for a light and powerful engine but one that emits more pollutants into the environment than engine designs utilizing other available technologies. The U.S. EPA issued regulations that prescribed a 75% reduction of emissions from small marine engines sold by 2005. This was to be done through new design features such as direct injection and four-stroke technologies. Direct injection engines reduce emissions by approximately
___________________
8 EALs are biodegradable and minimally toxic and are not bioaccumulative.
9 For purposes of the EAL permit condition, technically infeasible means that no EAL products are approved for use in a given application that meets manufacturer specifications for that equipment, products that come prelubricated (e.g., wire ropes) have no available alternatives manufactured with EALs, EAL products meeting a manufacturer’s specifications are not available within any port in which the vessel regularly calls, or change over and use of an EAL must wait until the vessel’s next drydocking (epa.gov).
80% and some four-stroke engine designs currently exceed 90% emissions reduction over the U.S. EPA 1998 standard.10
The recreational boating market continues to increase in developing and first-world countries. In Australia, between 1999 and 2009, boat ownership grew by 36.4% (Burgin and Hardiman, 2011). Similar trends have been noted in the United States.11 According to a Global Markets insights report, the recreational outboard market was estimated to be at $9.1 billion (U.S.) in 2020 and was expected to grow at a rate of 5% from 2021 to 2027. Although two-stroke outboard motors are no longer sold in the United States, they continue to hold a world share of the market. These sales are estimated to still be valued at around $3 billion (U.S.) in 2027. This share of the market is maintained predominantly by advantages of the engines’ lighter weight, higher torque, and lower maintenance cost relative to four-stroke motors, and by their excellent power-to-weight ratio.12
As predicted, the pervasiveness of the newer, cleaner four-stroke and direct injection engines has produced much cleaner recreational engines that emit far less oil directly into the marine ecosystem; however, in the United States, many of the existing older technology engines still exist and continue to contribute oil to those waters. Also, as previously mentioned many other countries, particularly the developing nations, continue to utilize the older technology systems due to lower costs, weight and operational constraints. Some national parks in the United States such as Lake Mead and parts of the Colorado River have banned the use of engines that do not meet the U.S. EPA 2006 standards (36 C.F.R. § 7.48[f][3]).
3.4.2.3 Aircraft Fuel Jettison
Aircraft deliberately dump, or “jettison,” fuel to reduce the aircraft’s weight in emergency situations to allow the aircraft to land safely without sustaining structural damage. Such emergency situations include a return to the airport shortly after takeoff, compromised aircraft performance, and an emergency landing at an unintended destination.
In the United States and Canada, regulations on fuel jettison are aligned with the standards and recommended practices of the International Civil Aviation Organization (ICAO)—a United Nations agency aiming to foster international consensus on aviation activities. ICAO recommendations include advising air traffic control regarding the onset of dumping, and requiring control to coordinate the route, altitude, and duration of dumping with the flight crew to prioritize unpopulated areas (preferably over water and away from expected or reported storms13).
Oil in the Sea III recommended that “federal agencies, especially the Federal Aviation Administration (FAA), should work with industry to more rigorously determine the amount of fuel dumping by aircraft and to formulate appropriate actions to understand this potential threat to the marine environment.” This recommendation from 2003 has not been acted upon.
The Transport Canada Civil Aviation (TCCA) agency does not maintain statistics on the frequency of fuel jettisoning. The FAA describes the frequency of emergency jettisoning as “extremely rare,”14 and has neither required nor routinely recorded incidences of commercial aircraft fuel jettisons as they occur (Clewell, 1983). The Oil in the Sea III report (NRC, 2003) estimated that 1,500 tonnes of petroleum per year are released over the open ocean in North America, and 7,500 tonnes per year worldwide from this activity based on assumptions about the probability of fuel dumping occurring for civilian and military aircraft and experimental deposition studies estimating constraints on the amount of fuel that typically reaches the sea surface (NRC, 2003). Given that U.S.-system air traffic has tended to increase since the completion of the Oil in the Sea III report, which estimated an approximate total of 1,000 flights per day (700 North Atlantic, 100 North Pacific, 200 Southern hemisphere) for its calculations, an input of 1,500 tonnes of petroleum per year to North American waters may be an underestimate. Following a low-altitude fuel dumping incident in January 2020, the FAA was quoted to be aware of 47 events globally in the past 3 years involving a U.S. airline.15 Previous estimates of the frequency of fuel-dumping incidents are derived from U.S. Air Force assessments of military jettisoning, and cited in Oil in the Sea III.
3.5 ACCIDENTAL SPILLS
Accidental spills are oil spillages occurring during exploration and production of oil and gas, spills due to aging infrastructure, and spills from transportation, including pipelines, tank vessel spills, non-tank vessel spills, transportation by rail, and spills associated with coastal refineries and storage facilities.
3.5.1 Exploration and Production of Oil and Gas
Significant oil spillage related to oil extraction may occur due to a blowout (the uncontrolled release of oil and gas from a well to the environment or “loss of well control”). A blowout, also known as a loss of well control, is an uncontrolled flow of formation or other fluids, and can occur at the surface or underground. A blowout usually does not involve the release of much oil. However, it may, on occasion, lead to the release of large volumes of oil (such as in the case of the DWH spill). The volume of oil released in a blowout depends
___________________
10 See https://www.bts.gov/content/federal-exhaust-emissions-standards-newly-manufactured-marine-spark-ignition-outboard-0.
11 See https://www.nmma.org.
12 See https://www.gminsights.com/industry-analysis/outboard-engines-market.
14 See www.faa.gov/airports/airport_development/omp/faq/general_concerns#q23.
15 See popsci.com/story/technology/airplane-fuel-dumping-landing-weight.
on the flow rate, which is in turn dependent on the reservoir properties, well characteristics, and the duration of the flow (i.e., how long it takes for the oil to stop flowing naturally through natural bridging or through a human intervention, such as a blowout preventer, capping stack, or relief well).
Smaller spills may also occur during routine operations. As reported in Oil in the Sea III, spills related to oil extraction contributed a relatively minor input of oil to marine and estuarine waters—totaling an estimated 168 MT of oil per year with slightly more than half coming from offshore operations. This picture changed dramatically when, in April 2010, the Macondo MC252 well experienced a blowout event during drilling operations from the drilling rig Deepwater Horizon. Although the oil spilled from the Macondo MC252 well, the incident is generally referred to as the Deepwater Horizon or DWH oil spill. This event resulted in the release of 4 million bbl (about 571,000 MT) of oil into the Gulf of Mexico over the course of 86 days. Except for the DWH outlier event, overall, despite an increase in volume of oil produced, the inputs of oil from oil extraction-related spills from 2010–2019 have been minor and of a similar scale to those reported in Oil in the Sea III. However, there has been a shift to more spillage in offshore waters and less spillage in nearshore/coastal waters.
3.5.1.1 Estimation of Oil Inputs from Spills Resulting from Exploration and Production
In a 2009 report prepared for the American Petroleum Institute (API), the 95% reduction in spillage from U.S. offshore oil platforms was described as a significant achievement (Etkin, 2009). Although there had been other oil spills resulting from blowouts in North American waters during the 1960s and 1970s, including the 1969 Alpha Well 21 Platform A incident off Santa Barbara, California, in which 100,000 bbl (14,285 MT) were released, there were no incidents that approached the magnitude of the Ixtoc I incident in Mexico. In the Ixtoc I blowout, between 3.3 million and 10.2 million bbl of crude oil (471,000 to 1.46 million MT) spilled into the Gulf of Mexico at Bahia del Campeche, Mexico, over the course of 290 days in 1979 and into 1980 (Boehm and Feist, 1982; Dokken, 2011). The next largest blowout of 2 million bbl (286,000 MT) occurred off the United Arab Emirates in 1973. In Canada, the largest blowout, which occurred in 1984 off Nova Scotia, amounted to a release of 1,500 bbl (215 MT). In the year before the DWH incident, there was a blowout at the Montara platform offshore Australia in which 28,600 to 214,300 bbl had spilled (Commonwealth of Australia, 2011).
While it will never be possible to definitively establish the exact volume of oil released during DWH (refer to Box 3.2), in 2015, the U.S. District Court’s findings of fact showed that approximately 4 million bbl of oil were released and that, given the oil collected at the source (810,000 bbl), a total of 3.19 million bbl of oil were released into the Gulf of Mexico. With regard to impacts, the amount released into the Gulf would be of greatest relevance, although for the purposes of evaluating potentials of releases from blowouts and responses to these events, the amount of oil collected at the source should not be discounted.
The 10-year time period selected for the analysis of data to produce an estimate of oil spill inputs corresponds to the 10-year period for spills just prior to the 2000 commencement of the Oil in the Sea III study (1990–1999); the fact that
the DWH incident coincidentally occurred at the beginning of the 10-year time frame being analyzed to determine estimates of “average annual oil inputs” from various types of spill, including oil extraction operations, presents a challenge for the Oil in the Sea IV study input estimation analysis. The volume of 4 million bbl (571,430 MT) is assumed in this Oil in the Sea IV study. If this amount is “averaged” over 10 years (2010–2019), the “annual” input from oil extraction would come to more than 57,000 MT. This amount not only exceeds the entire annual spillage reported in Oil in the Sea III (7,941 MT) by seven times but is also the equivalent of more than half of the total inputs from all anthropogenic sources as estimated in Oil in the Sea III. Given that the DWH incident can reasonably be considered an extreme outlier case (Ji et al., 2014), it is factored in separately in the Oil in the Sea IV analysis. The effect of including and excluding the DWH incident from the overall extraction spill estimates is shown in Table 3.4.
The estimated 160 MT of annual spillage from offshore and coastal/nearshore oil exploration and production activities represents the relatively small spills that occur during routine operations. These spills include the spills of hydraulic oils, diesel and other fuels, petroleum-based synthetic drilling muds, and occasionally crude oil that occur during exploration drilling and production activities. For Canadian offshore operations, spills of crude oil have averaged less than 6 bbl (0.9 MT) per year. There have been some spills of drilling muds that have all been less than 100 bbl each. In the United States, for the past decade, excluding the DWH incident, spills from oil and gas extraction have all involved 500 bbl or less; 77% have involved less than 10 bbl. (No data on individual incidents were available for Mexico.)
Prior to the 2010 DWH spill, U.S. offshore spillage per unit production had decreased by 87% since the 1970s and 71% since the 1990s (Etkin, 2009). This appeared to indicate increased safety measures or “Standard of Care” (i.e., implementation of accident prevention measures, inspections, maintenance, and operator training) in operations. However, the DWH incident brought up significant concerns regarding safety and spill prevention measures for offshore exploration and production operations, which were echoed in Canada, Mexico, and other parts of the world (see Box 3.3).
With respect to the statistical analysis of oil inputs from extraction operations for Oil in the Sea IV, DWH is included as a separate and distinct input of oil. The fact that the incident occurred during the 10-year Oil in the Sea IV time frame of 2010–2019 does not mean that this is a once in 10 years event. In fact, its occurrence once in 20 years (back to Oil in the Sea III) or longer (to the beginning of offshore oil exploration in the mid-1950s) does not have any bearing on
TABLE 3.4 Estimated Annual Spillage Inputs from Oil Extractiona
| Geographic Zone | Subzone | Average Annual Spillage from Oil Extraction (MT/year)b | Oil in the Sea III Estimate for 1990–1999 (MT/year)c | |
|---|---|---|---|---|
| Excluding DWH | Including DWH | |||
| C: E Canada | Coastal | 0 | 0 | ND |
| C: E Canada | Offshore | 0.9* | 0.9* | 28 |
| D: N Atlantic | Coastal | 0 | 0 | Trace |
| F: E GOM | Coastal | 0 | 0 | Trace |
| F: E GOM | Offshore | 1.4* | 1.4* | Trace |
| G: W GOM | Coastal | 70.8 | 70.8 | 90 |
| G: W GOM | Offshore | 18.1 | 57,161.00 | 50 |
| H: Mexican GOM | Coastal | 0 | 0 | ND |
| H: Mexican GOM | Offshore | 1,016.70 | 1,016.70 | 61 |
| J: Mexico Pacific | Coastal | 0 | 0 | NA |
| J: Mexico Pacific | Offshore | 0 | 0 | NA |
| K: CA Pacific | Coastal | 0.1* | 0.1* | Trace |
| K: CA Pacific | Offshore | 1.2* | 1.2* | Trace |
| L: Mid-Pacific | Coastal | NA | NA | Trace |
| P: South Alaska | Coastal | 0.1* | 0.1* | Trace |
| P: South Alaska | Offshore | 0.3* | 0.3* | NA |
| Total | Coastal | 71 | 71 | 90 |
| Total | Offshore | 1,038.60 | 57,291.20 | 139 |
| Grand Total | 1,109.60 | 57,362.20 | 229 | |
a Current estimates are based on data analyses conducted by Environmental Research Consulting and Greene Economics on the U.S. Coast Guard Marine Information for Safety and Law Enforcement (MISLE) database for U.S. zones, on data from the Canada-Nova Scotia Offshore Petroleum Board and Canada-Newfoundland and Labrador Offshore Petroleum Board for Canadian zones, and data provided by Petróleos Mexicanos (Pemex) for Mexican zones.
b Estimates that would have been classified as “trace” in the Oil in the Sea III study are shown with an asterisk.
c “Trace” indicates that estimated input is less than 10 MT or 70 bbl/year.
NOTE: NA = not applicable; ND = not determined.
the expected future occurrence of a similar well failure or oil spill of the magnitude of the DWH oil spill.
There are potential worst-case discharge scenarios for which operators and regulators are conducting contingency planning in the Gulf of Mexico, as well as in other offshore oil exploration and production areas in North America (notably Eastern Canada and possibly Mexico) that could hypothetically result in a blowout that would dwarf DWH (e.g., Buchholz et al., 2016). The likelihood of blowouts of this magnitude are affected by flow rates and the time by which the flow of oil and gas is stopped, either by natural bridging or by active source control measures (e.g., relief wells, capping stacks, or top hat installations) implemented by responders.
A number of studies have looked into the likelihood of blowouts with varying results.
Worldwide, there have been about 50,000 exploratory wells drilled with two large blowouts–the 1979 Ixtoc I well blowout, and the 2010 Macondo MC252 well blowout. That suggests an incidence rate of about 1 large blowout for every 25,000 exploration drilling operations (Imperial Oil Resources, 2013). However, this rate assumes that offshore operations have equivalent safety standards worldwide.
The most comprehensive data on offshore blowouts are maintained by SINTEF. Based on analyses of 607 offshore well blowouts and releases that have occurred worldwide since 1955, Holand (2013) has calculated blowout probabilities that range from about 4.0 × 10⁻⁶ to 1.4 × 10⁻⁴ (1 in 250,000 to 1 in 7,000) per well or per well-year, depending on the well depth and phase of drilling operations (development, production, or completion) (reviewed in Etkin, 2015). Blowouts are more likely to occur in wells in deeper water (Holand, 2013). Note that a blowout (or loss of well control) does not necessarily imply a large oil release. When an oil spill results from a blowout, there is a 56% likelihood of it lasting 2 days or less (i.e., bridging naturally with sediments filling the wellbore), and only a 15% chance of it lasting more than 2 weeks (Holand, 2006, 2013); however, the Macondo well in the DWH incident flowed for 85 days until it was capped.
In a study conducted for the U.S. Bureau of Safety and Environmental Enforcement (BSEE), loss of well control (LOWC) events in the U.S. Gulf of Mexico outer continental shelf (OCS) were analyzed for the purpose of developing a risk model to estimate risk for future LOWC events (Holand, 2016). One factor that was found to contribute to the probability of a large spill (of at least 500 to 5,000 bbl) is exploration drilling (as opposed to development or production drilling), especially from a floating vessel (drilling rig) rather than from a fixed platform.
The frequency (per well) of LOWC events or blowouts for development drilling resulting in at least 500 bbl of spillage was estimated to be significantly higher in the U.S. Gulf of Mexico OCS than in regulated areas in other parts of the world, including offshore East Canada (1 in 390, compared to 1 in 1,560). The greatest likelihood of a LOWC event is during the exploration drilling phase when the characteristics of the reservoirs are not well known. Here again, the U.S. Gulf of Mexico was calculated to have a higher probability of an LOWC event (1 in 160 compared to 1 in 600). The U.S. Gulf of Mexico has a higher reported rate of “kicks,” although according to Holand (2016) there is no clear explanation for this. Possible reasons include the greater depth of the wells in the substrate (as distinct from water depth) which take a longer time to drill, or that there are more complicated formations to deal with. A well kick occurs when the pressure found within the drilled rock is higher than the mud hydrostatic pressure acting on the borehole or rock face, which can force formation fluids into the wellbore. The forced fluid flow is called a “kick.”16
These calculations were based on historical data. The probabilities for future blowouts will be affected by the degree to which known mitigation and prevention measures are implemented (including the capping stack developed for the DWH response), as well as any new technologies that are developed. One research team (Caia et al., 2018), conducted analyses based on newer intervention technologies developed after the DWH incident. These newer interventions, such as Rapid CUBE (Rapid Containment of Underwater Blowout Events) (Andreussi and DeGhetto, 2013) and Blowstop injections (Caia et al., 2018), were shown to reduce the duration
___________________
of flow by 30% to 60%, resulting in much lower volumes of release. Most of these technologies are designed to intervene in spills that originate from a broken riser above the seafloor. In the case in which a well failure results in subsurface damage and leakage through the near seabed sediments, the leak area will be diffuse, and rapid containment would be much more challenging and likely would be achieved through a relief well.
From a preparedness and response perspective, the ability to reliably control the source of the oil release (the well) as quickly as possible to reduce or stop the flow of oil will be the most effective way to reduce or mitigate impacts of any future blowout or large release (Buchholz et al., 2016). Section 4.1.2 includes additional detail on source control measures for offshore wells.
Offshore Exploration and Production Safety
Following the Macondo incident, a comprehensive review was conducted by the U.S. oil and gas industry, the U.S. Department of the Interior and the Presidential Oil Spill Commission, the National Research Council (NRC, 2012), and the National Chemical Safety Board—all of which resulted in a series of recommendations and actions to improve offshore safety, safety culture, and the regulatory framework. Since then, government and industry have been focused on developing regulations and standards as well as ensuring availability and readiness of well intervention and spill response capabilities.
The U.S. government, through the BSEE and the Bureau of Ocean Energy Management (BOEM), has made significant changes to the regulations governing offshore oil and gas operations. Among them are requirements for the safety and environmental management systems (SEMS), drilling safety, well control, blowout preventer systems, production safety, and spill response. The regulations for well design, integrity, and safety now have extensive requirements that include (among other things):
- Requirement for two independent barriers between hydrocarbon-bearing zone and the environment
- Requirements for the testing, inspection and certification of well completion activities as well as subsea well control equipment including blowout prevention equipment
- Real-time monitoring capabilities for high-risk drilling activities
- New requirements for firefighting systems and high pressure/high temperature (HP/HT) well equipment
- New reporting requirements
The USCG is another regulatory agency overseeing offshore oil and gas operations in relation to safety of life, property, and navigation as well as protection of the environment. During a maritime oil spill response, the U.S. Coast Guard acts as the designated federal Incident Commander. The USCG has also revised some of its regulations, guidance, inspections, and training practices including, among others:
- Requirements for the independent testing and certification of electrical equipment in hazardous locations on new mobile offshore drilling units (MODUs), floating offshore facilities, and vessels other than offshore supply vessels that engage in offshore activities
- Guidelines for fire and explosion risk analysis
- Guidelines for lifesaving and firefighting equipment, training, and drills onboard manned offshore facilities
- Updated inspection protocols for vessels in offshore operations
- Improved collaboration with the BSEE on regulatory oversight, inspection, and spill response
In the United States, the API develops industry standards for safe oil and gas operations. Since 2010 API has published more than 250 new and revised exploration and production standards including standards for wells, blowout preventers, subsea and well capping equipment, integrity management, and spill response, among others. Development of standards is underpinned by continuous innovation and development of new technologies to increase safety and environmental protection in all segments of offshore operations. Latest efforts have resulted in significant improvements in information management systems, large data analytics for well planning and design, equipment manufacturing, complex well completion tools, and a variety of other new methods and techniques.
In 2011, the industry formed the Center for Offshore Safety (COS) to help improve the safety performance of the offshore oil and natural gas industry. The COS is focused on a development of audit tools, standards, and best practices as well as protocols for industry data collection, analysis, reporting, and knowledge sharing among companies and regulators. The COS has developed SEMS tools for auditor qualification, conduct of audits, and accreditation of audit service providers (API, 2019a). The development of consistent and transparent audit tools and processes assists in effective implementation of SEMS and facilitates broad sharing of audit learnings.
Another significant achievement of the offshore oil and gas industry was the creation of well intervention and containment consortiums that provide containment and response capabilities for well intervention thousands of feet below the water’s surface. These companies maintain specially designed equipment for well control in strategic locations around the globe and complement capabilities of commercial well control companies. More than 20 capping stacks (see Figure 3.7) are now available for well control. This ensures quick deployment of equipment tailored to specific incident conditions to any location in the world. Source
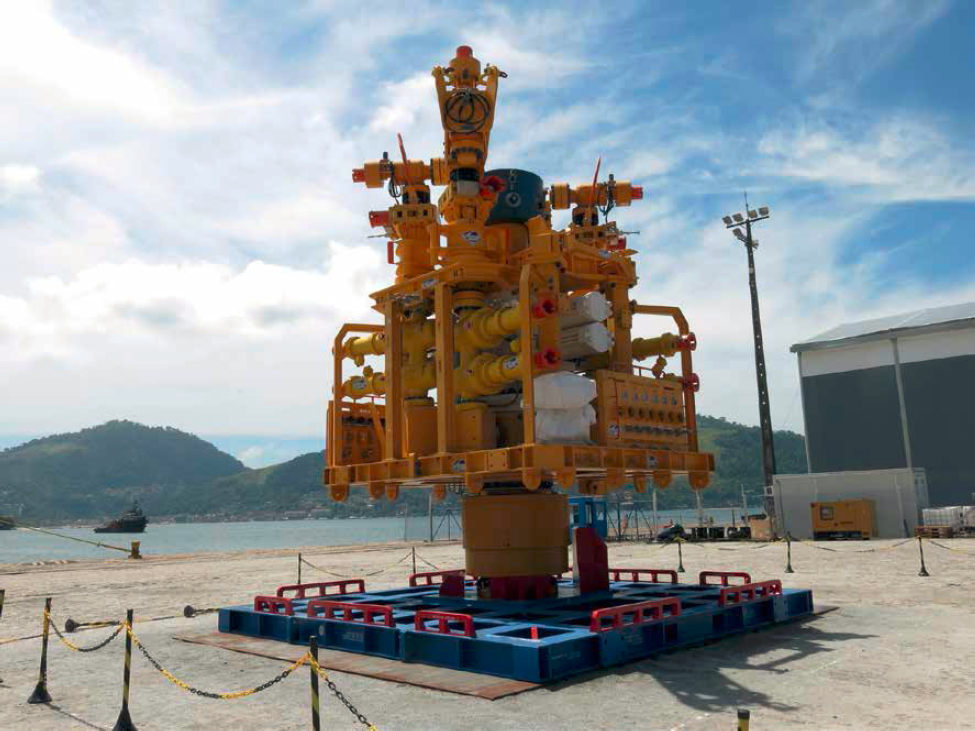
SOURCE: Oil Spill Response, Limited.
control procedures and equipment are being continuously upgraded with new technologies and best practices to keep pace with industry operations and ensure global response readiness. Regulators in many countries now require oil and gas companies to demonstrate availability of equipment and trained staff to cap a well or capture uncontrolled flow of hydrocarbons prior to commencement of operations.
In Canada, following the Macondo incident, several regulatory reviews and audits were conducted. In 2010, the commissioner of the Environment and Sustainable Development branch of the Office of the Auditor General of Canada evaluated whether Transport Canada, the Canadian Coast Guard, Fisheries and Oceans Canada, and Environment Canada have implemented measures to prepare for and respond to pollution from ships in Canada’s marine environment (The Office of the Auditor General of Canada, 201017). In 2012, the commissioner evaluated whether existing regulations and agencies appropriately manage the environmental risks and impacts from offshore oil and gas activities (The Office of the Auditor General of Canada, 2012). These reports and subsequent work by the agencies resulted in several notable improvements:
- The Canadian Coast Guard established a new Environmental Response Branch within the Maritime Services Directorate. The Director, Environmental Response position was created and staffed, with additional personnel to provide a strategic focus for the program, and to ensure that the Coast Guard can fulfill its mandated obligations related to marine pollution preparedness and response. The Coast Guard also reviewed its Response Management System to ensure that it can support a multi-party response to a major oil spill in Canadian waters.
- Transport Canada, in their Report to Parliament 2006–2011 on Marine Oil Spill Preparedness and Response Regime (Transport Canada, 2014), reported improvements in interdepartmental governance and coordination. The Interdepartmental Marine Pollution Committee was formed, co-chaired by Coast Guard and Transport Canada, and reporting to the Assistant Deputy Ministers’ Emergency Management Committee. Transport Canada, Environment Canada,
___________________
17 See https://publications.gc.ca/collections/collection_2011/bvg-oag/FA1-14-2011-eng.pdf.
- Natural Resources Canada, Aboriginal Affairs and Northern Development, National Defence, and Public Safety Canada are members of the committee. The committee supports the Government of Canada’s objectives related to marine pollution, focusing on interdepartmental collaboration to strengthen Canada’s ability in prevention, preparedness, and response and recovery capabilities regarding marine pollution events.
- Canada-Newfoundland and Labrador Offshore Petroleum Board (C-NLOPB) established a Special Oversight Team and defined Special Oversight Measures for critical wells. The measures are applied prior to and during the well approval review process, and extend throughout the execution phase and into the plugging and abandonment of the well.
Special Oversight Measures are focused on well control protocols, equipment, and competencies, blowout prevention, and oil spill response contingency plans. There is a heightened focus on kick prevention, maintaining dual well barrier envelopes, assessing the extent of means in place for primary and secondary well control, and assessing the integrity and functionality of primary and secondary BOP systems. There is also heightened focus on assessing plans and processes for oil spill response readiness, relief well drilling arrangements, and arrangements for capping stack/subsea containment systems. (C-NLOPB, 2018)
- In 2013, the governments of Canada, Nova Scotia, Newfoundland, and Labrador implemented changes to further strengthen the Canadian regimes to reinforce the “polluter-pays principle” in legislation, increasing “absolute” liability (no-fault) limits in the offshore from $30 million to $1 billion (CA).
- A regulation under the Canada Oil and Gas Operations Act added Corexit® EC9500A and Corexit® EC9580A to Schedule 1, enabling the use of the spill-treating agents when they are likely to achieve a net environmental benefit.
- The Multi-partner Research Initiative, part of the national Oceans Protection Plan, was launched in 2016. The Initiative provided $45.5 million over 5 years to support collaboration among leading national and international experts on oil spill research and response to:
- identify knowledge gaps and research priorities;
- improve understanding of how oil spills behave in water and their impacts on fish and other aquatic organisms;
- develop new technologies and protocols to select the best methodologies for oil spill clean-up; and
- support science-based decisions that will aim to minimize the environmental impacts of oil spills and enhance habitat recovery.
Pipeline Safety
In 2017, the U.S. Department of Transportation Pipeline and Hazardous Materials Safety Administration’s (PHMSA’s) Office of Pipeline Safety (OPS) Division worked with the Pipeline Safety Trust, the API, and the Association of Oil Pipe Lines and develop performance measures for pipeline systems transporting crude oil, refined petroleum, and biofuel. Safety metrics were defined, by individual operator and by safety program, that uses incident data for serious incidents (as rate per mile and causes), accidents impacting people or the environment (as rate per mile and volume spilled per barrel-mile transported and for all causes in terms of integrity inspection target, and operations and maintenance target), and miles inspected (as miles inspected by inspection method).18 PHMSA monitors compliance through field inspections of facilities and construction projects; programmatic inspections of operator management systems, procedures, and processes; incident investigations; and direct dialogue with operator management. PHMSA has established enforcement mechanisms to require that operators take appropriate and timely corrective actions for violations, and that they take preventive measures to prevent future failures or non-compliant operation of the pipelines.19
In the United States for the past 5 years, the total number of onshore and offshore pipeline incidents impacting people or the environment decreased by 36% despite a 10% increase in pipeline mileage and barrels (10% increase in “barrel miles,” or barrels of liquid moved one mile) delivered (API, 2019b). Leak prevention is accomplished by robust pipeline integrity management, which involves, among other things, risk identification and measures to mitigate these risks (API, 2019c). Industry’s strategic plan to further improve pipeline safety includes four main goals:
- Promote and improve safety culture by implementing safety and integrity management systems (ANSI and API, 2015; API, 2019c), analyze and share learnings from incidents and implement mitigation measures;
- Improve safety through technology and innovation—for example, by developing and implementing a holistic leak detection program and advanced leak detection methods including corrosion identification and mitigation techniques (API, 2015);
- Increase stakeholder awareness and engagement to reduce potential for excavation damage for onshore assets (API, 2010); and
- Enhance emergency preparedness and response tools and practices (API, 2015).
___________________
18 See https://www.phmsa.dot.gov/data-and-statistics/pipeline/national-pipeline-performance-measures.
19 See https://primis.phmsa.dot.gov/comm/reports/enforce/Enforcement.html.
3.5.2 Spills Caused by Natural Hazards
Besides blowouts and more usual operational spillage, there is also a potential for oil spillage to occur from offshore oil platforms, wells, and other installations due to damage from earthquakes, hurricanes, and storm-related currents and mudslides. Storm damage may include wind damage to topside structures; topside damage by greenwater (waves that break over the deck); wave slamming on the underside of floating platforms; loss of mooring systems due to disconnection in high seas, breakage in high currents, or loss of anchors in sediment failures; and structural damage caused by submarine mudslides and shoreline erosion, among others. Loss of mooring systems can result in capsizing or uncontrolled drift, which may also result in damage to subsea equipment due to dragging the mooring system or risers with the rogue platform. Studies conducted in the Gulf of Mexico document damage to offshore platforms and structures during Hurricanes Andrew, Lili, Ivan, Gustav, and Ike (Wang et al., 2005; Energo Engineering, 2006, 2010). The high winds, storm surge, and associated seafloor mudslides during Hurricane Ivan toppled a number of offshore platforms in September 2004, including that of Taylor Energy at Mississippi Canyon (MC-20) (Bryant et al., 2020; see Box 3.4), causing the spillage of an undetermined amount of oil at the time of this study. Estimates from model calculations, reported by the National Oceanic and Atmospheric Administration’s (NOAA’s) National Centers for Coastal Ocean Science, range between 9–108 bbl of oil released daily into the Gulf of Mexico for, at the time of this study, 17 years (and counting). The amount of oil collected by the containment system installed in April 2018 is in the vicinity of 30 bbl per day. Oil from this incident is still being released periodically from the seafloor (Bryant et al., 2020).
The potential for future spillage related to damage from hurricanes, particularly in light of increase in intensity and frequency of severe storms and hurricanes related to global warming, represents a considerable risk of future oil inputs into the marine environment (Wang et al., 2005; Webster et al., 2005; Elsner et al., 2008; Bender et al., 2010; Knutson et al., 2010; Wijesekera et al., 2010).
3.5.3 Aging Infrastructure and Decommissioning Leakage
Offshore oil and gas exploration activities began in the late 1800s off Santa Barbara, California followed closely by exponential expansion of offshore exploration in the marshes, bays and nearshore waters of Louisiana. Shortly thereafter, exploration expanded to the nearshore and offshore waters throughout the Gulf of Mexico at an expeditious rate.20 To date, this activity has produced some 55,000 oil and gas wells drilled, and roughly 23,000 miles of pipelines installed in waters of the U.S. outer continental shelf (OCS) associated with oil and gas exploration. Of the wells drilled, approximately 53% have been permanently or temporarily decommissioned.21 The two largest oil producing states, Texas and Louisiana, each report a growing number of decommissioning and abandonments. Many wells and pipelines that have ceased production have gone into abandonment (orphaned) and potentially impart additional risks for leakage of oils into the environment. Even wells that have been properly plugged and abandoned (P&A) hold a significant long-term risk of release or total failure of the containment system.
Actively producing wells have been decreasing in number, particularly in shallow water. Over the past two decades, the BSEE reported more than a 50% decrease in active wells, from a peak in 2001 of approximately 4,000 to less than 1,908 remaining in 2017. Wells are decommissioned for a variety of reasons, but most often it is a matter of economics (costs of the operation surpassing the revenues from the production) or resource depletion. The decommissioning of an oil and gas well and associated infrastructure may include many processes but must include the plugging of each well bore by the use of means that meet regulatory standards. BSEE regulations also mandate that any well in an idle condition for more than three years, and platforms that have been inactive for 5 years, or platforms that have been toppled, or those for which there are no further plans for production must be listed on the BSEE “Idle Iron”22 list and be physically removed and/or otherwise decommissioned within 5 years of inclusion on the list. The fate of the decommissioned material may include scrapping, or use as artificial reef material, per BSEE’s Rigs-to-Reefs policy. Legislation regarding federal waters allows regulators to hold any previous owner responsible for necessary plug and abandonment and removals. Such legislation may not apply to waters not under 43 U.S.C. 1334 and 30 C.F.R. 250, Subpart Q, Decommissioning Activities.23
Oil and gas wells—whether active (in service), inactive, suspended, orphaned, or abandoned—have been sources of oil and gas released into the environment since the first wells were drilled. Releases occur during all phases of a well’s existence (see Figure 3.9), including the exploration, extraction, and abandonment phases. Structural components of the well tubing, valves, and fittings, and even the materials
___________________
20 American Oil & Gas Historical Society editors, “Offshore Petroleum History.” January 10, 2010; updated November 9, 2020. American Oil & Gas Historical Society. https://aoghs.org/offshore-history/offshore-oil-history.
21 Wesley C. Williams, PhD, PE, “Leakage During Decommissioning and from Decommissioned Wells” National Academies presentation. Advanced Reactor Systems Oak Ridge National Laboratory.
22 See https://www.bsee.gov/notices-to-lessees-ntl/ntl-2018-g03-idleiron-decommissioning-guidance-for-wells-and-platforms.
23 43 U.S.C. § 1334 and 30 C.F.R. Pt. 250, Subpart Q, Decommissioning Activities, https://www.govinfo.gov/content/pkg/CFR-2015-title30-vol2/pdf/CFR-2015-title30-vol2-part250-subpartQ.pdf.
used to plug a well, are susceptible to corrosion, decay, tectonic shifting, underwater landslides, and accidents such as allisions by passing vessels, but more often fail due to well design and the materials used in their construction and containment efforts. Although the age of the wells and associated infrastructure are not always the underlying reasons for an oil release into the environment, age can be, as has been established, a contributing factor and cause for concern. Age ranges of pipelines and wells for the northern Gulf of Mexico are shown in Table 3.6. BSEE has
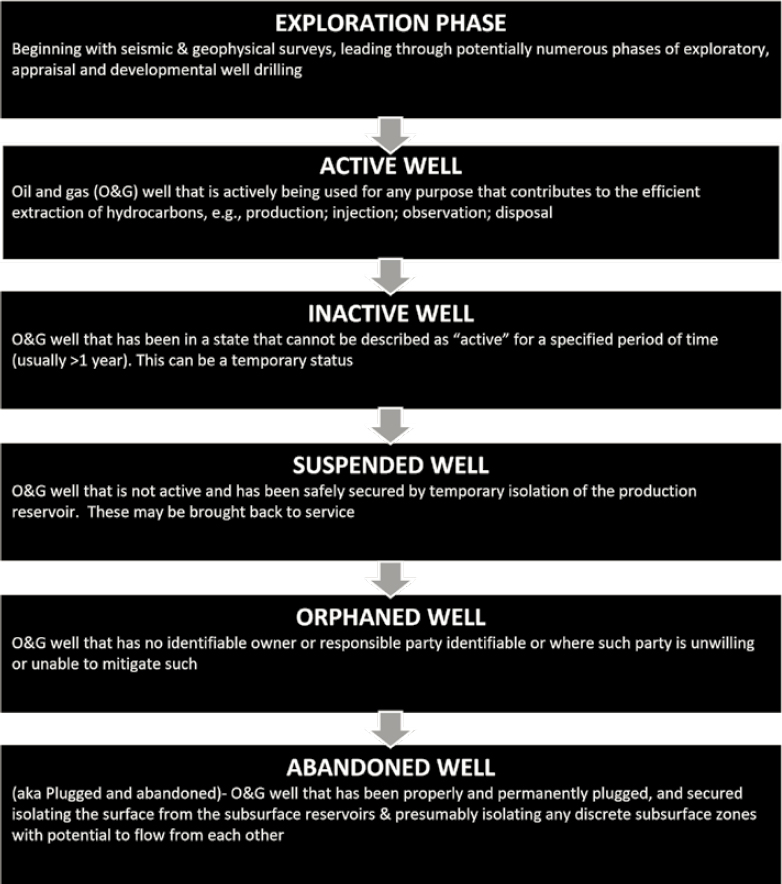
TABLE 3.6 Age Categories of Pipelines and Wells in the Northern Gulf of Mexico
| Age | Total Number of Pipelines and Wells (by Age) in Northern Gulf of Mexico | ||||||||
|---|---|---|---|---|---|---|---|---|---|
| <10 years | 10+ years | 20+ years | 30+ years | 40+ years | 50+ years | 60+ years | 70+ years | Total | |
| Total Pipelines | 2,293 | 4,396 | 3,280 | 1,409 | 2,799 | 898 | 109 | 15,184 | |
| Total Wells | 1,349 | 4,205 | 7,209 | 7,514 | 8,149 | 6,677 | 1,948 | 69 | 37,120 |
SOURCE: Data based on BSEE data available as of November 30, 2020.
NOTE: Totals do not include sidetracks.
indicated there are more than 8,500 actively producing wells in the Gulf of Mexico alone with ages greater than 50 years.24
Wells that have been properly plugged and abandoned (P&Aed) continue to pose a threat to the environment. Several leak paths potentially exist (see Figure 3.10), including loss through the casing-annulus, cement micro-annulus, plug casing annulus, bulk flow through cement, casing penetration, and micro channeling through annulus cement and annulus cement-formation micro-annulus. Recently developed sealing alternatives such as bismuth alloys, thermite and resins have been replacing cements for the P&A process, but no data exists to date that any design currently in use will meet the conventional “eternal, 3,000 years or greater” expectation. Some research suggests that P&Aed wells are still under high pressure and that use of current P&A practices may have a statistical life of only a few hundred years. Some studies suggest that between 1.9 to 75% of drilled wells may eventually exhibit integrity failure of containment, resulting in a potential of more than 10 million bbl of oil that could be released into the environment, given the current number of wells drilled to date (Ingraffea et al., 2014; Boothroyd et al., 2016; Willis et al., 2019).
Pipelines associated with oil and gas activities have exhibited accidental spills emanating from failures due to allisions to the pipeline associated with vessel groundings, anchor drags and setting, and ruptures due to human oversight such as over-pressuring (Kaiser and Narra, 2017). Steel pipelines in saltwater marine environments are particularly susceptible to corrosion, which has contributed to a growing number of spills in older systems such as in the marshes of Louisiana and in Texas bays. Cathodic protection measures and coating are standard practice but have limitations to the extension of a pipeline’s usable life. Pipelines are either trunklines or gathering lines. Trunklines are typically large in diameter and may carry products from wells, fields and lease blocks to market. Gathering lines typically are shorter segments of smaller diameter lines that transport liquids and gases between facilities or to a trunkline. Normal procedures for the retirement of an existing pipeline include full or partial removal off the pipeline, or the pigging (a process that may include internal inspection and purging of the line) and cutting of the ends of the line, as well as ensuring proper burial depth and abandonment, after which pipelines pose little threat for spillage. In the Gulf of Mexico, a total of 45,310 miles of pipeline have been installed and more than half have been decommissioned (Kaiser and Narra, 2019). Data suggest that the number of spills from pipelines has increased dramatically. From 1968 to 1977, an average of 47 pipeline spills per year were reported. Decadal averages increased to 188 per year in 1978–1987 and to 228 per year in 1988–1997 (GESAMP, 2007). Some papers suggest that the increase in releases from pipelines may be attributable not only to the increase in number and length of lines, but also to the aging of the existing lines (Jernelöv, 2010).
Well infrastructure and pipeline spill data are not collected in a manner that denotes a cause due to aging; therefore, the ability to quantify the amount of oil entering the seas due to such releases cannot be discerned.
3.5.4 Transportation of Oil and Gas
Between crude oil extraction (exploration and production processes) and the use of oil as a fuel or material for the production of chemicals, oil is transported and handled many times.
Crude oil and refined petroleum products are transported from one place to another in a number of ways: by tank vessel (tanker or tank barge); by pipeline; and, more recently, by

SOURCE: Willis et al. (2019).
___________________
TABLE 3.7 Estimated Annual Spillage from Pipeline Oil Transportationa
| Geographic Zone | Subzone | Average Annual Spillage from Pipeline Oil Transportation 2010–2019 (MT/year)b | Average Annual Spillage from Pipeline Oil Transportation Oil in the Sea III Estimate for 1990–1999 (MT/year)c |
|---|---|---|---|
| D: N Atlantic | Coastal | 24 | 150 |
| E: Mid-Atlantic | Coastal | 3.7* | 36 |
| F: E GOM | Coastal | 11.4 | Trace |
| F: E GOM | Offshore | 0 | Trace |
| G: W GOM | Coastal | 296.1 | 890 |
| G: W GOM | Offshore | 2.1* | 60 |
| H: Mexican GOM | Coastal | 0 | Trace |
| H: Mexican GOM | Offshore | 0 | ND |
| I: Puerto Rico | Coastal | 0 | Trace |
| J: Mexico Pacific | Coastal | 0 | ND |
| J: Mexico Pacific | Offshore | 0 | ND |
| K: CA Pacific | Coastal | 42 | 39 |
| K: CA Pacific | Offshore | 0 | Trace |
| L: Mid-Pacific | Coastal | 0 | Trace |
| M: NW Pacific | Coastal | 0 | Trace |
| N: Hawaii | Coastal | 1.0* | Trace |
| P: South Alaska | Coastal | 0 | Trace |
| Total | Coastal | 378.3 | 1,115.0 |
| Total | Offshore | 2.1* | 60 |
| Grand Total | 380.4 | 1,175.0 |
a Current estimates are based on data analyses conducted by Environmental Research Consulting on the Pipeline and Hazardous Material Safety Administration (PHMSA) database for U.S. zones. There are currently no offshore or coastal pipelines in Canada. No data were publicly available for Mexican zones.
b Estimates that would have been classified as “trace” in the Oil in the Sea III study are shown with an asterisk.
c “Trace” indicates that estimated input is less than 10 MT or 70 bbl/year.
NOTE: NA = not applicable; ND = not determined.
rail. Each time oil is handled, temporarily stored, transferred, or transported, there is the potential for spillage to occur. Spills that occur from tank vessels, from coastal or offshore pipelines, and conceivably from trains that transit along coastal routes would affect the marine waters of concern in the Oil in the Sea IV study. In addition, spills may occur from coastal storage terminals and refineries.
In the Oil in the Sea IV analysis, the spillage related to the “transportation” phase is considered to take place from the conclusion of the offshore (or onshore) oil extraction phase through the transport by tank vessel, pipeline, or rail to storage terminals, and then through the transport to consumption facilities. Only spills that occur into marine and estuarine waters of North America are included.
3.5.4.1 Pipelines
Pipelines are a vital part of the oil transportation infrastructure of North America. Crude oil is transported through offshore pipelines to terminals and to connect with coastal/inland pipeline systems. Crude oil and diluted bitumen (dilbit; see Section 2.1) are transported from inland production sites in the United States and Canada through pipelines to inland and coastal terminals for distribution by tank vessel, rail, or tanker truck. Some pipelines run directly to refineries. Refined petroleum products are often transmitted through pipelines to terminals and end-use consumption facilities, such as power plants and airports.
Although tens of thousands of pipeline spills have been reported in the last 50 years in the United States and Canada (Etkin, 2014, 2017a), only a small percentage of those spills have affected the marine and estuarine waters of North America as covered by the Oil in the Sea IV study.
The estimated annual inputs of oil to North American marine and estuarine waters are shown in Table 3.7. There has been a 68% reduction in the amount of oil spilled from pipelines between the 1990–1999 Oil in the Sea III time frame and 2010–2019. More than 99% of the spillage has occurred in nearshore or coastal waters.
The significant reduction in coastal and offshore pipeline spillage has mirrored the continuing trend seen in inland pipelines of the United States over the past 50 years (Etkin, 2017a). Many of the safety improvements made to inland pipeline operations have also been applied to offshore and coastal pipelines. These measures include increased inspections and monitoring, as well as replacement of older lines. However, the aging infrastructure of the offshore pipeline system in the Gulf of Mexico is of concern, as described in Section 3.5.2. Of the more than 15,000 miles of oil and gas pipelines in the Gulf of Mexico, over one-third are at least 30 years old (see Table 3.8).
TABLE 3.8 Age of Active Pipelines in Northern Gulf of Mexicoa
| Product Type Transported | Total Pipeline Mileage (by Age) | Total | ||||||
|---|---|---|---|---|---|---|---|---|
| <10 years | 10+ years | 20+ years | 30+ years | 40+ years | 50+ years | 60+ years | ||
| Oil | 1,393 | 2,253 | 1,534 | 525 | 788 | 242 | 48 | 6,783 |
| Gas | 879 | 2,056 | 1,138 | 653 | 1,797 | 537 | 61 | 7,120 |
| Condensate | 0 | 0 | 12 | 0 | 0 | 0 | 0 | 12 |
| Gas/Oil | 0 | 1 | 14 | 45 | 40 | 24 | 1 | 126 |
| Gas/Condensate | 21 | 86 | 582 | 186 | 174 | 94 | 0 | 1,144 |
| Total | 2,293 | 4,396 | 3,280 | 1,409 | 2,799 | 898 | 109 | 15,184 |
a Based on analyses of BSEE data conducted by Environmental Research Consulting.
TABLE 3.9 Estimated Annual Spillage from Tank Vessel Oil Transportationa
| Geographic Zone | Subzone | Average Annual Spillage from Tank Vessel Oil Transportation 2010–2019 (MT/year)b | Average Annual Spillage from Tank Vessel Oil Transportation Oil in the Sea III Estimate for 1990–1999 (MT/year)c |
|---|---|---|---|
| C: E Canada | Coastal | 0.2* | 0 |
| D: N Atlantic | Coastal | 9.5* | 740 |
| D: N Atlantic | Offshore | 0 | 17 |
| E: Mid-Atlantic | Coastal | 0.2* | 14 |
| E: Mid-Atlantic | Offshore | 0 | Trace |
| F: E GOM | Coastal | 2.3* | 140 |
| F: E GOM | Offshore | 0 | 10 |
| G: W GOM | Coastal | 84.8 | 770 |
| G: W GOM | Offshore | 91 | 1,500.00 |
| H: Mexican GOM | Coastal | ND | 80 |
| H: Mexican GOM | Offshore | ND | ND |
| I: Puerto Rico | Coastal | 0 | Trace |
| I: Puerto Rico | Offshore | 0 | 490 |
| J: Mexico Pacific | Coastal | ND | ND |
| J: Mexico Pacific | Offshore | ND | Trace |
| K: CA Pacific | Coastal | 0 | 150 |
| K: CA Pacific | Offshore | 0 | 0 |
| L: Mid-Pacific | Coastal | 0 | Trace |
| L: Mid-Pacific | Offshore | 0 | 12 |
| M: NW Pacific | Coastal | 0.2* | 10 |
| M: NW Pacific | Offshore | 0 | 0 |
| N: Hawaii | Coastal | 0 | Trace |
| N: Hawaii | Offshore | 0 | Trace |
| O: Pacific Canada | Coastal | 9.9* | 0 |
| O: Pacific Canada | Offshore | 0 | 0 |
| P: South Alaska | Coastal | 0.2* | 20 |
| P: South Alaska | Offshore | 0 | Trace |
| Q: North Alaska | Coastal | 0 | Trace |
| Q: North Alaska | Offshore | 0 | Trace |
| Total | Coastal | 107.4 | 1,924.00 |
| Total | Offshore | 91.1 | 2,029.00 |
| Grand Total | 198.5 | 3,953.00 |
a Current estimates are based on data analyses conducted by Environmental Research Consulting and Greene Economics on the U.S. Coast Guard Marine Information for Safety and Law Enforcement (MISLE) database for U.S. zones, and on the Marine Safety Information System (MARSIS) data for Canadian zones. No data were publicly available for Mexican zones.
b Estimates that would have been classified as “trace” in the Oil in the Sea III study (less than 10 MT) are shown with an asterisk.
c “Trace” indicates that estimated input is less than 10 MT or 70 bbl/year.
NOTE: NA = not applicable; ND = not determined.
For coastal and inshore pipelines, 28% of spills are caused by corrosion, which is greater in older pipelines. For offshore pipelines, corrosion is identified as the main cause of pipeline spills 14% of the time. However, these pipeline incidents tend to involve smaller volumes as corrosion and associated leakage are generally detected during inspections. Larger pipeline spills are more likely to occur from natural forces or other outside damage, which for offshore and coastal pipelines can include hurricanes (Energo Engineering, 2010) and seismic activity, anchor dragging, dredging, or excavation.
Pipeline spill prevention measures that would address these types of incidents include regular inspections and maintenance, and clear marking of locations of pipelines on navigational and coastal maps.
3.5.4.2 Tank Vessel Spills
The category of “tank vessels” includes all the tankships (tankers) and tank barges that carry crude oil or petroleum products as cargo. These vessels also carry oil as fuel and for lubrication, as with all non-tank vessels.
Average annual spillage by geographic zone and subzone is shown in Table 3.9 in MT for the current Oil in the Sea IV analysis, which encompasses the years 2010–2019 and for Oil in the Sea III, which encompassed 1990–1999. Only spills of one bbl (0.14 MT) or more are included in the analysis. The Oil in the Sea III analysis excluded vessels less than 100 gross tonnage (GT). There were a total of 94 tanker spills of at least one bbl—less than 10 spills per year. (Final estimates, as shown in Table 3.9, are expressed in MT to be consistent with the Oil in the Sea III results.) The locations of the spills are shown in Figure 3.11.
While tankers were of the greatest concern as spill sources in the Oil in the Sea III study and other risk assessments at that time, the picture is considerably different now. There was a nearly 95% reduction in the overall volume of tank vessel spillage in North American waters during 2010–2019 compared to the Oil in the Sea III time
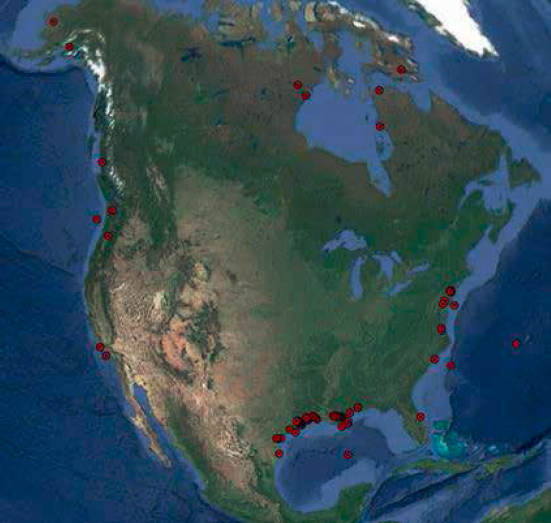
SOURCE: Courtesy of Environmental Research Consulting.
TABLE 3.10 Global Tanker Spill Trend
| Time Frame | Average Annual Tanker Spills Worldwide (>7 MT) | Reduction in Numbers from Previous Decade | Average Annual Amount of Oil Spilled by Tankers (MT) | Reduction in Spill Amount from Previous Decade |
|---|---|---|---|---|
| 1970s | 76.8 | — | 319,500 | — |
| 1980s | 45.4 | 41% | 117,500 | 63% |
| 1990s | 35.8 | 32% | 113,400 | 4% |
| 2000s | 18.1 | 49% | 19,600 | 83% |
| 2010s | 6.3 | 65% | 16,400 | 16% |
SOURCE: Based on ITOPF (2021).
frame. Nearly 62% of the spills involved less than 10 bbl. Only 2% involved 1,000 bbl or more.
This reduction in tank vessel spillage mirrors the international trend. The International Tanker Owners Pollution Federation (ITOPF) reported that the numbers and total volumes of worldwide tanker spills has decreased significantly over five decades, as shown in Table 3.10. These data only include tanker spills of 7 tonnes (MT) (about 50 bbl) or more. Overall, there has been a nearly 92% reduction in tanker spill numbers since the 1970s, and an 82% reduction since the Oil in the Sea III time frame of the 1990s. There has been a 95% reduction in the amount of spillage since the 1970s, and an 86% reduction since the 1990s. Tanker spillage worldwide decreased even with an increase in the amount of oil transported by tanker.
Likewise, in the United States, oil spillage by tank vessels in relation to the amount of oil transported in U.S. waters had been decreasing since the late 1970s, as shown in Table 3.11. (Note that a comparison between the current data and previous time periods on the basis of ton-miles is not possible, as ton-mile data are no longer available from the U.S. Army Corps of Engineers.) A separate analysis comparing oil spillage per tonnage of oil transported for the Oil in the Sea III and Oil in the Sea IV time frames is shown in Table 3.12. There has been a 97% reduction in the amount of oil spilled from tank vessels in U.S. waters since the Oil in the Sea III time frame.
TABLE 3.11 Average Annual Tank Vessel Spillage in Relation to Ton-Miles Transported in U.S. Waters
| Time Frame | Average Annual Spillage (MT) | Average Spillage per Billion Ton-Miles Oil Transport | Reduction from Previous Decade |
|---|---|---|---|
| 1978–1987 | 16,177 | 27.4 | — |
| 1988–1997 | 9,297 | 18.22 | 34% |
| 1998–2007 | 1,290 | 5.28 | 71% |
SOURCE: Based on Etkin (2010).
TABLE 3.12 Average Annual Tank Vessel Spillage in Relation to Oil Transported in U.S. Waters
| Time Frame | Average Annual Spillage (MT) | Average Oil Transport/Year (Million MT) | Average Spillage per Million MT Oil Transport |
|---|---|---|---|
| Oil in the Sea III (1990–1999) |
3,861.00 | 313.1 | 12.331 |
| Oil in the Sea IV (2010–2019) |
188.2 | 497.1 | 0.379 |
The significant reduction in oil tanker spillage that has occurred over the past few decades can be attributed to a number of factors:
- Overall increase in accident prevention measures, inspection and maintenance processes, and safety programs, sometimes called “Standard of Care,” by the oil industry in light of significant costs and damages related to major tanker spills, especially the 1989 Exxon Valdez tanker spill, and, in the United States, the Oil Pollution Act of 1990’s more stringent requirements for spill liability (Homan and Steiner, 2008). Ships (300 GT or more) transporting oil and operating in the U.S. waters are required to have the Certificate of Financial Responsibility to ensure that the owner/operator of the vessel has the financial means to meet the requirements of the law.
- Reduction in the number of major impact accidents (groundings, collisions, and allisions) due to increased implementation of measures such as improvements and establishment of vessel traffic systems, which employ Automatic Identification System (AIS) and Geographic Information System (GIS) mapping capabilities, traffic separation schemes, compulsory pilotage, and escort tugs in busy ports (see Table 3.13);
- Improvements in safety measures taken during oil transfer and lightering procedures (Etkin, 2006);
- Certificates of Financial Responsibility, improved inspections and audits, and other measures to assure the quality of tankers entering U.S. waters (Etkin and Neel, 2001; Homan and Steiner, 2008);
- Internationally, the IMO adopted the International Convention on Oil Spill Preparedness, Response and Cooperation (OPRC) in 1990, providing a global framework to facilitate international cooperation and mutual assistance in preparing for and responding to major oil pollution incidents. The convention entered into force in 1995. Ships are required to carry a shipboard emergency plan (SOPEP), and they are required to report pollution incidents to coastal authorities (Article 3 of OPRC and MARPOL Annex I Reg. 19); and
- Requirements for the phase-out of single-hulled tankers by 2015.
TABLE 3.13 Effectiveness of Accident Mitigation Measures for Tankers
| Mitigation Measure | Estimated Effectiveness | Data Source |
|---|---|---|
| Traffic Separation Scheme in Ports | 60% reduction in collisions | DNV, 1999 |
| Vessel Traffic Service (VTS) | 84% reduction in collisions | DNV, 1999 |
| Compulsory Pilotage | 75% reduction in collisions | NRC, 1994; Young 1994, 1995 |
| Compulsory Pilotage with VTS | 88% reduction in collisions | NRC, 1994; Young 1994, 1995 |
| Tug Escorts | varies | Gray et al., 2005 |
Beyond the regulatory changes, the tanker industry has initiated a number of programs that have contributed to safer oil transportation.
- ITOPF, a not-for-profit membership organization, provides services in the areas of spill response, claims analysis and damage assessment, contingency planning, training and information. Members of ITOPF are tanker owners through their P&I Clubs and other oil pollution insurers who pay the ITOPF annual dues on behalf of the members.
- The Oil Companies International Maritime Forum (OCIMF) focuses on promoting best practices in the tanker industry (ocimf.org). In 1993 OCIMF launched the Ship Inspection Report Program (SIRE) to address concerns about substandard ships. The SIRE database stores inspection reports for ships inspected in accordance with the SIRE inspection protocol. The information is used by charterers, ship and terminal operators, and government bodies to assess the quality of tankers. Oil company vetting of tankers based on the SIRE protocol has become a prerequisite for tanker eligibility in worldwide chartering.
- INTERTANKO, an industry body representing the tanker industry, promotes safe, environmentally sound, and efficient seaborne transportation of oil, gas, and chemical products. The organization’s main focus areas are (1) safety and technical, (2) human element, (3) environment, (4) quality operations, and (5) commercial sustainability.25 The organization has a nongovernmental organization status in the IMO and it provides input regarding regulatory development.
Papanikolau and Eliopoulou (2008) analyzed tanker accidents for tankers larger than 60,000 deadweight tonnage (see Figure 3.12). The analysis shows a significant decrease in large tanker accidents in the post-1990 period and credits the reduction to the introduction of a series of regulatory
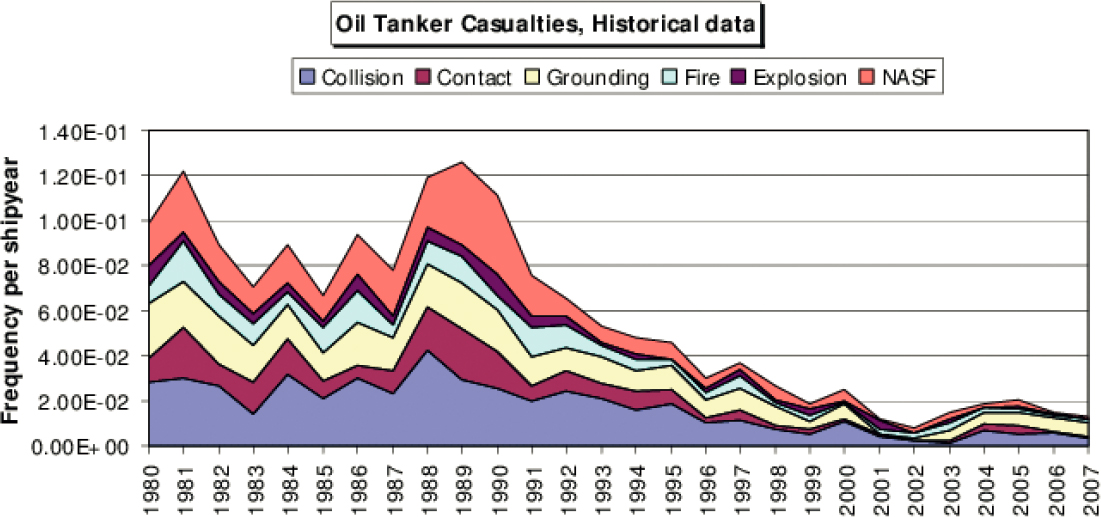
NOTE: Casualties include accidents in the following categories: (1) collisions of two vessels, (2) contacts of a vessel with a floating or a fixed object, (3) groundings of a vessel touching the sea bottom or shore, (4) fires as the first initiative event, (5) explosions as the first initiative event, and (6) non-accidental structural failures (NASFs) where hull cracks or fractures affect the ship’s structural integrity and seaworthiness.
SOURCE: Papanikolaou and Elipoulou, 2008.
___________________
25 See intertanko.com.
measures, changes in ship design, and overall improvement of the safety culture of the maritime industry.
Effectiveness of Double Hulls for Mitigating Vessel Spills
The significant decrease in tanker oil spills has been observed worldwide since the 1970s (ITOPF, 2021), largely attributed to the reduction in tanker spills to double hulls. While double hulls have played an important role in reducing tanker oil spills, they are not the only mitigation factor at play. Reductions in tanker spills were seen even before widespread implementation of double hulls. Overall changes in the standard of care taken by the tanker industry—as well as the effects of the large costs of oil spills, especially in the United States with the enactment of the Oil Pollution Act of 1990 (OPA 90), which set high liability limits for response and natural resource damages—also had an effect.
Double hulls on tankers were required by a 1992 amendment to MARPOL that was further amended in 2001 to accelerate the phase-in schedule so that all tankers of 5,000 deadweight tonnes and above would be outfitted no later than 2015. This requirement has had a significant effect on reducing the very large tanker spills due to groundings, collisions, and allisions. Having a double hull on the cargo tanks of a tank vessel reduces the likelihood that there will be an outflow of oil in the event of impact. Impact accidents have caused about 50% of all tanker spills over the past 50 years, and they have been implicated in 62% of the largest incidents (ITOPF, 2021). Double hulls help to reduce the likelihood of spillage (Yip et al., 2011b). The probability of having no outflow of oil in the event of an accident with a double-hull tanker was calculated to be 16% to 25% of the probability of no outflow with a single-hull tanker (Michel et al., 1996). Several NRC studies have evaluated the effectiveness of the double-hull design (NRC, 1991, 1998, 2001) and concluded that although no design is superior in all conditions the advantage of the double-hull design has been demonstrated (NRC, 2001).
Double hulls on tankers have no effect on the likelihood of spills caused by engine fires, bunkering or cargo transfer errors, mechanical defects, or operational mishaps. However, these types of spills tend to have lower volumes of release.
While the regulations addressed prevention of and preparedness for oil spills from tankers, a concern about fuel tank spills emerged as cargo vessels became larger and bunker fuel quantities grew. To mitigate the risk, a new IMO regulation entered into force in 2007 to require double hulls for fuel tanks in new ships with large oil-fuel capacity (MARPOL Annex I Reg. 12A).
Double hulls on bunker tanks reduce, but do not eliminate, the likelihood of an oil spill in the event of an impact-related accident. However, they have no effect on reducing the amount of oil released in the event of a breach of both hulls.
The degree to which double hulls on either cargo or bunker tanks are effective in preventing the breach of both hulls to release oil in a specific accident case depends on a number of factors including:
- The speed of the vessel(s) at the time of contact;
- The weight of the vessel(s), which determines the forces involved;
- The angle and relative height of the point of contact; and
- The condition of the vessel(s).
Overall, double hulls on tankers are about 90% effective in reducing oil spill incidence in groundings and 75% in collisions (Keith, 1993). Statistical and modeling studies conducted on the effectiveness of double hulls in reducing oil spillage have shown that for a double-hull tanker, the probability of an oil spill in an impact-related accident is still about 0.15 (i.e., a 15% chance of a spill with each accident). The likelihood of a tanker spill in which at least half of the oil in the cargo tanks is released is about 1 in 67,000 per accident (based on NRC, 1998, 2001; Rawson et al., 1998; Etkin and Neel, 2001; Etkin and Michel, 2003; and Yip et al., 2011b).
For bunker tank spills, the likelihood of a spill is reduced by 60% with double hulls. The likelihood of the outflow of the entire bunker fuel capacity is about 1 in 1,250 per accident (Michel and Winslow, 2000; Etkin and Michel, 2003; Herbert Engineering and Designers & Planners Inc., 2003; Barone et al., 2007). Unlike double hulls for cargo tanks, double-hull bunker tanks are not yet universal. In 2020, about 50% of the world’s vessel bunker tanks are double-hulled.
Given the degree to which vessel tonnage and maneuverability may affect the likelihood of accidents and hull breaches, it is important to consider that the overall size of tankers and cargo ships, particularly container ships, is increasing.
The chances of a large tanker spill may be escalating despite the full implementation of double hulls and other prevention measures because of the increased capacity of tankers (Statistica, 2021), as well as the increasing size of other cargo vessels, especially container ships, that may collide with them in busy ports and shipping lanes. Larger vessels are less maneuverable and have a greater impact due to the force of their tonnage in the event of a collision.
While the probability of major tank vessel spills has been reduced significantly in the past 20 years, there is still a possibility that such a spill might occur. Accident prevention measures and oil outflow mitigation from double hulls do not entirely eliminate the risk of spills from tankers. Although not presently a concern in the North American waters, piracy and terrorist attacks on tankers in some areas of the world create dangerous situations for the crews and generate a risk of oil spills. As long as oil is transported by tankers and tank barges, there is a possibility of a major spill, and a continuing need to remain prepared and vigilant.
Prevention of Lightering and Oil Transfer Spills
Oil spills may occur during operations in which oil is transferred from one vessel to another or between a vessel and a facility through loading arms and hoses. Oil transfers routinely occur when:
- Oil is transferred or lightered from a larger tank vessel to a smaller one (e.g., when a portion of the oil cargo in a sea-going tanker is lightered to a smaller tanker or tank barge that will deliver the oil to a coastal or inland river facility;
- Oil is transferred from a tank vessel to a facility during offloading operations (e.g., a delivery of crude oil to a storage terminal or to a refinery);
- Oil is transferred from a facility to a tank vessel during loading operations (e.g., from a refinery to a product tanker that will deliver the refined product to another facility); and
- Oil is transferred during bunkering or fueling operations from a storage tank at a facility or between a bunkering barge and a vessel.
In the United States, spills occur less than about once in 2,500 transfer operations (a probability of 0.0004). With the implementation of strict standards to reduce spillage during transfer operations, the spillage rate may be reduced to about a 0.00026 probability of a spill during every transfer operation, or one spill every 3,850 transfer operations. Between 1985 and 2004, there was a 96% reduction in the number of transfer-related spills in the United States, but this rate could be reduced further (Etkin, 2006).
One of the approaches to mitigating spills from transfer operations is to pre-boom the vessel: that is to place an oil spill containment boom around the vessel so that any spilled oil is contained within the boomed area. With oil spill removal equipment (pumps and skimmers) on standby, a relatively high percentage of the oil may be removed from the water surface before it can spread. This does not prevent the spill as safety protocols, monitoring, and alarm systems employed during the operation do, but it may reduce the impacts of a spill. Pre-booming is only effective when the velocity of the current does not exceed about 0.7 knots. Higher currents will allow some of the oil to begin entraining (going under) the boom (Etkin et al., 2007).
The spills that occur during lightering and oil transfer operations are generally quite small. About 72% of the spills amount to less than one barrel (bbl); 90% are less than 10 bbl.
3.5.4.3 Non-Tank Vessel Spills
The category of “non-tank vessels” includes all the ships and boats that use oil only as fuel and for lubrication but excludes those that carry crude oil or refined petroleum products as cargo. Spills from tank vessels that carry oil as cargo are included under Transportation (see 3.4.2). In this study, the non-tank vessels are divided into two size subcategories: less than 100 gross tons and 100 GT and over. The larger category includes cargo ships, industrial vessels, passenger vessels, and larger fishing vessels. The smaller category includes smaller fishing boats, recreational boats, and miscellaneous smaller vessels.
Average annual spillage by geographic zone and subzone is shown in Table 3.14 in MT for the current Oil in the Sea IV analysis, which encompasses the years 2010–2019 and for Oil in the Sea III, which encompassed 1990–1999. Only spills of one barrel (bbl) (0.14 MT) or more are included in the analysis. The Oil in the Sea III analysis excluded vessels less than 100 GT. From 2010 to 2019, there was a total of 1,010 spills of at least one bbl—or about 100 spills per year, 32 from larger non-tank vessels and 68 from vessels of less than 100 GT. (Final estimates of volume of oil spilled, as shown in Table 3.14, are expressed in MT to be consistent with the Oil in the Sea III results.)
Considering only spills from non-tank vessels of 100 GT and over, there was a 70% reduction in spill volume for the time period 2010–2019 compared with the 1990–1999 time period covered in the Oil in the Sea III study. That study did not include analyses of smaller vessels, which were found in the current study to contribute about as much oil pollution as larger vessels. It is reasonable to assume that there were likely to have been similar contributions to the overall non-tank vessel pollution from smaller vessels 20 years ago.
Another notable trend for non-tank vessels is a shift from offshore oil spillage to a greater proportion of spillage occurring in coastal and nearshore waters. Nearly 66% of the spillage during 2010–2019 occurred in coastal and nearshore waters compared to 45% during 1990–1999.
Spill volumes from non-tank vessels tended to be low during the past decade, as was the case in previous time periods. For larger (≥ 100 GT) non-tank vessels, 67% of the spills were of less than 10 bbl. (Note that spills of less than one bbl were not counted in this analysis.) Only 0.6% of the spills were of 1,000 bbl or more.
The reduction in spillage from non-tank vessels may reflect the overall increase in diligence of vessel operators to reduce spills and measures to reduce accidents, particularly for larger cargo ships, through vessel traffic services and AIS in busy ports.
Although the volumes of oil contained in cargo ships are generally smaller than the volumes of cargo oil carried by large tankers, spills from these vessels can cause significant damage. In 2007, the container ship Cosco Busan allided with a support tower on a bridge in San Francisco Bay, California, spilling 1,262 bbl (180 MT) of heavy fuel oil into the bay. In an allision, the moving vessel strikes a stationary
TABLE 3.14 Estimated Annual Spillage from Non-Tank Vesselsa
| Geographic Zone | Average Annual Spillage 2010–2019 (MT/year)b | Oil in the Sea III Estimate for 1990–1999 for Non-Tank Vessels > 100 GTc (MT/year)d | ||
|---|---|---|---|---|
| Subzone | Non-Tank Vessels <100 GT | Non-Tank Vessels ≥100 GT | ||
| A: NW Canada | Coastal | 0 | 0 | NA |
| A: NW Canada | Offshore | 0 | 0 | NA |
| B: N Canada | Coastal | 0 | 0 | NA |
| B: N Canada | Offshore | 0 | 0 | Trace |
| C: E Canada | Coastal | 0.4* | 0 | Trace |
| C: E Canada | Offshore | 0.7* | 0 | Trace |
| D: N Atlantic | Coastal | 10.2 | 6.7* | 88 |
| D: N Atlantic | Offshore | 1.3* | 2.4* | Trace |
| E: Mid-Atlantic | Coastal | 5.5* | 8.5* | 22 |
| E: Mid-Atlantic | Offshore | 0.8* | 0.3* | 40 |
| F: E GOM | Coastal | 2.1* | 12.7 | 30 |
| F: E GOM | Offshore | 0.3* | 1.2* | 70 |
| G: W GOM | Coastal | 21.3 | 28.4 | 100 |
| G: W GOM | Offshore | 24.9 | 18.3 | 120 |
| H: Mexican GOM | Coastal | 0 | 0 | Trace |
| H: Mexican GOM | Offshore | 0 | 0 | Trace |
| I: Puerto Rico | Coastal | 0.5* | 0.8* | Trace |
| I: Puerto Rico | Offshore | 0.1* | 0.2* | 10 |
| J: Mexico Pacific | Coastal | 0 | 0 | ND |
| J: Mexico Pacific | Offshore | 0 | 0 | Trace |
| K: CA Pacific | Coastal | 3.7* | 1.3* | 28 |
| K: CA Pacific | Offshore | 0.5* | 0 | Trace |
| L: Mid-Pacific | Coastal | 2.1* | 0.1* | Trace |
| L: Mid-Pacific | Offshore | 0 | 0.1* | 16 |
| M: NW Pacific | Coastal | 6.8* | 5.9* | 35 |
| M: NW Pacific | Offshore | 0.8* | 0 | 13 |
| N: Hawaii | Coastal | 38.3 | 19 | 26 |
| N: Hawaii | Offshore | 2.6* | 0.1* | 87 |
| O: Pacific Canada | Coastal | 24.9 | 21.4 | Trace |
| O: Pacific Canada | Offshore | 10 | 0 | 52 |
| P: South Alaska | Coastal | 6.4* | 9.9* | 70 |
| P: South Alaska | Offshore | 0.2* | 4.4* | 30 |
| Q: North Alaska | Coastal | 0 | 4.6* | Trace |
| Q: North Alaska | Offshore | 0 | 35.1 | 50 |
| Total | Coastal | 122.1 | 119.3 | 399 |
| Total | Offshore | 42.1 | 62.2 | 488 |
| Grand Total | 164.2 | 181.6 | 887 | |
a Current estimates are based on data analyses conducted by Environmental Research Consulting and Greene Economics on the U.S. Coast Guard Marine Information for Safety and Law Enforcement (MISLE) database for U.S. zones, and on the Marine Safety Information System (MARSIS) data for Canadian zones. No data were publicly available for Mexican zones.
b Estimates that would have been classified as “trace” in the Oil in the Sea III study (less than 10 MT) are shown with an asterisk.
c Gross tons (GT).
d “Trace” indicates that estimated input is less than 10 MT or 70 bbl/year.
NOTE: NA = not applicable; ND = not determined.
object, such as the bridge tower. In a collision, the moving vessel strikes another moving vessel. (This incident is not included in the data analysis for Oil in the Sea IV because it occurred prior to the 2010–2019 time frame selected as representative of the current situation.)
The volumes of bunker fuel carried by large cargo ships can be considerable. For example, the container ship Benjamin Franklin that visits the Port of Seattle, with a capacity of 18,000 20-foot equivalent units (TEUs), contains more than 107,000 bbl of bunker fuel.26 This volume is nearly half the amount of oil spilled from the tanker Exxon Valdez in Prince William Sound in 1989. The potential for a major spill of fuel oil from a large cargo ship continues to be a concern.
One significant improvement since the Oil in the Sea III time period is the introduction of double hulls on
___________________
26 See https://response.restoration.noaa.gov/about/media/how-much-oil-ship.html.
TABLE 3.15 Cargo Ship Oil Spillage per Dry Cargo Shipments in U.S. Waters
| Years | Dry Cargo Shipment (million short tons) | Annual MT Oil Spilled | MT Oil Spilled per Million Short Tons Shippeda | Source |
|---|---|---|---|---|
| 1978–1987 | 1,057 | 969 | 0.9 | Etkin, 2010 |
| 1988–1997 | 1,256 | 402 | 0.32 | Etkin, 2010 |
| 1998–2007 | 1,382 | 229 | 0.16 | Etkin, 2010 |
| 2010–2019 | 2,340 | 160 | 0.07 | Current Oil in the Sea IV data |
a Shipment data from U.S. Army Corps of Engineers.
bunker tanks. Similar to double hulls on cargo tanks as present on tank vessels, double hulls on bunker tanks reduce the likelihood of an oil release in the event of an impact accident—a collision, grounding, or allision (such as occurred with the Cosco Busan). With the inclusion of a double hull on bunker tanks, the probability of a release of oil due to an impact accident decreases by 60% from 0.05 per accident to 0.02 per accident (Michel and Winslow, 1999, 2000; Etkin and Michel, 2003; Herbert Engineering and Designers & Planners Inc., 2003; Barone et al., 2007). Double hulls on bunker tanks do not provide any additional protection against other types of incidents, such as operational or bunker fuel transfer errors. Currently, approximately 50% of cargo ships have double-hull bunker tanks.
The trend in the reduction of oil spillage from non-tank vessels in U.S. waters was noted even prior to the time period of Oil in the Sea III. Even with a 30% increase in dry cargo shipments, there was a 76% reduction in bunker spills from cargo ships: that is, an 82% reduction in the oil spilled per cargo shipped between the decades of 1978–1987 and 1998–2007, and a 50% reduction between 1987–1997 and 1998–2007 (Etkin, 2010). The rate of spillage in U.S. waters during 2010–2019 showed an even greater reduction, 92% since 1978–1987 and 56% since 1998–2007 (see Table 3.15).
3.5.4.4 Transportation by Rail
Although rail tank cars have been used to transport fuel and petrochemicals for many years in most parts of the world with extensive freight railroad systems, the use of trains to transport large quantities of crude oil is a relatively new phenomenon in the past decade and one that is, at least currently, limited to the United States and Canada. In both the United States and Canada, rapidly increasing inland shale oil production in the early 2010s exceeded the capacity and availability of pipelines for transport to refineries and terminals. Key trains and unit trains of 20 to 120 tank cars carrying crude oil were utilized as “moving pipelines” of “crude-by-rail.” Movement by rail made it easier to change routes utilizing existing rail lines and oil could be efficiently loaded at production facilities and unloaded at refineries and terminals.
In 2005, about 17 tank cars of oil per day (each one holding about 714 bbl) were moving on U.S. railroads. By 2015, more than 1,400 tank cars per day were on the railroads. After a peak in about 2017, crude-by-rail movements began to decrease. In 2019 and 2020, there was some increase in crude-by rail traffic (see Figure 3.13). In some cases during the past decade, there have been temporary switches to the use of rail when there have been pipeline or refinery closures. For example, during Hurricane Harvey in 2017, when Texas refineries were temporarily
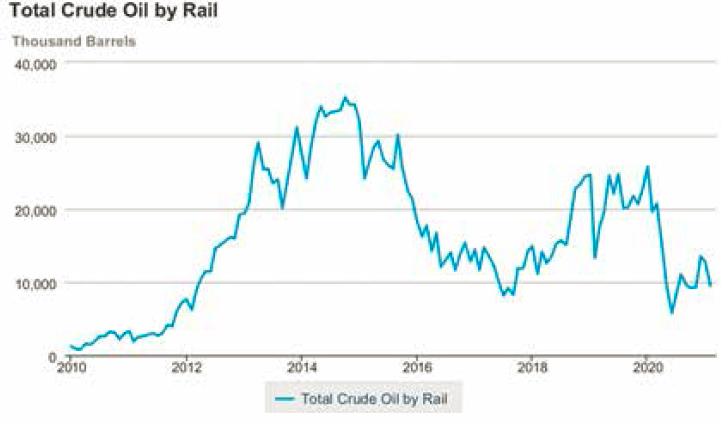
SOURCE: EIA (2021b).
TABLE 3.16 Estimated Annual Spillage from Coastal Oil Storage Facilitiesa
| Geographic Zone | Subzone | Average Annual Spillage from Coastal Oil Storage Facilities 2010–2019 (MT/year)b | Average Annual Spillage from Coastal Oil Storage Facilities Oil in the Sea III Estimate for 1990–1999 (MT/year)c |
|---|---|---|---|
| C: E Canada | Coastal | 0 | Trace |
| D: N Atlantic | Coastal | 14.6 | 500 |
| E: Mid-Atlantic | Coastal | 0.2* | 79 |
| F: E GOM | Coastal | 174.3 | 10 |
| G: W GOM | Coastal | 14.3 | 740 |
| I: Puerto Rico | Coastal | 0 | 130 |
| J: Mexico Pacific | Coastal | ND | Trace |
| K: CA Pacific | Coastal | 7.4* | 62 |
| L: Mid-Pacific | Coastal | 0 | 26 |
| L: Mid-Pacific | Offshore | 0 | 12 |
| M: NW Pacific | Coastal | 0.3* | 10 |
| N: Hawaii | Coastal | 0.1* | 31 |
| P: South Alaska | Coastal | 16.5 | 30 |
| Q: North Alaska | Coastal | 0 | 10 |
| Total | Coastal | 216.4 | 1,697.00 |
| Total | Offshore | 0 | 12 |
| Grand Total | 216.4 | 1,709.00 |
a Current estimates are based on data analyses conducted by Environmental Research Consulting and Greene Economics on the U.S. Coast Guard Marine Information for Safety and Law Enforcement (MISLE) database for U.S. zones, and on the Marine Safety Information System (MARSIS) data for Canadian zones. No data were publicly available for Mexican zones.
b Estimates that would have been classified as “trace” in the Oil in the Sea III study are shown with an asterisk.
c “Trace” indicates that estimated input is less than 10 MT or 70 bbl/year.
NOTE: NA = not applicable; ND = not determined.
shut down, increased operations at Northeast U.S. refineries required eight trainloads of oil to be brought to Philadelphia via a route that went along the Hudson River in New York.
The greatest concern about the crude-by-rail trains was the possibility of an accident that could cause an explosion, such as occurred in 2013 in Lac-Megantic, Quebec, where there were 47 fatalities. There were a number of other accidents in the United States and Canada, which created a significant public outcry and spurred changes in regulations to increase safety (Etkin et al., 2015; Etkin, 2017b).
With respect to the current Oil in the Sea IV study, there are no reports of spillage to marine and estuarine waters that should be considered in estimating rail transportation-related oil inputs. However, there is the possibility of future spills that may affect these waters.
3.5.4.5 Coastal Storage Facilities
Coastal storage facilities included under the Transportation category of the Oil in the Sea III and Oil in the Sea IV studies include large oil terminals at which oil transported by tank vessel or pipeline is loaded and offloaded and stored. These facilities do not include smaller consumer-oriented fuel storage facilities (local home heating oil storage or marinas) or facilities involved in the consumption of oil (e.g., power plants and manufacturing facilities).
Estimates of oil inputs from this source are summarized in Table 3.16. For the 2010–2019 time frame, 56 MT (395 bbl) of spillage occurred annually. This represents an 87% reduction in spillage since the 1990s and Oil in the Sea III.
With the storage of large quantities of oil at coastal terminals (individual storage tanks may contain as much as 300,000 bbl of oil), there is a possibility of a significant facility spill in the future. Spills that occur from storage tanks at coastal terminals will usually be contained within required secondary containment. However, there are circumstances when this containment, which is designed to hold more than the volume of the tanks, may be breached, causing some or all of the spilled oil to enter a waterway. This may occur during heavy flooding conditions and during hurricanes or other storms. There is also the possibility that flood waters may swamp the containment area, in which case secondary containment is generally ineffective and oil may enter marine waters.
In the United States, Hurricanes Katrina and Rita in 2005 caused significant damage to coastal terminals in Louisiana and Texas and the release of nearly 132,000 bbl (19,000 MT) of oil. One 12,000-bbl tank was lifted and moved 3 miles in a Texas marsh by the tidal surge during Hurricane Rita (USCG, 2006).
In 2017, Hurricane Harvey caused damage to more than two dozen aboveground storage tanks in Texas, spilling more than 24,000 bbl of oil and chemicals. The largest spillage came from two storage tanks that released 12,000 bbl (1,714 MT) of gasoline. This event, in addition to the incidents that occurred during Hurricanes Katrina and Rita, clearly exposed the vulnerability of aboveground storage tanks to damage from severe storms and flooding (Bernier et al., 2017).
With the potential for increasing intensity and frequency of hurricanes due to climate change and sea level rise (Webster et al., 2005; Elsner et al., 2008; Bender et al., 2010; Knutson et al., 2010; Kang and Elsner, 2015), the risk for major spills from coastal terminals may be increasing.
3.5.4.6 Coastal Refineries
Average annual spillage by geographic zone and subzone for refineries is shown in Table 3.17 in MT for the current Oil in the Sea IV analysis, which encompasses the years 2010–2019. Oil in the Sea III did not include coastal refineries as a separate category. Only spills of one barrel or more are included in the analysis. The average annual amount spilled from coastal refineries was less than 11 MT (75 bbl). However, because refineries often contain aboveground storage tanks, they may be subject to similar damage during earthquakes, hurricanes, and flooding.
TABLE 3.17 Estimated Annual Spillage from Coastal Refineriesa
| Geographic Zone | Subzone | Average Annual Spillage from Coastal Refineries 2010–2019 (MT/year)b | Oil in the Sea III Estimate for 1990–1999 (MT/year)c |
|---|---|---|---|
| D: N Atlantic | Coastal | 0.3* | ND |
| F: E GOM | Coastal | 0.1* | ND |
| G: W GOM | Coastal | 10.4 | ND |
| Total | Coastal | 10.7 | ND |
| Total | Offshore | 0 | ND |
| Grand Total | 10.7 | ND |
a Current estimates are based on data analyses conducted by Environmental Research Consulting and Greene Economics on the U.S. Coast Guard Marine Information for Safety and Law Enforcement (MISLE) database for U.S. zones, and on the Marine Safety Information System (MARSIS) data for Canadian zones. No data were publicly available for Mexican zones.
b Estimates that would have been classified as “trace” in the Oil in the Sea III study (less than 10 MT) are shown with an asterisk.
c “Trace” indicates that estimated input is less than 10 MT or 70 bbl/year.
NOTE: NA = not applicable; ND = not determined.
Combined Spillage from Transportation of Oil
Oil spillage from transportation-related sources has been reduced significantly in the past 20 years (see Figure 3.14 and Table 3.18). The greatest reduction has been in tank vessel spills. Notably, tank vessel spillage was about one-half of the spillage from coastal and offshore pipelines. A summary of transportation inputs by geographic zone and subzone is shown in Table 3.19.
3.5.5 Potentially Polluting Sunken Wrecks
The 2003 Oil in the Sea III study (NRC, 2003) mentioned a few historic shipwrecks still containing oil as ongoing and potential future sources of pollution, but did not provide details regarding their location or the quantity of oil that could be released. The study briefly mentioned the particular risk of chronic or potentially significant oil releases from the thousands of World War II-era wrecks of tankers (see Box 3.5), merchant ships, and military vessels due to their large oil contents and 60 years of corrosion at the time of the study. The study cited the example of the USS Mississinewa, an oil tanker sunk in 1944 in Ulithi Lagoon, Caroline Islands, as leaking heavy fuel oil after a storm in 2001 (Gilbert, 2001; Gilbert et al., 2003).
In the two decades since Oil in the Sea III, there has been significant progress in documenting the larger wrecks and in developing programs for conducting risk assessments for future oil pollution potential. At the 2005 International Oil Spill Conference, an issue paper and panel discussion of experts estimated that worldwide there are about 8,600 wrecks of tankers and other large vessels (at least 400 gross tons) that in total may still contain as much as 2.5 to 20.4 million tonnes (17.5 million to 143 million bbl) of oil. Three-quarters of the identified large wrecks are World War II–related (Michel et al., 2005), making them about 80 years old at present.
There have also been non-war wrecks that have caused environmental damage through leakage, notably the S.S. Jacob Luckenbach that sank off central California in 1953 (see Box 3.6). After this wreck was reported to be causing continuing oiling of beaches and birds, an oil removal operation was conducted (Hampton et al., 2003; Moffat
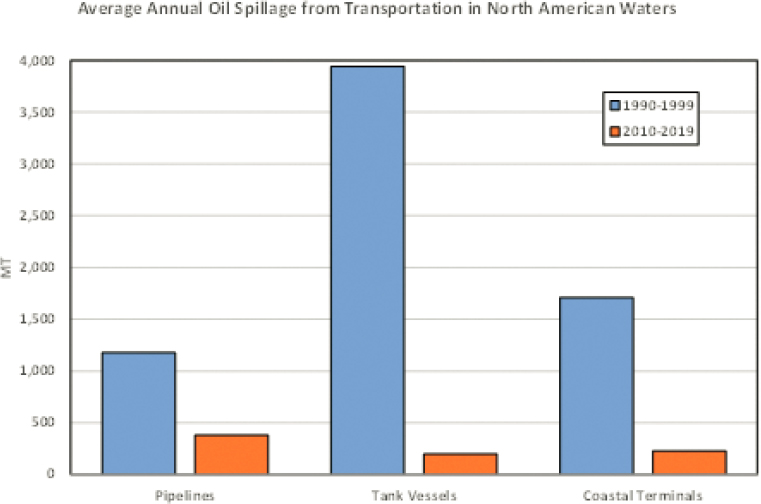
TABLE 3.18 Comparison of Oil in the Sea III and Oil in the Sea IV for Oil Transportation Spillage
| Source | Oil in the Sea IV (2010–2019) | Oil in the Sea III (1990–1999) | Reduction Between Oil in the Sea III and Oil in the Sea IV | ||
|---|---|---|---|---|---|
| Annual Spillage (MT) | % Total | Annual Spillage (MT) | % Total | ||
| Pipelines | 380 | 47.20% | 1,175 | 17.20% | 67.60% |
| Tank Vessels | 199 | 24.60% | 3,941 | 57.70% | 95.00% |
| Coastal Terminals | 227 | 28.20% | 1,709 | 25.00% | 86.70% |
| Total | 806 | 100.00% | 6,825 | 100.00% | 88.20% |
TABLE 3.19 Estimated Annual Spillage from Oil Transportationa
| Geographic Zone | Subzone | Average Annual Spillage for 2010–2019 (MT/year)b | Oil in the Sea III Estimate for 1990–1999 (MT/year)c | ||||||||
|---|---|---|---|---|---|---|---|---|---|---|---|
| Pipelines | Tank Vessels | Coastal Terminals | Refineries | Total | Pipelines | Tank Vessels | Coastal Terminals | Refineries | Totald | ||
| A: NW Canada | Coastal | 0 | 0 | 0 | 0 | 0 | NA | NA | NA | ND | 0 |
| A: NW Canada | Offshore | 0 | 0 | 0 | 0 | 0 | NA | NA | NA | ND | 0 |
| B: N Canada | Coastal | 0 | 0 | 0 | 0 | 0 | NA | NA | NA | ND | 0 |
| B: N Canada | Offshore | 0 | 0 | 0 | 0 | 0 | NA | NA | NA | ND | 0 |
| C: E Canada | Coastal | 0 | 0.2* | 0 | 0 | 0.2* | 0 | 0 | Trace | ND | 0 |
| C: E Canada | Offshore | 0 | 0 | 0 | 0 | 0 | NA | NA | 0 | ND | 0 |
| D: N Atlantic | Coastal | 24 | 9.5* | 14.6 | 0.3* | 48.4 | 150 | 740 | 500 | ND | 1,390.00 |
| D: N Atlantic | Offshore | 0 | 0 | 0 | 0 | 0 | NA | 17 | 0 | ND | 17 |
| E: Mid-Atlantic | Coastal | 3.7* | 0.2* | 0.2* | 0 | 4.1* | 36 | 14 | 79 | ND | 129 |
| E: Mid-Atlantic | Offshore | 0 | 0 | 0 | 0 | 0 | NA | Trace | 0 | ND | 0 |
| F: E GOM | Coastal | 11.4 | 2.3* | 174.3 | 0.1 | 188.1 | Trace | 140 | 10 | ND | 150 |
| F: E GOM | Offshore | 0 | 0 | 0 | 0 | 0 | Trace | 10 | 0 | ND | 10 |
| G: W GOM | Coastal | 296.1 | 84.8 | 14.3 | 10.4 | 405.6 | 890 | 770 | 740 | ND | 2,400.00 |
| G: W GOM | Offshore | 2.1* | 91 | 0 | 0 | 93.1 | 60 | 1,500.00 | 0 | ND | 1,560.00 |
| H: Mexican GOM | Coastal | 0 | ND | ND | 0 | 0 | Trace | 80 | ND | ND | 80 |
| H: Mexican GOM | Offshore | 0 | ND | ND | 0 | 0 | ND | ND | 0 | ND | 0 |
| I: Puerto Rico | Coastal | 0 | 0 | 0 | 0 | 0 | Trace | Trace | 130 | ND | 130 |
| I: Puerto Rico | Offshore | 0 | 0 | 0 | 0 | 0 | NA | 490 | 0 | ND | 490 |
| J: Mexico Pacific | Coastal | 0 | ND | ND | 0 | 0 | ND | ND | Trace | ND | 0 |
| J: Mexico Pacific | Offshore | 0 | ND | ND | 0 | 0 | ND | Trace | 0 | ND | 0 |
| K: CA Pacific | Coastal | 42 | 0 | 7.4* | 0 | 49.4 | 39 | 150 | 62 | ND | 251 |
| K: CA Pacific | Offshore | 0 | 0 | 0 | 0 | 0 | Trace | 0 | 0 | ND | 0 |
| L: Mid-Pacific | Coastal | 0 | 0 | 0 | 0 | 0 | Trace | Trace | 26 | ND | 26 |
| L: Mid-Pacific | Offshore | 0 | 0 | 0 | 0 | 0 | 0 | Trace | 12 | ND | 12 |
| M: NW Pacific U.S. | Coastal | 0 | 0.2* | 0.3* | 0 | 0.5* | Trace | 10 | 10 | ND | 20 |
| M: NW Pacific U.S. | Offshore | 0 | 0 | 0 | 0 | 0 | 0 | 0 | 0 | ND | 0 |
| N: Hawaii | Coastal | 1.0* | 0 | 0.1* | 0 | 1.1* | Trace | Trace | 31 | ND | 31 |
| N: Hawaii | Offshore | 0 | 0 | 0 | 0 | 0 | 0 | Trace | 0 | ND | 0 |
| O: Pacific Canada | Coastal | 0 | 9.9* | 0 | 0 | 9.9* | 0 | 0 | 69 | ND | 69 |
| O: Pacific Canada | Offshore | 0 | 0 | 0 | 0 | 0 | 0 | 0 | 0 | ND | 0 |
| P: South Alaska | Coastal | 0 | 0.2* | 16.5 | 0 | 16.7 | Trace | 20 | 30 | ND | 50 |
| P: South Alaska | Offshore | 0 | 0 | 0 | 0 | 0 | NA | Trace | 0 | ND | 0 |
| Q: North Alaska | Coastal | 0 | 0 | 0 | 0 | 0 | NA | Trace | 10 | ND | 10 |
| Q: North Alaska | Offshore | 0 | 0 | 0 | 0 | 0 | NA | Trace | 0 | ND | 0 |
| Total | Coastal | 378.3 | 107.4 | 216.4 | 10.7 | 712.8 | 1,115.00 | 1,924.00 | 1,697.00 | ND | 4,736.00 |
| Total | Offshore | 2.1* | 91.1 | 0 | 0 | 93.2 | 60 | 2,017.00 | 12 | ND | 2,089.00 |
| Grand Total | 380.4 | 198.5 | 216.4 | 10.7 | 806 | 1,175.00 | 3,941.00 | 1,709.00 | ND | 6,825.00 | |
a Current estimates are based on data analyses conducted by Environmental Research Consulting and Greene Economics on the U.S. Coast Guard Marine Information for Safety and Law Enforcement (MISLE) database for U.S. zones, and on the Marine Safety Information System (MARSIS) data for Canadian zones. No data were publicly available for Mexican zones.
b Estimates that would have been classified as “trace” in the Oil in the Sea III study are shown with an asterisk.
c “Trace” indicates that estimated input is less than 10 MT or 70 bbl/year.
d Totals assume that “trace” values equal zero.
NOTE: NA = not applicable; ND = not determined.
et al., 2003; Luckenbach Trustee Council, 2006; Henkel et al., 2014). Another example is the wreck of the U.S. Army Transport ship Brigadier General M.G. Zalinski that grounded and sank in the Grenville Channel, British Columbia, in 1946. This wreck presented a continuing environmental threat until the remaining fuel oil was removed in 2014 (Elliott and DeVilbiss, 2014).
An important outcome of the 2005 study was the recognition that, in addition to the sheer magnitude of the wreck problem, there were many significant legal and financial obstacles to conducting proactive oil removal projects even for the most threatening wrecks. The financial and legal liability and responsibility of the vessel owners was a particular issue of concern, especially for the war-related wrecks. The need to evaluate the benefits of removing the oil from a wreck in relation to the intervention costs was identified (Girin, 2004).
In addition to the costs involved, and the potential lack of funding to conduct proactive oil removal operations, the logistical and safety challenges of wreck oil removal operations can be formidable (Findlay, 2003). However, in the past decade, salvage masters and crews have conducted increasingly complex operations on various wrecks. There are also a number of significant technological developments that have improved safety and efficiency of these operations, such as the use of remotely operated vehicles (ROVs), remote sensing, saturated diving systems, and hot-tapping (Elliott and DeVilbiss, 2014).
The application of systematic risk assessments to prioritize the wrecks with respect to the likelihood of leakage and degree of potential environmental impact is another significant development in recent years (Etkin, 2019). Advances in monitoring of sunken wrecks through remote sensing technologies, as well as models to simulate hypothetical releases (French-McCay et al., 2012) and models to determine more accurately the probability of discharges from particular vessels based on vessel architecture and condition, disturbance potential, and environmental factors (Landquist et al., 2013, 2014, 2017) have greatly improved the capabilities for desktop risk assessments.
The most comprehensive wreck risk assessment conducted to date is the NOAA Remediation of Underwater Legacy Environmental Threats (RULET) project (Symons et al., 2013). Ultimately, the study team identified 87 wrecks for more detailed analysis with respect to wreck condition and the potential for impacts to ecological and socioeconomic resources in the water column, on the water surface, and on the shoreline based on thresholds of concern for oiling (French-McCay, 2016). The overall analysis and prioritization of the wrecks with respect to risk provides the USCG with specific criteria that may be applied on a district basis to access the nation’s Oil Spill Liability Trust Fund (OSLTF) Emergency Fund for monitoring or removal operations. The OSLTF funds are derived from a tax on imported and domestic oil. These funds are available to finance spill response operations. Typically, an identified responsible party (spiller) would have to reimburse the OSLTF, but funds may also be used
if there is no identified responsible party, or the spiller is unable to pay. In the case of a potentially polluting wreck where there is no actual spill at the time, the USCG needs to establish that there is a “substantial and imminent threat” of an oil spill in order to be able to procure funds from the OSLTF to perform any monitoring, surveying, or oil removal operations.
For the current Oil in the Sea IV study, documented wrecks of tankers and larger non-tank vessels of 400 gross tons and larger in the Environmental Research Consulting databases (as used in the 2005 study) and the RULET study results for North America and the Caribbean were evaluated to estimate the potential volumes and types of oil present by geographic zone. Note that these wrecks generally only present a potential for leakage in the future, although some episodic releases are occurring presently as some wrecks are currently releasing oil on occasion. The analytical results are shown in Table 3.20 in MT, and in the map in Figure 3.16.
TABLE 3.20 Estimated Potential Oil Content in Sunken Wrecks by Geographic Zone
| Zonea | Subzone | Crude Oil (MT) | Heavy Oil (MT) | Light Oil (MT) | All Oils (MT) | ||||
|---|---|---|---|---|---|---|---|---|---|
| Max | Min | Max | Min | Max | Min | Max | Min | ||
| B: N Canada | Offshore | 0 | 0 | 535 | 54 | 0 | 0 | 535 | 54 |
| C: E Canada | Coastal | 0 | 0 | 1,453 | 145 | 0 | 0 | 1,453 | 145 |
| C: E Canada | Offshore | 19,491 | 1,949 | 138,105 | 13,811 | 64,936 | 6,494 | 222,533 | 22,253 |
| D: N Atlantic | Coastal | 0 | 0 | 0 | 0 | 1,714 | 171 | 1,714 | 171 |
| D: N Atlantic | Offshore | 11,134 | 1,113 | 46,140 | 4,614 | 59,165 | 5,916 | 116,438 | 11,644 |
| E: Mid-Atlantic | Coastal | 0 | 0 | 1,981 | 198 | 0 | 0 | 1,981 | 198 |
| E: Mid-Atlantic | Offshore | 82,783 | 8,278 | 81,590 | 8,159 | 39,498 | 3,950 | 203,871 | 20,387 |
| F: E GOM | Offshore | 12,857 | 1,286 | 11,706 | 1,171 | 714 | 71 | 25,278 | 2,528 |
| G: W GOM | Coastal | 0 | 0 | 27,450 | 2,745 | 0 | 0 | 27,450 | 2,745 |
| G: W GOM | Offshore | 33,999 | 3,400 | 57,566 | 5,757 | 9,947 | 995 | 101,512 | 10,151 |
| H: Mexican GOM | Offshore | 0 | 0 | 51,991 | 5,199 | 0 | 0 | 51,991 | 5,199 |
| I: Puerto Rico | Coastal | 0 | 0 | 7,032 | 703 | 0 | 0 | 7,032 | 703 |
| I: Puerto Rico | Offshore | 0 | 0 | 0 | 0 | 30,994 | 3,099 | 30,994 | 3,099 |
| J: Mexico Pacific | Coastal | 0 | 0 | 3,401 | 340 | 0 | 0 | 3,401 | 340 |
| K: CA Pacific | Coastal | 0 | 0 | 0 | 0 | 1,120 | 112 | 1,120 | 112 |
| L: Mid-Pacific | Coastal | 0 | 0 | 0 | 0 | 1,786 | 179 | 1,786 | 179 |
| L: Mid-Pacific | Offshore | 0 | 0 | 25,926 | 2,593 | 0 | 0 | 25,926 | 2,593 |
| M: NW Pacific | Coastal | 0 | 0 | 245 | 24 | 929 | 93 | 1,173 | 117 |
| M: NW Pacific | Offshore | 0 | 0 | 14,930 | 1,493 | 561 | 56 | 15,491 | 1,549 |
| N: Hawaii | Coastal | 0 | 0 | 0 | 0 | 3,286 | 329 | 3,286 | 329 |
| N: Hawaii | Offshore | 0 | 0 | 0 | 0 | 1,714 | 171 | 1,714 | 171 |
| O: Pacific Canada | Offshore | 0 | 0 | 3,852 | 385 | 1,036 | 104 | 4,888 | 489 |
| P: South Alaska | Coastal | 0 | 0 | 1,000 | 100 | 0 | 0 | 1,000 | 100 |
| P: South Alaska | Offshore | 0 | 0 | 1,722 | 172 | 0 | 0 | 1,722 | 172 |
| Total | Coastal | 0 | 0 | 42,562 | 4,256 | 8,835 | 883 | 51,397 | 5,140 |
| Total | Offshore | 160,263 | 16,026 | 434,063 | 43,406 | 208,566 | 20,857 | 802,892 | 80,289 |
| Grand Total | 160,263 | 16,026 | 476,625 | 47,662 | 217,401 | 21,740 | 854,289 | 85,429 | |
| Caribbean | Coastal | 16,438 | 1,644 | 43,489 | 4,349 | 2,708 | 271 | 62,634 | 6,263 |
| Caribbean | Offshore | 30,253 | 3,025 | 259,055 | 25,905 | 48,157 | 4,816 | 337,464 | 33,746 |
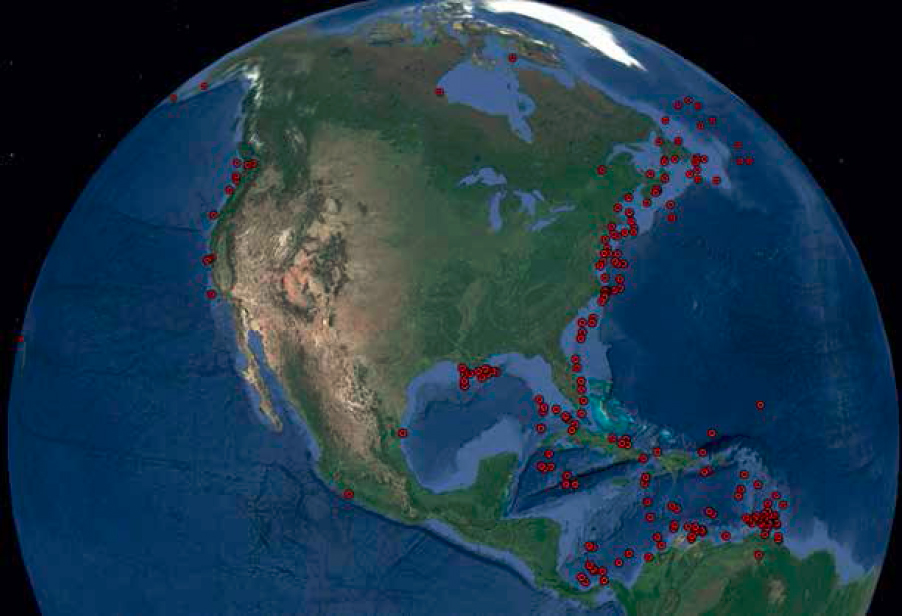
SOURCE: Courtesy of Environmental Research Consulting.
In North American waters, there are at least 236 large wrecks containing an estimated 600,000 to 6 million bbl (85,000 to 850,000 MT) of oil that may present a threat of pollution in the future. There are an additional 89 wrecks with 280,000 to 2.8 million bbl (40,000 to 400,000 MT) of oil that may threaten Caribbean waters. Oil pollution from these wrecks may come in the form of chronic smaller discharges similar to natural seeps. There is also the possibility of episodic discharges and even large release events when the vessel is disturbed by storms, landslides, tremors, anchors, or fish trawling nets, or when corrosion becomes extensive. Many of the World War II wrecks may contain particularly toxic fuel oils that were often used during that era (Faksness et al., 2015).
3.5.6 Projections of Future Oil Spillage
The estimates of oil spillage into marine and estuarine waters of North America from oil extraction, transportation, and consumption activities as estimated for Oil in the Sea IV (based on spill data for the years 2010–2019 to represent current spillage), were compared to historical data from Oil in the Sea III (1990s) in addition to future projections through 2050 (energy outlook based on data provided to the committee from Greene Economics—data sources are included as Appendix B).
The projections for oil spillage were based on the fundamental assumption that current spillage rates (i.e., amount spilled per amount extracted, transported, and consumed) would apply in the future. In other words, the rate of spillage would not be further decreased by prevention measures and source control beyond those measures that are currently in place. In reality, there may well be more spill prevention measures put into place over the next decades that are not currently anticipated or imagined. This approach also assumes that the spillage rates would not be increased due to negligence or decreases in the current practices that prevent accidents and associated spills. The projections also do not account for increases in spillage that could occur due to natural hazards, aging and changing infrastructure, changes in transportation routes, or other potential sources of oil in the sea. The oil spillage projections merely track the projections for oil extraction, transportation, and consumption in the future.
Three separate oil energy outlook scenarios were included in the analysis (Greene Economics, 2021):
- The Reference scenario is the business as usual (BAU) case based on the EIA Energy Outlook (2021), which assumes a continuation of energy usage trends (and petroleum usage as part of that usage).
- The Partial Decarbonization scenario is based on the Greene Economics (2021) report in which the forecasts for 2020–2050 by fuel type are the midpoint between the Reference scenario and the Net Zero 2050 scenario with the exception of the shipping data, which are based on previous estimates by an American Bureau of Shipping (2020) study.
- The Net Zero 2050 scenario is based on projections made for a decarbonized future by the International Energy Agency (2021).
Spillage rates were calculated separately for:
- Oil exploration and production (oil exploration and extraction activities in offshore and state marine waters);
- Oil transportation (tank vessels, pipelines, coastal storage facilities, and refineries); and
- Oil consumption (oil used as fuel in non-tank vessels and coastal facilities).
In addition, total spillage rates were calculated.
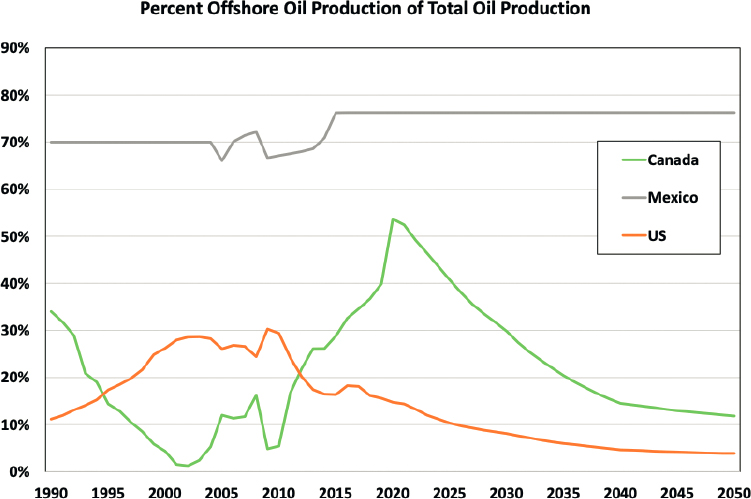
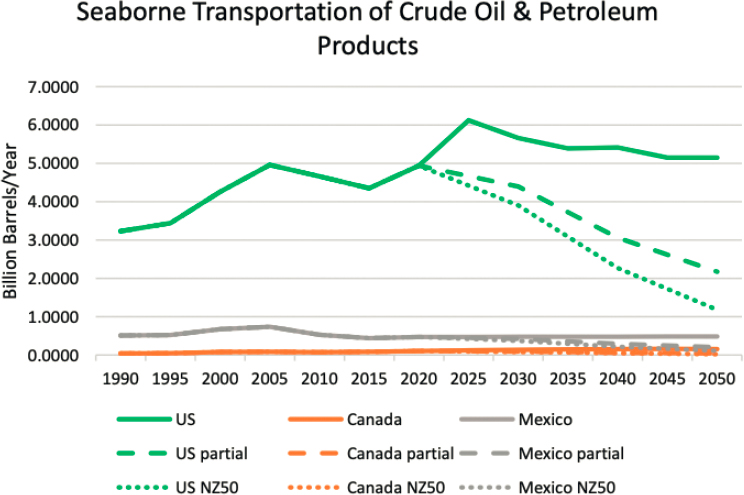
All annual data (MT/year) were based on averages of the decade shown (e.g., 2020s = 2020–2029). For the 2050s, the value was based on the estimate for the year 2050.
Because the Oil in the Sea IV study is limited to input to marine and estuarine waters and do not include spills to inland areas, only oil extracted from offshore and nearshore (state) waters was included as the denominator for spillage rates. The future oil production data presented in the Greene Economics report (2021) included all oil extraction activities, including for inland areas of the United States, Canada, and Mexico (see Figure 1.9). The relative percentage of offshore production out of total production for each nation was assumed to follow the same downward trajectory (i.e., a lower proportion of offshore production in the future) in the two decarbonization scenarios (Partial Decarbonization and Net Zero 2050) as for the Reference case (see Figure 3.17). Oil spillage from extraction does not include outlier well blowouts such as the DWH incident.
For oil transportation, seaborne transportation data were applied (see Figure 3.18). Although these data only directly address the transport of imported and exported oil by tank vessels, it was assumed that the same oil would also be stored in coastal facilities (terminals) and transported to refineries. Oil offloaded at offshore oil ports would be transported landward by pipeline.
The projected oil consumption data in the three future scenarios as presented in Greene Economics (2021) were global estimates. The relative proportion of oil consumed
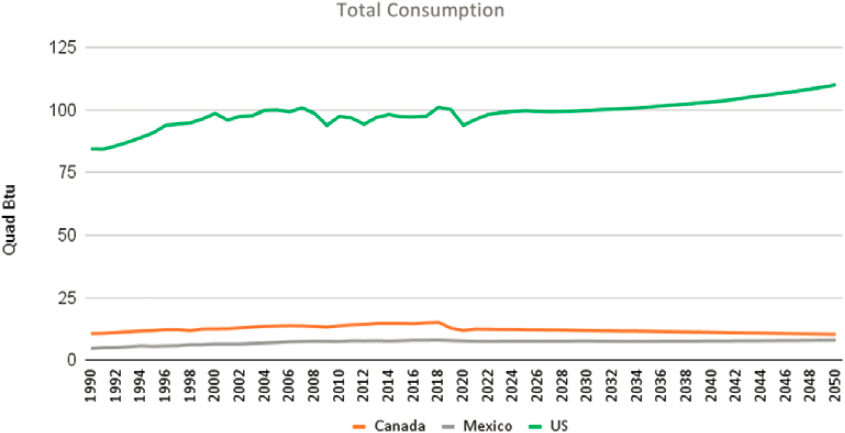
TABLE 3.21 Oil Extraction-Related Spilling (excluding outlier events)
| Energy Scenario | Time Period | Average Annual Input by Nation (MT/year) | |||
|---|---|---|---|---|---|
| USA | Canada | Mexico | Total | ||
| Historical Data | 1990s (OITS III) | 140 | 28 | 61 | 229 |
| 2010s (OITS IV) | 92.0 | 0.9 | 1,016.7 | 1,110 | |
| Reference Scenario | 2020s | 82.8 | 1.6 | 708.9 | 793 |
| 2030s | 51 | 1 | 863.9 | 9169 | |
| 2040s | 33.1 | 0.7 | 1,094.8 | 1,129 | |
| 2050s | 29.6 | 0.6 | 1,171.2 | 1,201 | |
| Partial Decarbonization Scenario | 2020s | 71.3 | 1.5 | 720.5 | 793 |
| 2030s | 32.2 | 0.6 | 577.2 | 610 | |
| 2040s | 15.2 | 0.3 | 405.1 | 421 | |
| 2050s | 11.5 | 0.2 | 333.9 | 346 | |
| Net Zero 2050 Scenario | 2020s | 66.9 | 1.4 | 542.5 | 611 |
| 2030s | 26.5 | 0.5 | 378.3 | 405 | |
| 2040s | 9.9 | 0.2 | 210.1 | 220 | |
| 2050s | 6.3 | 0.1 | 144.4 | 151 | |
by the three nations under the two decarbonization scenarios was assumed to be the same as for the reference scenario (see Figure 3.19).
For oil extraction-related spillage, the estimated historical and projected spillage amounts are shown in Table 3.21 and Figure 3.20. Note that these do not include outlier blowouts such as the DWH incident.
For oil transportation-related spillage, the estimated historical and projected spillage amounts are shown in Table 3.22 and Figure 3.21. Though the general trend in tanker spillage has been downward (ITOPF, 2021), a large tanker spill in the future could change the spillage volumes significantly. The chances of a large tanker spill may be escalating, despite the full implementation of double hulls and other prevention measures, because of the increased capacity of tankers (Statistica, 2021), as well as the increasing size of other cargo vessels, especially container ships, that may collide with them in busy ports and
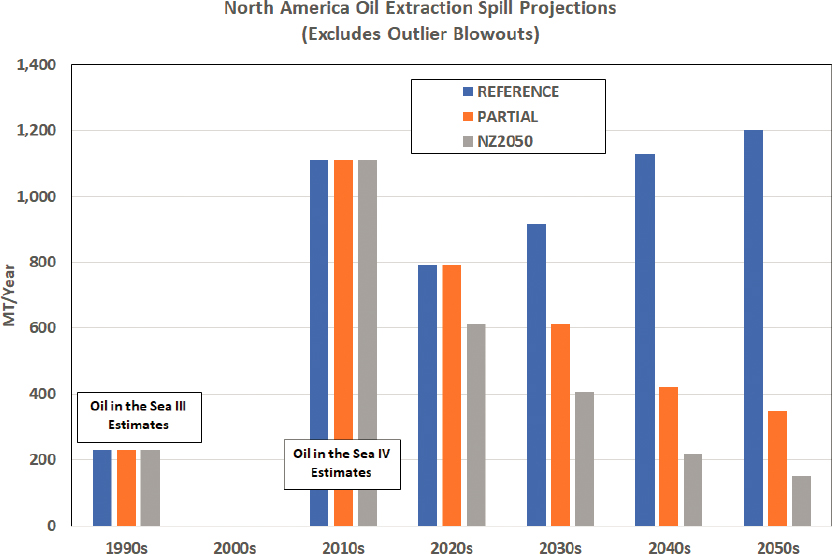
TABLE 3.22 Oil Transportation-Related Spillage
| Energy Scenario | Time Period | Average Annual Input by Nation (MT/year) | |||
|---|---|---|---|---|---|
| USA | Canada | Mexico | Total | ||
| Historical Data | 1990s (OITS III) | 6,676 | 69 | 80 | 6,825 |
| 2010s (OITS IV) | 796 | 10 | ND | 806 | |
| Reference Scenario | 2020s | 976 | 14 | ND | 990 |
| 2030s | 975 | 18 | ND | 994 | |
| 2040s | 932 | 20 | ND | 952 | |
| 2050s | 909 | 20 | ND | 929 | |
| Partial Decarbonization Scenario | 2020s | 848 | 13 | ND | 860 |
| 2030s | 717 | 11 | ND | 728 | |
| 2040s | 501 | 7 | ND | 509 | |
| 2050s | 384 | 6 | ND | 390 | |
| Net Zero 2050 Scenario | 2020s | 826 | 12 | ND | 838 |
| 2030s | 617 | 9 | ND | 626 | |
| 2040s | 353 | 5 | ND | 358 | |
| 2050s | 209 | 3 | ND | 212 | |
NOTE: ND = no data.
shipping lanes. Larger vessels are less maneuverable and have a greater impact due to the force of their tonnage in the event of a collision.
For oil consumption-related spillage, the estimated historical and projected spillage amounts are shown in Table 3.23 and Figure 3.22. The probability of a significant spill from a consumption-related source (fuel) is unlikely, as the oil volumes contained in these sources are considerably lower than in large tankers or outlier well blowouts.
The total spillage from all sources is summarized in Table 3.24 and Figure 3.23. Again, outlier blowouts are excluded from the analysis.
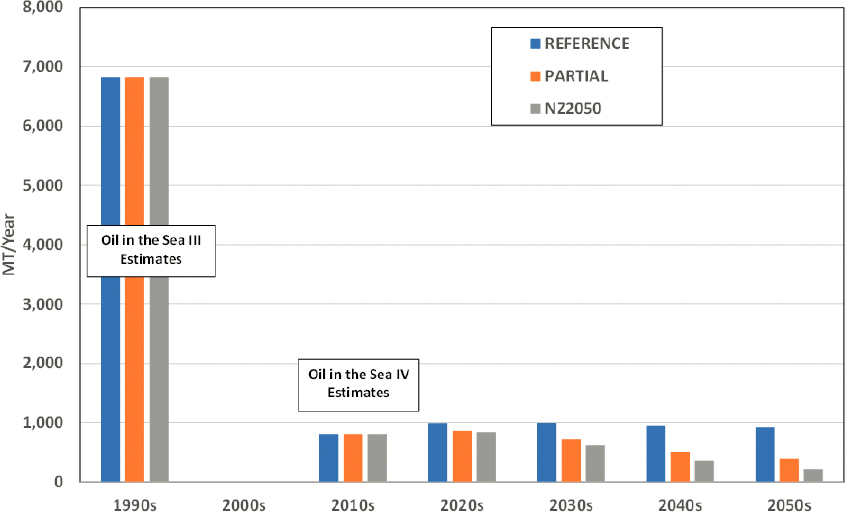
TABLE 3.23 Oil Consumption-Related Spillage
| Energy Scenario | Time Period | Average Annual Input by Nation (MT/year) | |||
|---|---|---|---|---|---|
| USA | Canada | Mexico | Total | ||
| Historical Data | 1990s (OITS III) | 835 | 52 | ND | 887 |
| 2010s (OITS IV) | 337 | 57 | ND | 394 | |
| Reference Scenario | 2020s | 335 | 50 | ND | 385 |
| 2030s | 341 | 44 | ND | 385 | |
| 2040s | 350 | 39 | ND | 389 | |
| 2050s | 360 | 35 | ND | 395 | |
| Partial Decarbonization Scenario | 2020s | 318 | 47 | ND | 365 |
| 2030s | 281 | 42 | ND | 323 | |
| 2040s | 198 | 29 | ND | 227 | |
| 2050s | 141 | 21 | ND | 162 | |
| Net Zero 2050 Scenario | 2020s | 302 | 52 | ND | 354 |
| 2030s | 239 | 41 | ND | 280 | |
| 2040s | 138 | 24 | ND | 162 | |
| 2050s | 73 | 13 | ND | 86 | |
NOTE: ND = no data.

TABLE 3.24 Total Oil Spillage (excluding outlier blowouts)
| Energy Scenario | Time Period | Average Annual Input by Nation (MT/year) | |||
|---|---|---|---|---|---|
| USA | Canada | Mexico | Total | ||
| Historical Data | 1990s (OITS III) | 7,651 | 149 | 141 | 7,941 |
| 2010s (OITS IV) | 1,224 | 69 | 1,017 | 2,310 | |
| Reference Scenario | 2020s | 1,394 | 65 | 709 | 2,168 |
| 2030s | 1,367 | 63 | 864 | 2,295 | |
| 2040s | 1,316 | 59 | 1,095 | 2,469 | |
| 2050s | 1,298 | 55 | 1,171 | 2,525 | |
| Partial Decarbonization Scenario | 2020s | 1,237 | 61 | 721 | 2,018 |
| 2030s | 1,030 | 53 | 577 | 1,660 | |
| 2040s | 714 | 37 | 405 | 1,156 | |
| 2050s | 536 | 27 | 334 | 896 | |
| Net Zero 2050 Scenario | 2020s | 1,195 | 65 | 543 | 1,802 |
| 2030s | 882 | 51 | 378 | 1,311 | |
| 2040s | 501 | 29 | 210 | 740 | |
| 2050s | 289 | 16 | 144 | 449 | |
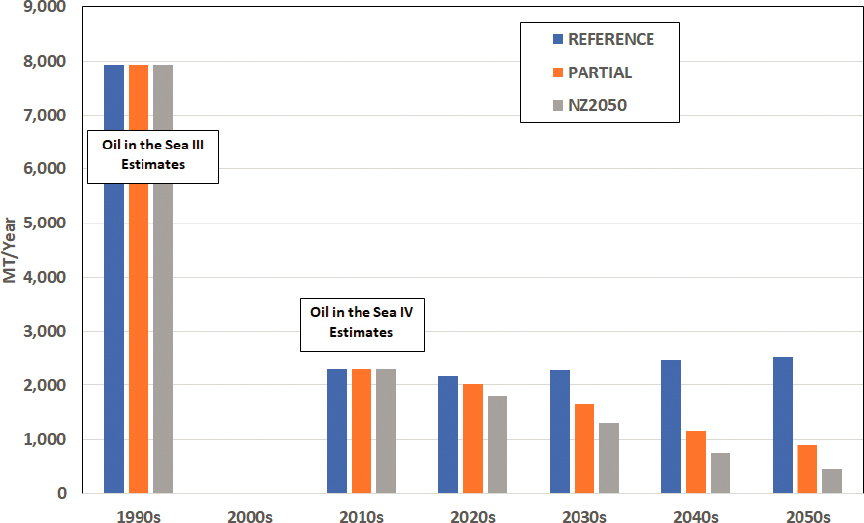
3.6 CONCLUSIONS
Conclusion—In agreement with the 1975 National Research Council report titled Petroleum in the Marine Environment (the first in the series of Oil in the Sea reports), this report also recognizes “that there was a significant lack of systematic data collection concerning petroleum hydrocarbon discharges entering the oceans.” As was stated in Oil in the Sea III (2003) “the report, lacking significant quantitative data, was based on estimates and in some instances, educated guesses.” Although the Oil in the Sea IV committee found more specific data on some inputs (spill volumes, permitted discharges), other values in input categories remain vague (land-based runoff, sewage discharge, two-cycle engines, atmospheric deposition, and emergency dumping) to nonexistent.
Conclusion—Energy transition from hydrocarbon fossil fuels to alternative (renewable, nuclear) energy will ultimately reduce the input of oil in the sea from production, transportation, and consumption. New energy sources (e.g., wind farms) and fuels (e.g., biofuels, ammonia, and hydrogen) can introduce new safety and pollution concerns and the regulators, the research community, and the industry are encouraged to proactively review and address any potential adverse effects from these transitions. While energy transition is taking place, continued attention to environmental concerns associated with fates and effects from human-caused chronic and episodic inputs of oil remains critical.
Natural Seeps
Conclusion—Oil in the Sea III recommended that “[f]ederal agencies especially the USGS, MMS, and NOAA should work to develop more accurate techniques for estimating inputs from natural seeps, especially those adjacent to sensitive habitats.” Some progress has been made on identification of seep locations, but not much work has advanced quantification of oil and gaseous hydrocarbons released from natural seeps, particularly outside the Gulf of Mexico in areas such as the North American Pacific margin and North American Arctic margin. The geographic and temporal expanse of natural seeps could be better understood through use of existing techniques, along with exploration of new technologies for identification and quantification of natural seeps.
Land-Based Sources
Conclusion—Oil in the Sea III recommended that “[i]n order to assess impacts attributable to different sources including oil spills, and nonpoint sources, federal agencies, especially USGS and EPA should work with state and local authorities to undertake regular monitoring of TPH and PAH inputs from air and water (especially rivers and harbors) to determine background concentrations.” It is evident that this recommendation has not been acted upon. In order to quantify inputs from nonpoint sources and thus understand the effects these inputs may have on the ecosystem, regular monitoring of rivers and harbors has to occur. Oil and grease and petroleum hydrocarbon data was collected in the 2000s, but that data corresponds to individual and unique projects aimed at monitoring runoff in specific locations. These projects do not allow for temporal or spatial coverage or extrapolation, or improved insights into baseline data regarding the composition of oil compounds present in runoff from land.
Conclusion—Personal and industrial practices for controlling nonpoint pollution, such as motor oil recycling, and reduction in fossil fuel usage via improved fuel efficiency and electrification of transportation, will have the added benefit of reduction in land-based runoff.
Conclusion—Further research is required to refine estimates of land-based inputs of oil that is transported via the atmosphere to the sea. This would include (1) expanding the geographic and temporal coverage of data collection; and (2) refining understanding of the source of hydrocarbons measured in marine atmospheres and surface seawater by improved structural elucidation of compounds of interest coupled to robust source determination via the methods previously mentioned in this section.
Operational Discharges
Conclusion—Operational discharges from exploration and production operations are permitted as long as they do not exceed maximum weighted average concentration of oil-in-water (or “oil and grease”). Under this approach the exact concentration of oil in produced water is not reported, preventing accurate estimation of oil inputs into the marine environment.
Conclusion—Regulatory changes had a positive impact on decreasing operational discharges from exploration, production, and transportation, in the North American waters. With compliance, the operational discharges are small relative to potential spill volumes. Illegal discharges still occur and the best prevention is rigorous and effective enforcement of the regulations. Technologies such as drones and satellites can be used to improve surveillance and enforcement. Additionally, the corporate culture increasing the standard of care for environmental stewardship within the industry has grown and continues to aid in the reduction of illegal activities.
Conclusion—Illegal discharges from ships can have a significant impact on the total input volumes in the locations where they occur. The Oil in the Sea III report recommended: “federal agencies, especially the U.S. Coast Guard, should work with the transportation industry to undertake a systematic assessment of the extent of noncompliance.” The extent of noncompliance with illegal-discharge regulations in North American waters remains unknown.
Conclusion—Oil in the Sea III recommended that “federal agencies, especially the U.S. EPA, should continue efforts
to regulate and encourage the phase out of inefficient two-stroke engines, and a coordinated enforcement policy should be established.” The committee commends the U.S. EPA’s efforts to address this important recommendation. Continued efforts to reduce use of two-stroke engines in North American waters are encouraged.
Conclusion—Oil in the Sea III recommended that “[f]ederal agencies, especially the Federal Aviation Administration (FAA), should work with industry to more rigorously determine the amount of fuel dumping by aircraft and to formulate appropriate actions to understand this potential threat to the marine environment.” It was found that this recommendation has not been addressed and remains an important gap in the understanding of oil inputs into the marine environment. Additionally, obtaining accurate estimates of fuel released into the seas would require reporting of jettison dumping by the defense sectors, in addition to the private sector.
Accidental Spills
Conclusion—Excluding the DWH incident in annualized estimates, in U.S. and Canadian waters, the spillage from oil extraction activities is nearly the same as that estimated in Oil in the Sea III (1990–1999), although there is a shift away from coastal/nearshore spillage to more offshore spillage. This reflects the increase in offshore oil exploration and production activities in deeper offshore waters both in the United States and Canada. However, the actual rate of spillage per amount of production has decreased in the past two decades.
Conclusion—The DWH incident was unprecedented with regard to the total volume of the release. It represents an “outlier” case in that it is expected to be a very low-probability–high-volume event. Its occurrence during the time period considered as the “sampling period” for the estimation of average annual inputs of oil into the sea (2010–2019) from oil extraction activities is treated separately from the annual estimates while recognizing its impacts during the period reviewed in this report.
Conclusion—Extensive investigations in the aftermath of the DWH incident resulted in numerous positive changes by government agencies, industry, and regulators to prevent such a disaster from happening again. This includes technological improvements to detect anomalies that may indicate potential issues with well integrity during offshore drilling operations and to intervene with source control measures in as timely a fashion as possible to prevent large releases and blowouts. Continued support of technological and organizational improvements is critical to being better prepared for the next event, should it occur.
Conclusion—Governmental agencies and industry have improved pipeline systems’ reliability as well as spill prevention and early detection techniques and processes, resulting in a decrease of spills from onshore and offshore pipelines despite the increase in pipeline mileage and barrels delivered.
Conclusion—The potential for future spillage related to storm damage of offshore structures, pipelines, and coastal facilities, particularly in light of increased intensity and frequency of severe storms and hurricanes related to climate change, represents a considerable risk of future oil inputs into the marine environment.
Conclusion—Double hulls on tankers and on fuel tanks of other types of vessels help reduce the likelihood of spillage from low-impact groundings and collisions, but they will not guarantee zero pollution in all incidents. Port congestion and increased vessel size make maneuvering more challenging and create a risk of collisions and allisions. Robust systems for monitoring and managing vessel traffic decrease the risk of pollution incidents.
Conclusion—While the probability of major tank vessel spills has been reduced significantly in the past 20 years, there is still a possibility that such a spill might occur. Future advancement in oil spill prevention would benefit from improved connectivity via satellites, available automatic information system data, machine learning, and other new technologies that would help both the onboard crew and onshore personnel to identify potentially dangerous situations before they occur.
Conclusion—Aging infrastructure (i.e., abandoned wells and pipelines, coastal facilities, etc.) poses potential sources of oil into the marine environment. Appropriate federal, state, or tribal entities should take inventory of the existing remnants of oil storage, transport, or production activities that still remain to be identified, triaged for potential losses, and as appropriate salvaged or capped.
Conclusion—There is an increased potential for future spillage from sunken wrecks as those wrecks age. The majority of the larger wrecks are World War II–related casualties and thus more than 70 years old. As such, they are subject to significant corrosion in addition to possible damage incurred in battle. U.S. Coast Guard and environmental authorities from the United States, Canada, and Mexico are encouraged to take advantage of the availability of data from existing risk assessment studies to prioritize wrecks for monitoring, surveying, and potential oil removal operations. The availability of advanced tools for conducting more effective monitoring and remote sensing survey operations, as well as the technological capability to conduct effective oil removal operations may help to reduce this threat. Although the number of wrecks may seem a daunting task, a strategy of systematic risk assessment and prioritization using existing tools will focus efforts on the wrecks that present the greatest threats to marine waters and sensitive ecological and socioeconomic resources.


