
OBJECTIVE
This chapter assesses the efficacy of EEO-1 Component 21 data for the estimation of pay gaps by sex and race/ethnicity. Component 2 data have several advantages for this purpose. For example, Component 2 data comprise the only large dataset with earnings by sex and race/ethnicity that also contains information on establishments and firms, together with hours worked and occupations. The identification of establishments (and firms) is one of the great strengths of Component 2 data, since the use of within-establishment comparisons is consistent with the regulatory and enforcement roles of EEOC.
Component 2 data also have several potential limitations, which have been noted in previous chapters. These shortcomings include the fact that the data are aggregated in various ways; they use wide pay bands for annual earnings (see Chapter 3); annual hours worked are aggregated for all employees in each of the pay bands (see Chapter 3); occupations are aggregated into 10, somewhat antiquated, classifications (see Chapter 3); and data on years of education and work experience are absent (see Chapter 3). Finally, the currently available data contain errors of various sorts (see Chapters 4 and 5).
APPROACH
The panel undertook four related comparisons to understand the efficacy of Component 2 data. Analysis was limited to 2018 Component 2 data, and 2018 American Community Survey (ACS) data were used for comparison. The Census Bureau collects the ACS annually.2
The ACS database differs in various ways from Component 2 data. First, Component 2 data are reported by firms (or professional employer organizations on behalf of firms), whereas ACS is a household survey. This can result in discrepancies between employers’ and workers’ perceptions of sex and race/ethnicity, as well as occupation, industry, and pay. Second, Component 2 data generally are meant to include only private-sector,
___________________
1 In 2018 and 2019, EEO-1 data collections occurred in two components. The customary EEO-1 instrument containing composition data (Component 1) was collected in 2018 for reporting year 2017, and in 2019 for reporting year 2018. In 2019 and 2020, pay data (Component 2) were collected for reporting years 2017 and 2018. In this report, we refer to historical EEO-1 data collections as EEO-1, and the 2017 and 2018 EEO-1 Component 1 and Component 2 instruments as “Component 1” and “Component 2,” respectively. All information collected by the Component 1 instrument is also collected by the Component 2 instrument.
2 ACS data can be publicly accessed through www.ipums.org and information about the ACS can be found at https://www.census.gov/programs-surveys/acs/about.html
for-profit and non-profit firms with 100 or more employees.3 Establishments within firms, however, can have fewer employees. ACS data are nationally representative and do not indicate whether a worker was employed by a firm covered in the EEO-1 instrument. Individuals who reported that they were self-employed or working in the public sector were excluded from the ACS sample, but workers in small firms could not be eliminated.4 The ACS sample, therefore, has a larger fraction of workers employed in small firms than does the Component 2 data. The reporting period of the two datasets is another difference. The Component 2 data collection was to include all full-time and part-time employees employed during an employer-selected payroll period between October 1 and December 31. ACS, however, asks respondents questions about current or most recent employment and pay information covering the entire previous 12 months. For ACS, workers are sampled throughout the calendar year so, for most respondents, some of their reported earnings come from 2017.5 ACS pay data are likely more error prone than are employer reports, with underestimates of pay at the high end and overestimates at the low end more common (Kim and Tamborini, 2012a,b). Similar errors may occur in ACS data for self-reported occupations (Speer, 2016).
Basic summary statistics from the ACS sample and the Component 2 data, for certain key variables common to both datasets, are reported in Appendix 6-4. Some differences exist across the two datasets that need to be taken into account when considering this chapter’s analyses, but the datasets are comparable enough to make the analyses informative for evaluating multiple dimensions of quality in the Component 2 data.
Relative to Component 2 data, workers in the ACS sample have lower average annual pay. There are more males (55% in the ACS sample versus 51% in Component 2 data), more Hispanic workers (19% versus 15%), and fewer Black workers (12% versus 15%). Many of these differences are probably an artifact of the inclusion of smaller firms in the ACS data collection relative to the Component 2 data collection (Stainback and Tomaskovic-Devey, 2012).
There are differences in the distributions of workers across EEO-1 job categories between the two datasets with, for example, fewer professionals
___________________
3 See Chapter 2 for a detailed description of eligible filers.
4 Those who were working in industries in North American Industry Classification System code 611M1 were also excluded, thereby excluding junior colleges and four-year colleges and universities not covered by EEO-1 reporting requirements.
5 Basic results for the 2017 and 2019 ACS data were also examined, and they are very similar to those reported here for 2018. Detailed analyses using these additional years of data were therefore not pursued.
in the ACS data (17% versus 21%). This difference could be an artifact of the differential coverage of small firms (or other sample-selection issues), or of reporting differences between the identification of job categories by workers and firms.6
The first comparison assessed whether individual-level ACS data yield similar results regarding pay gaps by sex and race/ethnicity as the less-detailed data arranged in a manner following that collected by the Component 2 instrument (called the “EEO’d” data). This was accomplished by taking detailed data from the 2018 ACS data collection and decreasing the detail to achieve features similar to EEO-1 data.
The second analysis compared ACS estimates of pay gaps to those from EEO-1 data. The third assessed whether adding various measured characteristics of workers, not collected in Component 2 data, resulted in important changes in the estimates. That was achieved by adding measures of individual characteristics to ACS regressions, in both the detailed (original) and the less-detailed (EEO’d) formats. The fourth comparison evaluated the impact of a within-establishment estimation, which can be done only with Component 2 data, on pay gaps by sex and race/ethnicity. In this case, Component 2 data were used, as was done for the second comparison, and establishment fixed effects were added to gauge the impact on the coefficients. Pay gaps were first compared using annual pay and then controlled for annual hours worked, which approximated pay gaps for rates of pay.
Comparisons of the coefficient estimates are diagrammed in Figure 6-1: (1) compare original ACS data to ACS data in the less detailed (EEO’d) format; (2) compare ACS EEO’d data to estimates from Component 2 data; (3) compare the coefficients from the original ACS individual-level data and ACS EEO’d data to data that include human-capital variables; and (4) compare the Component 2 results, as produced for (2), to those that include establishment fixed effects.
___________________
6Appendix 6-4 further breaks down the information in the two datasets by job category and pay band. In addition to differences in the representation of workers across job categories, there are also differences across pay bands. Given the width of the bottom and top pay bands, it is not surprising that most of these discrepancies occur in these pay bands. For example, 58 percent of service workers in the EEO-1 Component 2 data are in the lowest pay band, but for the ACS data, 48 percent are in the lowest pay band. Also, compared to ACS data, a much higher proportion of executives are in the highest pay band of the Component 2 data.
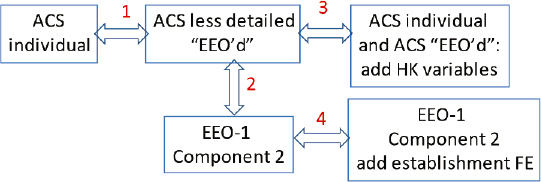
NOTE: In this figure “HK” refers to human capital and “FE” refers to fixed effects.
FINDINGS
Comparison 1: ACS Data and “EEO’d” ACS Data
General Methodology
To assess whether and how the aggregations of pay and occupation in the Component 2 data alter their usefulness, individual-level data were taken from the 2018 ACS data collection and responses were recoded for consistency with the less-detailed data collected by the Component 2 instrument. That is, rather than having an individual’s occupation given by the six-digit level Standard Occupational Classification (SOC) system occupation code, of which there are around 800 in the ACS data, data were aggregated using the 10 EEO-1 job categories. For example, a “human resources manager” (SOC 2010 occupation code 11-3121), would be classified as “first/midlevel officials and managers,” which is EEO-1 job category 2.7
In addition, rather than assigning each individual their annual income they reported in ACS, individuals were placed in appropriate EEO-1 pay bands, of which there are 12. One income measure was assigned in each pay band. For the middle pay bands (bands 2 to 11), the midpoint of the pay band was assigned. For example, if the “human resources manager” earned $60,000 per year, that person would be placed in pay band number 6 ($49,920–$62,919) and assigned the midpoint for that pay band ($56,420). For the bottom and top pay bands, because they are wide (the top band is open-ended), 2018 ACS data on pay for workers in each of those pay bands were used. State-specific medians were calculated and assigned to workers in the upper and lower pay bands based on state of residence.
___________________
7 In this report, “job category” is used to refer to the 10 job categories used in the Components 1 and 2 data collections. “Occupation” is used as a more generic term and with reference to the SOC codes that provide a more detailed categorization of occupations.
Using this method, two versions of the ACS data were available: the original data by individual, and the less-detailed (EEO’d) data. This method was used to ascertain the efficacy of Component 2 data relative to the more precise pay and occupation measurement used in the ACS.
The construction of key ACS variables by individual was as follows. The ACS “incwage” variable was used to provide total annual pre-tax wage and salary income for employees in the previous year. Hours worked in the ACS were calculated using usual hours worked per week multiplied by weeks worked in the previous year. Usual weeks worked was binned and the midpoints of each bin were used. Sex and race/ethnicity variables allowed the groupings in the EEO-1 data to be recreated.
In the regressions, individuals with yearly earnings less than $3,770 (i.e., half the federal minimum wage for someone working 20 hours per week during the year) were dropped. This trimming eliminated observations for workers marginally attached to the labor force (and therefore less likely to work for Component 2-covered firms). Trimming also excluded those for whom the implied hourly wage was likely in error. Earnings, as noted previously, were the approximate midpoints of each of the pay bands, with the exception of the upper and lower bands.
Each version of the data was used to estimate standard natural logarithm earnings equations, to compare the coefficients of interest for the various sex and race/ethnicity groups. White (non-Hispanic) males were the standard to which all others were compared.
Empirical Implementation
The empirical analysis began with an examination of differences in annual pay between workers in the 2018 ACS, by sex and race/ethnicity. Correlates of and contributors to these wage differences were documented following a commonly used standard (e.g., Altonji and Blank, 1999). (Natural) log wage regressions of the form below.
| ln(w)i = α + β1Fi + β2REi + γXi + εi | Eq. 6.a |
were estimated where, for an individual worker i, wi is the worker’s reported wage and salary income during the previous 12 months, Fi is a an indicator variable (also called a dummy variable) for whether worker i is female, REi is a vector of indicators for the race and/or ethnicity of the worker, and Xi is a set of other measured characteristics of worker i that are known to be related to wage variation across workers (e.g., occupation, industry, age, education, hours worked). All regressions were weighted using standard ACS “person weights.” By using the natural log specification,
the estimated regression coefficients on sex and race/ethnicity (β1 and β2), as (approximate) percentage differences in earnings relative to an omitted category, could be interpreted.
ACS uses the federal standard of categorizing race/ethnicity separately so that an individual can identify as Hispanic and as a specific race. To match EEOC definitions of race and ethnicity, ACS race and ethnicity measures were recoded. An individual was coded as Hispanic if the person self-identified as Hispanic in the data. The individual was then assigned to a race category only if that person did not identify as Hispanic. For example, an individual identifying as Hispanic and Black/African American in the ACS was recoded as Hispanic in this ACS analysis, and only non-Hispanic White individuals in the ACS were coded as White in this analysis. This categorization of race and ethnicity is not an endorsement of EEOC’s choice. Rather, it allowed the panel to directly align the ACS and Component 2 instrument categories.8 (EEOC’s choice of categorization of race/ethnicity was addressed in Chapter 3.) In all regression specifications, White (non-Hispanic) males were always the omitted category and thus the standard to which all other groups were compared.9
The standard wage regression in Eq. 6.a does not allow estimation of the importance of intersectionality in sex and race/ethnicity (i.e., whether the pay gap by sex differs by race/ethnicity groups). To do so, interaction terms and estimate regressions were added, of the form below.
| ln(w)i = α + β1Fi + β2REi + β3(Fi × REi) + γXi + εi | Eq. 6.b |
___________________
8 ACS utilizes the federal standard naming convention “American Indian/Alaska Native.” The comparable EEOC race category is “Native American or Alaska Native.” In the text, this group is referred to as American Indian/Alaska Native; in the tables and figures, the naming conventions particular to the data collection are used. Non-Hispanic individuals in the ACS who report their race as “other” were dropped from the sample.
9 The estimated regression coefficients β1 and β2 from the log earnings equation are good approximations for percentage differences in earnings when their magnitudes are small. But when the coefficient is large, the difference between the coefficient and its percentage representation is less close. For example, if the coefficient on the female indicator were –0.05, or five log points, it is safe to call the difference in earnings five percent, since the ratio of female to male earnings would be 0.9512 (= e–0.05). But if the coefficient were –0.35, or 35 log points, which is the case for some coefficients reported in this chapter, then the approximation is much less good: the ratio of female to male earnings would be 0.7047 (= e–0.35) and the difference would be more like 29.53 percent (1 – 0.7047). For ease of comprehension, and because it is a common convention, all coefficient estimates in this chapter are referred to as percentage differences, but some readers may want to do the further conversion, for precision.
Basic Pay Differences by Race/Ethnicity
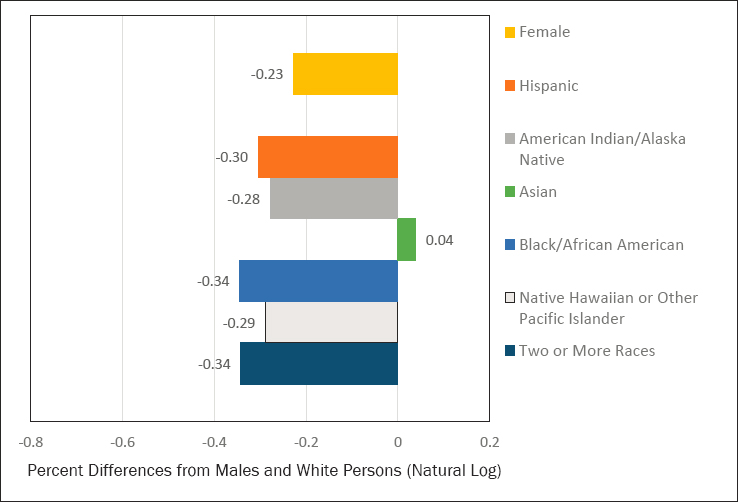
The first set of results comes from a version of Eq. 6.a for which indicators were included in the model for sex and race/ethnicity only, but a set of covariates was not included (γ is set to zero). The estimated sex and race/ethnicity coefficients and associated standard errors (the estimates of β1 and β2 and their standard errors) are reported in Appendix 6-6, and the resulting pay differences across groups are reported in Figure 6-2. It is worth reiterating that these results use annual pay as the outcome variable, without any adjustments for hours worked per week and weeks worked per year.
Annual pay for women is 35 percent less than that of men. Compared to White workers, Black workers earn 32 percent less; Native Hawaiian or Other Pacific Islanders earn 18 percent less; American Indian/Alaska Natives workers earn 34 percent less; and workers who report being of two or more races earn 21 percent less. Only Asian workers earn more (14%) than White workers when measured in this manner.
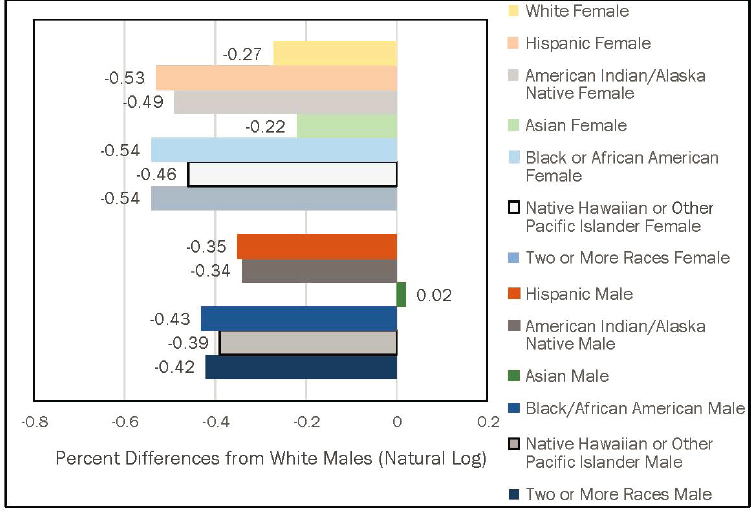
Figure 6-3 reports results on pay gaps by race/ethnicity for men and women that arise from estimating a version of Eq. 6.b that allows for interactions between the sex indicator and the race/ethnicity indicators, but that
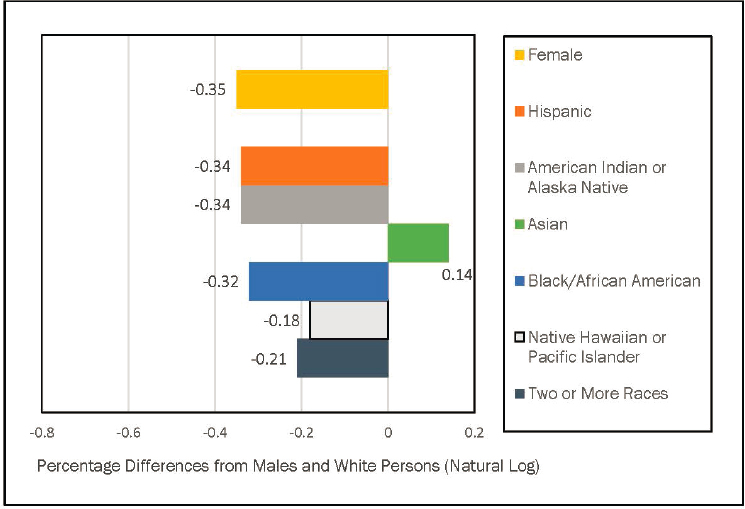
SOURCE: Panel generated from ACS, 2018.
NOTE: All differences from White males are statistically significant.
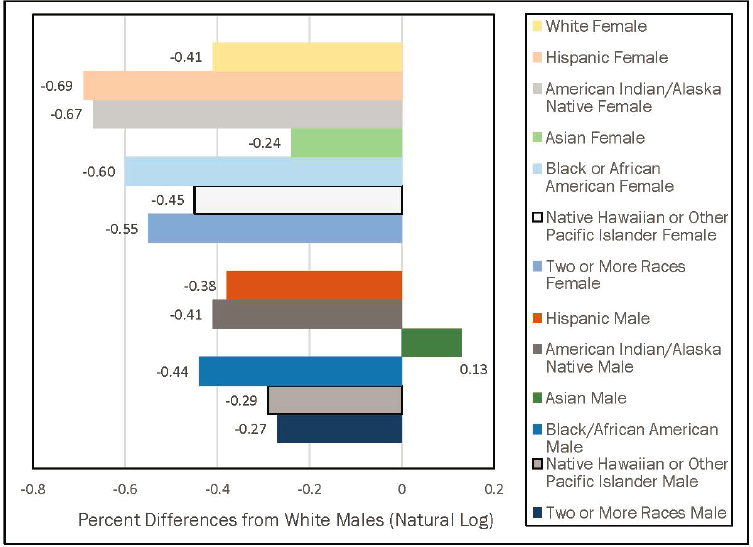
SOURCE: Panel generated from ACS, 2018.
NOTE: All differences from White males are statistically significant.
excludes other relevant covariates. As is clear from the figure and from the non-zero coefficient estimates of β3 (reported in Appendix 6-6), sex differences in pay are not constant across all race/ethnicity groups and, relatedly, race/ethnicity pay differentials are not the same for men and women. In particular, pay disparities between non-White women and White men are larger than for White women and White men for all groups except Asian workers.
Relative to White men, Black men earn 44 percent less, Hispanic men earn 38 percent less, Native Hawaiian or Other Pacific Islander men earn 29 percent less, American Indian/Alaska Native men earn 41 percent less, and men of two or more races earn 27 percent less. Only Asian men earn more (13%) than White men.
White women earn 41 percent less than White men and, except for Asian women, all other non-White women earn even less relative to White men (69% less for Hispanic women, 60% for Black women, 45% for Native Hawaiian or Other Pacific Islander women, 67% for American Indian/Alaska Native women, and 55% for women of two or more races). Asian women earn 24 percent less than White men.
Pay Differences Controlling for Occupation, Industry, and Geography
Figures 6-2 and 6-3 highlight the economic importance of pay differences by sex and race/ethnicity, and the significance of intersectionality in sex and race/ethnicity in determining pay differences. Because the analysis is intended to examine the basic utility of Component 2 data in estimating patterns of pay differences across workers, the rest of the discussion, in the interest of brevity, focuses on regression results derived from Eq. 6.a. Full regression results for both Eq. 6.a and Eq. 6.b are in Appendix 6-6.
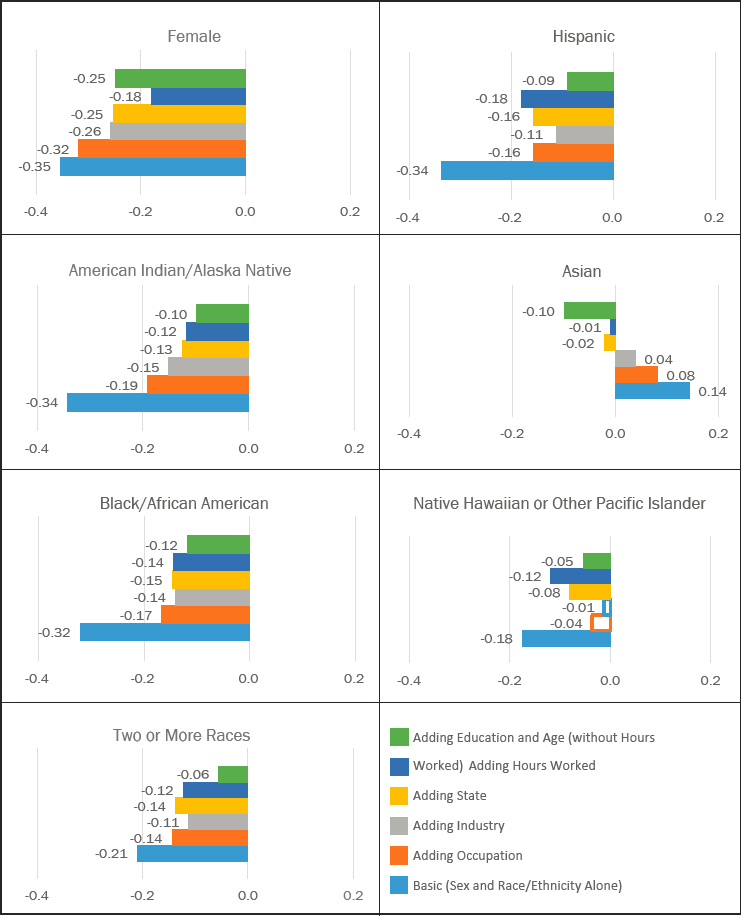
Figure 6-4 reports coefficient estimates representing sex and race/ethnicity pay gaps starting with a model that contains no controls. Controls were then added for the occupation of the worker, the industry of the worker, and geographic information regarding where the worker was employed. Specifically, the detailed (six-digit) SOC codes to account for occupation, the detailed North American Industry Classification System (NAICS) codes available in the public-use ACS microdata to account for industry, and the employment state of the worker were sequentially included in the regressions.10 The exercise served four purposes.
First, there is considerable, although declining, occupational and industrial sorting of workers by sex and race/ethnicity in the United States (e.g., Albelda, 1986; Blau et al., 2013). By controlling for these two dimensions of segregation, estimates of pay differences are provided, after accounting for this sorting. Moreover, there is spatial variation of race/ethnicity in the United States and geographic variation in pay. Second, these estimated pay gaps can be compared to those obtained when EEO’d data were used, by employing the 10 EEO-1 job categories rather than the detailed SOC codes. (For this reason the controls were sequentially ordered, with occupation first followed by industry and geography.)
Third, because ACS does not provide information on the identity or characteristics of establishments in which individuals work, the best proxy was developed for the establishment, using a combination of occupation, industry, and geography indicators. The effectiveness of these proxies was assessed relative to estimating “within”-establishment pay differentials, using Component 2 data (see below). Fourth, and relatedly, for EEOC enforcement purposes, similarly situated workers are generally those in the same occupation, industry, and geographic location. Controlling for these measures at some level in regressions allows the recovery of pay gaps across workers, conditional on these factors as defined.
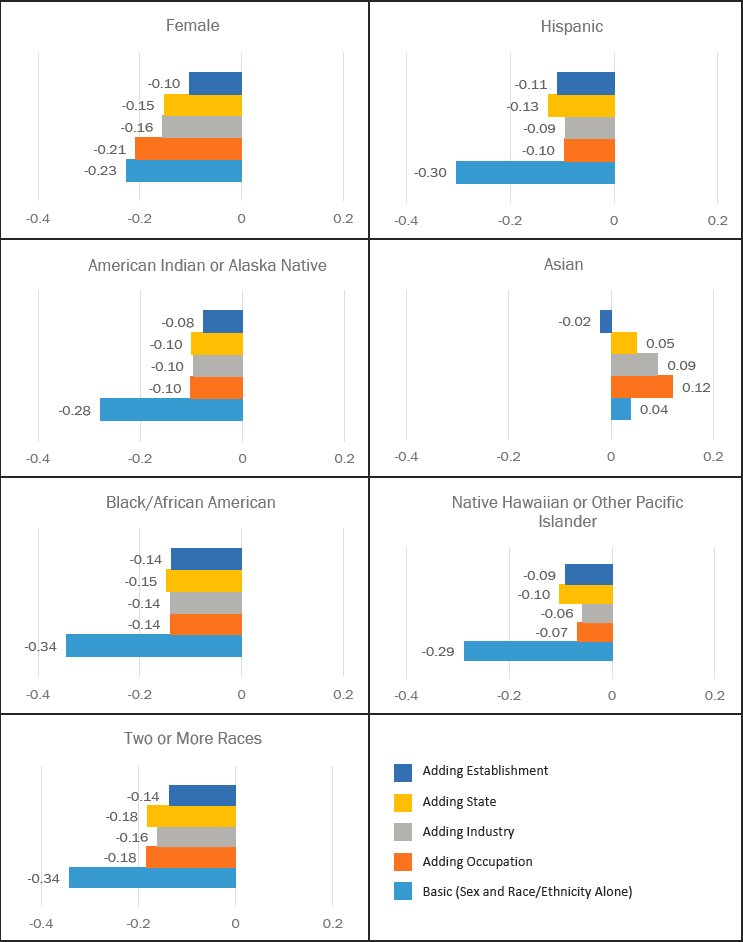
Each bar chart in Figure 6-4 depicts estimated coefficients for a specific group defined by sex or race/ethnicity across various regression
___________________
10 Estimated coefficients and standard errors for these regressions are reported in Appendix 6-5.
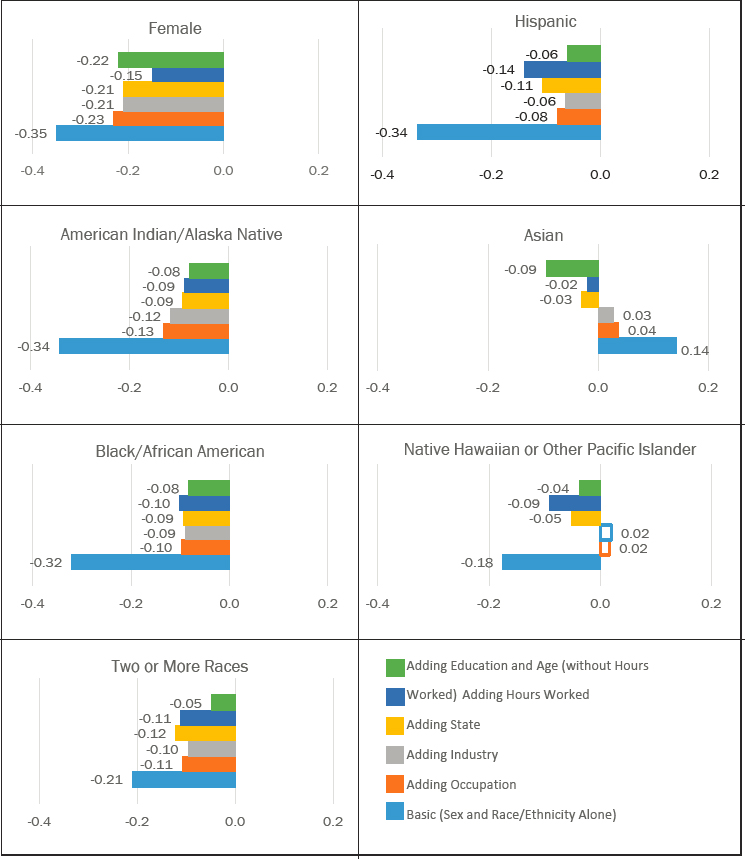
SOURCE: Panel generated from ACS, 2018.
NOTE: Percent differences from White males (natural log). All differences from White males are statistically significant except those bars that are not filled in. These bars show the estimated differences based on the following progressively more detailed specifications of the models: basic, followed by adding occupations, industry, geography (states), the natural log of the hours worked, and education and age (without including the log of the hours worked).
specifications. The first bar in each chart reports coefficients from regressions with no controls and replicates the results in Figure 6-2. The second through fourth bars in each chart report results from regressions that control sequentially for occupation, then industry, and then state. In all cases, controlling for occupation alone markedly reduces pay differentials, highlighting the economic importance of occupational sorting in the labor market, which may be a matter of individual choice or may be imposed on individuals by group characteristics. Adding industry and then geography controls also impacts pay differentials but in a less important manner after controlling for occupation.
For women, controlling for detailed occupation (SOC) codes has a very large effect on the male-female annual pay differential, reducing it from 35 to 23 percent; adding industry controls and then state controls reduces the differential further but by just 2.8 percentage points. Controlling for geographic variation across states increases the relative pay premium for White workers for all race/ethnicity groups, and notably, for Asian workers, a positive pay gap relative to White workers becomes negative. In summary, after controlling for occupation, industry, and state, women earn 21 percent less than men, and all race/ethnicity groups earn less than White workers, with differentials ranging from three percent (Asian workers) to 11 percent (Hispanic workers).11
Estimating Differences in Wage Rates Across Workers
Results presented thus far give differences in annual pay by workers’ sex and race/ethnicity. Given that many employees do not work full-time for the full year in the establishments under consideration, these pay gaps may not represent differences in underlying wage rates. To estimate pay differentials that reflect underlying wage rates, a version of Eq. 6.a was estimated in which, in addition to controlling for occupation, industry, and geography, a control variable was added for the (natural) log of the annual hours worked by the employee in 2018.12 The resulting coefficient estimates are reported as the dark blue bars of Figure 6-4 and in Appendix 6-6.
The pay differential between women and men is significantly smaller when hours worked are accounted for, shrinking from 21 percent lower pay for women to 15 percent, reflecting the fact that women are more likely than men to be part-time workers. Notably, for a number of race/ethnicity
___________________
11 The reader is cautioned that the order of adding variables to the regression equation can influence a given variable’s contribution to measuring the outcome variable (in this case, wage difference).
12 Annual weeks worked is constructed by multiplying the variable for usual hours worked per week by the midpoint of the binned variable for weeks worked in the last 12 months.
groups, the pay differential relative to White workers expands when hours worked are included. For example, controlling for hours worked increases the Hispanic-White pay gap from 11 to 14 percent, and the Native Hawaiian or Other Pacific Islanders pay gap from five to nine percent. For the other race/ethnicity groups, controlling for hours worked has little effect on the estimation of pay differences (after already controlling for occupation, industry, and geography).
ACS Data in EEO’d Form
Controlling for the 819 detailed SOC codes, as reported in Figure 6-4, meaningfully reduces estimated pay gaps across workers. But EEO-1 Component 1 and 2 data collections contain information on only 10 aggregated job categories. Moreover, unlike SOC occupation codes, which are updated by the federal government at regular intervals to account for changes in the work being performed in the U.S. labor market, EEO-1 job categories have remained unchanged for decades.
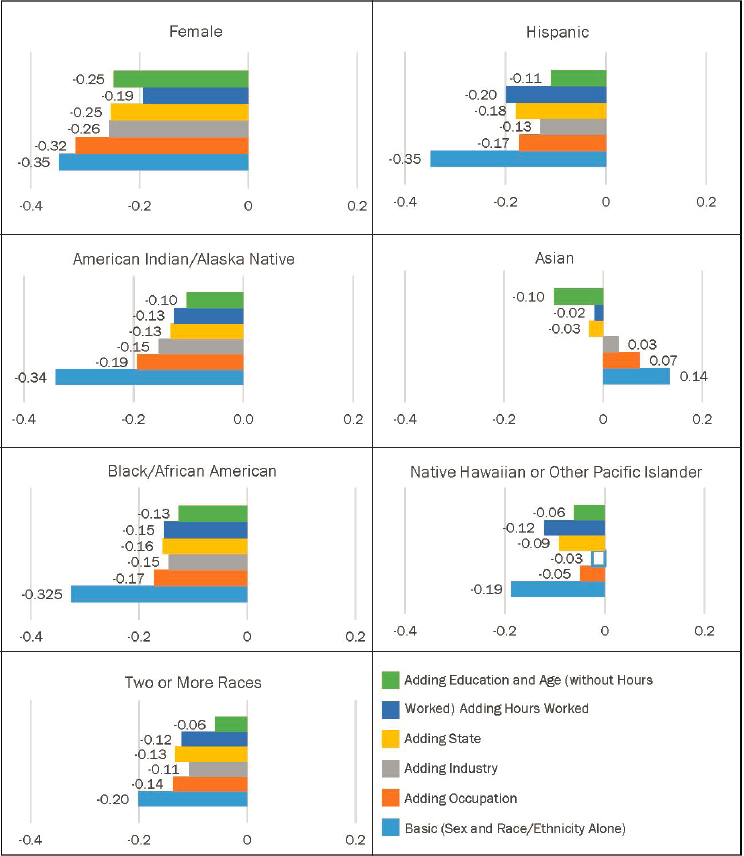
Using the published crosswalk between SOC occupation codes and EEO-1 job categories, each worker in the ACS sample was first assigned the EEO-1 job category corresponding to their reported SOC occupation. Versions of Eqs. 6.a and 6.b were then estimated that replace indicators for SOC code with the set of indicator variables for the 10 EEO-1 job categories. The resulting coefficient estimates on sex and race/ethnicity differences are reported in Figure 6-5 and can be compared directly to those in Figure 6-4 to assess the impact of using EEO’d occupations.13
Controlling for EEO-1 job categories alone reduces the pay gap for women far less than does controlling for SOC code. In particular, while the 35 percent pay gap decreases to 23 percent when detailed SOC codes are used to classify occupations, it decreases minimally to 32 percent when EEO-1 job categories are used. This finding is not surprising given that there are only 10 job categories as opposed to more than 800 SOC codes. EEO-1 job categories alone do not meaningfully describe the extent of sorting by sex across occupations.
Occupations are not evenly distributed across industries. It is therefore not surprising that adding controls for industry has a larger effect on reducing the pay gap for women (from 32% to 26%) when EEO-1 job categories are used than when SOC occupation codes are used. The same basic pattern holds for each race/ethnicity group: sorting across occupations as defined by SOC codes explains far more of the pay differentials by race/ethnicity than does sorting across EEO-1 job categories; and sorting
___________________
13 The coefficient estimates and standard errors corresponding to Figure 6-5 are in Appendix 6-6.
SOURCE: Panel generated from ACS, 2018.
NOTE: Percent differences from White males (natural log). All differences from White males are statistically significant except those bars that are not filled in. These bars show the estimated differences based on the following progressively more detailed specifications of the models: basic, followed by adding occupations, industry, geography (states), the natural log of the hours worked, and education and age (without including the log of the hours worked).
on industry conditional on occupation is far more important for explaining pay differentials when the broad EEO-1 categories are used to measure occupation. Additionally, including controls for state has a similar effect on pay differentials by sex and race/ethnicity, regardless of which occupation categorization is used.
The most useful question addressed in this subsection is the extent to which, controlling for industry, EEO-1 job categories, and geography, pay differentials by sex and race/ethnicity replicate pay differentials that use SOC categories for occupation. This can be done through a direct comparison of the coefficient estimates represented by the yellow bars in Figures 6-4 and 6-5. For some race/ethnicity groups, controlling for EEO-1 job categories, industry, and geography leads to estimated pay differentials close to those estimated when using SOC codes. This is true for Asian workers and people reporting two or more races. For other race/ethnicity groups, there are marked differences in estimated pay differentials between EEO’d occupations and SOC codes, and the same is true for females relative to males. In all cases, use of SOC codes leads to smaller (sometimes considerably so) estimated pay differentials. For example, the pay gap for women is 25 percent when occupation is EEO’d but 10 percent when SOC codes are used, and the pay gap for Black workers is 16 percent when EEO-1 job categories are used but 9 percent when SOC codes are used.14
Occupational sorting matters to estimated pay gaps in ways that cannot be captured by combining sorting across EEO-1 job categories with sorting across industries and geography.
In addition to replacing SOC codes with EEO-1 job categories, ACS data were further EEO’d by replacing individual workers’ reports of pay in the last 12 months with the corresponding Component 2 pay band. As previously described, the worker was assigned a measure of annual pay set as either the midpoint of that pay band (for interior pay bands) or the median pay in the worker’s state (for the top and bottom pay bands, for which a much wider range of pay is included).15
Whether this coarsening of earnings, which also introduces measurement error, has a meaningful impact on the estimated pay differentials across sex and race/ethnicity was then examined. That was done by estimating versions of Eq. 6.a that use the (natural) log of pay as the dependent variable, set to be equal for all workers in the same pay band. Figure 6-6 reports results using both EEO-1 job categories and the coarsened pay
___________________
14 The magnitudes differ but the patterns are the same when comparing pay differentials controlling for hours worked. The relevant coefficient estimates are represented by the dark blue bars in Figures 6-4 and 6-5 (and Appendixes 6-3 and 6-4).
15 The results are similar when medians-by-state are used for all pay bands.
measure that can be compared directly to Figure 6-4.16 Interestingly, the results in Figure 6-6 are quite similar to those in Figure 6-4, suggesting that, unlike the impact of the EEO’d occupations, using pay-band data rather than individual-level wage data does not have a marked impact on estimated pay differentials.17
The finding that the results are not much affected by the EEO’d pay measure does not imply that pay-band data are an acceptable substitute in all circumstances. The ACS sample has more than one million observations, allowing statistically significant average differences across workers at the national level to be uncovered, even when pay data are coarsened. More granular analyses may not be able to do this. The bottom box in Appendix 6-4 contains breakdowns of the percentages of workers in each pay band in the ACS sample, both for the overall samples and for each job category. For example, fully 25 percent of the ACS sample is in the lowest pay band. Workers are even more concentrated into pay bands in specific job categories. For example, 58 percent of service workers are in the lowest pay band. On the other end of the pay-band spectrum, 31 percent of executives are in the top pay band. Due to this disproportionate concentration of workers in certain pay bands, it is impossible to examine pay differences by sex or race/ethnicity for the lowest-earning workers once pay data are EEO’d. This problem is even more serious when examining workers within job categories.
Comparison 2: Component 2 Data and EEO’d ACS Data
Next, Component 2 data from 2018 were used to run similar log pay equations to those run on ACS data. Prior to using Component 2 data, various adjustments and corrections were employed, as advised in Chapters 3–5. The data filtering process eliminated 56 percent of the worker observations in Component 2 data.18 The process removed observations and cells that had apparently spurious data. For example, establishments larger than any known current establishment in the United States were removed, and establishments for which there were inconsistencies across the two years were also removed. The fraction of eliminated establishments was far less than the fraction of eliminated workers.
The results of these modifications on the numbers of employees by various observable characteristics are detailed in Appendixes 6-1 to 6-3.
___________________
16 Full regression results corresponding to Figure 6-6 are in Appendix 6-7.
17 Versions of the regressions in which the EEO’d measure for pay was used but SOC codes were used for occupation were also examined. The results are not qualitatively different from those reported in Figure 6-3 that use reported ACS earnings.
18 To measure the importance of deleting the observations, the regressions were also rerun using all observations, with little impact on the results.
SOURCE: Panel generated from ACS, 2018.
NOTE: Percent differences from White males (natural log) are shown. All differences from White males are statistically significant except those bars that are not filled in. These bars show the estimated differences based on the following progressively more detailed specifications of the models: basic, followed by adding occupations, industry, geography (states), the natural log of the hours worked, and education and age (without including the log of the hours worked).
The panel is confident that the excluded cells have some type of error. But, given the large reduction in the dataset, it is unknown how representative the resulting data are relative to the population covered by EEO-1 Component 2 reporting requirements. This section will compare pay differentials in the remaining 2018 Component 2 data to the results from the ACS sample.
As previously described in Chapter 5, a unit of observation in the Component 2 data is a sex-race/ethnicity-occupation-pay band (SROP) cell. Pay, as noted previously, is the approximate midpoint of each of the ranges in the pay bands except for the upper and lower bands. For a given establishment, each SROP cell identifies workers reported to have the same sex, race/ethnicity, occupation, and pay band. The data provide the number of workers in each pay band and the annual number of hours that those employees, as a group, are reported to have worked.
The panel could therefore estimate (weighted) regressions that are versions of Eqs. 6.a and 6.b, in which the unit of observation is an SROP cell, the dependent variable is the (natural) log of a measure of pay in the pay band of the SROP cell, and the weights are the number of workers in the cell. These regressions are the exact analogue to those run on the ACS sample.
As with the ACS sample, the coefficients on the sex, race/ethnicity, and interactions dummy variables are of interest. Here, EEO-1 job category, industry (with detailed NAICS codes), and annual hours worked the natural log of can be controlled. While detailed SOC codes are not available for Component 2 data, the establishment to which a SROP cell belongs is known. That additional detail allows regressions to be run that control for the establishment of the workers, allowing “within”-establishment pay differentials across workers to be estimated (also known as regressions with establishment fixed effects).
Figure 6-7 reports the coefficient results from estimating versions of Eqs. 6.a and 6.b without additional controls, and this figure can be compared to ACS results in Figure 6-3.19 Women in the Component 2 data earn 23 percent less than men; compared to White workers, Black workers earn 34 percent less; Hispanic workers earn 30 percent less; Native Hawaiian and Other Pacific Islander workers earn 29 percent less; American Indian/Alaska Native workers earn 28 percent less; and those reporting two or more races report 34 percent less. Asian workers out-earn White workers by four percent.
The patterns across the two datasets are not artifacts of including coarse pay-band earnings data in the Component 2 data. The related
___________________
19 The large size of the Component 2 dataset yields standard errors for the estimated regression coefficients that are always statistically significantly different from zero at conventional levels. Full regression results from the Component 2 data are found in Appendix 6-8.
SOURCE: Panel generated from Component 2 employer, establishment, and employee files for 2018.
NOTE: Excludes data based on all rules in Appendix 6-1.
regression results from ACS data that coarsen pay to be similar to that of Component 2 pay bands (Figure 6-5, light blue bars) yield the same patterns.
Estimated pay differentials are of the same signs in Component 2 data and ACS data. For some groups, the pay gaps are also similar in magnitude across the two datasets. Indeed, the pay differentials for Hispanic workers and Black workers in the Component 2 data are within two to four percentage points of the estimates in the ACS data.
But, for other groups, the results across the two datasets are sufficiently different to merit comment, with some gaps larger in ACS data and some larger in Component 2 data. The pay difference between women and men is one important divergence—the pay gap in Component 2 data is 12 percentage points narrower than in ACS data. The pay gap between Asian workers and White workers is 10 percentage points narrower in Component 2 data than in ACS data. Conversely, the pay gap between Native Hawaiian or Other Pacific Islander workers and White workers is much larger in Component 2 data than in ACS data.
The same kinds of patterns replicate when the estimated coefficients on versions of Eq. 6.b are compared using Component 2 data and ACS data (Figure 6-8). For men, some estimated race/ethnicity pay gaps relative to White men are similar in Component 2 and ACS data (e.g., for Black and Hispanic workers), some are smaller in Component 2 data (e.g., Asian workers, where the pay advantage is smaller), and some are much larger (e.g., Native Hawaiian or Other Pacific Islander workers). The coefficients for pay gaps between females of all race/ethnicity groups and White men are smaller in Component 2 data than in ACS data to varying degrees, largely driven by the much smaller overall male/female average pay gap in Component 2 data.
The fact that the differences across the two datasets vary in direction and magnitude suggests that there is no one underlying explanation for that divergence. It is therefore of great importance to examine pay differentials after controlling for observable differences between the workers and their workplaces in both datasets. For brevity, detailed results from regressions of the form in Eq. 6.a will be compared here, but full results appear in Appendix 6-9.
Figure 6-9 reports results from regressions that control for EEO-1 job category, and then additional controls for industry and state were added
SOURCE: Panel generated from Component 2 employer, establishment, and employee files for 2018.
NOTE: Excludes data based on all rules in Appendix 6-1.
SOURCE: Panel generated from Component 2 employer, establishment, and employee files for 2018.
NOTE: Excludes data based on all rules in Appendix 6-1. Percent differences from White males (natural log) are shown. All differences from White males are statistically significant. These bars show the estimated differences based on the following progressively more detailed specifications of the models: basic (race/ethnicity and sex), followed by successively adding occupation, industry, geography (states), and establishment fixed effects (without industry and geography (states).
sequentially. These results are directly comparable to Figure 6-5, which uses ACS data, but in this figure EEO’d ACS data were used, so that pay was transformed into pay-band earnings and EEO-1 job categories were used for occupation.
Even after adding these controls, some key differences (and similarities) remain in the results across the two datasets. Notably, the pay gap for women is still much lower (by 10 percentage points) in the Component 2 data than in the ACS data (Figure 6-6). For Asian workers, adding the controls leads to an estimated pay disadvantage relative to White workers in ACS data but still yields an estimated pay benefit for Asian workers in Component 2 data (with a divergence across the two datasets of eight percentage points). For some groups, however, controlling for observables does align the pay gaps across the two datasets so that they are more similar; for example, the pay gap for Native Hawaiian or Other Pacific Islander workers is very similar across the two datasets once these controls are added, and a good portion of this alignment happens as the result of adding state controls.
Regressions were also estimated in which the log of hours worked by the average employee in the SROP was controlled for (results not reported). Once job categories, industry, and state controls are in the regression, controlling for hours worked generally has little additional effect on estimated pay gaps for almost all groups. Moreover, the estimated coefficient on the log hours worked variable (the elasticity of annual earnings with respect to hours worked) is unreasonably low (0.26). All of this is expected given that there are numerous errors in the hours worked information in the Component 2 data (see Chapters 4 and 5), and given that, as demonstrated using ACS data, controlling for high(er) quality hours-worked data does not meaningfully change estimated pay gaps for most groups.
Digging more deeply into the reasons why results using Component 2 data differ from those using ACS data would require considerably more effort and resources. The pay differentials estimated in Component 2 data are of magnitudes that the panel deems reasonable, but those differentials may still over- or understate pay differences in the underlying population of covered firms and establishments. Moreover, the fact that the pay differentials across the two datasets are similar for Black and Hispanic workers but diverge for other workers (e.g., Asian workers) does not mean that Component 2 data are of higher quality for detecting pay differences between White workers and Black or Hispanic workers than between White and Asian workers.
Users of the Component 2 data, including EEOC, are advised to work carefully and intensively with 2018 Component 2 data to better understand their properties relative to the underlying population, and to ensure that any data utilized are not error-ridden. The panel reiterates that the data used for analysis from the 2018 Component 2 data eliminated a large number of
workers and establishments from the initial data, hopefully reducing error, but there are still many unknowns about what a more representative and accurate data collection would yield.
Comparison 3: ACS Data and EEO’d ACS, Adding Controls for Education and Age
Next, estimates from both the detailed ACS sample and the less detailed, EEO’d ACS sample were compared after the inclusion of human capital covariates. A series of indicator variables were created for educational attainment, using the ACS variable “educd,” which indicates all levels of education, including separate codes for bachelor’s degrees, professional degrees, and master’s or doctoral degrees. The education indicators and a quartic in age (in years) to proxy for potential labor-market experience were included in the regressions, along with controls for occupation, industry, and geography (but not the log of annual hours worked). For detailed ACS data, the dependent variable was the log of earnings, and the occupation was the individual’s SOC code, as a set of dummy variables. For EEO’d data, the dependent variable was the log of the pay-band earnings, and the occupation was the relevant EEO-1 job category. Results for detailed ACS data are shown in Figure 6-4 (green bars), and those for EEO’d data are shown in Figure 6-6. The impact of including education and age variables can be seen by comparing the green bars to the yellow bars, which report coefficient estimates from versions of Eq. 6.a that control for occupation, industry, and geography (state) but not the log of annual hours worked.
Figure 6-4 shows that including information on education and age in the detailed ACS regressions had mixed impacts on estimated pay gaps. Including this information did not meaningfully change estimated pay gaps for many groups relative to men or White workers, but it did reduce the pay gap for Hispanic workers relative to White workers by five percentage points. It increased the pay disadvantage for Asian workers by six percentage points, and it reduced the pay gap for those with two or more races by seven percentage points.
The results shown in Figure 6-6 are similar, but given that job categories are substantially less predictive of pay differences than SOC codes, it is not surprising that controlling for age and education had a somewhat larger impact when data were EEO’d. For example, with detailed ACS data, adding the human capital variables reduced the pay gap for Black workers from nine to eight percent; when data were EEO’d, adding these variables reduced the pay gap for Black workers from 16 to 13 percent. The importance of these differences will depend on how they are interpreted and used, but clearly differences in relevant productivity-related variables
can have measurable effects on sex and race/ethnicity pay gaps net of EEO occupation groups.20
Comparison 4: Component 2 Data, Adding Establishment Fixed Effects
To understand the impact of measuring pay differences for employees in the same occupation and in the same establishment, the estimation for Component 2 data using Eq. 6.a was rerun, controlling for job categories and adding establishment fixed effects21 (Figure 6-9, dark blue bars).
The within-establishment pay gap for women fell from 15 to 10 percent when industry and state indicators were replaced by establishment fixed effects (since they were subsumed by separate establishment identifiers). For race/ethnicity groups, pay gaps relative to White workers narrowed from between one percentage point (Black workers) to four percentage points (two or more races), relative to what industry and geography can capture.
These results highlight that clear sorting exists across establishments by race/ethnicity and especially by sex, in ways that are related to earnings and not fully captured by industry and state codes. Specifically, women and non-White workers work, on average, in lower-paying establishments. The clear advantage in using EEO-1 pay data to explain pay gaps is the inclusion of establishment and firm information in those data.
SUMMARY
This chapter first described an assessment of the estimation of pay differentials by sex and race/ethnicity in ACS data, using reported information on pay, occupation, industry, and geography, and then alternatively when using EEO-1 measures of occupation (job categories) and pay (pay bands). Pay differentials were then estimated in the constructed Component 2 data and their reliability was investigated.
Using EEO-1 job categories obscures the importance of sorting of workers by sex and race/ethnicity across occupations. Based on EEO-1 job categories alone, similarly situated workers will, in at least some cases, be working in very different occupations with very different pay structures. Using pay-band information instead of individual-level wage information on
___________________
20 ACS data do not contain information on actual labor-market experience or on tenure in the current job. Given that labor-market interruptions after the completion of schooling are well known to be more common in some groups (e.g., women and Black workers) than others (e.g., White men), controlling only for age and education in these regressions is not adequate to fully control for human capital differences across workers.
21 Industry and geography codes were dropped as they were perfectly co-linear with the establishment fixed effects.
earnings does not markedly affect the estimation of national differences in pay by sex and race/ethnicity, but the panel cautions that the top and bottom pay bands are very large and, for some job categories, encompass too many workers at various levels of individual pay to allow for comparisons of pay differentials at finer levels of disaggregation.
As estimated using the constructed Component 2 data, pay differentials are not unreasonable in magnitude, but for some groups of workers, the differentials differ markedly from those estimated using ACS data. The panel did not have the capacity to fully explore the reasons for these discrepancies, as many discrepancies are not eliminated by controlling for observable worker characteristics. The ACS sample also includes workers in smaller firms, which may also affect comparisons. Measurement or data-quality issues in ACS data could affect comparisons of pay differentials. These include (but are not limited to) the following examples: the ACS earnings data reflect earnings from all jobs held by an individual; self-reported earnings in the ACS may underestimate earnings among high wage earners and overestimate them among low wage earners (Kim and Tamborini, 2012a,b); and self-reported occupation may be subject to “upcoding” (Abraham et al., 2009).
The Component 2 data clearly demonstrate that workers who differ by sex and race/ethnicity are sorted across establishments in ways that affect pay differentials across these groups. Understanding the importance of the ways pay is determined within and between establishments is an important tool for understanding pay differentials more generally.
2018 Component 2 data have many limitations. Users of both 2017 and 2018 data are advised to be aware of the data limitations raised in this report and those discussed in the Component 2 data cleaning and post-processing report (EEOC, 2020h), and users are recommended to conduct careful checks that surpass those the panel could undertake. All conclusions listed below were made based on the panel’s assessment of the measurement of pay differentials in Component 2 data, but those recommendations fully align with those provided throughout the report.
Reasonable estimates of national-level pay differentials can be obtained by sex and race/ethnicity in the data examined in this chapter, but further analysis is advised if those estimates are to be used by EEOC for enforcement or research purposes.
EEO-1 job categories are too coarse to capture important pay differences across occupations that are associated with the sorting of workers into occupations by sex and race/ethnicity. In the panel’s opinion, future data collections should move to the collection of SOC-based occupation information.
Pay-band information can be used to generate national-level average pay differentials across sex and race/ethnicity that are similar to results generated using individual-level pay data. This happens because, in the very large group of workers studied at the national level, there is sufficient variation in the characteristics of workers across pay bands. However, this would not be the case for examinations of pay differentials that are narrower in scope. In particular, the lowest and highest pay bands are so wide as to encompass large fractions of employees, particularly in certain EEO-1 job categories, so that no measurable differences of pay are available for many workers. In the panel’s opinion, future data collections should capture information on individual-level pay to allow for more granular estimates of pay differences.
Hours-worked information in the Component 2 data appears to be poorly measured such that it does not allow for the useful measurement of pay differentials in (hourly) wage rates. This limitation exists even in the analysis subsample used in this chapter—one for which many data quality filters had been applied. In the panel’s judgment, future data collections should improve the quality of hours-worked information.
CONCLUSION
A conclusion based on the findings of this chapter is presented below.
CONCLUSION 6-1: After cleaning, 2017–2018 Component 2 data could be used to obtain estimates of raw pay gaps at the national level by sex, race/ethnicity, and occupation.
CHAPTER APPENDIXES
APPENDIX 6-1
EEO-1 Component 2 Adjustments
As described in Chapters 3, 4, and 5, preliminary edits were undertaken to remove clearly problematic Component 2 data in the first stage of analysis. Type 6 reports were excluded because they did not include data on race/ethnicity, occupation, and pay. Firms reporting employment greater than that of the largest employer in the United States, which reported 1.4 million employees, were also excluded. The second column of Appendix 6-2 presents the resulting baseline total of 112.7 million employees by race/ethnicity, sex, job category, size of firm, federal contractor status, and industry.
The third column of Appendix 6-2 removes additional establishments that were outliers in employee counts in Component 2 data. Their employee counts were deemed implausible, either because they exceeded the largest-known establishment size (about 60,000 employees) or because numbers reported were simultaneously more than nine times those reported in the 2018 Component 1 data for that establishment and show differences between Component 1 and Component 2 employee counts for 2018 of at least 400 employees. This filter reduced the counts to 64 million employees, or 57 percent of the baseline. (This filter had the largest effect on employee counts in Appendix 6-2.)
The third filter excluded establishments in Component 2 data that could not be matched to Component 1 data, since the quality of employee counts could not be verified. This process eliminated another nine percent of the employees, shown in Column 4 of Appendix 6-2.
The last round of editing to create the regression sample involved applying filters for problematic data on hours worked (discussed in detail below) and excluding cells that had any missing data from the pay-gap analysis. The final column of Appendix 6-2 shows the final employee counts for the remaining dataset, with a total of 50 million, or 44 percent of the baseline counts of employees (or 22% of the non-zero cells with counts of employees).
The reduction in employee counts that resulted from these adjustments varied by characteristic, however. Larger than average drops in employee counts were seen for Hispanic workers (dropping to 41% of baseline), Native Hawaiian or Other Pacific Islander workers (36%), American Indian/Alaska Native workers (39%), executives (19%), and establishments with fewer than 100 employees (38%). Much smaller than average drops in employee counts were seen for Asian American workers (dropping to 50% of baseline), professionals (47%), sales workers (56%), establishments
with 250–499 employees (55%), those with 500–999 employees (47%), and federal contractors (52%). The proportional decrease in the numbers of employees from Column 2 to Column 5 also varied greatly by industry. The largest percentage drops in employee counts were in agriculture, mining, wholesale trade, real estate, management, educational services, other services, and public administration.
Appendix 6-3 displays the total hours worked reported by employers and a similar sequence of adjustments across the columns. Column 2 applies the same initial outlier rule as in Appendix 6-2, removing firms with Type 6 reports or that were larger than the largest known firm. This baseline is 118 billion hours worked. Removing establishments with implausibly high hours worked per employees reduced the total to 96 billion hours worked, or 81.5 percent of the baseline (Column 3). Outliers with hours-worked cells more than three standard deviations from the mean of each SROP were also dropped, marginally reducing the total, which still rounded to 96 billion hours worked (Column 4). The final column of Appendix 6-3 reports hours worked for the same set of establishments in the final column of Appendix 6-2: those not excluded by the filters for employment and those without missing data on regression variables.22 The total of 76 billion hours worked in the final column is 64 percent of the baseline hours worked in the initial data.
As with employment, the hours-worked adjustments affected some groups more than others. While the adjustments varied for sex and race/ethnicity groups, the largest differed from the average by five percentage points. The biggest differences in adjustments involved variables for job category, establishment size, and industry.
The final sample of establishments for the regression analysis reports 76 billion hours worked (Appendix 6-3) for 50 million employees (Appendix 6-2), for an average of 1,531 hours worked per employee.
___________________
22 This column also excludes a small number of cells with no employees reported.
APPENDIX 6-2
Number of Employees, by Selected Employee and Establishment Characteristics: 2018
| Employee and Establishment Characteristic | Component 2 (Unedited) (Only Exclude the Extreme Firm Size Outliers)a | Component 2 (Maxima Applied) | Component 2 (Maxima Applied and Non-Matches Removed) | Final Edited Data When All Edits Are in Place | |
|---|---|---|---|---|---|
| Race/Ethnicity | |||||
| Hispanic | 18,190,363 | 9,814,302 | 8,138,649 | 7,462,194 | |
| White | 67,771,550 | 38,379,821 | 32,054,088 | 29,687,614 | |
| Black/African American | 16,235,123 | 9,764,824 | 8,114,521 | 7,492,356 | |
| Native Hawaiian or Other Pacific Islander | 654,370 | 300,699 | 262,793 | 235,994 | |
| Asian | 6,655,007 | 4,004,308 | 3,574,248 | 3,330,861 | |
| Native American/Alaska Native | 699,606 | 356,940 | 300,430 | 274,964 | |
| Two or More Races | 2,461,857 | 1,535,154 | 1,226,151 | 1,132,361 | |
| Sex | |||||
| Male | 57,753,516 | 32,767,875 | 27,525,706 | 25,429,036 | |
| Female | 54,914,360 | 31,388,173 | 26,145,174 | 24,187,308 | |
| Job Category | |||||
| Executive | 3,867,316 | 1,115,682 | 851,482 | 733,882 | |
| First/Midlevel | 11,625,579 | 6,488,531 | 5,372,463 | 5,008,445 | |
| Professionals | 21,791,200 | 13,056,010 | 11,257,033 | 10,342,682 | |
| Technicians | 6,936,129 | 3,719,137 | 3,203,644 | 2,925,548 | |
| Sales Workers | 10,561,595 | 7,372,567 | 6,093,798 | 5,878,204 | |
| Administrative Support | 14,003,620 | 7,929,296 | 6,691,626 | 6,229,372 | |
| Craft Workers | 5,971,061 | 3,342,690 | 2,824,998 | 2,558,991 | |
| Operatives | 11,710,199 | 6,111,329 | 5,291,923 | 4,865,954 | |
| Laborers and Helpers | 8,451,228 | 4,706,811 | 3,868,123 | 3,502,298 | |
| Service Workers | 17,749,949 | 10,313,995 | 8,215,790 | 7,570,968 | |
| Number of Employees | |||||
| Less than 100 | 33,035,190 | 16,889,911 | 13,409,200 | 12,558,409 | |
| 100–249 | 28,253,879 | 14,937,493 | 13,517,771 | 12,446,269 | |
| Employee and Establishment Characteristic | Component 2 (Unedited) (Only Exclude the Extreme Firm Size Outliers)a | Component 2 (Maxima Applied) | Component 2 (Maxima Applied and Non-Matches Removed) | Final Edited Data When All Edits Are in Place | ||
|---|---|---|---|---|---|---|
| 250–499 | 14,821,209 | 9,930,597 | 8,855,726 | 8,183,381 | ||
| 500–999 | 12,424,701 | 7,055,524 | 6,363,225 | 5,901,549 | ||
| 1,000 or More | 24,132,897 | 15,342,523 | 11,524,958 | 10,526,736 | ||
| Federal Contractor | ||||||
| Yes | 51,812,201 | 33,387,367 | 28,709,616 | 26,798,137 | ||
| No | 60,348,558 | 30,734,407 | 24,930,847 | 22,793,330 | ||
| NAICS Code | Industry Sector | |||||
| 11 | Agriculture, Forestry, Fishing, and Hunting | 968,465 | 307,219 | 244,843 | 199,990 | |
| 21 | Mining, Quarrying, and Oil and Gas Extraction | 979,252 | 484,726 | 388,871 | 344,543 | |
| 22 | Utilities | 552,805 | 495,574 | 454,737 | 441,728 | |
| 23 | Construction | 3,289,431 | 1,795,913 | 1,453,977 | 1,262,796 | |
| 31–33 | Manufacturing | 19,131,122 | 10,104,097 | 8,812,210 | 8,016,794 | |
| 42 | Wholesale Trade | 4,905,647 | 2,077,105 | 1,644,062 | 1,506,046 | |
| 44–45 | Retail Trade | 13,260,679 | 10,229,311 | 8,809,144 | 8,561,894 | |
| 48–49 | Transportation and Warehousing | 4,803,385 | 3,086,063 | 2,641,680 | 2,475,126 | |
| 51 | Information | 3,018,710 | 2,098,462 | 1,876,352 | 1,800,435 | |
| 52 | Finance and Insurance | 7,943,392 | 4,575,968 | 3,830,759 | 3,690,200 | |
| 53 | Real Estate and Rental and Leasing | 1,872,925 | 737,595 | 570,950 | 529,665 | |
| 54 | Professional, Scientific, and Technical Services | 6,222,468 | 4,284,129 | 3,654,007 | 3,406,106 | |
| 55 | Management of Companies and Enterprises | 2,562,559 | 811,486 | 697,481 | 670,014 | |
| 56 | Administrative and Support and Waste Management and Remediation Services | 6,128,461 | 3,349,228 | 2,766,576 | 2,533,647 |
| 61 | Educational Services | 1,420,683 | 554,020 | 459,271 | 395,526 |
| 62 | Health Care and Social Assistance | 22,319,596 | 11,425,581 | 9,620,107 | 8,472,960 |
| 71 | Arts, Entertainment, and Recreation | 1,509,877 | 1,078,364 | 953,075 | 861,559 |
| 72 | Accommodation and Food Services | 7,133,987 | 4,960,580 | 3,776,255 | 3,569,881 |
| 81 | Other Services (except Public Administration) | 3,632,412 | 1,284,729 | 884,019 | 776,045 |
| 92 | Public Administration | 299,019 | 91,517 | 68,981 | 56,303 |
| 99 | Unclassified | 713,001 | 324,381 | 63,523 | 45,086 |
SOURCE: Panel generated from Component 2 employer, establishment, and employee files for 2018.
NOTE: Overall, the final edited data had 44 percent of the employees reported in the original unedited data. In terms of non-zero data cells, 22 percent were discarded to produce the final column.
a Extreme firm size outliers refer to firms reporting more than 1.4 million employees—a number larger than the largest U.S. employer.
APPENDIX 6-3
Hours Worked in Thousands, by Employee and Establishment Characteristics: 2018
| Employee and Establishment Characteristic | Unedited (Excludes Extreme Firm Size Outliers)a | Excludes Average Hours Worked per Employee Greater Than 5,840 (Excludes Red Flag) | Also Excludes Hours Worked >3 Standard Deviations (SDs) from Mean for SROP (Excludes Orange Flag) | Final Edited Data When All Edits Are in Place | |
|---|---|---|---|---|---|
| Race/Ethnicity | |||||
| Hispanic | 18,150,016.3 | 14,363,473.9 | 14,360,785.3 | 11,130,930.9 | |
| White | 70,823,667.6 | 59,239,283.7 | 59,236,570.5 | 46,873,143.6 | |
| Black/African American | 17,093,983.6 | 13,241,643.5 | 13,239,450.8 | 10,361,008.0 | |
| Native Hawaiian or Other Pacific Islander | 526,555.0 | 490,994.3 | 488,079.1 | 344,441.3 | |
| Asian | 9,173,269.9 | 6,667,425.2 | 6,663,142.7 | 5,409,958.1 | |
| Native American/Alaska Native | 587,385.2 | 565,463.9 | 561,771.2 | 399,786.7 | |
| Two or More Races | 2,070,934.5 | 1,904,799.2 | 1,902,649.9 | 1,420,137.4 | |
| Sex | |||||
| Male | 67,793,486.7 | 52,017,945.1 | 52,010,078.2 | 41,587,992.4 | |
| Female | 50,632,325.3 | 44,455,138.6 | 44,442,371.3 | 34,351,413.6 | |
| Job Category | |||||
| Executive | 2,004,510.9 | 1,830,656.7 | 1,830,366.3 | 1,368,153.7 | |
| First/Midlevel | 17,904,978.2 | 11,797,384.8 | 11,796,786.7 | 9,356,221.5 | |
| Professionals | 24,059,856.6 | 22,088,797.0 | 22,084,175.4 | 17,160,826.6 | |
| Technicians | 6,164,942.3 | 5,760,872.7 | 5,755,649.1 | 4,581,158.4 | |
| Sales Workers | 9,347,089.2 | 8,954,726.5 | 8,953,204.8 | 7,370,338.4 | |
| Administrative Support | 13,617,845.4 | 12,053,291.8 | 12,051,603.1 | 9,718,183.4 | |
| Craft Workers | 10,024,720.9 | 5,948,193.1 | 5,946,140.8 | 4,708,263.8 | |
| Operatives | 14,672,154.0 | 10,674,486.4 | 10,673,977.1 | 8,559,719.4 | |
| Laborers and Helpers | 7,459,483.2 | 6,203,739.1 | 6,201,678.2 | 4,685,316.5 | |
| Service Workers | 13,170,231.4 | 11,160,935.5 | 11,158,868.1 | 8,431,224.2 | |
| Employee and Establishment Characteristic | Unedited (Excludes Extreme Firm Size Outliers)a | Excludes Average Hours Worked per Employee Greater Than 5,840 (Excludes Red Flag) | Also Excludes Hours Worked >3 Standard Deviations (SDs) from Mean for SROP (Excludes Orange Flag) | Final Edited Data When All Edits Are in Place | |||
|---|---|---|---|---|---|---|---|
| Number of Employees | |||||||
| Less than 100 | 29,386,062.9 | 24,626,217.7 | 24,620,443.6 | 17,574,746.5 | |||
| 100–249 | 25,819,625.8 | 23,163,953.4 | 23,160,093.8 | 18,791,525.3 | |||
| 250–499 | 22,694,211.0 | 15,466,795.7 | 15,463,631.3 | 12,947,806.4 | |||
| 500–999 | 11,734,965.9 | 11,290,062.6 | 11,288,233.0 | 9,609,660.1 | |||
| 1,000 or More | 28,789,207.0 | 21,924,314.9 | 21,918,308.5 | 17,015,667.7 | |||
| Federal Contractor | |||||||
| Yes | 65,630,263.4 | 53,891,829.8 | 53,881,081.2 | 43,581,825.1 | |||
| No | 52,720,007.8 | 42,530,332.3 | 42,520,451.3 | 32,318,946.7 | |||
| NAICS Code | Industry Sector | ||||||
| 11 | Agriculture, Forestry, Fishing, and Hunting | 951,771.2 | 494,638.0 | 494,618.4 | 337,894.5 | ||
| 21 | Mining, Quarrying, and Oil and Gas Extraction | 952,074.8 | 918,915.0 | 918,347.6 | 690,957.9 | ||
| 22 | Utilities | 1,070,493.5 | 1,065,322.3 | 1,065,139.4 | 881,064.0 | ||
| 23 | Construction | 3,622,565.1 | 2,803,315.2 | 2,803,057.3 | 2,091,478.4 | ||
| 31–33 | Manufacturing | 27,167,211.8 | 19,002,286.9 | 18,998,970.3 | 14,914,836.5 | ||
| 42 | Wholesale Trade | 3,939,782.6 | 3,481,017.3 | 3,480,818.4 | 2,611,152.9 | ||
| 44–45 | Retail Trade | 13,172,177.6 | 12,870,636.5 | 12,868,486.2 | 11,017,662.3 | ||
| 48–49 | Transportation and Warehousing | 6,015,737.3 | 4,666,309.4 | 4,665,341.8 | 3,893,170.8 | ||
| Employee and Establishment Characteristic | Unedited (Excludes Extreme Firm Size Outliers)a | Excludes Average Hours Worked per Employee Greater Than 5,840 (Excludes Red Flag) | Also Excludes Hours Worked >3 Standard Deviations (SDs) from Mean for SROP (Excludes Orange Flag) | Final Edited Data When All Edits Are in Place | |
|---|---|---|---|---|---|
| 51 | Information | 3,518,913.7 | 3,502,416.0 | 3,502,228.5 | 3,058,588.8 |
| 52 | Finance and Insurance | 7,913,652.1 | 7,690,660.6 | 7,690,505.1 | 6,594,580.1 |
| 53 | Real Estate and Rental and Leasing | 1,336,260.9 | 1,163,436.5 | 1,163,352.7 | 848,131.8 |
| 54 | Professional, Scientific, and Technical Services | 11,781,754.8 | 6,963,847.2 | 6,962,974.6 | 5,732,300.4 |
| 55 | Management of Companies and Enterprises | 1,486,566.6 | 1,463,258.6 | 1,463,143.6 | 1,178,874.5 |
| 56 | Administrative and Support and Waste Management and Remediation Services | 5,049,283.0 | 4,520,911.1 | 4,520,284.9 | 3,481,781.0 |
| 61 | Educational Services | 718,358.7 | 685,543.5 | 685,457.2 | 525,216.3 |
| 62 | Health Care and Social Assistance | 20,513,376.5 | 17,343,564.3 | 17,334,078.6 | 12,040,438.4 |
| 71 | Arts, Entertainment, and Recreation | 1,198,151.9 | 1,128,907.3 | 1,128,701.1 | 850,609.5 |
| 72 | Accommodation and Food Services | 5,779,936.6 | 4,885,745.1 | 4,884,949.6 | 3,988,675.2 |
| 81 | Other Services (except Public Administration) | 1,693,338.4 | 1,430,160.1 | 1,430,039.1 | 1,055,223.2 |
| Employee and Establishment Characteristic | Unedited (Excludes Extreme Firm Size Outliers)a | Excludes Average Hours Worked per Employee Greater Than 5,840 (Excludes Red Flag) | Also Excludes Hours Worked >3 Standard Deviations (SDs) from Mean for SROP (Excludes Orange Flag) | Final Edited Data When All Edits Are in Place | |
|---|---|---|---|---|---|
| 92 | Public Administration | 163,937.7 | 127,018.6 | 126,949.7 | 79,832.8 |
| 99 | Unclassified | 380,467.2 | 265,174.2 | 265,005.3 | 66,936.4 |
SOURCE: Panel generated from Component 2 employer, establishment, and employee files for 2018.
a Extreme firm size outliers refer to firms reporting more than 1.4 million employees--a number larger than the largest U.S. employer.
APPENDIX 6-4
Key Summary Statistics
| Measure | ACS Data | Component 2 Data | ||
|---|---|---|---|---|
| Mean | SD | Mean | SD | |
| ln(Annual Pay) | 10.413 | 0.914 | 10.636 | 1.318 |
| ln(Annual Hours Worked) | 7.466 | 0.520 | 7.132 | 1.506 |
| Male | 0.553 | 0.513 | ||
| Female | 0.447 | 0.487 | ||
| White (Non-Hispanic) | 0.602 | 0.598 | ||
| Hispanic | 0.193 | 0.150 | ||
| Black/African American | 0.118 | 0.151 | ||
| Native Hawaiian or Other Pacific Islander | 0.002 | 0.005 | ||
| Asian | 0.060 | 0.067 | ||
| American Indian/Alaska Native & Not Hispanic | 0.005 | 0.006 | ||
| Two or More Races | 0.022 | 0.023 | ||
| Executives | 0.008 | 0.015 | ||
| Managers | 0.093 | 0.101 | ||
| Professionals | 0.165 | 0.208 | ||
| Technicians | 0.027 | 0.059 | ||
| Sales Workers | 0.124 | 0.118 | ||
| Administrative Support Workers | 0.149 | 0.126 | ||
| Craft Workers | 0.088 | 0.052 | ||
| Operatives | 0.122 | 0.098 | ||
| Laborers and Helpers | 0.061 | 0.071 | ||
| Service Workers | 0.164 | 0.153 | ||
| N (total workers) | 1,004,52 | 49,616,344 | ||
SOURCE: Panel generated from ACS, 2018; and Component 2 employer, establishment, and employee files for 2018.
NOTE: Excludes data based on all rules in Appendix 6-1.
APPENDIX 6-5
Percentage of Employees in Each Job Category Who Are in Each Pay Band
| $19,239 and Less | $19,240–$24,439 | $24,440–$30,679 | $30,680–$38,999 | $39,000–$49,919 | $49,920–$62,919 | $62,920–$80,079 | $80,080–$101,919 | $101,920–$128,959 | $128,960–$163,799 | $163,800–$207,999 | $208,000 and More | Total % of Workers | |
|---|---|---|---|---|---|---|---|---|---|---|---|---|---|
| COMPONENT 2 | |||||||||||||
| Totals | 27.94 | 6.23 | 7.82 | 9.75 | 10.18 | 9.44 | 8.65 | 6.94 | 4.84 | 3.18 | 1.88 | 3.15 | 100.00 |
| Executive | 2.66 | 0.64 | 0.78 | 1.14 | 1.80 | 2.72 | 4.41 | 6.63 | 8.61 | 11.14 | 12.18 | 47.30 | 1.48 |
| Midlevel | 3.97 | 1.41 | 1.99 | 3.87 | 7.98 | 11.24 | 13.28 | 14.25 | 13.25 | 11.16 | 7.18 | 10.42 | 10.09 |
| Professionals | 9.80 | 2.35 | 3.13 | 4.91 | 8.75 | 13.47 | 16.87 | 15.01 | 10.81 | 6.40 | 3.38 | 5.12 | 20.85 |
| Technicians | 29.03 | 5.02 | 7.61 | 11.31 | 13.72 | 12.63 | 10.05 | 6.01 | 2.94 | 1.11 | 0.35 | 0.23 | 5.90 |
| Sales | 51.30 | 8.84 | 8.26 | 7.05 | 5.57 | 4.52 | 3.58 | 3.02 | 2.50 | 2.05 | 1.36 | 1.97 | 11.85 |
| Admin. Support | 24.31 | 8.45 | 12.90 | 19.04 | 17.06 | 9.97 | 5.07 | 2.01 | 0.69 | 0.26 | 0.11 | 0.12 | 12.56 |
| Craft | 12.64 | 3.51 | 5.34 | 9.42 | 14.34 | 16.46 | 15.92 | 11.78 | 6.47 | 2.64 | 0.95 | 0.53 | 5.16 |
| Operatives | 19.70 | 6.04 | 9.93 | 15.69 | 17.34 | 13.92 | 9.27 | 5.60 | 1.81 | 0.52 | 0.12 | 0.06 | 9.81 |
| Laborers/Helpers | 44.91 | 9.93 | 13.30 | 14.29 | 9.47 | 4.52 | 2.08 | 0.98 | 0.31 | 0.10 | 0.04 | 0.07 | 7.06 |
| Service Workers | 58.09 | 11.22 | 11.28 | 9.15 | 5.27 | 2.58 | 1.28 | 0.52 | 0.22 | 0.11 | 0.07 | 0.21 | 15.26 |
| ACS | |||||||||||||
| Totals | 24.96 | 9.08 | 11.71 | 9.48 | 10.80 | 10.69 | 8.41 | 5.43 | 3.29 | 2.55 | 1.49 | 2.11 | 100.00 |
| Executive | 2.40 | 0.98 | 1.58 | 1.56 | 3.00 | 5.58 | 7.38 | 10.28 | 10.33 | 12.24 | 13.84 | 30.82 | 0.76 |
| $19,239 and Less | $19,240–$24,439 | $24,440–$30,679 | $30,680–$38,999 | $39,000–$49,919 | $49,920–$62,919 | $62,920–$80,079 | $80,080–$101,919 | $101,920–$128,959 | $128,960–$163,799 | $163,800–$207,999 | $208,000 and More | Total % of Workers | |
|---|---|---|---|---|---|---|---|---|---|---|---|---|---|
| Midlevel | 6.90 | 3.45 | 5.68 | 6.42 | 10.01 | 13.70 | 14.40 | 12.23 | 9.24 | 7.73 | 4.79 | 5.44 | 9.29 |
| Professionals | 11.68 | 4.08 | 5.96 | 6.32 | 10.13 | 13.55 | 14.28 | 11.20 | 7.73 | 6.18 | 3.43 | 5.45 | 16.54 |
| Technicians | 13.12 | 6.82 | 11.27 | 11.53 | 16.52 | 17.32 | 12.62 | 5.64 | 2.41 | 1.11 | 0.64 | 0.99 | 2.71 |
| Sales | 33.62 | 8.52 | 9.62 | 7.64 | 8.98 | 9.41 | 7.37 | 5.01 | 2.95 | 2.79 | 1.78 | 2.32 | 12.35 |
| Admin. Support | 27.25 | 11.01 | 15.63 | 13.88 | 12.79 | 9.42 | 5.25 | 2.41 | 1.00 | 0.63 | 0.32 | 0.40 | 14.91 |
| Craft | 12.76 | 7.12 | 12.80 | 11.42 | 15.27 | 16.40 | 12.80 | 6.61 | 2.69 | 1.41 | 0.41 | 0.31 | 8.76 |
| Operatives | 20.98 | 10.74 | 14.91 | 11.92 | 13.89 | 13.05 | 8.20 | 3.72 | 1.46 | 0.65 | 0.25 | 0.23 | 12.17 |
| Laborers/Helpers | 36.23 | 13.83 | 16.62 | 10.96 | 9.82 | 6.78 | 3.28 | 1.41 | 0.52 | 0.29 | 0.12 | 0.15 | 6.10 |
| Service Workers | 48.25 | 14.76 | 14.69 | 8.43 | 6.59 | 4.03 | 1.85 | 0.69 | 0.30 | 0.19 | 0.07 | 0.16 | 16.41 |
SOURCE: Panel generated from Component 2 employer, establishment, and employee files for 2018 and ACS, 2018.
NOTE: Excludes data based on all rules in Appendix 6-1.
APPENDIX 6-6
Regression Results Using Detailed ACS Earnings Information and SOC Codes
| Regression Model | ||||||||||||
|---|---|---|---|---|---|---|---|---|---|---|---|---|
| (1) | (2) | (3) | (4) | (5) | (6) | (7) | (8) | (9) | (10) | (11) | (12) | |
| Female | –0.353*** | –0.234*** | –0.211*** | –0.206*** | –0.154*** | 0.219*** | –0.407*** | –0.267*** | –0.242*** | –0.237*** | –0.179*** | –0.251*** |
| (0.002) | (0.002) | (0.002) | (0.002) | (0.002) | (0.002) | (0.003) | (0.003) | (0.003) | (0.003) | (0.002) | (0.002) | |
| Hispanic | –0.336*** | –0.079*** | –0.064*** | –0.106*** | –0.139*** | –0.060*** | –0.377*** | –0.095*** | –0.079*** | –0.121*** | –0.158*** | –0.076*** |
| (0.003) | (0.002) | (0.002) | (0.003) | (0.002) | (0.003) | (0.004) | (0.003) | (0.003) | (0.003) | (0.003) | (0.003) | |
| Black/African American | –0.321*** | –0.097*** | –0.090*** | –0.094*** | –0.101*** | –0.083*** | –0.443*** | –0.171*** | –0.159*** | –0.163*** | –0.146*** | –0.152*** |
| (0.004) | (0.003) | (0.003) | (0.003) | (0.003) | (0.003) | (0.005) | (0.005) | (0.005) | (0.005) | (0.004) | (0.004) | |
| Native Hawaiian or Other Pacific Islander | –0.175*** | 0.017 | 0.020 | –0.052** | –0.091*** | –0.038** | –0.286*** | –0.050* | –0.044 | –0.116*** | –0.159*** | –0.093*** |
| (0.024) | (0.021) | (0.021) | (0.021) | (0.018) | (0.019) | (0.034) | (0.028) | (0.028) | (0.028) | (0.027) | (0.025) | |
| Asian | 0.143*** | 0.037*** | 0.028*** | –0.030*** | –0.020*** | –0.094*** | 0.127*** | 0.002 | –0.005 | –0.061*** | –0.049*** | –0.125*** |
| (0.005) | (0.004) | (0.004) | (0.004) | (0.004) | (0.004) | (0.007) | (0.006) | (0.006) | (0.006) | (0.005) | (0.005) | |
| American Indian/Alaska Native | –0.342*** | –0.131*** | –0.117*** | –0.092*** | –0.089*** | –0.078*** | –0.411*** | –0.175*** | –0.164*** | –0.140*** | –0.122*** | –0.121*** |
| (0.015) | (0.013) | (0.012) | (0.012) | (0.011) | (0.012) | (0.020) | (0.018) | (0.017) | (0.017) | (0.015) | (0.016) | |
| Two or More Races | –0.210*** | –0.108*** | –0.096*** | –0.121*** | –0.111*** | –0.048*** | –0.266*** | –0.144*** | –0.131*** | –0.156*** | –0.138*** | –0.091*** |
| (0.008) | (0.007) | (0.007) | (0.007) | (0.005) | (0.006) | (0.012) | (0.010) | (0.009) | (0.009) | (0.008) | (0.008) | |
| Female*Hispanic | 0.096*** | 0.038*** | 0.033*** | 0.034*** | 0.043*** | 0.035*** | ||||||
| (0.005) | (0.005) | (0.005) | (0.005) | (0.004) | (0.004) | |||||||
| Regression Model | ||||||||||||
|---|---|---|---|---|---|---|---|---|---|---|---|---|
| (1) | (2) | (3) | (4) | (5) | (6) | (7) | (8) | (9) | (10) | (11) | (12) | |
| Female*Black/African American | 0.249*** | 0.150*** | 0.141*** | 0.142*** | 0.093*** | 0.142*** | ||||||
| (0.007) | (0.006) | (0.006) | (0.006) | (0.005) | (0.006) | |||||||
| Female*Native Hawaiian or Other Pacific Islander | 0.240*** | 0.146*** | 0.139*** | 0.137*** | 0.148*** | 0.118*** | ||||||
| (0.048) | (0.042) | (0.041) | (0.041) | (0.035) | (0.038) | |||||||
| Female*Asian | 0.036*** | 0.078*** | 0.074*** | 0.068*** | 0.063*** | 0.068*** | ||||||
| (0.010) | (0.008) | (0.008) | (0.008) | (0.007) | (0.007) | |||||||
| Female*American Indian/Alaska Native | 0.150*** | 0.096*** | 0.104*** | 0.105*** | 0.074*** | 0.094*** | ||||||
| (0.029) | (0.025) | (0.025) | (0.024) | (0.021) | (0.024) | |||||||
| Female*Two or More Races | 0.122*** | 0.078*** | 0.075*** | 0.075*** | 0.058*** | 0.090*** | ||||||
| (0.017) | (0.013) | (0.013) | (0.013) | (0.011) | (0.012) | |||||||
| Observations | 1004526 | 1004526 | 1004526 | 1004526 | 1004526 | 1004526 | 1004526 | 1004526 | 1004526 | 1004526 | 1004526 | 1004526 |
| Occ. Dummies | ✓ | ✓ | ✓ | ✓ | ✓ | ✓ | ✓ | ✓ | ✓ | ✓ | ||
| Ind. Dummies | ✓ | ✓ | ✓ | ✓ | ✓ | ✓ | ✓ | ✓ | ||||
| State Dummies | ✓ | ✓ | ✓ | ✓ | ✓ | ✓ | ||||||
| Educ. Dummies | ✓ | ✓ | ||||||||||
| age, age2, age3, age4 | ✓ | ✓ | ||||||||||
| ln(week*hr.) | ✓ | ✓ | ||||||||||
SOURCE: Panel generated from ACS, 2018.
NOTE: Standard errors in parentheses: *** p<0.01; ** p<0.05; * p<0.1.
APPENDIX 6-7
Regression Results Using ACS Detailed Earnings Information and EEO-1 Job Categories
| Regression Model | ||||||
|---|---|---|---|---|---|---|
| (1) | (2) | (3) | (4) | (5) | (6) | |
| Female | –0.353*** | –0.318*** | –0.257*** | –0.253*** | –0.180*** | –0.248*** |
| (0.002) | (0.002) | (0.002) | (0.002) | (0.002) | (0.002) | |
| Hispanic | –0.336*** | –0.156*** | –0.112*** | –0.157*** | –0.181*** | –0.089*** |
| (0.003) | (0.003) | (0.003) | (0.003) | (0.002) | (0.003) | |
| Black/African American | –0.321*** | –0.166*** | –0.140*** | –0.147*** | –0.144*** | –0.118*** |
| (0.004) | (0.003) | (0.003) | (0.003) | (0.003) | (0.003) | |
| Native Hawaiian or Other Pacific Islander | –0.175*** | –0.036 | –0.012 | –0.080*** | –0.118*** | –0.054*** |
| (0.024) | (0.024) | (0.022) | (0.023) | (0.020) | (0.021) | |
| Asian | 0.143*** | 0.081*** | 0.038*** | –0.022*** | –0.009** | –0.099*** |
| (0.005) | (0.004) | (0.004) | (0.004) | (0.004) | (0.004) | |
| American Indian/Alaska Native | –0.342*** | –0.191*** | –0.151*** | –0.126*** | –0.118*** | –0.098*** |
| (0.015) | (0.014) | (0.013) | (0.013) | (0.011) | (0.012) | |
| Two or More Races | –0.210*** | –0.144*** | –0.112*** | –0.137*** | –0.123*** | –0.055*** |
| (0.008) | (0.007) | (0.007) | (0.007) | (0.006) | (0.006) | |
| Observations | 1004526 | 1004526 | 1004526 | 1004526 | 1004526 | 1004526 |
| Occ. Dummies | ✓ | ✓ | ✓ | ✓ | ✓ | |
| Ind. Dummies | ✓ | ✓ | ✓ | ✓ | ||
| Regression Model | ||||||
|---|---|---|---|---|---|---|
| (1) | (2) | (3) | (4) | (5) | (6) | |
| State Dummies | ✓ | ✓ | ✓ | |||
| Educ. Dummies | ✓ | |||||
| age, age2, age3, age4 | ✓ | |||||
| ln(week*hr.) | ✓ | |||||
SOURCE: Panel generated from ACS, 2018.
NOTE: Standard errors in parentheses: *** p<0.01; ** p<0.05; * p<0.1.
| Regression Model | ||||||
|---|---|---|---|---|---|---|
| (1) | (2) | (3) | (4) | (5) | (6) | |
| Female | –0.348*** | –0.317*** | –0.256*** | –0.252*** | –0.194*** | –0.247*** |
| (0.002) | (0.002) | (0.002) | (0.002) | (0.002) | (0.002) | |
| Hispanic | –0.349*** | –0.172*** | –0.130*** | –0.179*** | –0.198*** | –0.109*** |
| (0.003) | (0.002) | (0.002) | (0.003) | (0.002) | (0.003) | |
| Black/African American | –0.325*** | –0.172*** | –0.145*** | –0.156*** | –0.154*** | –0.126*** |
| (0.004) | (0.003) | (0.003) | (0.003) | (0.003) | (0.003) | |
| Native Hawaiian or Other Pacific Islander | –0.186*** | –0.049** | –0.025 | –0.091*** | –0.121*** | –0.061*** |
| (0.023) | (0.023) | (0.021) | (0.022) | (0.020) | (0.020) | |
| Asian | 0.135*** | 0.074*** | 0.031*** | –0.027*** | –0.017*** | –0.099*** |
| (0.005) | (0.004) | (0.004) | (0.004) | (0.004) | (0.004) | |
| American Indian/Alaska Native | –0.341*** | –0.193*** | –0.154*** | –0.132*** | –0.126*** | –0.103*** |
| (0.014) | (0.013) | (0.012) | (0.012) | (0.011) | (0.012) | |
| Two or More Races | –0.201*** | –0.137*** | –0.107*** | –0.132*** | –0.121*** | –0.059*** |
| (0.008) | (0.007) | (0.007) | (0.007) | (0.006) | (0.006) | |
| Observations | 1004526 | 1004526 | 1004526 | 1004526 | 1004526 | 1004526 |
| Regression Model | ||||||
|---|---|---|---|---|---|---|
| (1) | (2) | (3) | (4) | (5) | (6) | |
| Occ. Dummies | ✓ | ✓ | ✓ | ✓ | ✓ | |
| Ind. Dummies | ✓ | ✓ | ✓ | ✓ | ||
| State Dummies | ✓ | ✓ | ✓ | |||
| Educ. Dummies | ✓ | |||||
| age, age2, age3, age4 | ✓ | |||||
| ln(week*hr.) | ✓ | |||||
SOURCE: Panel generated from ACS, 2018.
NOTE: Standard errors in parentheses: *** p<0.01; ** p<0.05; * p<0.1.
APPENDIX 6-9
2018 EEO-1 Component 2 Data Regression Results
| Regression Model | ||||||||||
|---|---|---|---|---|---|---|---|---|---|---|
| (1) | (2) | (3) | (4) | (5) | (6) | (7) | (8) | (9) | (10) | |
| Female | –0.2269*** | –0.2087*** | –0.1551*** | –0.1526*** | –0.1019*** | –0.2724*** | –0.2452*** | –0.1799*** | –0.177*** | –0.1176*** |
| (0.0025) | (0.0017) | (0.0012) | (0.0012) | (0.0006) | (0.0027) | (0.0019) | (0.0015) | (0.0014) | (0.0007) | |
| Hispanic | –0.3042*** | –0.0958*** | –0.0937*** | –0.1265*** | –0.1101*** | –0.3485*** | –0.1316*** | –0.1139*** | –0.1468*** | –0.1201*** |
| (0.0022) | (0.0018) | (0.0015) | (0.0016) | (0.0007) | (0.0027) | (0.0023) | (0.0018) | (0.0018) | (0.0008) | |
| Black/African American | –0.3444*** | –0.1406*** | –0.1407*** | –0.1471*** | –0.1373*** | –0.4346*** | –0.2088*** | –0.1888*** | –0.1954*** | –0.1676*** |
| (0.0021) | (0.0017) | (0.0015) | (0.0015) | (0.0007) | (0.0027) | (0.0021) | (0.0017) | (0.0018) | (0.0008) | |
| Native Hawaiian or Other Pacific Islander | –0.2882*** | –0.0668*** | –0.0569*** | –0.1021*** | –0.0908*** | –0.3904*** | –0.1277*** | –0.1034*** | –0.148*** | –0.1255*** |
| (0.0046) | (0.0043) | (0.0039) | (0.0035) | (0.0021) | (0.005) | (0.0049) | (0.0048) | (0.0043) | (0.0023) | |
| Asian | 0.0378** | 0.1207*** | 0.0918*** | 0.0502*** | –0.0206*** | 0.0234 | 0.0969*** | 0.0742*** | 0.0356*** | –0.0322*** |
| (0.012) | (0.0051) | (0.0032) | (0.0031) | (0.0012) | (0.0158) | (0.0065) | (0.0041) | (0.0042) | (0.0015) | |
| American Indian/Alaska Native | –0.2783*** | –0.101*** | –0.0964*** | –0.0991*** | –0.0761*** | –0.3405*** | –0.1219*** | –0.1111*** | –0.1141*** | –0.089*** |
| (0.0042) | (0.0031) | (0.0029) | (0.0031) | (0.0013) | (0.0058) | (0.0047) | (0.0045) | (0.0046) | (0.0019) | |
| Two or More Races | –0.342*** | –0.1847*** | –0.1605*** | –0.1812*** | –0.1371*** | –0.4204*** | –0.2252*** | –0.1926*** | –0.2128*** | –0.1651*** |
| (0.0058) | (0.0111) | (0.0055) | (0.0056) | (0.0009) | (0.0098) | (0.0086) | (0.0052) | (0.0051) | (0.0012) | |
| Female*Hispanic | 0.0914*** | 0.0744*** | 0.0417*** | 0.0418*** | 0.0207*** | |||||
| (0.0026) | (0.0022) | (0.0018) | (0.0018) | (0.0008) | ||||||
| Regression Model | ||||||||||
|---|---|---|---|---|---|---|---|---|---|---|
| (1) | (2) | (3) | (4) | (5) | (6) | (7) | (8) | (9) | (10) | |
| Female*Black/African American | 0.1697*** (0.0024) | 0.1278*** (0.0019) | 0.0899*** (0.0016) | 0.0908*** (0.0016) | 0.0584*** (0.0008) | |||||
| Female*Native Hawaiian or Other Pacific Islander | 0.2004*** (0.0052) | 0.1215*** (0.0049) | 0.0922*** (0.0045) | 0.0913*** (0.0042) | 0.0694*** (0.0026) | |||||
| Female*Asian | 0.0300*** (0.0093) | 0.0502*** (0.0039) | 0.0371*** (0.0032) | 0.0311*** (0.0033) | 0.0250*** (0.0015) | |||||
| Female*American Indian/Alaska Native | 0.1236*** (0.0053) | 0.0437*** (0.0045) | 0.0307*** (0.0046) | 0.0312*** (0.0046) | 0.0269*** (0.0022) | |||||
| Female*Two or More Races | 0.1488*** (0.0090) | 0.0795*** (0.0116) | 0.0622*** (0.0059) | 0.0614*** (0.0058) | 0.0544*** (0.0013) | |||||
| Observations | 14567192 | 14567192 | 14567192 | 14567192 | 14567192 | 14567192 | 14567192 | 14567192 | 14567192 | 14567192 |
| Occ. Dummies | ✓ | ✓ | ✓ | ✓ | ✓ | ✓ | ✓ | ✓ | ||
| Ind. Dummies | ✓ | ✓ | ✓ | ✓ | ||||||
| State Dummies | ✓ | ✓ | ||||||||
| Estab. Dummies | ✓ | ✓ | ||||||||
SOURCE: Panel generated from Component 2 employer, establishment, and employee files for 2018.
NOTE: Excludes data based on all rules in Appendix 6-1. Standard errors in parentheses: *** p<0.01; ** p<0.05; * p<0.1.


