
7
Standard and Evolving Monitoring Practices
Chapter 6 describes initial subsurface site characterization and post-steel-installation subsurface monitoring. This chapter focuses on practices for monitoring the steel itself. Once in the subsurface, directly monitoring steel corrosion is complicated by lack of direct access to the steel, but some monitoring is possible and is, in fact, required in the oil and gas pipeline industry. The U.S. Code of Federal Regulations (C.F.R.) 49 C.F.R. Parts 192 (gas) and 195 (liquids), as enforced by the Pipeline and Hazardous Materials Safety Administration, requires potential surveys (to be performed annually) to determine effective levels of cathodic protection (CP) going to the entire system (see pipe-to-soil under Potential Surveys to Locate Defects, below). In addition, the code requires that the CP test points (see Chapter 5) must be inspected in-person every 2 months. These checks validate that the current levels determined during the annual survey are being maintained. Other tests described in this chapter, such as in-line inspection (ILI) and aboveground (i.e., over-the-line) potential surveys, are also commonly employed.
There are no regulations related to monitoring buried steel in the geo-civil or water pipeline industries. As does the oil and gas pipeline industry, the geo-civil industries consider safety paramount, but the geo-civil industries address corrosion in the subsurface characterization and design stages. Corrosion monitoring after steel installation is not a standard practice and is done in few instances. Corrosion monitoring for water pipelines is conducted through direct and indirect condition assessments. Many utilities perform direct condition assessment of critical transmission pipelines every few years, but the assessments are not guided by regulation. For pipelines greater than 36 inches in diameter, direct (internal) assessment can include dewatering so that workers can enter pipelines to inspect the lining and corrosion defects and collect removable steel samples. Indirect corrosion assessment techniques—including potential measurements—are also important. Potential surveys can be completed directly by connecting to the pipe through the test stations or pipe appurtenances (e.g., air/vacuum valves) or by indirect measurements using two reference electrodes.
The difference in monitoring approaches among oil and gas pipelines, water pipelines, and geo-civil industries is related to the distinct spatial scales of infrastructure (feet [meters] versus miles [kilometers]), redundancies inherent to the design of the different systems, and the philosophies of corrosion protection versus corrosion minimization, as discussed in Chapter 2. Corrosion prevention, as a primary philosophy of the oil and gas pipeline industry, implies minimization of corrosion and vigilant monitoring. The geo-civil industries, on the other hand, expect a certain amount of corrosion over the infrastructure lifetime. The steel is designed with excess volume to compensate for metal loss expected over the infrastructure design life. Monitoring is not regulated. While corrosion allowance is the prevailing philosophy in the geo-civil industries, it may not be a best practice. The recognition
of these philosophical differences is valuable in that it opens discussion about how practices could be improved in the future.
COMMON MONITORING TECHNIQUES
Monitoring techniques range from mostly field-based to mostly laboratory-based, destructive1 or nondestructive, and fairly simple to extremely complex. One of the simpler techniques is weight or thickness loss measurements in the laboratory of test samples of metal extracted from the field. These measurements can be used to calculate the average rate of corrosion over the time of exposure. Those samples can also be used for other variably destructive laboratory-based methods including microscopic and chemical evaluation. Nondestructive methods include the measurement of the sample corrosion potential (variably referred to as the corrosion potential, open-circuit potential, free potential, or half-cell potential) and techniques such as linear polarization resistance (LPR) and electrochemical impedance spectroscopy (EIS). In contrast, other methods, such as potentiodynamic polarization (PDP), are destructive to the sample because they apply potentials vastly different than the corrosion potential. These approaches are described in this chapter. A laboratory investigation might employ several methods, usually starting with the least destructive (sample corrosion potential, LPR, and EIS) and ending with the most destructive (PDP). Such a combined approach provides different types of data and might take 2–3 hours to complete.
Field-based measurements are beneficial as they provide in situ measurements that can often be performed repeatedly over time. These methods include the measurement of in situ sample corrosion potential, as well as more complex methods that use sophisticated field-based ILI devices (in the case of pipelines). The devices can measure multiple parameters related to external corrosion while traveling in the pipeline.
Monitoring techniques are chosen based on the problem to be addressed. Often, the intent is to determine the location of corrosion or to gather data from which the corrosion rate of the metal in an environment may be estimated. The details of the monitoring method must be carefully controlled as laboratory sample preparation and the sample area can affect the measurement. Table 7.1 lists various methods of monitoring corrosion of buried steel infrastructure, and the subsequent text describes each of those in more detail. The table and text are ordered based on methodologies that primarily use extracted steel samples from the field for laboratory measurements (e.g., direct metal loss measurements, sample corrosion potential, LPR, PDP, and EIS), and then those that are primarily used in the field (potential surveys and ILI).
Direct Metal Loss Measurements (Coupon and Test Sections)
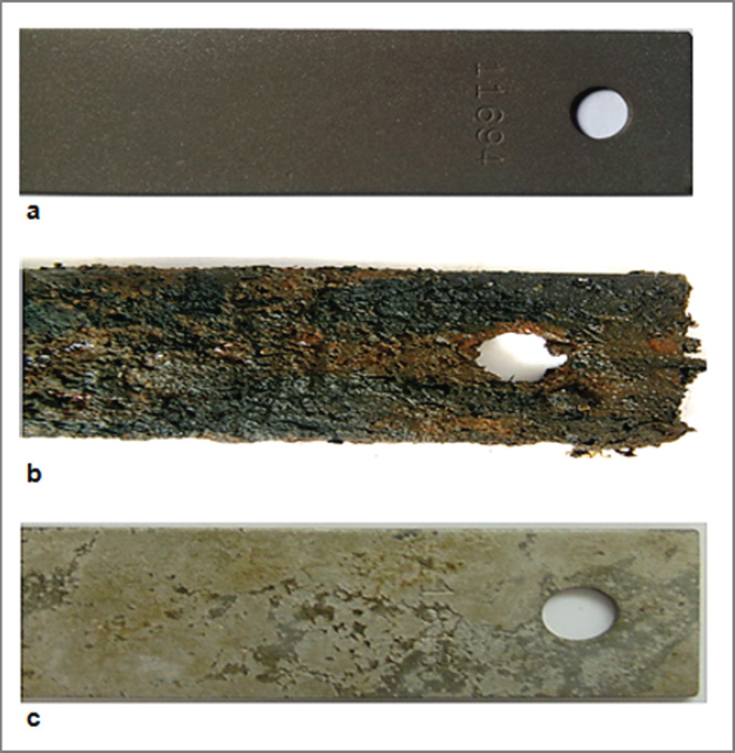
Direct assessment of corrosion of buried steel can be made by measuring the weight, cross-sectional dimensions, or tensile strength of steel prior to burial and then again after some time underground. The mass of steel or protective metal coating loss can be measured and an average corrosion rate can be estimated by comparing those measurements. For example, a test section from a corrugated metal pipe might be obtained by exhuming and cutting a sample from the pipe. The samples are taken back to the laboratory for measurements, and those measurements are compared with preconstruction values. Alternatively, to avoid the need to destructively sample infrastructure, extractable samples of steel of composition similar to that in the infrastructure—called “coupons” (see Figure 7.1)—or other types of inspection elements may be installed directly on or buried near the steel infrastructure during or post-construction and then later exhumed (e.g., Singh, 2014). Visual inspection of the samples may indicate what kind of corrosion has occurred (e.g., pitting). Only average corrosion rates may be calculated, and no information is available about variation over time (e.g., corrosion rates that were initially higher and then attenuated with time; see Chapter 8). Use of coupons is one of the oldest methods for site-specific corrosion monitoring. However, once coupons are exhumed, they are unavailable for future measurements.
___________________
1 This report defines a “destructive” test as one that cannot be performed in the field because it damages the infrastructure, or a test that cannot be performed more than once in the laboratory without changing the sample and rendering further tests unreliable. Laboratory tests require the removal of a section or inspection element from the steel on which to perform the test; however, that is not considered “destructive” in this report.
TABLE 7.1 Techniques for Monitoring Corrosion of Buried Steel in Geo-Civil and Pipeline Exteriors
| Method | Destructive or Nondestructive | Laboratory or Field Based | Measurement | Application | Industries Used | Efficacy/Issues/Limitations |
|---|---|---|---|---|---|---|
| Direct metal loss measurements (coupon and test sections) | Destructive for coupon | Exposure occurs in the field, but analyses occur in the laboratory. | Visual observation; mass loss (steel or coating); pitting; cross-sectional area loss; tensile strength reduction. | Determine average corrosion rate | Geo-civil and pipeline | Direct simple measurement; extraction of coupons from buried field environment is difficult; get average rate over time of exposure; need multiple coupons to get trend. |
| Linear polarization resistance (LPR) | Nondestructive | Mostly laboratory based, but field-based LPR is also possible. | Measuring applied current during application of potential to get polarization resistance, which is the slope of potential versus current. | Determine instantaneous corrosion rate | Rare in geo-civil and pipelines | Need Tafel slopes to get corrosion rate, but repeated measurements can be made to get trend; need trained personnel for interpretation. |
| Potentiodynamic polarization (Tafel slope extrapolation plots) | Destructive | Laboratory based | Measure and extrapolate or fit slopes of cathodic or anodic sections of the polarization curve (potential plotted versus log of current density). | Determine instantaneous corrosion rate and tendency for passivity or pitting corrosion | Rare in geo-civil | Repeated measurements not recommended; strictly only valid for activation polarization; need trained personnel for interpretation. |
| Electrochemical impedance spectroscopy (EIS) | Nondestructive | Mostly laboratory based, although emerging practices can be applied in the field. | Measuring applied current during application of alternating current potential signal with varying frequency to get polarization resistance from detailed analysis. | Determine instantaneous corrosion rate | Rare in geo-civil | Provides mechanistic information; repeated measurements can be made to get trend; need Tafel slopes to get corrosion rate; need trained personnel for interpretation. |
| Electrical resistance probes | Destructive for probe | Field based | Increasing resistance owing to loss of cross section of test component. | Determine metal loss and corrosion rate | Emerging in geo-civil | Often results in noisy data that are difficult to interpret. |
| Potential measurements | Nondestructive | Field and laboratory based | Difference in potential between the surface of a test element (working electrode) and a reference electrode.a | Correlated with zinc loss; condition of galvanized reinforcements | Geo-civil and pipelines | Do not provide measure of corrosion rate. |
| In-line/direct inspection | Nondestructive | Field based | Magnetic flux leakage (MFL) and ultrasonic measurements. | Determine defect size and shape | Oil and gas and water pipeline | The MFL tools are generally very heavy and difficult to deploy. Both methods require close contact with the metal surface and the surfaces should be generally dry (e.g., dewatering of pipe is needed). Both MLF and ultrasonic testing are unable to measure local stresses. |
SOURCE: Modified from Oparaodu and Okpokwasili (2014). CC BY 4.0.
Given that exhumation is necessary, sampling is typically restricted to near-surface applications. Direct sampling of buried steel is destructive for the test sample, labor intensive, and expensive, and therefore often impractical or impossible. As a result, samples might only be collected if corrosion is suspected. Coupons and other inspection elements are commonly used in geo-civil applications, and water and oil and gas pipelines. In the oil and gas pipeline industry, coupons provide grounding pathways that can interfere with CP systems. Box 7.2 provides an example of the use of inspection elements by the California Department of Transportation. Numerous ASTM standards guide procedures for measuring corrosion on both coupons and test sections. These methods, most commonly applied in the geo-civil industries, are used primarily to estimate corrosion rates for the purpose of modeling design. Methods that rely on electrochemical measurements can be utilized for long-term study to generate an instantaneous corrosion rate.
Potentiodynamic Polarization
PDP is a standard laboratory-based electrochemical method (ASTM G59-97, 2020) that is not used in the field for monitoring corrosion but is included here for completeness. In this method, the potential of the specimen or working electrode is controlled using an instrument called a potentiostat, along with counter and reference electrodes, and the current response is measured. The potential is usually scanned at a slow rate—from a value of about 250 millivolts (mV) below the corrosion potential (Ecorr; see Box 2.1) to a value of about 250 mV above Ecorr—and
the current is measured. In the United States, the data are commonly plotted with log of the current density (current divided by exposed area) on the x-axis and potential on the y-axis. An idealized PDP plot is shown in Figure 4.2, which also shows how the curve is analyzed to determine the corrosion current density, or the corrosion rate. The curve points to the left at Ecorr, and the linear regions in the semi-log plot, which are called the Tafel regions, are extrapolated to the Ecorr to determine the corrosion current density. The slopes of the lines are the Tafel slopes, which are useful for other techniques as described below. Polarization of the specimen to potentials far from Ecorr can damage the specimen, so the method is considered to be destructive and is not used for monitoring in the field.
Linear Polarization Resistance and Tafel Slope Measurements
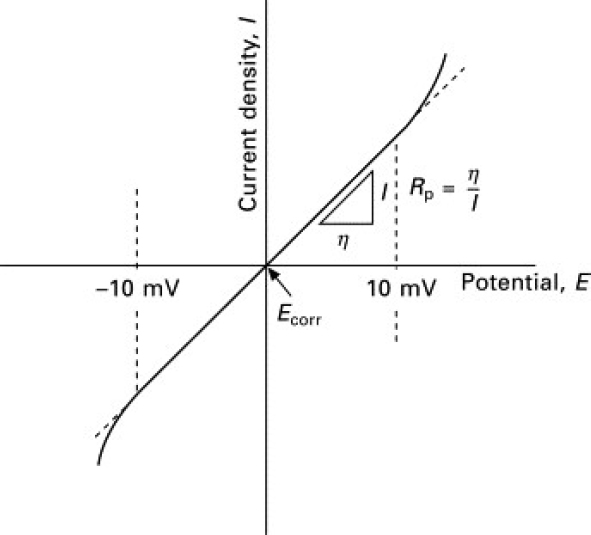
The LPR technique is primarily a laboratory-based method used to estimate the corrosion rate of extracted coupons and in-service steel elements. A small-amplitude potential (approximately ±15 mV from an open circuit) is applied to the specimen. The polarization resistance (Rp), defined as the inverse slope of the current–potential curve (see Figure 7.2), can be correlated to the instantaneous corrosion current density (icorr) with the Stern-Geary equation:
| Equation 7.1 |
where βa and βc are Tafel slopes (Stern and Geary, 1957). Then, icorr, in units of μA/cm2, can be converted into corrosion rates in milli-inches per year (mpy) using the following equation:
| Corrosion rate (mpy) = 0.46 icorr | Equation 7.2 |
As shown in Equation 7.1, the anodic and cathodic Tafel slopes (βa and βc) are required to convert Rp (measured from LPR) to corrosion rate. Tafel slopes are often assumed using values from the literature or can be measured by PDP as described above. Beavers and Durr (1998) directly measured Tafel slopes at their studied sites and found that measured Tafel slopes were almost double the literature values for steel in an earthen environment. This study demonstrates that site-specific Tafel slopes need to be determined in concert with LPR measurements. However, even without knowing the exact corrosion rate, measured decreases in Rp from LPR can also signal a concerning increase in corrosion rate and prompt further investigation.
LPR is a laboratory-based measurement that can be deployed in the field to provide a real-time measurement of corrosion rate. However, it is rarely applied in the geo-civil and pipeline industries because there are no requirements to do so and resources are needed to perform the measurements (Flounders and Lindemuth, 2015). LPR has been used in the field to collect data for performance studies that have been incorporated into research projects (e.g., NASEM, 2011) and is sometimes used in forensic investigations. In the field, a field-based three-electrode configuration is used, whereby a current is impressed between two coupons or in-service steel elements serving as the working and auxiliary electrodes, and the surface potential of the working electrode is measured with respect to a copper–copper sulfate reference electrode (CSE; see Box 7.1) (e.g., IEEE Std 81, 2012).
Electrical Impedance Spectroscopy
EIS involves the application of a small-amplitude alternating current (AC) potential signal of varying frequency, usually around the corrosion potential. This small amplitude of applied potential (~10 mV) makes this a nondestructive technique. The method is useful for assessing corrosion rates under coatings and can be used to characterize corrosion rates and mechanisms for steel samples in soil generally in the geo-civil industries. Like LPR, EIS results can be used to determine the Rp, which again requires knowledge of Tafel slopes for accurate determination of corrosion rate. Analysis of EIS data is significantly more complicated than the other methods and is prone to error and artifact. It has been traditionally used mostly in the laboratory and only now is emerging as
SOURCE: Hiromoto (2010).
a field monitoring approach. EIS provides more information than LPR, and artifacts in the LPR and PDP methods (e.g., ohmic potential drops) are explicitly evident in EIS data.
Potential Surveys to Locate Defects
In many corrosion studies, the measurement of the corrosion potential refers to the potential drop at the electrode interface measured relative to a reference electrode (see Box 7.1). These measurements provide no direct information on corrosion rate, but they can be used to characterize the corrosion process or monitor for change. Although this technique is applied in the laboratory, such measurements are also made in the field in the oil and gas pipeline industries. The pipeline industries often refer to such measurements as structure-to-earth, structure-to-electrolyte, or pipe-to-soil. The corrosion potential testing techniques can be applied to both non-cathodically protected pipe to identify areas that are actively corroding and to cathodically protected pipe to check the performance of a CP system (described in the next section). The CSE (see Box 7.1) is the most used reference electrode for corrosion of steel buried in soil and is cited in most standard practices (SPs), test methods, and recommended practices regarding CP.
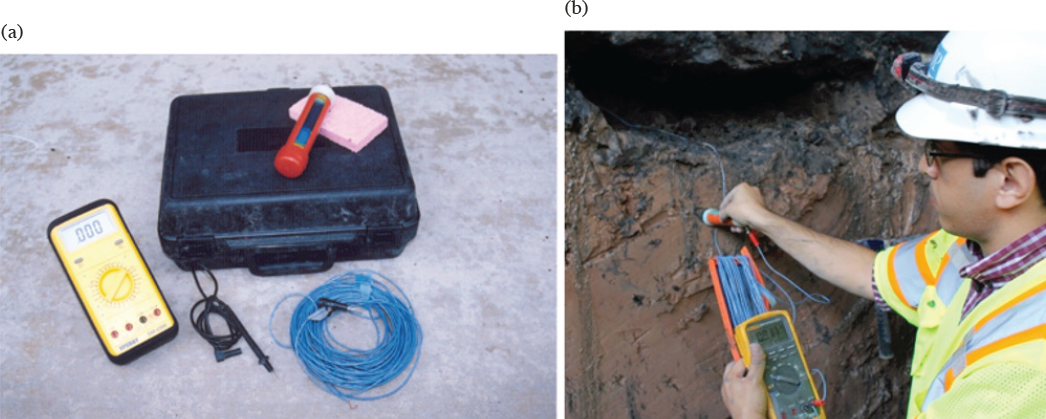
One potential survey common in the geo-civil industries is often referred to as half-cell potential and is standardized for reinforcing steel encased in concrete (ASTM C876-15, 2016). This method also has been used occasionally as a nonstandard, nondestructive test method in the field to assess the likelihood of corrosion of buried steel in soil. However, the potential measured in soil cannot be correlated directly to ASTM C876-15 (2016) because that standard relates specifically to likelihood of corrosion of reinforcing steel in concrete. Half-cell potential measurement uses a high-impedance voltmeter to measure the potential difference between steel and a CSE in contact with the soil surface. Figure 7.3 shows the components used in measuring the potential. More negative potential values can indicate where active corrosion may be occurring. The test does not provide corrosion rates.
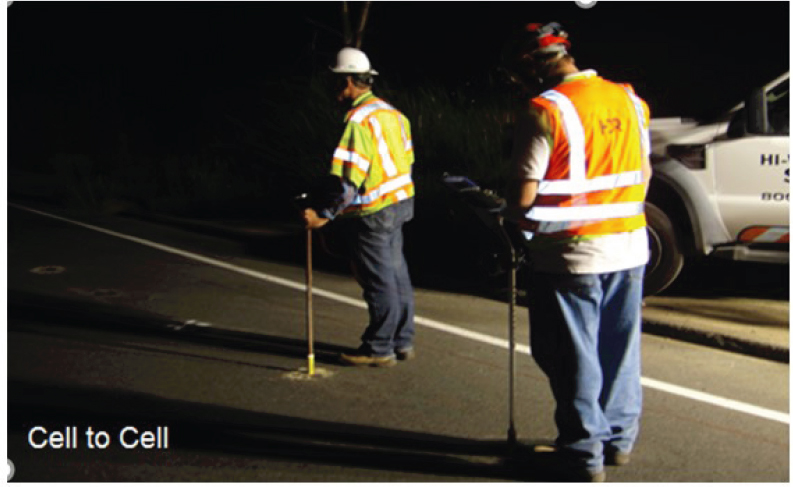
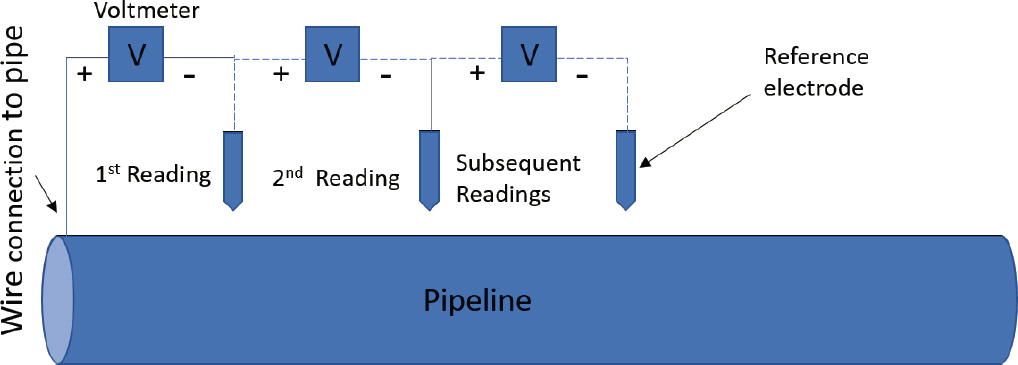
Other configurations and testing conditions are used commonly in the water pipeline industry, including cell-to-cell and side-drain potential surveys. These can be used to understand and locate corrosion, particularly for non-electrically continuous pipes (AMPP TM0497-2018-SG, 2018; Bianchetti, 2001; NACE SP0169, 2013). Cell-to-cell potential and side-drain surveys measure a potential gradient in the earth using two CSEs and a high-impedance digital voltmeter. The reference cells are repositioned approximately every 5 feet along the pipe. The measurements are stored along with the estimated pipeline station and global positioning system coordinates. In a cell-to-cell survey (see Figures 7.4 and 7.5), one electrode is placed over the pipeline’s centerline while the other trails at 5-foot (1.5-m) intervals in a “leapfrog” fashion. Both CSEs are moved along the alignment simultaneously, and the resulting earth potential gradient is measured. The potential gradient measure is related to corrosion or cathodic protection current flowing through the soil to or from the pipe. For this survey, typically the forward CSE is connected to the positive terminal of the voltmeter, and the rear CSE is connected to the negative terminal of the voltmeter. Both references are moving above the center of the pipe simultaneously every time measurements are taken. On the cell-to-cell potential plots, more electronegative potential indicates anodic locations.
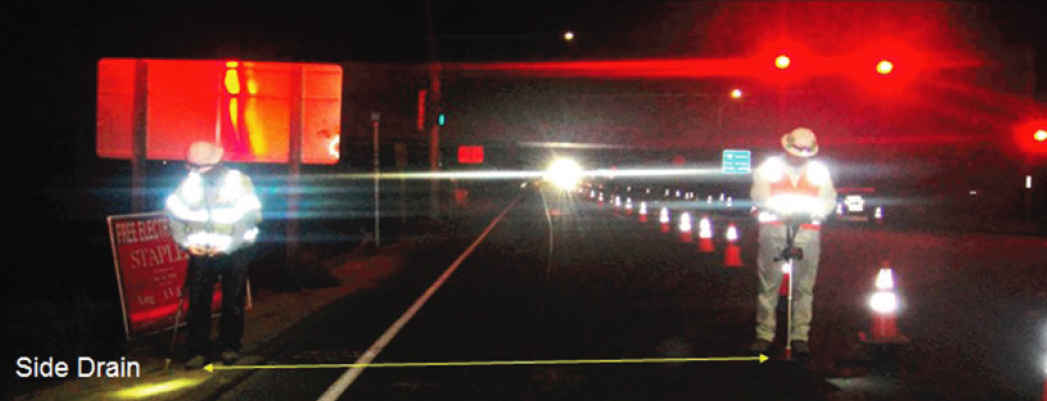
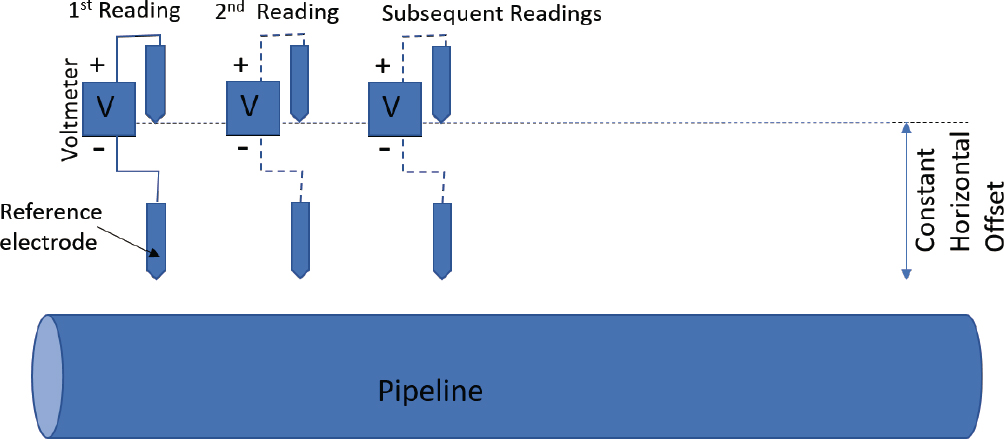
In side-drain surveys (see Figures 7.6 and 7.7), one reference is positioned above the center of the pipe (connected to negative terminal of voltmeter) and the other one (connected to positive terminal of voltmeter) is positioned parallel to the pipe at approximately 5- to 10-foot offset (the offset distance is kept constant). When the survey is conducted, both electrodes are moved along the alignment simultaneously, and the resulting earth potential gradient is measured. The side-drain measurements are examined for magnitude and polarity changes to determine the anodic locations.
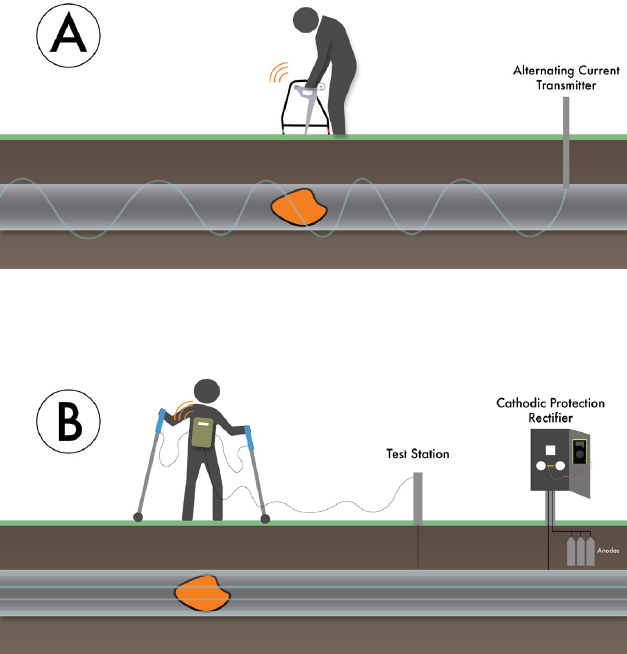
Alternative potential survey methods in the pipeline industries include alternating current voltage gradient (ACVG) surveys, historically known as Pearson surveys. These surveys are applied to non-cathodically protected infrastructure. The surveys apply an AC signal to the pipeline and measure signal leaks to the soil under areas of coating failure. This leakage of signal generates a potential gradient that can be measured using two “ski poles” or A-shaped frames. A more common variation of this survey is the direct current voltage gradient (DCVG) surveys, which can also identify coating defects but using the current impressed by the CP unit (see Figure 7.8).
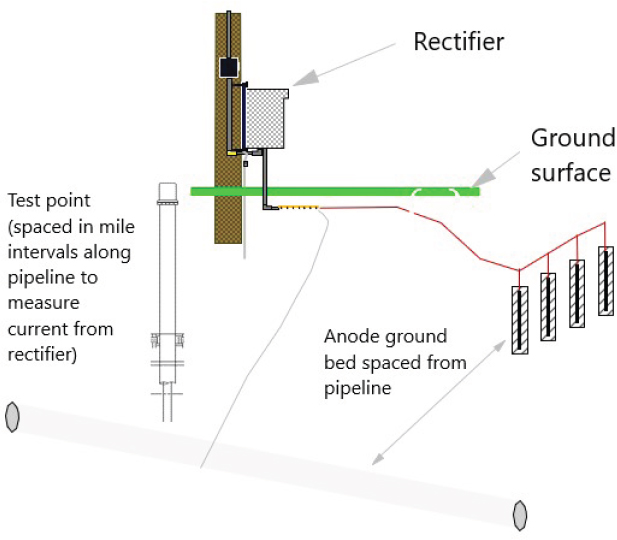
A similar method, often referred to as pipe-to-soil potential, is commonly used in the oil and gas industry to monitor CP effectiveness. During effective application of CP to a pipeline, the pipe potential is reduced from the corrosion potential to decrease the corrosion rate. Therefore, the pipe-to-soil potential measured when CP is being applied is not the corrosion potential. Pipe-to-soil potential measurements are completed on test points that
SOURCE: Pivot Engineers.
SOURCE: Mersedeh Akhoondan, committee member.
SOURCE: Mersedeh Akhoondan, committee member.
are usually about a mile apart along a pipeline and utilize a one- or two-electrode indirect methodology based on electrochemical principles to characterize the condition of the steel, the protective coating, or the effectiveness of the CP system. Surveys are conducted along the length of the steel infrastructure and measure changes in the way current flows over the surface of buried steel. Those test points are connected to a rectifier and ground bed containing anodes for the CP system. The rectifier supplies the current needed to protect the pipeline and the test points measure that an adequate amount of current is reaching those prescribed points (see Figure 7.9). The spacing of rectifiers depends largely on the resistivity of the soil and the condition of the coating. Newer pipelines can have rectifiers spaced over dozens of miles, whereas older pipelines can have them much closer.
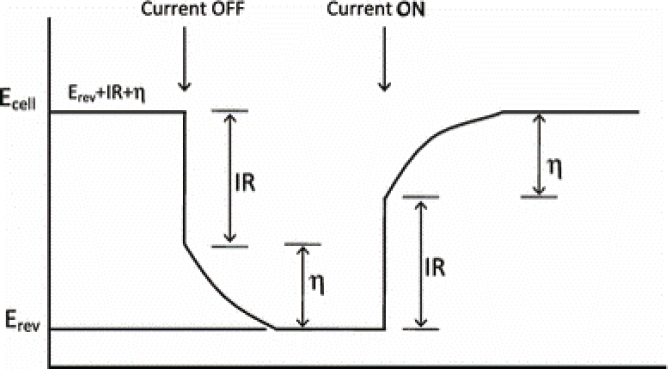
NACE SP0169 (2013) provides three criteria for CP of steel and gray or ductile cast iron: empirical evidence that a particular cathodic polarization is adequate, a structure-to-electrolyte potential (voltage) of −850 mV versus CSE, or a minimum cathodic polarization of −100 mV versus CSE. This SP is used as a standard in many state regulations describing required maintenance and monitoring procedures for pipeline operators. Potential surveys on CP infrastructure are not simply a measurement of pipe polarization (η) but also include voltage drops due to soil and pipe resistance (IR; see Figure 7.10). These voltage drops are artifacts in that they do not reflect the potential at the sample–soil interface, so they must be accounted for to assess whether measured voltages across a structure-to-electrolyte (soil) boundary are adequate. “Instant-off potential” is a standard technique for assessing CP because a potential measurement collected immediately after cathodic polarization has been interrupted (instant-off) eliminates the influence of IR. The extent of cathodic polarization is determined by the difference between the instant-off potential and the native potential measured in the absence of cathodic polarization.
Adequate CP is achieved at differing levels of cathodic polarization and depends on the environmental conditions. A single polarization voltage or voltage difference may not provide corrosion control for all environments. When microbially influenced corrosion is identified or probable, a polarized potential of −950 mV versus CSE (or more negative) or as much as 300 mV of cathodic polarization might be required (NACE SP0169, 2013). Similar recommendations are suggested for steels maintained at temperatures >40°C and for mill-scaled steels.
SOURCE: Mohandas and Fray (2011).
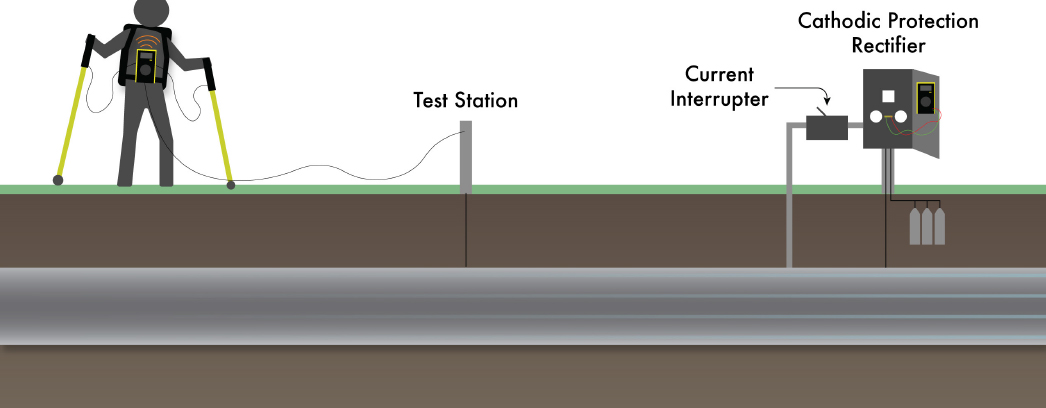
There are several pipe-to-soil potential methods that utilize current interrupters to measure CP effectiveness. By far the most common are close interval potential surveys (CIPSs), which measure the effectiveness of CP and possible coating defects along stops at regular distances along the pipeline (see Figure 7.11). Although CIPS is not a routine prescriptive, code-required monitoring test, the test provides a detailed survey of the CP system at points every 2.5 feet, as opposed to every mile at test points, and has therefore become an effective and accepted tool for meeting the generic code requirements of “adequately monitoring the CP system” while also providing useful data in conjunction with ILI tools to locate active corrosion on the pipeline.
In-Line Inspection
As described earlier, direct inspection of pipes can be accomplished by people traveling through a drained pipe (common in the water pipeline industry) to take measurements. ILI also can be accomplished using ILI machinery, called “smart pigs,” as is common in the oil and gas pipeline industry. The focus of ILI is often identification of interior corrosion caused by fluids transported within a pipe, but measurements of wall thickness also reflect exterior corrosion (the focus of this study). A number of metal loss measurement techniques can be applied during ILI. For example, magnetic flux utilizes a temporary applied magnetic field to identify anomalies in the magnetic flux distribution. An uncorroded wall returns a homogeneous magnetic flux distribution, whereas a corroded wall shows a heterogeneous distribution. The movement of the magnetic flux from corroded areas is referred to as “leakage,” and the technique is called magnetic flux leakage (MFL). Transverse MFL is a similar method except the orientation of the magnetic field is turned 90 degrees. While traditional MFL will generally see defects and corrosion of the circumferential variety, transverse MFL can be used to assist with tight axial slotting defects, such as those found in a pipe weld seam. Axial slotting defects can include selective seam corrosion. Ultrasonic methods are another commonly applied ILI technique that measure pipe wall thickness to determine metal loss. In this technique, ultrasonic signals are emitted toward the pipe, and the corresponding echoes are received from both the internal and external pipe surfaces. The time of echo return and the speed of the ultrasound in the applicable steel must be measured or known. As with all ultrasonic technologies, this method requires a couplant—a material applied to the metal to facilitate the sound wave transmission. Therefore, it is a tool more commonly used in liquid pipelines. Some gas pipelines run this tool with a “slug” of liquid couplant to facilitate inspection. A third commonly applied technique in ILI is electromagnetic acoustic transducer, or EMAT, where the transmission of a magnetic field created by transmitter coils is measured by one or more receiver coils. This technique allows for external and internal defect measurement. This technology is mainly used for tighter, planar- or crack-like defects rather than volumetric defects such as a corrosion defect.
Because of its relative ease of use and data provided, ILI technology is used for a majority of the oil and gas transportation pipelines in the world to verify their integrity. New pipelines are purpose-built to run this technology, and older pipelines are modified to accept it—a cost-intensive process. Unfortunately, there are still limitations within the technologies, usually associated with their basic physics. Therefore, selection of the right tool for the job can be as important as obtaining the data these tools provide. For example, transverse MFL tools are the standard tools used to detect corrosion anomalies on a pipeline. However, there can be limitations to how the resulting data are evaluated, particularly with respect to much larger areas of corrosion. Transverse MFL uses two sensors at a relatively short distance from each other to determine if there is an “upset” in the conditions on the pipeline wall. If the sensors are moved into a large area of corrosion, both sensors can lose the reference point of the nominal wall thickness and the data can produce a smaller anomaly and make the corrosion appear less severe than it actually is. Conversely, a ultrasonic tool, which provides a straight wall thickness measurement, does not have this issue. As described above, transverse MFL also has difficulty recognizing tighter axial anomalies for which a circumferential MFL tool can better assist. Other tools described above have come into the market more recently to address cracking in pipelines. This technology is evolving as well with time and use.
In the water pipeline industry, a number of different ILI or direct inspection methods are used, including remote-field electromagnetic scans, broadband electromagnetic probes, remote-field transformer coupled scans, MFL scans, in-pipe acoustic velocity wall thickness, and ultrasonic techniques. These also can be performed by a human or remotely using a smart pig. Other tools can be installed on the exterior of pipe after trenching (AWWA M77, 2019).
EMERGING (ASPIRATIONAL) OPPORTUNITIES
Although all industries have standards for nondestructive, field-based methods, they are most commonly used by the oil and gas industry. This may be because of the relative ease of access in oil and gas compared to the geo-civil industries (e.g., accessing a deep foundation is challenging compared to a relatively near-surface pipe and the access granted by the pipe interior). Because of the relatively recent push in the geo-civil industries for increased asset management, it is anticipated that nondestructive, field-based monitoring will become more routine.
Electrochemical Impedance Spectroscopy in the Field
Laboratory electrochemical measurements are performed on isolated test steel components because it must be known over which area the current flows. It is difficult to know exactly where the current is flowing in the field or larger uncontrolled settings. However, frequency-domain electrochemical methods are possible as field methods and are an area of active research in applied geophysics (e.g., Hördt et al., 2007; Kemna, 2000; C. Wang et al., 2021). There is often confusion because the nomenclature is different in different fields (i.e., corrosion engineering, geophysics, biomedical engineering), and the nomenclature changes based on the experimental setup. For example, in geophysics the analogous corrosion laboratory EIS measurement is called spectral induced polarization (SIP) when the frequency is from 0.1 to 1,000 Hz. Field-based SIP measurements are often called complex resistivity or complex conductivity. Furthermore, higher-frequency, above 104 Hz, measurements may be called dielectric spectroscopy or complex permittivity. Note that these are common frequency ranges. Ultra-broadband electrical spectroscopy has been measured on soils from 10−3 to 109 Hz in the laboratory (Loewer et al., 2017).
Regardless of the frequency range, making measurements in the field remains aspirational because current instrumentation requires electrodes to initiate a signal and measure the resulting voltage potential of the subsurface. Insulated wires are needed to connect these electrodes to the instrumentation, and extensive insulated wiring is needed to obtain clean signals. Working with such extensive wiring systems can be challenging in the field (Binley and Slater, 2020). Furthermore, where low-frequency measurements are of interest, collecting field data becomes difficult given power needs or simply the amount of time the technician requires to perform the measurement. Truffert et al. (2019) recently addressed this limitation using time-synchronized transmitter and receiver waveforms.
Field EIS measurements are more commonly obtained in the time domain, at one frequency and coupled with electrical resistivity—known as induced polarization. Tucker et al. (2015) used induced polarization to evaluate the depth of unknown bridge foundations, including steel piles, by measuring the response of the subsurface around
the pile. In this case, a corroded steel pile will be relatively more chargeable than a noncorroded pile in the same soil. It may be possible to use this method to identify corrosion of buried steel; however, as Hubbard et al. (2003) note, the method is largely qualitative. It can identify where there is a change in the measurement but not necessarily the cause. In addition, SIP has also been used to monitor calcite precipitation rates during biocementation (see Chapter 6). However, this application is related to the control of the environment and not directly related to monitoring the corrosion of steel (Kessouri et al., 2019).
Finally, as previously mentioned, it is not possible to know exactly where the current is flowing when using the techniques in the field. For this reason, near-surface geophysicists rely on inversion methods to interpret data. Inversion methods result in nonunique solutions and are designed to provide a general indication of an area of interest, not necessarily an exact solution that one obtains in the laboratory.2 Still, novel inversion techniques such as the analytical element method (Steward, 2020) to overcome previous mathematical limitations are being explored to improve inversion methods and provide more robust and discrete field data.
Electrical Resistance Probes
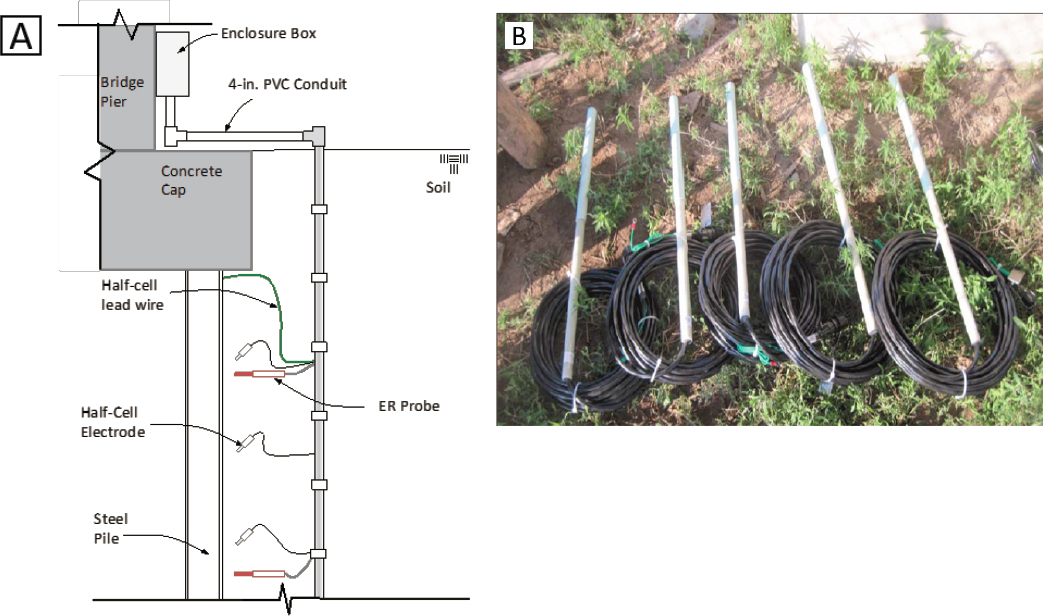
The electrical resistance of a solid body depends on its dimensions. Therefore, it is possible to estimate the corrosion rate of a metallic element by measuring the metal’s change in resistance resulting from the loss of material by corrosion. Electrical resistance (ER) probes measure the change in electrical resistance of steel relative to reference noncorroding steel within the probe body. At present, the technique is only applied in the field after a major failure or when extreme corrosion is anticipated (see Figure 7.12).
The resistance R of a body with length L and cross-sectional area A is given by the following:
R = ρ L/A
where ρ is resistivity. As corrosion occurs from the outside in, the metallic cross section of the body decreases and R increases, so the change in R provides a means to estimate weight loss. However, resistivity is a sensitive function of temperature; therefore, temperature changes need to be accounted for when assessing resistance changes. This is accomplished by incorporating a “dummy coupon” as a control into the ER probe body that is protected from the soil but not from temperature changes. Changes in resistance in the coupon due to changing temperature are measured, and those resistance changes can be accounted for in the resistance measured on the subject steel infrastructure. ER probes can provide a sustained measurement of metal loss, which can be used to calculate corrosion rate without having to remove the probe from the environment. Furthermore, the approach is not electrochemical in nature so it can be used in environments where electrochemical measurements are difficult or impossible, such as in poorly conducting electrolytes. Figure 7.12a shows a schematic of a monitoring system installed at select piers at the Leo Frigo Memorial Bridge (Wisconsin) after there had been a pile foundation failure at one pier. As can be seen, the system includes both half-cell potential and ER probes.
In Situ Coupon Measurements
Some industries install coupons that are used for in situ measurements taken at regular intervals during service. This is useful because corrosion rates often decrease with time (Romanoff, 1957), and time-series measurements are necessary to assess the rate of steel loss and strength decay. The New York State Department of Transportation, the Kentucky Transportation Research Cabinet Engineering Services, the Florida Department of Transportation, and the Georgia Department of Transportation perform nondestructive tests including measurement of half-cell potential and LPR on in-service reinforcements and coupons installed and wired for monitoring. The North Carolina Department of Transportation routinely installs coupons during construction of mechanically stabilized earth walls and monitors in-service reinforcements and coupons using half-cell potential to evaluate the remaining zinc and service-life for their galvanized reinforcements.
___________________
2 See, for example, recorded presentation to the committee by Mark Everett, available at https://www.nationalacademies.org/event/03-09-2021/laboratory-and-field-geotechnical-characterization-for-improved-steel-corrosion-modeling (accessed June 24, 2022).
SOURCE: Pivot Engineers.
Fiber-Optic Strain Sensing
Significant recent work in infrastructure monitoring has focused on the use of fiber optics as a technique that can deliver high spatial resolution of several physical properties. Fiber-optic sensors can be embedded within infrastructure, on its surface, or around the infrastructure to measure temperature (distributed temperature sensing), strain (distributed fiber-optic strain sensing), acoustics (distributed fiber-optic acoustic sensing), and even pressure (distributed fiber-optic pressure sensing). Corrosion of buried steel results in a loss of cross section of the material, which can lead to measurable strain. These measurements are collected at a desired temporal interval that can range from frequent sampling over brief periods to stable measurements for years to monitor infrastructure. Using the distributed fiber-optic technique, engineers can obtain real-time measurements to monitor in situ conditions or damage related to changes in these properties. Distributed fiber-optic techniques are commonly used for structural health monitoring in aboveground infrastructure, such as bridges, and there have been many related laboratory studies. Zhao et al. (2011) used fiber-optic sensors to monitor the corrosion of steel in reinforced concrete in the laboratory. Distributed fiber-optic sensors have also been used for subsurface infrastructure monitoring (Pelecanos and Soga, 2017) but not directly related to corrosion. In pipelines, these sensors are used for perforation monitoring, leak detection, pipeline integrity monitoring, and strain deformation modeling (Sasaki et al., 2019). As these methods have proven successful in the laboratory for monitoring corrosion and in the field for monitoring strain of buried steel and buried reinforced concrete infrastructure, they are an aspirational method for monitoring corrosion of buried infrastructure.


