
1
Introduction
Measurement of price inflation in an economy serves a range of essential policy and program purposes, and the Consumer Price Index (CPI) produced by the Bureau of Labor Statistics (BLS) for more than 100 years is the most widely used measure of consumer price changes. As a key economic indicator, the CPI measures the average change in the prices paid by households for a market basket of goods and services. It is used to deflate some components in the calculation of the nation’s gross domestic product (GDP) statistics and to calculate inflation-adjusted changes in measures of the nation’s living standards. The CPI is also used to determine annual cost-of-living allowances for Social Security retirees (since 1972) and other recipients of federal payments, adjust the federal income tax system for inflation (since 1985), and provide a yardstick for U.S. Treasury inflation-indexed bonds (since 1997). Finally, the CPI factors into determining the appropriate stance of U.S. monetary policy, which affects all Americans and the stability of the global economy. Outside of the government, the CPI is often used by households, businesses, and financial market participants as a broad statistic of price changes and to adjust wages and lease payments.
1.1. THE GOALS OF PRICE MEASUREMENT; RESEARCH AND POLICY NEEDS
Prior to the introduction of the CPI in 1921, several “cost of living” measures had been developed, first by the Bureau of Labor and then by the BLS. In 1917, a price collection effort of family expenditures in 92 industrial centers was begun to provide appropriate weighting patterns for
a comprehensive index. By 1919, BLS began publishing semiannual cost-of-living data of retail prices for 32 cities and then extended this index to cities across the country in 1921. A price sampling framework more akin to the modern version was established after the 1935 revision. This revision doubled the number of food items sampled and changed the rent sampling to “better represent the population consisting of urban wage earners and lower salaried workers” (Rippy, 2014). The name “cost-of-living index” was changed to “consumer price index” in 1945.
As stated in its Handbook of Methods (BLS, 2020, Chapter 17), BLS formally adheres to a “conditional COLI framework,” which strikes a compromise between a true cost-of-living index (COLI)—which measures the change in expenditures a household would have to make to maintain a given standard of living—and a cost-of-goods and service index (the more traditional market basket pricing approach). The “conditional” COLI seeks to “measure changes in consumers’ costs of living on the assumption of stability in conditions—such as the weather or the quality of publicly provided goods—that are outside the universe of private goods.”1 Statistical agencies around the world have by and large settled on this conceptual basis for price change measurement, and this methodological decision is not revisited here. Rather, this report is about modernizing the price measurement data infrastructure within the context of this accepted framework. New data sources carry the potential to increase accuracy, detail, and timeliness (possibly reduce costs), as well as present new methodological opportunities.
The most appropriate measure of consumer price change is not the same for all purposes; recognizing this, statistical agencies have developed multiple indexes over the years, with different coverage, weighting schemes, and aggregation formulas. Over its history, BLS has produced consumer price indexes focused on wage earners and clerical workers, on urban consumers, and on elderly consumers, as well as an index that more fully accounts for shifts in consumer buying and product substitution patterns.
Elsewhere in the U.S. statistical system, the Bureau of Economic Analysis (BEA) constructs another measure of consumer inflation, the Personal Consumption Expenditures (PCE) price index. This index has a broader scope than the CPI, tracking all spending by and on behalf of the “personal” sector, which includes both households and nonprofit institutions serving households. In contrast, the CPI mostly tracks households’ out-of-pocket expenditures. This difference in scope contributes to differences in weights such that, for example, the weight on medical care in the PCE index is larger than that in the CPI because the PCE index includes expenditures
___________________
1 National Research Council (2002, p. 3) provides a detailed comparison of the COLI and the “cost-of-goods” approaches and a full discussion of the data and theoretical realities faced by statistical agencies making the conditional COLI concept suitable for official statistics.
paid for by employer-provided insurance, Medicare, and Medicaid while these expenses are not included in the CPI. The PCE also uses a chained index formula that allows it to better account for consumers substituting between items in response to relative price changes.2 This chained index formula relies on data available with a lag that are not yet available at the time when the official monthly CPI is published, and the PCE can be substantially revised while the (nonseasonally adjusted) CPI is never revised. As a result, over the last 20 years, while the two prices indexes have followed broadly similar trends, they are not identical. The CPI typically indicates somewhat higher inflation.
1.2. MOTIVATION FOR THE STUDY: BUILDING A CPI FOR THE 21ST CENTURY
Since the introduction of the CPI, the marketplace and the data available for characterizing it have changed dramatically. What consumers buy, how they buy it, and from where is almost unrecognizable when compared to prevailing norms 100 years ago. Many more products exist, outlet structures are much more diverse, product turnover including introduction of new goods and services has become increasingly rapid, and a relatively higher proportion of the market basket consists of information goods and services. At the same time, “basics” such as food and clothing make up a shrinking proportion of overall consumer expenditures. Where consumers buy has changed as well, as shown in the growth of online shopping since 1999 (Figure 1-1).
As a result of these economic trends, price measurement is much more complex today, which has led to new and greater demands on the data needed for accurate price measurement. In the process, the decades-old survey infrastructure has been pushed beyond its capacity to meet these demands. Traditional field-collected data sources on which the CPI has relied are becoming more challenging to collect and likely less representative, particularly given changes in consumer and business behavior. Fortunately, at the same time, the digital revolution of recent decades has given rise to vast new alternative data sources that can be leveraged for the purpose of tracking consumer prices. These new data sources have the potential to improve the accuracy, coverage, and timeliness of the CPI. In particular, a multiple data source paradigm could reduce traditional sources of bias, including from product churn, quality change, lower-level substitution, and outlet churn. For price measurement, transaction data (especially those that can be associated with households’ demographic characteristics)
___________________
2 More specifically, the PCE price index is based on the Fisher-Ideal formula, and the CPI is based on a modified Laspeyres formula.
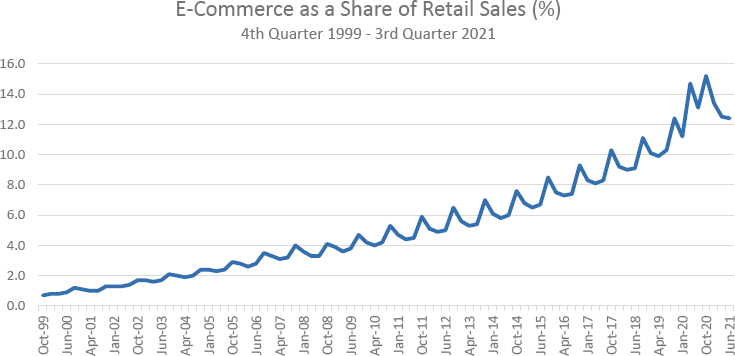
SOURCE: Quarterly data from Retail Indicators Branch, U.S. Census Bureau.
and internet price data are particularly promising, and they are discussed in detail in Chapter 2. More traditional types of alternative data also exist that could be used for some purposes, including surveys undertaken by other government agencies and commercial firms as well as administrative data from government agencies.
Historically in the CPI, a set of interrelated surveys determined the goods and services to be covered, the prices of those items, the outlets from which the prices are obtained, and the relative importance (weight) that is given to each category of goods and services in the index. These methods of price sampling and establishing consumer expenditure shares were more appropriate and more effective in the 20th century than they are now. Today, and even more so 5 to 10 years down the road, BLS will need to take advantage of alternative data sources for the CPI to keep up with measurement demands and to remain relevant.
The current survey infrastructure has been too rigid to capture recent changes in consumer behavior in a timely manner. Item and outlet samples are refreshed infrequently (one full rotation takes four years), leading to long lags in incorporating new types of outlets and goods. More recently, as noted above, a significant share of purchases has shifted to online retailers, creating new complications for tracking prices over time.3 Indeed, when consumption patterns change rapidly, the CPI may miss these shifts as
___________________
3 The share of e-commerce in total U.S. retail sales surged by 4 to 5 percentage points during early stages of the COVID-19 pandemic (U.S. Census Bureau, www.census.gov/retail/mrts/www/data/pdf/ec_current.pdf).
basket weights are derived from household Consumer Expenditure (CE) surveys with a two-year lag. Meanwhile, as the economy has become increasingly complex and fast-moving, users of the CPI data are demanding more detailed, timely, and high frequency information than ever before (Abraham et al., 2021). To meet modern information needs, statistical agencies and researchers alike are turning to alternative data sources—information beyond that collected through traditional CPI field procedures such as in-store price checking.
The surveys at the core of the CPI have struggled with falling response rates for some time, raising concerns about sample representativeness. While surveys of households’ consumption behaviors performed reliably in the 20th century, the survey-based data infrastructure underlying the CPI has come under strain more recently. Widespread survey hesitance has reduced response rates and that, in turn, has boosted the costs of obtaining representative samples.
The challenges of conducting price and expenditure surveys in a timely and reliable manner have been brought into sharp focus by the COVID-19 pandemic. CPI weights, updated every two years using lagged CE survey data, failed to capture dramatic shifts in consumption patterns in 2020 and 2021, leading to biases in measured CPI inflation. Airfares provide a salient example. Figure 1-2 highlights the modest decline in the weight on airfares in the CPI relative to those estimated by the BEA for the PCE price index (which uses more up-to-date weights). The figure illustrates how the CPI placed too much weight on airfares during this period and largely missed the pandemic-induced swings in the amount of air travel purchased by households.
Regarding the collection of price quotes, prior to the pandemic, CPI prices were largely collected through in-person visits from two surveys: the commodities and services (C&S) survey and the housing survey. BLS suspended in-person collection in March 2020, leading to a rapid shift to online and telephone collection; this shift in data collection modes is illustrated in Figure 1-3.
While alternative data sources will be useful for many aspects of the CPI, it also is important to acknowledge that it will be difficult to move away fully any time soon from systematic nationwide surveys that track consumer expenditure patterns. Surveys will still be needed for calibration, benchmarking, and testing representativeness; although, supplemented with nonsurvey data, perhaps some surveys could be undertaken less frequently.
A paradigm shift at BLS is needed for the CPI to be modernized. The agency needs to be more flexible about utilizing new data sources, developing new methodologies, and moving away from a strong emphasis on survey error. As noted, BLS has built an infrastructure well-suited for a CPI based on surveys and the types of errors associated with those surveys—and
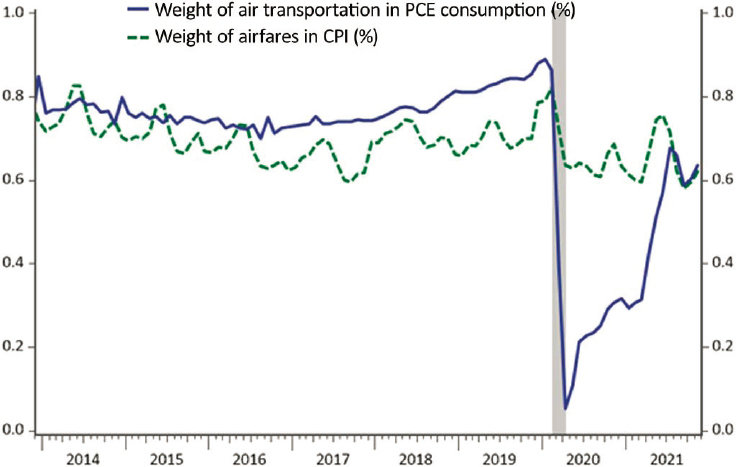
SOURCE: Panel-generated, using data from BEA and BLS.
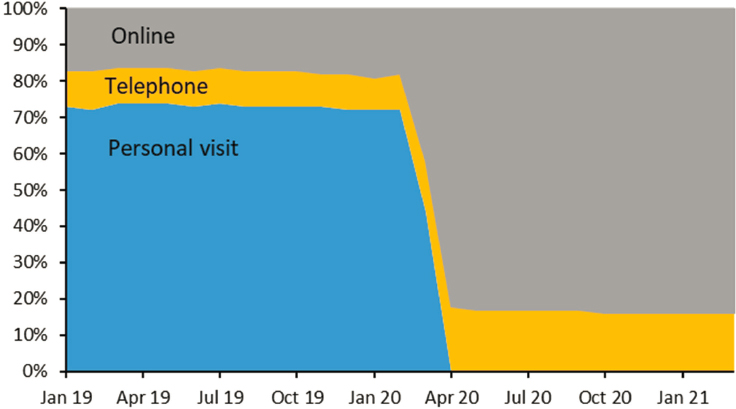
SOURCE: Panel-generated, using data from BLS.
that framework performed well for many decades. Indeed, the CPI was long considered the gold standard of consumer inflation measures. The balance of costs and benefits of this approach, however, has shifted. As noted, the surveys underlying much of the CPI are coming under increasing strains that raise the possibility of greater survey error as well as different types of nonsurvey error. Users are demanding more timely and disaggregated data, and outside organizations already are producing inflation estimates using alternative data sources that are garnering considerable attention. In this environment, BLS will need to develop and invest in new data sources and methodologies as well as develop the complementary staff and expertise required to ensure that the CPI remains a premier measure of inflation for the 21st century.
More broadly, BLS has a vital role to play in the changing data culture in economic statistics brought on by the increasing costs of surveys, reduced response rates, and emergence of data complements and substitutes, including administrative and commercial data sources. The statistical system now finds itself at a promising moment to make headway on modernizing its statistical infrastructure, in part because of the Foundations for Evidence-Based Policymaking Act of 2018 (Evidence Act), which became law in 2019. This act was intended as a starting point for improving federal data infrastructure. Increasingly, researchers and policy makers benefit from the capability to link across data sources “collected through formal surveys, federal program administration, and non-governmental data sources” (Hart and Potok, 2020, p. 3). As detailed in Chapter 2, statistical agencies around the world are already well along in the process of improving economic statistics while, in some cases, also reducing costs.
1.3. CHARGE TO THE PANEL
As outlined in the statement of task in Box 1-1, the panel was charged by BLS with examining the potential to improve the CPI by supplementing (or in some cases replacing) traditional survey-based data collection with an approach that blends multiple (survey and nonsurvey, government and commercial) data sources. Perhaps most obvious is the role of these data sources to improve elementary indexes (greater timeliness, frequency, and detail of price and quantity information), but it is also important to consider other stages of CPI construction, such as updating of upper-level category weights. The goal of this study is to assess new opportunities created by these alternative data sources to modernize and update CPI methods.
In addressing the charge to the panel, the remainder of this report assesses the potential of alternative data sources to improve the CPI. Chapter 2 focuses on opportunities, challenges, and priorities of transactions
(scanner) data from vendors or households, web-scraped data, and other options for improving timeliness and accuracy of elementary indexes. Chapter 3 considers the role of alternative data sources for use in the construction of higher-level aggregation phases of the CPI. As has been made evident by statistical agencies of several peer countries, nonsurvey sources have the potential to allow greater agility when consumer behavior changes rapidly. Chapters 4 and 5 detail how new data sources, combined
with new methodologies, might modernize the measurement of difficult-to-measure expenditure categories. Housing services and medical services are, in terms of the link between data and methodological choices and index performance, the most important of these categories and are discussed in that order. The panel also reflected on how various data sources could illuminate price changes for products that experience rapid technological progress (quality change). In Chapter 6 the case for developing supplemental subgroup price indexes, and how the emergence of new data sources could advance that measurement goal, is presented. Finally, in Chapter 7, organizational recommendations pertinent to moving forward with data infrastructure planning are made.
1.4. LOOKING AHEAD
CPI modernization, on which BLS has already embarked, is an enormous undertaking. Indeed, BLS stated in 2019 that its goal is to have a “significant portion of the CPI based on alternative data within 5 years” (Konny, Williams, and Friedman, 2019) to improve the relevance, timeliness, transparency, and accuracy of the CPI. This work will almost surely require additional resources (and BLS acknowledged in 2019 that progress is contingent on the agency’s budget and staffing). Nonetheless, as highlighted in the balance of this report, the panel believes that the case for data modernization in the CPI is urgent, compelling, and feasible.


