
4
Modernizing Difficult-to-Measure Expenditure Categories: Housing/Shelter
This chapter and the next explore several major consumer expenditure categories: housing/shelter, medical care, and several products that display rapid technological progress (and, in turn, quality change) are covered in that order. These are categories of goods and services that represent significant expenditure shares for consumers and have difficult conceptual and measurement issues, but for which new kinds of data could be especially helpful in improving price measurement.
4.1. MOTIVATION
Consumption of housing services, whether rental or owner-occupied, is by far the largest component of most consumers’ cost of living. With an expenditure share in the Consumer Price Index (CPI) of more than 30 percent, housing far outpaces the weight of other basic necessities such as food (close to 14 %) and medical care (close to 9 %).1 Although shelter remains a CPI category with inherently difficult conceptual and measurement issues, new source data have become available that may create opportunities to improve price measurement for housing services.
The focus of this section is on owner-occupied housing, both because it accounts for about three-fourths of the shelter category and because the issues
___________________
1 Shares are from May 2021. See: www.bls.gov/news.release/cpi.t01.htm reports the most recent expenditure shares.
involved in its measurement have yet to be fully resolved.2 Reflecting this lack of consensus, as detailed below, the statistical agencies of various countries use quite different methods to measure price change for shelter. In fact, 11 of 17 Organisation for Economic Co-operation and Development (OECD) members do not include owner-occupied housing in their CPIs at all (OECD, 2020). The measurement challenges for this spending category arise in large part because the price of housing services is not directly observable for owner-occupied dwellings and so must be imputed. In this section we discuss four different approaches to this imputation and how new data may help improve these methods, perhaps changing the relative merits of each. These approaches are the rental equivalence approach, the acquisitions approach, the user cost approach. and the payments approach.3 Each of these methods have advantages and drawbacks, and fitness for use depends largely on the intended application.
Broadly speaking, in a cost-of-living framework the goal is to estimate the prices of goods and services consumed by households. Therefore, a cost-of-living index should attempt to measure the price of a flow of housing services consumed by owner-occupants, which is a concept distinct from the price of purchasing a home in that the latter contains a significant investment component. To give a concrete example, if a family buys a house for $300,000 in year x and lives there for the next 10 years, their housing-related cost of living is not $300,000 in year x and zero in the subsequent 10 years. Rather, their housing-related cost of living is the amount they would have had to spend in order to consume the same amount of housing services provided by their owner-occupied home.4 Since the rent paid by renter households is an observable stream of expenditures used to consume housing services, one common approach is to impute the price of housing services for owner-occupied housing using rent data, called the “rental
___________________
2 This emphasis is not meant to imply that there are not also important issues having to do with measuring price changes faced by renters. For example, several researchers have questioned the CPI method for sampling rental units—particularly the mix of properties that have and have not changed hands. The CPI shelter component mainly surveys existing tenants and may not fully reflect the typically larger rental price changes that take place upon tenant turnover (www.personal.psu.edu/juy18/index_files/ACY_inflation_2018.01.13.pdf). Another issue has to do with tenant nonpayments (see, for example, Janson and Verbrugge, 2020, and Diewert and Fox, 2020b). This issue—the impact of rent nonpayment and its impact on CPI shelter inflation—has grown markedly in prominence during the COVID-19 economy. On this issue, see: www.clevelandfed.org/newsroom-and-events/publications/working-papers/2020working-papers/wp-2022-covid19-and-shelter-inflation-reductions.
3 Diewert and Nakamura (2009) provided a detailed description of the specifications and the appropriate application of some of these different approaches to pricing owner-occupied housing (OOH).
4 To put it another way, owner-occupants are forgoing a flow of rental income by choosing to live in the property themselves. This forgone income could be considered the cost of living in the home.
equivalence” approach. The current CPI methodology uses this approach, as do some other national statistical offices such as those in Japan, Mexico, and Switzerland. Consequently, in Section 4.2 below, we review the rental equivalence approach and how it is implemented in the case of the CPI. Section 4.3 then discusses the prominent alternative methods. This discussion is followed by consideration of opportunities for improvement brought about by new data sources and new methods.
4.2. RENTAL EQUIVALENCE APPROACH TO ESTIMATING PRICE CHANGE FOR OWNER-OCCUPIED HOUSING
The basic premise of a rental equivalence approach is that the price of owner-occupied housing services can be imputed by estimating the amount that would be required for a household to rent the same home. This premise guides production of other economic statistics as well; the System of National Accounts (International Monetary Fund, 1993, p. 211), for example, states as a guiding principle that “housing services produced are deemed to be equal in value to the rentals that would be paid on the market for accommodation of the same size, quality and type.” In the context of the CPI, where the goal is to measure price change, the methodology seeks to estimate changes in rent and then impute these estimates to the stock of owner-occupied homes. The appendix to this chapter provides background information on the methodological development of owner equivalent rent (OER) estimation historically at the Bureau of Labor Statistics (BLS).
Much of the data for BLS’s housing price program is generated by the CPI Housing Survey, which collects data on rent payments at a monthly frequency.5 In part because rents change relatively infrequently, housing units included in the survey are sampled once every six months, as opposed to once every month or two as for most other CPI items. The units in the survey are split into six panels with data collected from each panel in a different month, allowing the BLS to compute overlapping quality-adjusted six-month changes in rent.6 This quality adjustment accounts for changes in observable features such as number of bedrooms and the presence of air conditioning. BLS also adjusts rent for the estimated loss in quality from the
___________________
5 CPI agents identify respondents for each sampled housing unit. The respondent may be its occupant (the renter), its owner (the landlord), a property manager or an authorized representative of the occupant (see, How the CPI measures price change of Owners’ equivalent rent of primary residence and Rent of primary residence (rent), www.bls.gov/cpi/factsheets/owners-equivalent-rent-and-rent.pdf).
6 Detailed information on how BLS adjusts for shelter quality can be found at www.bls.gov/cpi/factsheets/owners-equivalent-rent-and-rent.pdf; information on shelter age bias adjustments in particular can be found at www.bls.gov/cpi/quality-adjustment/updating-housingage-bias.pdf.
aging of structures.7 The CPI Housing survey draws from 75 urban areas and selects representative block groups within each area.8
For each block group in the sample, changes in average rents are extrapolated to the owner-occupied stock within that block group using information on housing unit and household characteristics from the American Community Survey (ACS). A potential concern about this implementation is that, based on a comparison with the 2017–2018 Consumer Expenditure Survey (CE), it appears that single-family rental units are undersampled in the CPI Housing survey.9 This undersampling might reduce the accuracy of the imputation of rent changes to the owner-occupied stock since many such units are single-family dwellings. Recent research has found that rents of single-family and multifamily units within the same neighborhood did not rise at the same rate from 2013 to 2016 (Adams and Verbrugge, 2021).
Once quality-adjusted rent changes are estimated for the owner-occupied stock in each block group, these changes are aggregated to create an elementary index for each basic area using housing expenditures as weights. The owner-occupied housing expenditures are derived from the CE, which asks owners to estimate the rent that they could obtain for the property if it were rented. A hedonic regression is used to associate this estimated rent with housing characteristics, and then the characteristics of the owner-occupied stock by block group from the ACS are combined with the hedonic coefficients to calculate the total owner-occupied housing expenditures for each block group.10 One cause for concern is that
___________________
7 The depreciation problem is, basically, that the same rental unit does not maintain a constant quality flow of services over time. On a month-to-month basis, depreciation will be tiny but over decades, significant upward bias can result. It is not a simple matter to make a depreciation adjustment since depreciation typically applies only to the structure part of the rental property while the rent covers both the user cost of the structure and the user cost of the land that the structure sits on (and different rental properties will have different land/structure ratios). It is not an easy problem to deal with, but some (Diewert and Shimizu, 2021) argue that a somewhat arbitrary depreciation adjustment may be better than ignoring depreciation of the structure.
8 The 2018 geographic revision of the CPI Housing survey specified a target sample of 43,000 renters with a goal of collecting 5 renters per block group. Roughly 20 of the urban areas are self-representing, meaning that they each represent a single elementary area. The remaining urban areas are grouped into elementary areas that represent a combination of region and size class. BLS publishes indexes for each elementary area. There are an average of about 275 block groups in each of the 32 elementary areas, with larger strata having more block groups (maximum of about 850) and smaller strata having fewer (minimum of about 80).
9 See www.bls.gov/advisory/fesacp1120905.pdf. Elsewhere, the 2004 International Labor Organization CPI manual recommends evaluating stratification of the renter sample by structure type (ILO et al., 2004).
10 The characteristics included in the regression are number of bedrooms, property value, income, and indicators for whether the housing unit is in an apartment building, high-rise, mobile home, or “other” structure. The coefficients vary over both location and time since the model is estimated in each of the 32 index areas every quarter.
owner-occupants have been shown to misjudge the market value of their homes (Benitez-Silva et al., 2015; Chan et al., 2015; DiPasquale and Somerville, 1995; Goodman and Ittner, 1992; Kiel and Zabel, 1999; Molloy and Nielsen, 2018), and there is no reason to suspect they would be better at assessing rental value.11 Another concern with this approach is that the extrapolation to block groups can only be done using housing characteristics available in the ACS. Key housing characteristics that are missing from the ACS include the floor space of the structure and land area. Consequently, block groups with larger homes on more land may not be given enough weight in the CPI if the available characteristics underestimate actual structure size and land area.12
One big-picture drawback of the rental equivalence approach is that if owner-occupied and rental markets are segmented, it can be difficult to find rental units that are reasonably comparable to owner-occupied homes in the same block group. This difficulty likely is prevalent specifically in neighborhoods with large, more expensive homes with few rental units. According to the 2014–2018 ACS, 16 percent of block groups in U.S. metropolitan areas had less than 10 percent of their occupied homes as rentals. And the few available rental homes could be quite different from the owner-occupied stock along observable and unobservable dimensions. In these cases, extrapolation of rent to the owner-occupied stock could generate a misleading estimate.
4.3. ALTERNATIVE METHODS TO ESTIMATING PRICE CHANGES OF OWNER-OCCUPIED HOUSING
4.3.1. Acquisitions Approach
For some purposes, it could be useful to track changes in the cost of acquiring a housing unit. This approach accounts for the full price of a purchase to the period in which it takes place. In addition to the purchase price of housing units, information on costs associated with maintenance and repair, property taxes, and insurance may also be included. Ideally, the purchase price of the structure and of the land would be tracked separately; this split, however, can be difficult to implement in practice, since most home purchases bundle the structure and land together. Another implementation challenge is that gauging changes in price estimates over
___________________
11 Heston (2009) and Heston and Nakamura (2009) suggested that owner-occupants overestimate the income that they could collect from renting their properties, which would cause imputed rents to be biased upward.
12 The use of property value and household income in the regression to extrapolate owner-occupied housing expenditures likely mitigates the absence of unit size and lot size information, since larger homes and homes on larger lots will likely have higher values and be occupied by higher-income households.
time requires accounting for changes in the quality of homes sold. These challenges notwithstanding, some countries use the acquisitions approach. Australia, for example, estimates owner-occupied housing costs based on the purchase price of dwellings (excluding land) and the cost of major improvements (OECD, 2020). It is worth emphasizing, however, that home purchases involve a substantial investment component, and therefore the acquisitions approach is not necessarily a good measure of a household’s cost of living over time.
In the United States, the acquisitions approach was given closer consideration during the mid-2000s since house prices were rising much faster than rents during that period. Cecchetti (2007), who concluded that the rental-equivalence approach is the most appropriate measure of changes in costs of living, noted that switching to the acquisition approach as the method for pricing owner-occupied housing would have made a substantial difference for U.S. headline CPI inflation, raising the estimate from an average annual rate of 2.8 percent to an average annual rate near 4 percent. He argued that “[h]ad these been the inflation readings, it is hard to imagine the Fed keeping their federal funds rate target below 2% for three years.” Relatedly, for some purposes, Diewert and Nakamura (2009, p. 1) called for further exploration of “more direct measures of inflation for owner-occupied housing services.”
Another argument that could be used in support of an acquisitions approach is consistency across CPI categories. Other goods that also provide a flow of future services, such as motor vehicles and washing machines, are included in the index on an acquisitions basis.13 The EU’s Harmonized Index of Consumer Prices Index of Consumer Prices (HICP), which is the EU’s most important inflation statistic, excludes services provided by owner-occupied housing but, because it uses the acquisitions approach to measure the contribution of durable goods expenditures in the CPI, an index based on housing acquisition costs is being piloted for possible future use. However, if consistency is the goal, pricing other durable goods on a flow of services basis is another option.14
4.3.2. User Cost Approach
Another option for measuring price change in owner-occupied housing is the user cost approach. Sweden and Iceland use variants of the user cost approach (Hill et al., 2018). The user cost is derived from the theory that the return on investing in housing should equal the opportunity cost
___________________
13 For a full discussion of this issue, see the chapter on durables in Diewert (2020b).
14 The Bureau of Economic Analysis has defined consumer durables as those having an average life of at least 3 years (Katz, 1983).
of investing; otherwise, more investors should bid the price of housing up or down until the return equals the cost. This market equilibration implies that the costs of owning the property—including borrowing costs, the opportunity cost of funds, maintenance, and taxes—should equal rent (the gross income from owning housing) plus the expected capital gain. The user cost is usually defined as the costs of owning minus the expected capital gain; based on the equilibration of cost and return, the user cost should be equal to rental income. Consequently, the user cost is theoretically equal to the price of housing services. With perfect data and a frictionless economy, the rental equivalence method and the user cost method should generate the same result.
A key advantage of the user cost approach is that it does not rely on an active rental market for homes of similar quality/location. Therefore, it could provide a reasonable alternative estimate for the price of housing services in cases where rental markets are thin. Notable examples include high-end properties and properties with large land components. The rental equivalence has been shown to be much lower than a user cost estimate in these cases (Garner and Verbrugge, 2009; Heston and Nakamura, 2009), possibly because nearby rents are artificially low to compensate renters for taking good care of these high-end properties.15 For this reason, Diewert, Nakamura, and Nakamura (2009) and Diewert (2008, 2011) argued that the best approach to valuing the services of owner-occupied housing is to take the maximum of its rental value and its user cost value, using long-run expected inflation rates for expected capital gains in the user cost formula. They refer to this method as the “opportunity cost” approach because it attempts to quantify the opportunity cost of occupying a home instead of renting it out.
However, the user cost is not without its own measurement challenges. Many of the components, such as maintenance and expected capital gains, are difficult to observe and so assumptions must be made for these inputs. Research has found that user cost estimates are quite sensitive to the assumptions made about these unobserved components (Gindelsky, Moulton, and Wentland, 2019; Hill, 2018). Relatedly, measures of user cost tend to exhibit high volatility due to the method’s inclusion (sometimes, depending on specification) of an interest rate term, expected capital gains, and a risk premium.
Another issue that arises with the user cost approach is that there could be an adverse interaction with monetary policy (Hill, 2004). When central banks attempt to combat inflation by raising short-term interest rates,
___________________
15 Some owners who rent out high-end homes are looking for “caretakers” to look after the property while the owner is not occupying the structure. Thus, the owners of high-end properties are not able to charge the full user cost to the renters.
long-terms rates can also rise if market participants expect higher rates to persist in the future. Higher long-term interest rates would raise mortgage costs, therefore pushing up owner-occupied housing costs according to the user cost and payments approaches. Thus, the central bank actions would have the unintended consequence of raising this large component of inflation.
4.3.3. Payments Approach
A related approach for pricing the consumption of owner-occupied housing is the payments approach, which tracks changes in the ongoing expenditures required to utilize shelter services for homeowners. These payments typically include mortgage payments, maintenance and repair, property taxes, and homeowners’ insurance. An appealing aspect of this approach is that it relates directly to observable expenditures by homeowners. Indeed, if the underlying policy objective is to track out-of-pocket costs, it seems sensible to track the prices of the payments required by owner-occupants. The Canadian CPI uses a method similar to the payments approach and includes price changes for six components: mortgage interest, replacement cost (used as a method for measuring the depreciation component), property taxes, homeowners’ home and mortgage insurance, maintenance and repairs, and other owned-accommodation expenses.16
The payments approach is appealing for some applications because it does not rely on imputations, but rather can be based only on observed payments made by property owners. However, there are significant drawbacks to using this approach. The first is theoretical. Although the expenditures used in the payments approach are components of the user cost, the payments approach does not include all of the elements of the user cost, such as the opportunity cost of owners’ equity, depreciation, and expected capital gains. Consequently, the payments approach does not yield a measure that is theoretically equivalent to the price of housing services. To give a concrete example, imagine two identical homes that were both purchased for the same amount at the same time. The owners of the first home financed their purchase with a mortgage for 80 percent of the home value, while the owners of the second home paid for their purchase with cash. The payments approach would assign different prices to the two homes even though the housing services provided by the homes are exactly the same. The payments approach also has implementation challenges. One challenge is how to disentangle the saving and consumption components of mortgage payments, because mortgage payments generally include some repayment
___________________
16 www150.statcan.gc.ca/n1/pub/62f0014m/62f0014m2017001-eng.htm. Because the Canadian method includes depreciation of the structure, it is not a pure payments approach.
of principal.17 In addition, like the user cost, not all owner payments are easy to measure.18
It is noteworthy that, prior to 1983, BLS measured the services of owner-occupied housing in a way that was influenced by mortgage interest costs, specifically the mortgage rate currently being offered on new mortgages. In essence, the index was assuming that the mortgage interest that home buyers agreed to pay over future years was part of their cost of living today. It should be noted that this method of using contracted mortgage payments of consumers buying a home in the current period is substantively different from what is done in the Canadian CPI, which tracks actual mortgage payments.
The high and volatile interest rate environment of the late 1970s made the old BLS approach untenable, as it tended to amplify the volatility in inflation. These issues were large enough that the BLS switched to a rental equivalence approach beginning in 1983 (Gillingham, 1983; Gillingham and Lane, 1982). As described in the appendix to this chapter, the agency experimented with an alternative rental equivalence approach from 1987 to 1997, but then essentially reverted to the methodology used from 1983 to 1987. Since that time, following a recommendation in At What Price? (NRC, 2002), BLS has considered returning to a “payments approach” for some population subgroup indexes—notably the index used for Social Security cost-of-living allowances (CPI-W), the elderly index (CPI-E), and in the production of a new index for low-income households. However, applying a different approach for the housing component of these subgroup indexes than for the headline inflation measure would create inconsistencies that would make differences between indexes difficult to interpret.
4.3.4. Assessment
Prominent reviews of the CPI program have endorsed BLS’s rental equivalence method of pricing owner-occupied housing on the basis that it is the most broadly applicable approach for a cost-of-living index. The
___________________
17 This line of reasoning was also articulated by the Reserve Bank of Austria, which stated that inclusion of interest charges in a measure of general inflation rates faced by consumers is problematic, conceptually, because it represents “a relative price (that of consumption in the future as opposed to the present), rather than the current price of a good or service.” It further notes that “in some countries where interest charges are included in the CPI, they are omitted from the CPI measure targeted by the central bank; this was the case in the 1990s in Austria” (Reserve Bank of Austria, Submission to the 16th Series Review of the Consumer Price Index, March 2010).
18 The case against using the payments approach is detailed more completely in the draft chapter by Diewert and Shimizu for the International Monetary Fund CPI Manual www.imf.org/-/media/Files/Data/CPI/companion-publication/chapter-9-treatment-of-durable-goods-andhousing.ashx).
1996 Boskin Commission (Advisory Commission to Study the Consumer Price Index, 1996) supported the rental equivalence approach to pricing owner-occupied housing and even argued that the method should be extended to automobiles and other durable goods. Likewise, the 2002 NRC report (p. 72) concluded that “for long-lived items like automobiles or houses…one must use not the purchase price but the consumption price” and “as is the current practice with housing, we believe that using rental rates is probably the best option.”
This panel is in general agreement with the overarching recommendation from the 2002 NRC report. One appeal of the rental equivalence approach to valuing owner-occupied housing is that, in many situations, it will correspond closely to the price of housing services. Moreover, it can generally be calculated without making as many assumptions as the alternate approaches discussed above. The current panel thinks that BLS should avoid an owner payments approach since this approach is not theoretically equivalent to the price of housing services.
Recommendation 4.1: BLS should continue using rental equivalence as the primary approach to estimating the price of housing services for owner-occupied units.
The rental equivalence approach is consistent with the cost-of-living index objective of the CPI, and the change over time is based on observed price changes. The user cost approach is also conceptually consistent with a cost-of-living index objective but is a model-based approach that has some practical operational constraints.19 The acquisitions approach and the payments approach are not fully consistent with a cost-of-living index objective.
4.4. OPPORTUNITIES CREATED BY ALTERNATIVE DATA SOURCES
The CPI methodology has traditionally relied on survey data to provide information on rent changes and housing expenditure shares. However, new data sources might provide alternatives or supplements to the existing surveys. Resulting from the expansion of large institutional landlords and property management companies, a number of large data sources for rent have emerged over the past several decades. For example, although institutional ownership remains only a small part of the overall market
___________________
19 The user cost approach does work well if long-term average capital gains are incorporated in the user cost formula. Moreover, the use of user costs is nearly universal in production theory, so it has an important role in some contexts.
for single-family homes, the two largest companies owned about 130,000 units in 2020.20 Most of these units were owner-occupied prior to 2010 and consequently should be fairly comparable to owner-occupied units. Supplementing the CPI Housing Survey with single-family rental data from such sources might therefore help BLS improve its imputations of rent changes to the owner-occupied stock.
Beyond single-family rentals, some property management companies have access to rental data on millions of multifamily rental units, which would also be useful in expanding the BLS’s sources on rent changes. Such data would bring a considerable advantage in that rent can be observed for a given housing unit in consecutive months, allowing for an accurate assessment of rent change in a single month. By contrast, the CPI Housing Survey only samples each housing unit every six months, and BLS assumes that the six-month change in rent is evenly spread over the six-month period. This assumption makes the CPI slow to reflect actual changes in rents paid by households and is particularly problematic in times when rent changes rapidly (Wilcox, 2021). These new data sources may also include information on characteristics—e.g., land plot area of the rental unit, floor space, and structure age—that are essential for imputing appropriate rents for these owned units.
Ambrose, Coulson, and Yoshida (2015) provided a useful example of creating a rent index from private market data on rent contracts. They show that an index using only newly signed leases is much more volatile than the CPI rent index and that fluctuations in their index predict future fluctuations in the CPI series. They interpreted these results as indicating that the CPI methodology smooths out market conditions and reflects the conditions with a lag. They noted, however, that the CPI methodology may be appropriate for an index with a purpose of measuring cost of living, since rental market contracts and frictions do, in fact, reduce the influence of market conditions on the rent that households actually pay.
Beyond the potential of these data sources to improve the CPI’s ability to reflect rapid changes in rent growth, resources saved from collecting multifamily data in the CPI Housing Survey could be used to expand the survey to include more single-family units in owner-occupied neighborhoods. In addition to data on rent payments, other potential sources for rent data might include asking rents from the Multiple Listings Service or from properties posted for rent on the internet. Although asking rent
___________________
20 According to their 2020 annual reports, AmericanHomes4Rent owned 53,000 properties and Invitation Homes owned 80,000 properties. Large samples notwithstanding, leasing firms often operate with a limited geographic scale; for example, AmericanHomes4Rent appears to have few listings for the Northeast, Mid-Atlantic, and California. https://s26.q4cdn.com/445305060/files/doc_financial/annual/2020/AMH-2020-Annual-Report.pdf.
may deviate from the rent actually paid by households in material ways, it might be possible to develop methods to infer contract rents from asking rents.
Despite the potential of large amounts of data from these alternative data sources, such data would never be a complete substitute for the CPI Housing Survey as these data sources do not cover all parts of the country or all strata of unit quality. It might be possible to use a survey like the ACS as a benchmark for the types of housing units and their geographic distribution across the United States, and then focus the CPI Housing Survey on unit types and areas that are underrepresented or not covered by alternative data sources.
Recommendation 4.2: BLS should seek to identify new data sources that would allow for improved coverage of single-family homes and of areas where houses are predominantly owner-occupied. New data sources could also improve the CPI’s ability to reflect rapid changes in rent growth by allowing for the measurement of rent for a given housing unit in consecutive months.
Beyond their use for measuring rent changes, new data sources could also be helpful for estimating the housing expenditure share for owner-occupied housing. One possible source is the ACS. This large, nationally representative dataset could be used to impute rental expenditure to owner-occupied housing, for example following the method that the Bureau of Economic Analysis (BEA) has begun using to estimate the consumption of owner-occupied housing services (Rassier et al., 2021). Another promising data source is property tax records, which covers nearly all housing units in the nation and contains information on many more housing characteristics than available in the ACS, including building and lot square footage. On their own, property tax records could not be easily used for the purpose of estimating expenditure shares of owner-occupied households because it is difficult to distinguish between rental units and owner-occupied units in these data. However, the property tax records could be merged with rent data from the CPI Housing Survey or the ACS to impute rental expenditure to the owner-occupied stock. With a large enough data source, the BLS could consider a machine learning approach to estimating expenditure shares instead of a single hedonic regression.
Recommendation 4.3: BLS should consider alternative strategies for estimating expenditure shares for owner-occupied housing, especially ones that would make use of the rich housing characteristics information that are often available in property tax data.
Many potential alternative data sources have an advantage of being much larger than the samples currently used for calculating the housing components of the CPI. Effective blending of data sources could ultimately allow BLS to provide additional detail about shelter prices to data users. For example, rent and owners’ equivalent rent (OER) growth rates could be published for different housing types, such as single-family and multifamily units. Data on rent growth by structure type would have been particularly helpful during the COVID-19 pandemic since such data would have helped policy makers and researchers assess the shift in housing demand toward single-family structures. Publishing a few “average rent” series for a set of unit types, such as average rent of a one-bedroom or two-bedroom apartment, would also likely be of interest to some stakeholders.21
Given growing interest in geographic variation in the price of housing (Diamond and Moretti, 2021; Howard and Liebersohn, 2020), it would also be helpful to a range of stakeholders to publish shelter price indexes for a larger number of metropolitan areas. Geographic detail is especially important for housing because there is so much variation in prices across and within regions (Guerrieri, Hartley, and Hurst, 2013). Currently, BLS publishes shelter price estimates for the roughly 20 metropolitan areas for which it also publishes a headline index. It would be useful to publish shelter indexes for a larger set of locations, even if price changes for other goods and services could not be computed for these areas.22 Updating the geographic sample of the CPI every 10 years may not be sufficient to capture important changes in the geography of housing, for example the reported migrations spurred by the pandemic. There could be advantages to maintaining a larger and more diverse sample of housing units across cities even if other CPI items are not priced in those areas.
Recommendation 4.4: BLS should publish additional detail on the housing components of the CPI, such as indexes by structure type and for a larger number of geographic areas. Broadening the geographic scope of the CPI could be facilitated by de-linking the housing sample from the samples of other CPI items.
Even within the context of the data sources that BLS currently uses to estimate changes in the price of housing services, alternative methodologies have the potential to provide additional insight. One issue emphasized above
___________________
21 For example, the OECD (Pionnier and Schuffels, 2021) is looking into providing detailed housing levels data.
22 The BEA Regional Economic Accounts (www.bea.gov/data/economic-accounts/regional) publishes a variety of data related to output and income for states, metro areas, and counties. Elements of its methodology could be useful in creating geographic price indexes.
is that the current method causes the CPI to be slow to reflect changes in rent paid by households because BLS assumes that rent change for the current month is one-sixth of the six-month change. A repeat-sales methodology, which was designed to infer high-frequency price movements from lower-frequency, overlapping price changes (Case and Shiller, 1987), has the potential to help BLS infer the rent change for the current month by comparing the six-month change in rent in one panel of the CPI housing survey to overlapping six-month changes in other panels. Such an approach would provide a timelier estimate of the changes in the price of housing services. However, the standard repeat-sales method would require allowing the index to revise back at least six months because each six-month change provides information about price changes over the previous six months, not only about the current month. Consequently, this approach would not be feasible for the published CPI-U or CPI-W, for which revisions are not allowed.
Recommendation 4.5: BLS should consider publishing a supplementary CPI for housing services that would use a repeat-sales approach for inferring monthly rent changes from all six panels of CPI Housing Survey data. Such an index would provide a more accurate signal of high-frequency changes in the price of housing services.
4.5. OPPORTUNITIES CREATED BY ALTERNATIVE METHODS FOR ESTIMATING PRICE CHANGE IN OWNER-OCCUPIED HOUSING
As outlined above, imputing rent for owner-occupied homes works best when there is a high degree of overlap—in terms of geography and housing quality—between the market of homes for sale and the market of homes for rent. Imputations of rent to owner-occupied homes will be less accurate for situations in which rental and owner-occupied homes are not in the same market. Examples of such market segmentation could occur when (1) most of the owner-occupied homes in a neighborhood are single-family structures while the rental homes are multifamily units, or (2) owner-occupied homes are located in neighborhoods with little rental housing, which often seems to occur in areas with very high-quality housing units. In these cases, a user cost approach might be helpful to improve estimates of the price of housing services. Further research comparing user cost estimates to rental equivalence estimates would be valuable in helping BLS learn about the types of housing units and/or markets for which each approach would be preferable. BLS should also explore the “opportunity cost” approach described by Diewert, Nakamura, and Nakamura (2009) and Diewert (2011), which advocates for the maximum of the rental equivalence and user cost approaches.
Alternative data sources have the potential to improve user cost estimates. For example, deeds records provide sales price data for the vast majority of property transactions in the United States, while property tax records provide the property characteristics of these homes. These data could be used to estimate the user cost for individual properties, as shown by Gindelsky, Moulton, and Wentland (2019).
Although this panel is of the view that the rental equivalence approach should continue to be the primary method used in the CPI, there could be value to creating alternative indexes using different methods. Such indexes could be useful for research purposes as well as potentially address different policy needs (such as indexation). For example, the creation of an alternative housing index based on the user cost or opportunity cost approaches would help BLS learn about the time series properties of estimating the price of housing services using these methods. Research conducted on data at the micro level would be valuable for testing where the rental equivalence method is performing well and where it is having troubles, such as for pricing housing services associated with higher-end properties.
Recommendation 4.6: As part of its research program, BLS should compare rental equivalence estimates to user cost estimates for individual properties, and also explore the opportunity cost approach. Research on alternative methods for housing could lay the groundwork for eventually publishing alternative housing indexes using different methodologies.
Accurate measurement of the price of housing services is even more important for the creation of price indexes for subpopulations that have a larger share of owner-occupiers, such as the CPI-E for the population age 62 and over. For such indexes, the payments approach may have an even greater appeal since owner payments are, in principle, easy to observe whereas the price of housing services must be imputed. In addition, the payments method may have an appeal for price indexes used to index benefit payments for increases in inflation, like the CPI-W, because the goal of these indexes is to compensate households for inflation in the cost of consuming goods and services purchased with money. However, as discussed above, the payments made by owner-occupants reflect more than the cost to consume housing services—they also capture investment in housing. Moreover, the use of a different method for a subindex than for the headline CPI could cause confusion, because it would be difficult to know whether differential movements were due to the focus on a particular subsample, to the different methodology, or to different data sources.
Recommendation 4.7: For the purpose of learning how the headline inflation measure may differ for various subpopulations (such as the CPI-E), BLS should use the same methodology for the price of housing services as it does for the headline index. For the purpose of creating alternative measures of housing-related inflation, different methodologies could be used depending on the purpose of the index.
The top priority should continue to be improving data sources and methods to improve the rental equivalence approach that is suitable for the flagship CPI-U.
APPENDIX 4A: HISTORICAL DEVELOPMENT OF OWNER EQUIVALENT RENT ESTIMATION AT BLS
To understand the methods currently used by BLS to measure owners’ equivalent rent (OER), it is helpful to be aware of the challenges the CPI program encountered with the first attempt to measure this concept during the period 1987 to 1997. BLS’s history of measuring OER and how the methods used influenced subsequent BLS sampling and methodologies is described by Ptacek and Rippy (2013). Prior to 1983, BLS measured the services of owner-occupied housing largely based on mortgage interest costs. The high inflation and double-digit interest rates of the late 1970s made that approach untenable, and there was wide consensus that another approach was needed. After investigating the user cost and OER alternatives, in 1981 BLS announced that it would phase in the OER approach beginning in 1983. This involved reweighting the tenant-occupied rents to derive the OER estimates, along with some sample augmentation of tenant-occupied units in heavily owner-occupied neighborhoods (Gillingham, 1983; Gillingham and Lane, 1982).
Initially, as Ptacek and Rippy (2013) described, BLS simply reweighted the tenant-occupied rents to derive the OER estimates, along with some sample augmentation of tenant-occupied units in heavily owner-occupied neighborhoods. Beginning in 1987, however, BLS switched to a sample that was selected specifically to implement the OER concept.
The housing survey that BLS used from January 1987 to January 1998 was designed to implement the OER concept as understood by BLS staff in the mid-1980s. BLS selected a sample of renters to represent the tenant population and a sample of owners to represent the owner-occupant population. The owners were then linked to a supplemental sample of renters that were intended to be matched to those owners and be used to impute their changes in OER, unit by unit. For example, BLS might select an enumeration district (a Census geographical unit that was similar to a block group) that was predominantly owner-occupied—for example, 94 percent owner-occupied. Within that enumeration district, a neighborhood of perhaps 50 homes was selected and screened to find which ones were occupied by owners and tenants. Then, if, for example, 47 units were owner-occupied and three were tenant-occupied, a sample of two owners and two tenants from that neighborhood might be selected to participate in the CPI housing survey. The selected units would complete a survey giving a detailed description of the characteristics of the unit. The tenant units would be resampled at six-month intervals to capture rent changes. Originally, the intention may have been to resample the owner units less frequently (maybe once every couple of years), but because CPI rent changes of the owner-occupied units were being imputed
from the tenant-occupied units, they soon decided that it was unnecessary to resample the owner units.
The imputation procedure was complicated, but the essence was that each owner unit in the sample would be matched to one or more tenant units, then the average rent changes of the matched tenant units would be used to impute the rent changes of the owner units. Each owner unit would be imputed in the index calculation at six-month intervals, matching a panel of tenant units sampled at the same frequency. The matching algorithm was run each time, so there was no guarantee that the owner unit would be matched to the same tenant units every time, although the algorithm was designed to usually make the same matches.
The matching algorithm went through a hierarchy of about six levels, first trying to find the closest matches, and then if close matches were not found, dropping to a lower level. The levels emphasized geography. To take the earlier example, if the two owner units and two tenant units were all single family, the algorithm would probably match each owner unit to both tenant units. If one of the tenant units was in a multifamily apartment building, however, then both owner units might be matched to the one single-family tenant unit. The algorithm always favored units from the same neighborhood, but if no tenant units were matched in the same neighborhood, it would try to match units from a broader geography.
In practice, the method encountered several problems. One was that the tenant-occupied units in predominantly owner neighborhoods tended to have high attrition. Owners sometimes rent out their own homes for short periods while away for limited periods, such as an employee on a one- or two-year assignment at a field office. While these short-term rental arrangements are not especially prevalent in aggregate, they may be an important source of rentals in predominantly owner neighborhoods.
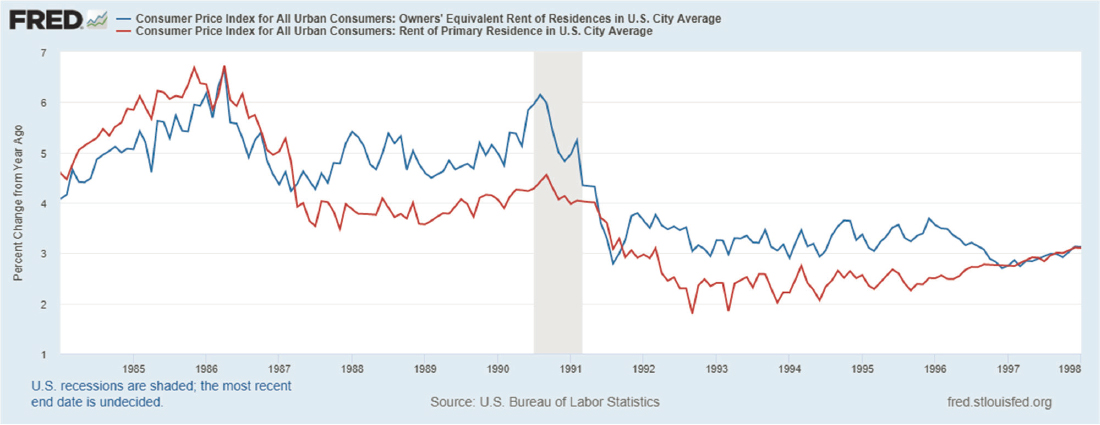
As time went by, the imputed changes in OER were being driven by fewer and fewer tenant units, and the few tenant units remaining in owner neighborhoods were carrying much of the weight. Since the introduction of the 1987 CPI housing sample, the OER index had persistently increased at a higher rate than the tenant index, with a difference of about one percentage point per year (see Figure 4A-1). At the time, the reason for the difference was not understood by the CPI program staff, as they regarded the imputation procedure they were using as essentially a reweighting of the prices used in the tenant index. While it was thought possible that the difference reflected a real difference in the inflation rates of the types of tenant units that were most similar to owner-occupied units, there was also a concern that there may have been a flaw in the matching process, which was considered to be a bit of a black box.
In the imputation algorithm, the six-month rent changes for OER were calculated using a Carli formula—that is, the imputed owner’s equivalent
SOURCE: BLS, St. Louis Federal Reserve.
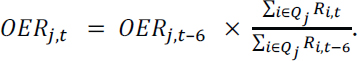
rent for owner unit j in month t was calculated based on the average of the price relatives for the rents of the matched tenant units:
![]()
where Ri,t is the rent for a matched tenant unit i, and Qj is the set of tenant units that are matched to owner unit j. It is now well known that the use of the Carli index for such calculations impart an upward bias to the resulting elementary index (which in this case is an imputed rent for an owner unit).
This problem was described by Armknecht, Moulton, and Stewart (1995), which refers to the average-of-relatives formula as a “Sauerbeck” index. Diewert (1995) attributed the index to its earlier discoverer, Carli, and now the term “Sauerbeck index” is typically used only when the relatives have unequal weights. Beginning in January 1995, BLS switched to using a Dutot formula for the imputation:
The upward bias did not immediately go away. Additional research showed that an upward bias persisted with the Dutot formula when the imputations were based on a very small number of matched tenant units, so about a year later, BLS began requiring a minimum number of units to be matched or else the matching algorithm would move to the next level up. With this additional adjustment, the upward bias of the OER estimator had ceased by 1997.
However, by imposing this requirement on the matching algorithm, the method was no longer routinely able to match owner units to rental units in the same neighborhood, which undercut the rationale for the overall methodology.
In 1998, BLS moved to a new housing survey and switched its OER methodology to resemble what had been used prior to 1987. While the panel does not know the full details of the motivation behind the shift, it seems that, at least in part, the new approach was driven by an understanding that it was problematic to attempt to closely match owner units to similar tenant units—especially in neighborhoods that were predominantly owner occupants—and that the most practical approach was to attempt to reweight the tenant units to more closely resemble the population of owner units.


