
3
Higher-Level Aggregation and Shifting Consumer Behavior
3.1. MOTIVATION FOR DATA MODERNIZATION
In today’s fast-paced economy, statistical agencies face a major challenge to keep published data relevant by reflecting rapidly changing conditions. Timely data have increasingly become a basic expectation, and COVID-19 has reinforced the need for up-to-date statistics. In the context of measuring changes in consumers’ costs of living, a price index must track the goods and services that people actually buy and account for the relative amounts spent on them. In other words, the expenditure weights used in a price index should represent current reality as much as possible. For long periods, expenditure patterns may be reasonably stable. However, the recent pandemic and recovery made the importance of updating the weights during unpredictable, turbulent times painfully apparent and showed that failure to keep the weights up to date can lead to lost credibility if households cannot recognize the market basket. The timeliness of the Consumer Price Index (CPI) weights must be improved.
A primary method used by most statistical offices to determine people’s expenditures is asking them directly about their consumption of goods and services in the form of a household survey.1 In the United States, the Bureau of Labor Statistics (BLS) carries out this process using the Consumer Expenditure Survey (CE), which has for decades been the most comprehensive
___________________
1 As discussed below, Statistical Offices in many countries use national accounts data to estimate upper-level CPI weights, and data from household expenditure surveys to derive the more detailed weights (Eurostat, 2018).
source of data on households’ income and expenditures.2 The CE is used to establish the relative importance of 243 expenditure items, or item strata (241 commodities and services plus 2 housing strata) for two higher-level indexes: the Consumer Price Index for All Urban Consumers (CPI-U) and the Consumer Price Index for Urban Wage Earners and Clerical Workers (CPI-W).3 Additionally, CE weights are used in an experimental price index published by BLS covering urban consumers aged 62 and older (the CPI-E).4
One challenge with the current approach for updating weights is that household expenditure surveys are burdensome to respondents and costly to administer, which places practical limits on how large the sample size can be and how often it can be conducted. The limited sample size means that more than one year of data must be pooled to create enough observations to estimate weights, especially for subnational (e.g., regional, population subgroup) indexes. Furthermore, processing the raw survey data and developing new item weights is time-consuming, which means that the weights used for a particular year are based on expenditure patterns from earlier periods and available only with a significant lag. For example, the CPI weights (or “market basket”) for 2020 and 2021 were based on the CE expenditure patterns for 2017 and 2018. Similarly, the new CPI weights in 2022 will be based on expenditure patterns from 2019 and 2020. As a result, the CPI weights tend to be outdated in representing consumer purchases taking place in a given period; for example, it is known that consumption behavior in 2020 changed sharply due to COVID-19 and so weights derived from 2019 to 2020 may not reflect what is going on in the market in subsequent periods.
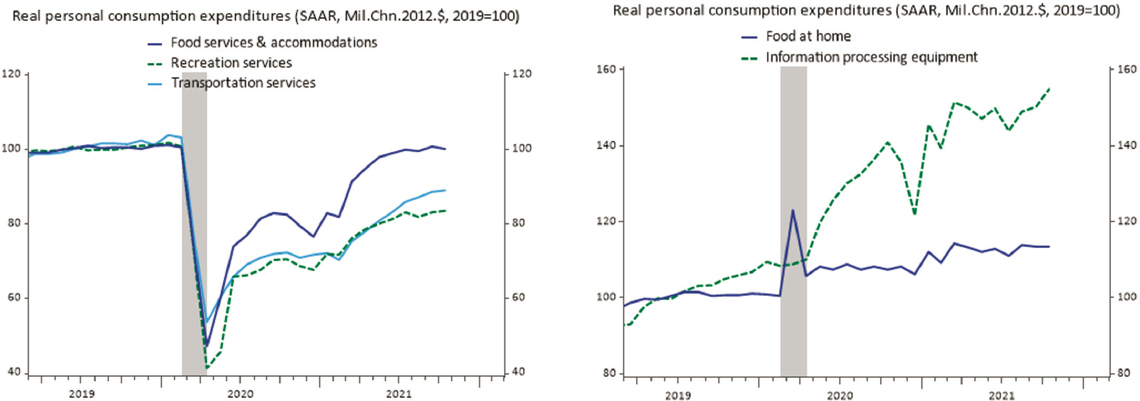
Additionally, infrequent updating of the market basket delays bringing new goods (which often display distinctive price dynamics) into the CPI or moving obsolete goods out of the index. While the composition of what consumers buy is constantly evolving, the shifts were especially dramatic during the pandemic—to the extent that, during the U.S. lockdowns of 2020, there was a substantial “disappearing products problem” in some expenditure categories.5 The most noteworthy declines in spending were in the categories of travel/transportation, food away from home, and recreation
___________________
2 NASEM (2013), Measuring What We Spend: Toward a New Consumer Expenditure Survey, includes a detailed description of all of the uses of the CE in administering federal programs.
3 As discussed in Section 3.3.3, the relevance of the CPI-W has diminished markedly in recent decades as the portion of the economy’s workers employed in occupations covered in the index continues to decline.
4 The CPI-E is discussed in greater detail in Chapter 5, on population subgroup price indexes.
5 Diewert and Fox (2020a) and Cavallo (2020) both documented the problems that arose during the pandemic, including goods and services becoming unavailable, for the measurement of price inflation.
services (which includes admissions to movies/theater/sports, gambling, and package tours among other things), and clothing worn outside the home (see Figure 3-1) (Cavallo, 2020; Diewert and Fox, 2020a; Reinsdorf, 2020). Moving in the opposite direction, demand for food at home and information processing equipment surged. These abrupt changes in spending patterns illustrate the need to keep the CPI basket up to date. Such episodes can cause sudden obsolescence of item weights, or even the basket itself, and call into question the accuracy and relevance of price indexes.
The recommendations in this chapter focus on the need to improve the timeliness and accuracy of data on spending patterns and to identify items where survey-based estimates of consumer expenditures are weak. Despite improvements in recent decades—e.g., merging the CE with the Point of Purchase Survey (indicating where households made purchases), a modestly streamlined questionnaire, and an increased survey sample size—the CE-based method of establishing expenditure weights remains problematic. The survey generates high respondent burden and has experienced declining response rates.
The specific problems described in this chapter are (1) the need to improve the timeliness of upper-level weights, which, on average, lag 36 months behind actual expenditures in a given period; (2) the need to improve the accuracy of weights applied to specific items for which CE does a poor job estimating6 and for which alternative data could do better; and (3) general concerns about the sustainability of the CE given concerns about respondent burden and falling response rates. The panel is optimistic that problem (2) can be successfully addressed with alternative data. Although problems (1) and (3) are more complicated, alternative data may also allow BLS to shorten the CE survey (which could help with respondent burden and response rate issues) and create other opportunities to shorten the lag between the survey and its incorporation in the CPI.
3.2. APPROACHES TO ESTIMATING CPI WEIGHTS AND MARKET BASKET COMPOSITION
3.2.1. Current BLS Methods
In the United States, weights for the 243 component cells that aggregate up to the overall CPI reflect data collected about consumers’ spending patterns from a two-year interval that is centered two years back at the time of
___________________
6 Underreporting of expenditures is especially a problem in the diary survey component. NASEM (2013), which focused on cognitive and motivational issues in the Diary and Interview surveys, documented survey method problems and provided guidance for turning around the deterioration.
SOURCE: Panel-generated, using BEA data.
their introduction. For example, BLS updated expenditure weights for the Consumer Price Index for All Urban Consumers (CPI-U) in January 2020 using data collected in the CE during the period 2017–2018.7 The weights used for 2020 and 2021 continued to use an average of expenditure shares from this two-year period.
A major reason for BLS’s practice of pooling data across 2 years is so that sample sizes are large enough to produce accurate weights at the needed item and geographic levels of detail. To calculate the 2017–2018 weights for the urban population, BLS used approximately 21,000 weekly diaries and 44,000 quarterly interviews. However, for 2020, BLS reports that response rates for the Diary part of the CE survey dropped to as low as 28.3 percent after March and the Interview response rate dropped to around 40 percent in July 2020, roughly 15 percentage points lower than April 2019 levels (https://www.bls.gov/cpi/questions-and-answers.htm). Past commenters have argued that an increase in the CE sample size is needed, especially for purposes of estimating subgroup and other subnational indexes.8 Combining CE records with government administrative data sources (e.g., from the Social Security Administration and the Internal Revenue Service for income) and using household consumption data from the national accounts could also reduce the amount of information requested of respondents.
CPI staff also receive data from the CE program quarterly, which enables the quarterly publication of the final Chained Consumer Price Index
___________________
7 The relative importance of a component is its expenditure or value weight expressed as a percentage of all items within an area or an area within the United States. For a detailed description of how base period weights are established and brought forward using the Lowe index formula, see the relevant parts of the CPI Handbook of Methods available at www.bls.gov/opub/hom/cpi/calculation.htm. See, also, Chapter 5 in Carroll, Crossley, and Sabelhaus (2015), and background from BLS at www.bls.gov/covid19/effects-of-covid-19-pandemic-onconsumer-price-index.htm.
(C-CPI-U) indexes. The C-CPI-U, first published in 2002, is a supplemental measure that largely solves the weight timeliness issue, but with the tradeoff of a long revision cycle. In particular, the C-CPI-U better accounts for cost-of-living changes faced by consumers in a world where buying patterns respond to changes in relative prices. It offers a measure of changes in cost of living characterized by reduced substitution bias relative to the Laspeyres formula used in the headline CPI.
Crucially, weights used in the C-CPI-U can be aligned with actual expenditures as opposed to two-year average weights being introduced with a long lag in the CPI-U, and are therefore considerably more coincident with the prices of items in the index than those used in the CPI-U. A preliminary version of the C-CPI-U uses a constant expenditure shares formula.9 The final chained CPI uses a Törnqvist formula, which accounts for consumer substitution and is the superior index for most applications where index revisions are acceptable. This Törnqvist formula is applied and the index is revised after monthly weights become available. For example, the March 2021 weights were incorporated in the final March 2021 C-CPI-U (released in February 2022).
Differences between the CPI-U and the C-CPI-U reveal how the age of the weights can affect index estimates. Because it captures effects associated with consumer substitutions, the C-CPI-U has typically increased at a slower rate than the CPI-U (or CPI-W).10 Differences in the two series started out fairly large during the initial period after the C-CPI-U was introduced and then stabilized at more moderate levels. In 2001 (the first year of C-CPI-U calculation), the gap in the 12-month percentage change between the C-CPI-U and the CPI-U was about 0.5 while, in subsequent periods, it was more typically in the 0.15–0.35 range.11 In contrast to the C-CPI-U, which approximates a superlative index after the final revision, a fundamental issue is that the CPI-U is not revisable and so the lagged weights from the CE cannot be updated to reflect current or recent spending patterns.12
In researching options for improving timeliness in the updating of weights to its flagship CPI-U, BLS has used historical CE data to illustrate
___________________
9 This weighted geometric mean index is used to combine individual prices into elementary aggregates for narrow product groups (i.e., the individual constituents of the basket). Higher-level aggregation is done with a Laspeyres formula (which uses a fixed basket from the reference period for expenditure patterns). For a full description of BLS’s Chained CPI, see www.bls.gov/cpi/additional-resources/chained-cpi.htm. In January 2015, BLS switched to a CES formula for the preliminary version of the C-CPI-U.
10 BLS research (Kurtzon, 2017) found that the weights, rather than differences in the formula used, account for most of the difference of the Chained CPI from the CPI-U.
11 Klick (2021) detailed the differences between the 12-month percent changes of the initial C-CPI-U minus the final C-CPI-U from January 2001 to September 2020.
12 One reason why the index is not revised is its widespread use in escalation of payments.
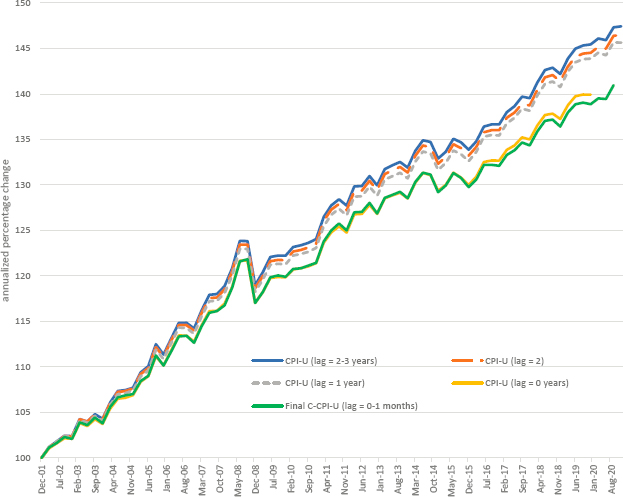
how the average weights would have looked under different scenarios for estimating expenditure category weights. The alternatives involve either compressing the period from which CE data are drawn for a weight update, reducing the lag between data collection and integration into the CPI, or a combination of the two. Implementing weights based on either a two-year rolling average or on annual estimates from expenditure data are both being considered with the latter appearing to be the frontrunner (Klick, 2021). Figure 3-2 depicts BLS simulation of the annualized percent changes over the period from December 2001 to December 2020 if annual CE data had been used in the CPI. It is important to note that a one-year lag for introducing new expenditure weight estimates into the CPI is not currently feasible due to data collection and processing timelines. Lagging by two years is feasible, and BLS research finds a three-tenth of a percentage point “improvement” over the current methods.
The main takeaway from BLS’s research is that moving from the current methodology to a 2-year lag in setting annual weights would have reduced the measure of substitution bias (the difference in the 12-month percent change of CPI-U minus C-CPI-U indexes) by 0.036 percentage points per year. Moving from the currently used methodology to a 1-year lag would have reduced substitution bias by 0.061 percentage points (for 2017–2018 estimates).13 To take a concrete example, calculating the index for April–May 2020 would involve lags of:
- 2–3 years expenditure weights for 2017–2018
- 2 years 2018
- 1 year 2019
- 0 years 2020
- 0–1 month, March-April 2020
Of course, the 2020 weights would not be possible to compile in real time, and even 2019 weights would be challenging from a production standpoint.
It is also worth noting that BLS experimentation with using one year of expenditure data to estimate weights has been focused on the national urban population. It is not clear whether one year of data would be sufficient for lower-level geographic or subgroup indexes (e.g., CPI-E or the income group indexes discussed in Chapter 5); however, it would certainly be an option to estimate the national total using one year of CE data and then use two years of data to allocate of distribute the national total to subgroups.
___________________
13 This sentence was revised after institutional report review to improve its accuracy.
SOURCE: Klick (2021).
3.2.2. Methods Developed by Other National Statistics Offices and Academic Researchers
Many national statistical offices (NSOs) update their upper-level CPI expenditure weights every year, with a one-year reference period for use in a Laspeyres/Lowe index formula. Due to advantages in terms of timeliness and accuracy relative to household surveys, the United Kingdom Office of National Statistics (ONS), for example, uses information on spending patterns culled primarily from the household final consumption expenditure component of the UK National Accounts, which largely is based on administrative and business data representing the whole economy. These data are used for the annual updates “because the expenditure information is comprehensive and balanced against data collected in other sectors of the economy to create the most accurate picture of consumer spending.”14 In general, Eurostat areas (and ONS) use the national accounts approach for the higher-level weights, and consumer expenditure surveys for the lower-level weights within each higher-level aggregate. Many other NSOs use a similar methodology.
___________________
14 www.ons.gov.uk/economy/inflationandpriceindices/articles/consumerpriceinflationupdatingweights/2017.
In a U.S. context, the analogous category to household final consumption is personal consumption expenditures (PCE) estimated for the national income and product accounts (NIPAs) produced by the Bureau of Economic Analysis (BEA). The implied shares can differ significantly from the lagged shares estimated from CE data.15 The example cited in Chapter 1 of weights for airfares during the pandemic illustrates the impact of these differences vividly; the weight on air transportation in the CPI only declined from around 0.8 to 0.6 from February 2020 to April 2020, whereas, in the PCE, the share dropped from 0.9 to below 0.1, much more accurately reflecting changed consumption patterns during the lockdowns. CE and PCE discrepancies do not just emerge during extraordinary times; in 1995, the ratio of CE to PCE expenditure shares on alcoholic beverages was a dismal 0.34 (NRC, 2002).16 Furthermore, there is considerable evidence that the discrepancies between the CE and PCE have been getting larger over time. Passero, Garner, and McCully (2015) found that among items that are totally comparable in definition and coverage between the CE and PCE, the ratio of CE expenditures to PCE expenditures declined from 84 percent in 1992 to 74 percent in 2010. This decline could indicate worsening underreporting of expenditures by CE respondents.
Eurostat guidelines also recommend putting in place procedures to promptly bring important new goods into the index. Extending this concept to the current situation, Eurostat (2020) has advised national statistical agencies to adjust their methodology for producing weights for Harmonized Indices of Consumer Prices so that they better reflect the impact of COVID-19. They are recommending a variety of source data, including national accounts, to estimate expenditure shares.17
Although somewhat different from their consumer survey counterparts, PCE data underlying the national accounts also come with challenges in terms of their applicability to estimating CPI weights. PCE and CPI item categories are not all comparably defined. One major category in particular—medical care—raises special challenges. For medical care, the PCE covers a wider scope of goods and services than does the CE/CPI. PCE coverage includes government-funded care provided through social insurance—such as Medicare and Medicaid—and the employer-paid portion of medical insurance; in contrast the CE/CPI excludes these categories.
___________________
15 For an assessment of the differences between expenditure data in the National Accounts and Consumer Expenditure Survey data, see Johnson (2017). Earlier, Blair (2015) constructed a PCE-Weighted Consumer Price Index.
16 As noted below, this observation should be tempered by the fact that the PCE basket has broader coverage of the economy (e.g., it includes business and government spending) than the CPI market basket, so the weight of any single item is usually lower in PCE.
17 See the report appendix, https://ec.europa.eu/eurostat/documents/10186/10693286/Guidanceon-the-compilation-of-HICP-weights-in-case-of-large-changes-in-consumer-expenditures.pdf.
BLS itself has published results of the CE/PCE Concordance that compares comparability in detail.18
Another challenge in using PCE weights for the CPI is that the procedure for obtaining PCE weights necessitates allocating overall sales data for a particular commodity to business, government, or consumers’ spending. Thus, the PCE is an indirect measure, calculated jointly with purchases made by non-consumer sectors. Triplett (1997, p. 16) noted that it is especially difficult to calculate consumption shares at more refined item levels because sales to consumers are not always distinguishable from sales to businesses and government: “The finer the level of detail, the more likely that the long chain of computations necessary to reach the PCE’s indirect estimate of consumer spending will have cumulative errors that affect the totals.”19 Even so, it seems implausible that estimates of business and government purchases of consumers goods could be off by enough to account, on their own, for the large differences between NIPA and CE weights for some expenditure categories.20
As alluded to above, a major advantage of the CE weights is that they are derived directly from a household survey, which allows household characteristics to be linked to expenditure information. In turn, subpopulation indexes such as the CPI-E and CPI-W can be calculated in a way that reflects expenditure patterns (although not necessarily prices paid) by those groups. A national accounts-based approach to estimating weights is therefore an option for statistical offices for whom producing subpopulation CPIs is less of a priority. The need for information on household/consumer unit characteristics presents a significant stumbling block to moving away from the CE completely, although, precisely because of this issue, some countries (e.g., Netherlands) have discontinued subgroup indexes.21 This decision has allowed these statistical offices to more easily turn to other sources to estimate upper-level expenditure weights. However, we note again that, even if BLS reduces its reliance on the CE for some CPI item
___________________
18 https://www.bls.gov/cex/cepceconcordance.htm.
19 A main part of the problem is that the sales data used for PCE do not always include product detail. For example, gas station sales combine snacks and drinks, auto parts/fluids, and fuel. BEA has been addressing this problem by supplementing sales data with scanner data providing product detail.
20 National accounting data provide fairly accurate information on total government spending and business expenses, which limits the scope for large errors to arise in total intermediate spending, though there may be offsetting errors in some detailed spending categories.
21 And a Netherlands–U.S. comparison of the need for subgroup data is not apples to apples; regional information within Europe is still needed as each country produces its own price data in addition to the 19 EU countries’ harmonized index. For the United States, measures of household inequality are likely to feature prominently in the coming years (see Chapter 5, which makes the case for population subgroup price indexes). Household-level information is essential for producing nominal measures of income and consumption inequality.
weights, it is still an important source of information on regional and demographic household expenditures.
NSOs are also advancing methods based on alternative, transaction data sources to improve the timeliness of weights. Statistics Canada, for example, published a special edition price index based on an alternative set of weights reflecting spending patterns during the pandemic. As part of the analytic exercise, the agency was able to use credit and debit card data supplied by the Bank of Canada to “to account for pandemic related expenditure shifts at more detailed levels of geography and CPI components” (Statistics Canada, 2021, p. 4). Even prior to COVID-19, Statistics Canada concluded that expenditure estimates from surveying consumers (using the agency’s Survey of Household Spending) were sufficiently inaccurate that a switch to using household final consumption expenditures (HFCE) data from the national accounts was warranted. This approach also helped with timeliness—for example, using the HFCE data, the weights used to estimate the June 2021 CPI were able to be based on expenditure patterns for 2020, a much more recent period that was possible with the Survey of Household Spending. This special analytical index shows the benefits of collaboration and data sharing between government agencies and other organizations—in this case, private data as one of the inputs in estimating the CPI weights, and the use of a timely complementary indicator to provide data users a more complete picture.22
Other countries are pursuing similar strategies to those employed by Canada. As noted in Chapter 2, the Australian Bureau of Statistics (ABS) has been turning to a range of more timely data sources such as retail trade and scanner data. For their program’s 2020 annual updating, the agency used these alternative data sources for approximately 20 percent of the weight of the CPI.23 More broadly, evidence has been compiled for many more countries about the changes in consumption patterns in response to COVID-19—see, for example, Seiler (2020) for Switzerland (based on transactions data), Andersen et al. (2020) for Denmark, Bounie et al. (2020) for France, Carvalho et al. (2020) for Spain, and Chronopoulos et al. (2020) for the United Kingdom. BLS is currently exploring these kinds of options for publishing “nearly superlative” indexes based on more timely data used for estimating higher-level aggregation (Bergqvist et al., 2021).
___________________
22 See “Consumer expenditures during COVID-19: An exploratory analysis of the effects of changing consumption patterns on consumer price indexes.” www150.statcan.gc.ca/n1/pub/62f0014m/62f0014m2020010-eng.htm; and “Adjusting the Consumer Price Index to the new spending realities during the pandemic,” The Daily (Oct. 8). www150.statcan.gc.ca/n1/en/dailyquotidien/201008/dq201008a-eng.pdf?st=FJEZmhzG.
23 www.rba.gov.au/publications/smp/2021/feb/box-a-consumption-patterns-and-consumer-price-index-weights.html.
Credit card and other payments records are also being accessed by academic researchers to compile price indexes that reflect current spending patterns. Much of this work, including the references just cited, has been driven by the need to quickly estimate higher-level aggregates during the pandemic. Cavallo (2020), for example, took as his starting point the latest available weights for the CPI and then updated them using credit and debit card transactions data collected by the Opportunity Insights Tracker.24 Cavallo’s COVID-19 period reweighting is only applied at the highest level of aggregation (although he does split the “food and beverages” category into three subcategories—food at home, alcoholic beverages, and food away from home25—disaggregations that the CPI publishes as a matter of course). Comparing the CPI and COVID-19–adjusted CPI weights yields changes in the expected directions: for example, food at home revised up from 7.58 to 11.28, transportation revised down from 15.74 to 6.25, and food away from home revised down from 6.19 to 3.13.
In the context of market disruptions during COVID-19, Reinsdorf (2020) recommended data blending procedures for updating CPI weights to ensure that they are less distorted by rapid changes in expenditure patterns exhibited by consumers brought on by extraordinary circumstances.26 As illustrated in the Statistics Canada example above, one such approach would use credit card and other payments data to produce a complementary index of short-term price change with weights reflecting spending patterns during the pandemic. More generally, such timely data on spending would also be valuable for quickly detecting the appearance of important new goods and to determine weights for their prompt incorporation into the basket.
3.3. OPPORTUNITIES, CHALLENGES, AND RECOMMENDATIONS
Leveraging a wider variety of data sources containing information on consumer purchases and changes in how these data are used have the potential to improve the timeliness and accuracy of upper-level weight estimates used to calculate the CPI. The inability of the current CE-based data infrastructure to detect and incorporate shifting purchasing patterns during the COVID-19 pandemic demonstrates well why timely weights are critical.
___________________
24 https://opportunityisights.org/.
25 Cavallo applied the same adjustment for food at home and alcoholic beverages, as he did not have separate spending data on alcohol.
26 Consistent with normal procedures, weights for the CPI will be refreshed in January 2022 based on CE data from 2019 to 2020. According to an official notice, BLS considered interventions but decided to maintain normal procedures. www.bls.gov/cpi/notices/2021/2022weight-update.htm.
Recommendation 3.1: To improve the timeliness of the CPI and the accuracy with which it captures changing buying patterns, BLS must (1) update upper-level weights—which currently, on average, lag 36 months behind actual expenditures in a given period—more frequently and rapidly, and (2) improve the accuracy of weights applied to specific items that the Consumer Expenditure Survey measures poorly and for which alternative data are likely more accurate.
Immediate steps that can be taken to improve the accuracy of the weights used in the CPI are to incorporate alternative data to offset the clearest weaknesses of the CE described above and to use two-year rolling averages of CE weights. Indeed, many statistical offices are already aggressively integrating nonsurvey sources into their item weighting and have implemented procedures that incorporate survey data more quickly. The recommendations below are intended to help guide research that is crucial for BLS’s capacity to maintain agility and flexibility in its weight-updating procedures both in ordinary times and to respond quickly to major shifts in consumption patterns such as those experienced during the pandemic.
3.3.1. Revising CE Weights More Frequently
A nationally representative survey conducted by a government statistical agency continues to be needed for benchmarking estimates of consumer expenditures in a way that links buying patterns to households. Thus, for the foreseeable future, a version of the CE—ideally, one optimized for its role in estimating CPI expenditure weights—will be needed. However, for the expenditure estimates to be relevant, particularly during times of rapid change, the lag with which the data become available must be reduced.
Recommendation 3.2: Ideally, the expenditure data used to calculate CPI weights would come from a single 12-month period ending no more than six months prior to their introduction. For example, new CPI weights introduced in January 2022 would reflect expenditure patterns from July 2020 to June 2021. This production schedule may take time to achieve so, as an interim step in mitigating the timeliness problem, weights should be updated annually using two-year rolling averages of the CE data. This approach should become part of the official measure as soon as possible.
Updating the weights every year can be done using the CE data that BLS already collects.27 Under this setup, the rolling weights would still lag real-
___________________
27 In the near term, one reason for continuing to use expenditure estimates based on 2 years of data is to maintain sample sizes needed to support metropolitan statistical areas level price indexes.
time market realities, but not by as much as they do in the current two-year cycle—it would provide an interim immediate improvement even if it does not reach the ideal. In addition to improving the timeliness of the updates, the compressed schedule would also smooth changes in the weights from one period to the next.
The objective in annual updating should be to shrink the lag between the endpoint of the expenditure data collection and weight updating.28 It should be possible to set a cut-off for the expenditure data at the end of the second quarter of a year for implementation in January of the following year. As noted, annual updating of the weights based on a two-year rolling average of the CE data is meant as an interim solution until BLS can develop methods that allow annual updating based on a single recent year of expenditure data.
Ultimately—in 10 to 20 years—even more detailed price and quantity information will be available for use in the CPI from a range of nonsurvey sources that could allow much more frequent updating of item weights. In the intermediate run, BLS could develop a hybrid approach to estimating consumers’ expenditure patterns that includes national accounts and credit card transactions data that could allow the reference period for weight updates to be compressed to just one year and the lag between the period to which they refer and the update to be shortened to a quarter or perhaps even just a month. Indeed, as documented above, some countries’ statistical offices—especially those in which high levels of cooperation exist between the business sector and statistical offices—are already moving quickly in this direction of blending different types of data.29 Typically, these countries use integrated expenditure and price data to construct the elementary aggregates, which are in turn combined using an annually chained Laspeyres index with weights from the preceding calendar year.
___________________
28 Currently, 36 months is the time from the middle of the expenditure data collection period to the middle of the index period. For example, the weights for 2017–2018 were used for the CPI from 2020 to 2021. The midpoint of the index period (January 1, 2021) is 36 months after the midpoint of the expenditure period (January 1, 2018). Under the recommended procedure, expenditures for one year from July 2018 to June 2019 would be used for the 2020 index, meaning that the endpoint of the expenditure period (June 2019) to the beginning of the index period (January 2020) is seven months. From midpoint to midpoint, it would run January 1, 2019, to July 1, 2020, or 18 months, cutting the lag in half. If expenditures for two years were still used, they would run from July 2017 to June 2019, and the average lag would be 24 months.
29 Eurostat, for example, produces a Lowe index at the higher levels of aggregation (because they can explain it to the public and they are used to it). But, at the lowest level of aggregation where scanner data are available, the agency appears willing to follow the ABS lead and experiment with multilateral methods. For more information, see Appendix 2A at the end of Chapter 2.
3.3.2. Broadening Sources of Data Used for Estimating and Updating Expenditure Weights
Comprehensive payment data on individuals’ spending from credit card issuers or from electronic payment processors (e.g., PayPal and Stripe) have the potential to substantially improve the timeliness and accuracy of expenditure weights estimated for the CPI; such data could also provide a source of direct information on higher-level purchasing trends that could be useful in assessing substitution and outlet bias. High-frequency and timely data on spending can also be used to quickly detect emerging, important (high expenditure) new goods and to determine weights for prompt incorporation of these new goods in the basket.
Transactions Data
As discussed in Chapter 2, the advantages and limitations of transactions data dictate how they can most effectively be used. For example, credit card data identify only relatively broad expenditure categories, although retailers often maintain and link information on detailed purchases to specific individuals/households. In contrast, transactions data from retailers, such as scanner data or the data used for the Adobe Digital Economy Index,30 do include product detail. While credit card data would be more useful if they included specific product codes, such detail is not always needed for estimation of upper-level weights.
Research is ongoing at statistical agencies regarding how best to address the challenges of using alternative data. Much of the challenge is in data blending—including, for the CPI, how best to coordinate and map geographic breakdowns and product detail in a way that brings internal consistency across data sources or indexes based on different sources—so that alternative data on consumer purchases can be used most effectively.
Recommendation 3.3: With supplementing and complementing the CE data in mind, BLS should invest in collecting comprehensive data for individual spending using electronic means of payments such as credit/debit cards or other electronic payment processors (e.g., PayPal or Stripe). Initially, these new data could be applied to the chained CPI-U or to a new experimental index. Later, after an adequate period of study, expenditure pattern estimates used to construct CPI weights should be derived as a blend of data on spending from (1) the CE, (2) timely private sources, and (3) the national accounts.
___________________
30 The software company Adobe Insights produces online transactions data that have been used to estimate spending on and quantities purchased of certain goods used (see Lasiy, White, and Pandya, 2020).
For this experimental research, it is likely that credit card data will only allow controlling totals (weights) for broad expenditure categories, while CE data can be used to estimate distributions for smaller subcategories. Given constraints about product detail availability and ability to link expenditure, price, and quantity data to households, population subgroups, and geographic areas, research into use of alternative data sources for estimating upper-level weights should be directed toward production of the national level CPI.
Even within the CE program, it may be possible to integrate transaction data. One option would be to redesign the CE such that household respondents have the option of completing the survey conventionally or of allowing access to electronic records (credit card, home-scanned data, etc.) in lieu of completing the eligible categories manually. Such streamlining could have significant impacts on accuracy and respondent burden.
In developing an experimental set of expenditure weights that update CE information with additional data culled from credit card and other transaction records, BLS should explore opportunities to collaborate with other statistical agencies, as Statistics Canada did with the Bank of Canada to produce its special project COVID-19 index. At the same time, as recommended in Chapter 2, BLS should explore options to work with other agencies. For instance, the Federal Reserve, because of its priority on using timely data, has considerable expertise in working with commercial data. Likewise, the Bureau of Economic Analysis has also done work with high frequency “real-time data,” with an emphasis on timely information for early estimates that will later be replaced by other (Census Bureau) data.
National Accounts Data
Because household surveys or other, alternative sources of information on household expenditures become available with a lag, agencies generally use the fixed basket approach that weights current price changes with expenditure share data from an earlier period (the Lowe formula) for their featured consumer price indexes. However, national accounts information can be used to produce a more accurate CPI. An advantage of PCE data, described above, is that the data are benchmarked to a census of retail establishments (conducted every five years) and a variety of other merchant-based sources, so they reflect a more comprehensive accounting of transactions on which to estimate how much was bought and how much was spent.
A disadvantage of the PCE data is that they are subject to revision. Assuming that updated CPI weights are introduced 13 months after the end of the year on which they are based (e.g., the weights introduced in January 2024 would be based on spending data from calendar year 2022),
the first annual revision of the NIPAs could be reflected in the PCE data used to estimate the CPI weights. Subsequent revisions of the NIPAs are likely to lead to relatively small changes in the numbers compared to the size of the sampling and nonsampling measurement errors of the CE.31
The idea of blending national accounts data into CPI weighting has been around for a long time (Triplett, 1997). The National Research Council report conducted through the Committee on National Statistics, At What Price? (NRC, 2002), recommended assessing the net advantages of using the BEA’s PCE to produce the upper-level weights for the national CPI. The idea would be to set up an experimental CPI that uses PCE-generated weights at the upper (243 item) level but that is otherwise no different from the CPI. PCE data also could be used to improve the official CPI:
Recommendation 3.4: One option for blending PCE and CE data that BLS should test for the purpose of updating upper-level expenditure weights in the CPI is to continue using the CE as the benchmark for most categories, but then integrate PCE data to adjust the acknowledged weakest categories of the CE.
BLS will need to carefully evaluate where to substitute data, but examples of problematic categories for the CE are “clothing” and “alcoholic beverages purchased for off-premises consumption.” The ratio of weights for the CE (interview) to PCE is 0.317 for the former and 0.22 for the latter, indicating very large underreporting problems. In contrast, in 2010, the ratio of CE (interview) to PCE exceeded 0.94 for imputed rent, rent and utilities, and new motor vehicles and 0.80 for food at home and communication. In general, larger items estimates (from interview survey) track more consistently between the CE and the PCE (NASEM, 2013). For cases where these discrepancies in weights change rapidly, as in the air travel example cited above, a CPI based on higher frequency information can be invaluable for detecting moments when there has been a disruption.
The experiences of other NSOs that already use national accounts data in their CPIs can be drawn upon to expedite this line of research. An example of the strategy to target problematic expenditure categories is Statistics Canada’s use of national accounts data for information on alcohol purchases. ABS also provides a model for between-CE updates: Its Household Expenditure Survey provides the benchmark information on the expenditure weights of Australian households, although, as of 2018, ABS moved to annually re-weighting using HFCE data from the national accounts.
___________________
31 Fixler, de Francisco, and Kanal (2021) describe the magnitude and direction of revisions to PCE and Gross Domestic Product.
Exploring the use of PCE spending data used by BEA for the national accounts to buttress specific CE categories is a low-hanging fruit, and indeed BLS has had a research program to study level differences in the two sources.32 BEA and BLS should collaborate on this project, which could also be extended to evaluate whether the PCE data provide a good predictor of the CE data. While improving the timeliness and accuracy of the weights of the national CPI-U should be treated as the most important objective, the extent to which achieving improved timeliness and using transactions or national accounts data entails a sacrifice of accuracy in the detailed expenditure patterns for local areas and demographic groups, such as the demographic groups covered by the CPI-W and CPI-E, might also be explored.
Survey Options
Capturing changing consumption behavior during dramatic circumstances such as pandemic lockdowns could conceivably be done within a survey framework; however, it would require something close to a continuous survey (and one that is processed in near real time). Diewert and Fox (2020a) concluded that “for many purposes, it would be useful for statistical agencies to establish a continuous consumer expenditure survey.” A continuously (or even monthly) updated set of weights would require a radical shift in methodology and data sources used, and any index built on such an approach would have to be assessed on an experimental basis for a significant period of time.33 Given that most statistical agencies do not have the resources to estimate representative baskets in anything close to real time, a hybrid data approach—one in which a consumer expenditure survey is still central, but new data sources are integrated for intra-benchmark updates—offers a particularly promising strategy. The hybrid approach entails estimating recent expenditure patterns using the best data source for each level of aggregation and item considering the goals of timeliness and accuracy and the weaknesses of the CE. As described above, national accounts and payments (credit and debit card) data are promising sources for at least some of the high-level weights, perhaps with some adjustments based on CE survey data.
For the foreseeable future, CE-type data will still be relied upon for details about consumer units and for completeness and representativeness, especially for item categories for which its accuracy is believed to be good.34
___________________
32 See, for example, BLS (2018); Blair (2015); Carroll, Crossley, and Sabelhaus (2015); Johnson (2017); and Passero, Garner, and McCully (2015).
33 The U.S. CE is in the field continuously, but the data are only combined for weight updating sporadically. Monthly weight updates are only worth considering for the Chained CPI.
34 For an assessment of CE data quality, see Chapter 5 in NRC (2013) and Parker, Souleles, and Carroll (2015).
Even so, the CE could be retooled to work in conjunction with alternative data sources (e.g., transaction/credit card data) so that weights are updated between CE benchmarks as has been done in some recent academic research.35
In the discussion above, it is recommended that BLS move more aggressively toward a blended data approach to establishing upper-level expenditure weights for the CPI. The presumption is that, in addition to national accounts data, BLS would purchase consumer transactions data (including prices and quantities where possible) from private companies on a continuous basis for a sample of households and items. For purposes of estimating expenditure weights, scanner data seem most appropriate as price and quantity information is often available, whereas web-scraped data generally do not offer the latter.
At this point, most official price measurement programs are using scanner data from retailers, mainly covering groceries. But consumer panel data are also produced and sold (usually, at fairly reasonable prices36) by companies such as Nielsen that would allow BLS to begin testing their use in the CPI immediately.37 The advantage of consumer panel data is that purchases are linked to the households making them, which allows indexes for subgroups of the population to be calculated more naturally. Currently, consumer panels do not typically collect inventory and consumption information, so there are challenges, for example with new and disappearing goods, to be overcome in using these data. However, assuming the home-scanned data are used primarily for construction of weights that represent spending for the entire year, the lumpiness of purchases and the lags in buying new goods caused by consumption out of inventories will be minimally consequential.
An alternative to the data purchase model to be considered for the longer run would be for BLS to set up an in-house operation for collecting the needed data. Since scanner data from aggregators are not perfectly
___________________
35 Cavallo (2020) used publicly available data from credit and debit card transactions to update official CPI weights and build an alternative “Covid Basket.” Chetty et al. (2020) built a database to measure economic trends more broadly “at a high-frequency, granular level using anonymized data from private companies” to track impacts of COVID-19 on the economy more quickly than is possible using conventional surveys.
36 Nielsen data are made available to researchers through a collaborative arrangement with the Chicago Booth Kilts Marketing Center. Data subscription prices, for individuals and institutions, can be found here: www.chicagobooth.edu/research/kilts/datasets/nielseniq-nielsen/pricing.
37 As discussed in Chapter 2, and in the context of creating subpopulation price indexes in Chapter 5, the Nielsen Consumer (Homescan) Panel is the most prominent example of this kind of data. The Homescan panel tracks the expenditures of about 55,000 households that scan the bar codes of their purchased items. Prices are then downloaded from the store where the item was purchased.
suited for use in the CPI (for reasons discussed in Chapter 2), this in-house operation would ideally be set up to collect scanner data directly from households.
Recommendation 3.5: BLS should begin exploring development of a household-based scanner recording program that would capture prices, quantities, and item characteristics of purchases made by surveyed respondents. In addition to its value for estimating item strata weights, this method of obtaining spending information would be useful for construction of elementary aggregates.
As a first step in such a project, a retrospective study demonstrating the benefits of a home scanner data approach (using historical data from private companies IRI or Nielsen) could provide insights about the best way forward. If BLS could learn to conduct Homescan-type data collection, it would carry with it the advantage of retaining control over the source, without worrying about prices going up or the source drying up, and the program could be designed in a way to ensure that the data are representative.38 IRI and Nielsen have already demonstrated that it is feasible to collect and use data in a timely way, and it could be viewed as an alternative survey method similar to how the computer-assisted personal interview (CAPI) method replaced home visits or phone calls years ago. However, thinking longer term, BLS should consider “leapfrogging” traditional methodologies of handheld scanners that require large initial investments and look to modern approaches using a custom mobile phone app. Technologies are changing fast, so the most durable solutions may be based on flexible, mostly software-based approaches. As recommended in Chapter 7, this project would benefit from coordination with the Census Bureau, which would benefit from access to such price and quantity data from retail sales, and BEA, which would also benefit if CPI weights incorporated national account information.
Sorting through these data infrastructure options, particularly the boldest ones, requires statistical agencies to envision the future data environment and what CPI users will need in 10 or 15 years. BLS requires timeliness for the flagship CPI but recognizes the value of population subindexes. In the current data setup, these two objectives have somewhat conflicting data requirements—it would be easy to use alternative data sources to produce a more timely CPI-U if the CPI-E, regional indexes, subgroup indexes, and other measures did not have to be considered. One way for BLS to make a large leap forward is to create its own, ambitious in-house data collection
___________________
38 For such data collection, cooperation may still be needed from the retailers, which could be an impediment to BLS developing its own home-scan data.
program that combines household scanner data as part of the CE, information from credit cards and other electronic transactions, and web-scraping. The other way BLS could handle the conflict would be to release the headline index in a timely manner but release subgroup indexes with a lag. Because of the need to not revise the headline, the subgroup indexes could be scaled to aggregate up to the headline. BLS would no longer build up the headline from the subindexes. Instead, the agency would estimate and release the headline index and then, later, when it had the detail, it would estimate the subgroup indexes and these indexes would be scaled so that they add up to the previously published headline index.
3.3.3. Increasing the Visibility of the C-CPI-U
For practical reasons—most notably, its advantages in terms of consistency in aggregation, simplicity, and ease of interpretation—it is clear that BLS must use the (nonchained) Laspeyres/Lowe formula for the flagship CPI-U. Further, revisions to the flagship CPI-U are ruled out by its uses for escalation of payments. However, many of the measurement advantages of a more flexible formula and revision policy can be realized by increasing the visibility to data users of the C-CPI-U.
BLS can raise the profile of the C-CPI-U by, among other actions, giving it more prominence in news releases, BLS publications, and on its website, as well as highlighting its advantages for many purposes. To provide researchers and analysts with a long time series, the agency could backcast the C-CPI-U historically to 1960 or 1970 incorporating the corrections from their research price index series.
Chained price indexes, precisely because they capture changing consumption patterns, also have some advantages for many purposes including indexation.39 The chained index also likely would be preferred for many special applications, such as assessing cost-of-living changes during COVID. For many of these applications, a need for updates (especially if modest) to gain timeliness would be favorable a tradeoff. For example, a relevant COVID-19 CPI, becomes possible.40 Much of the experimental work using alternative data described in this chapter can be carried out in the context of the C-CPI-U. Further improvements of the C-CPI-U as
___________________
39 For example, the “Simpson-Bowles” report (The National Commission on Fiscal Responsibility and Reform, 2010) recommended government-wide replacement of the CPI-W and CPI-U with the chained CPI. In fact, a modified version of the C-CPI-U proposal was included in the Obama Administration’s budget for Fiscal Year 2014.
40 The Fisher formula uses the baskets from both the base and the current period and is well-suited for chaining. For the pandemic period, Diewert and Fox (2020a) recommend using a Fisher index, linking the first post-lockdown period to the last pre-lockdown period, for measuring price changes during this aberrant period.
suggested in this chapter would provide useful comparison to the official CPI and in disruptive episodes like COVID-19 would provide one gauge of how far off weights were in the official CPI.


