
6
Supplemental Subgroup Price Indexes
New data sources present opportunities to improve the accuracy and timeliness of both the elementary item-area price indexes (Chapter 2) and of the higher index aggregation levels (Chapter 3) in construction of the Consumer Price Index (CPI). One related research and policy need to which the Bureau of Labor Statistics (BLS) has responded over the years is to produce price indexes (as well as other economic statistics) tailored to measuring trends for specific population subgroups. Both conventional data sources, such as microdata from expenditure and budget surveys, and new data sources, such as detailed transaction data that can be linked to shoppers’ characteristics, create new opportunities to study price changes faced by different population groups.
6.1. MOTIVATION
The rationale for producing price indexes for population subgroups is clear for purposes such as adjusting Social Security benefits (which are mainly received by older people), setting marginal tax rates (which increase with income level), and establishing consumer unit needs and resource levels that regulate transfer payments of various safety net programs (for which only certain groups are eligible). Broader public policy questions related to income and wealth inequality, social welfare, and poverty could also be informed by more precise measures of differential inflation rates faced by specific groups, such as lower-income households. Of course, the motivation to marshal the resources needed to produce subgroup indexes is more powerful if it can be established that the rates of inflation experienced
by different groups or by people in different geographic locations vary significantly. The assessment of evidence by this panel, as well as other experts (including a National Academies’ panel, see NRC, 2002, p. 222), is that, at least during some time periods, considerable heterogeneity does exist in the purchasing patterns and shopping behavior of, as well as the prices paid by, consumers with different demographic characteristics.1
6.2. RESEARCH FINDINGS
One factor that can lead to differential inflation rates—and, as it turns out, the easiest one to measure—is that different groups of people tend to purchase different baskets of goods and services. In other words, people allocate their consumption budgets differently across CPI item categories in a way that correlates with income and other demographic characteristics. This heterogeneity occurs at an individual consumer unit level, and may also be associated with observed group patterns:
Some [expenditure patterns] are idiosyncratic among individuals—vegetarians and meat eaters, book lovers and sports enthusiasts, travelers and homebodies. But many of the differences are systematically related to the economic, demographic, and locational characteristics of households. Lower-income households spend, on average, a higher fraction of their income on food and clothing than do higher-income households and a smaller fraction on travel and entertainment. The elderly tend to devote a smaller fraction of their budgets to durable goods and clothing and a larger fraction to travel and medical care than do non-elderly households. People who live in the South spend less on heating fuel and more on air conditioning than those in the North (NRC, 2002, p. 223).
Variation in purchasing patterns, when measurable, leads to a unique set of weights for each identified segment of the population. The mechanics of the calculation are readily illustrated by the several versions of the CPI already published. BLS currently produces official price indexes for two population subgroups—all urban consumers (CPI-U) and urban wage-earners and clerical workers (CPI-W; see Box 6-1). Additionally, on an experimental basis, BLS publishes a price index covering urban consumers aged 62 and older (CPI-E). Although the CPI-E is not currently used for indexing Social Security benefits, BLS has long been interested in a price index that could be used for that purpose; development of the CPI-E was
___________________
1 NRC (2002), Chapter 8, provides a comprehensive examination of the conceptual basis of population subgroup indexes as well as practical data issues that complicate implementation.
motivated in part by that line of research.2 These three versions of the CPI differ only in terms of the expenditure weights used to aggregate the component indexes. For example, the 2017–2018 expenditure weight for medical care is considerably higher for the CPI-E (12.20) than it is for the CPI-U (7.29); conversely, the weight for transportation in the CPI-E is lower (12.97) than it is in the CPI-U (15.16). While the weights differ across the CPI-U, CPI-W, and CPI-E, these indexes are constructed using the same set of price changes for each item strata from the same sample of urban areas.
Price measurement research using the simple reweighting approach (e.g., Amble and Stewart, 1994; Garner, Johnson, and Kokoski, 1996) has tended to detect only minimal differences in inflation rates faced by different groups. Comparison of the CPI-E and CPI-U (and the CPI-W, for that matter) offers a case in point that simple reweighting typically leads only to minimal differences in index performance. As shown in Figure 6-1, a comparison of average 12-month percent changes in the CPI-U and CPI-E reveals a difference that averages only 0.16 percentage point over the entire period (the CPI-E tends to have slightly larger increases).
Statistical agencies in other countries also regularly produce price indexes based primarily on reweighting to reflect subgroup expenditure patterns. For example, the Office for National Statistics in the United Kingdom publishes “Household Cost Indices,” developed to measure the change in household costs over time for different population subgroups. These indexes have indicated, for example, that “retired households have experienced higher costs growth than non-retired households since May 2017,” mainly due to different weights for electricity and council taxes.3 The Household Cost Indices are aggregated using democratic weighting, wherein all households are assigned an equal weight, instead of plutocratic weighting, wherein households are implicitly represented in proportion to their total spending levels.4 Most nations’ headline CPIs, including those in the United Kingdom and United States, are plutocratic, meaning that they reflect the consumption patterns of upper-income households more closely than those of lower-income households.
___________________
2 Currently, adjustments to Social Security benefits are still based on percent changes in the CPI-W (Cage, Klick, and Johnson, 2018). Arguments against adopting the CPI-E for the purpose are that it is associated with a higher sampling error than the alternatives and fails to address upper-level substitution bias.
3 www.ons.gov.uk/economy/inflationandpriceindices/bulletins/householdcostsindices/thirdpreliminaryestimates2005to2019.
4 NRC (2002), Chapter 8 on approaches to aggregating across households, provides a complete discussion of the implications (and appropriate uses) of a democratic index in which individual price indexes are estimated for a representative sample of the whole population and then averaged by assigning the same weight to each consumer unit regardless of the magnitude of their total consumption expenditures.
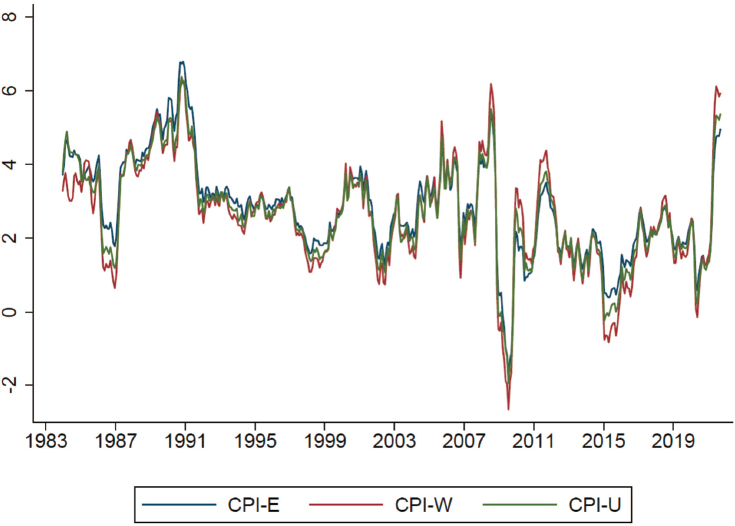
SOURCE: Panel-generated using BLS data.
Researchers outside statistical agencies also have developed subgroup indexes that use different patterns of expenditure weights across groups. For example, using microdata from Eurostat’s European Household Budget Surveys and the Harmonized Index of Consumer Prices, Gürer and Weichenrieder (2020) found that for the period 2001–2015, the “consumption bundles of the poorest deciles in 25 European countries have, on average, become 11.2 percentage points more expensive than those of the richest deciles” (p. 1). Broadly speaking, the researchers found that price increases had been more rapid for necessities—e.g., food, shelter, and utilities—which constitute a higher expenditure share for lower-income households than for luxury goods and services having to do with, for example, recreation and culture, or car purchases.
Academic researchers have also used microdata on expenditures to calculate U.S. household-level inflation rates. McGranahan and Paulson (2006), for example, used CE data and item-specific CPI data to construct the chain-weighted “Chicago Fed Income Based Economic Index” for a variety of different demographic groups. The authors found that, for the period 1983–2005, the inflation experiences of the different groups were
“highly correlated with and similar in magnitude to the inflation experiences of the overall urban population” (McGranahan and Paulson, 2006, p. 26). The exception to this pattern found by the authors were the elderly, who faced an 11 percentage point (or 5.5 percent) higher cumulative inflation rate compared with the average over the period of the study.
On the other hand, analyzing the period 1984–2004, Hobijn and Lagakos concluded that the distribution of inflation experiences across households exhibited a large amount of dispersion. Additionally, they found that a democratic index (one that weights price changes faced by each household equally) constructed for the latter part of the period was higher than the plutocratic index (one that weights price changes according to each household’s share of aggregate expenditures), suggesting that poorer households (with greater representation in the former) experienced higher inflation than richer households. More rapid price growth for gasoline and food prices contributed to the trend. Michael (1979), Hobijn and Lagakos (2005), and Hobijn and Sahin (2009), applying household-specific consumption bundles to estimate indexes of average prices for relatively broad categories of goods (mainly at the CPI item strata level), reached similar conclusions. These analyses continued to assume that all households pay the same price for specific goods purchased and buy the same mix of goods within each item stratum (Kaplan and Schulhofer-Wohl, 2017).
Their value to research notwithstanding, the deficiency in the alternative CPIs estimated in the way described above is that they do not account for the multiple factors affecting prices paid by different groups. Ideally, for a comprehensive measure of price inflation, any differences in the prices paid by different groups—particularly for big-ticket items that could really make a difference, such as medical care and housing/shelter—would be taken into account along with differences in spending patterns. Housing, discussed at length in Chapter 4, is a particularly important case of inflation differentials faced by subgroups defined by geography since prices (and, at times, changes in prices) vary a great deal from one part of the country to another and between urban and rural areas.
Recent research, some of which is described below, has been based on more diverse data sources that allow factors beyond expenditure shares to be considered. This research has revealed clear patterns of differential price inflation, in particular across income groups. It strongly suggests that if statistical agencies are serious about tackling differential price inflation, they must move beyond the exercise of simply reweighting price quotes from the official CPI. To create meaningful price indexes for demographic subgroups, it will be necessary to combine, for each consumer unit, monthly information on the prices it has paid, the amount expended on each item, and its basic demographic characteristics.
As a first step toward building the capacity to fully portray differential inflation, household- or group-specific inflation rates should reflect the fact that, in addition to buying a different mix of goods and services, households purchase goods and services from different outlets and, therefore, face different prices. Even if all consumer units patronize the same outlets (for example, Amazon during the pandemic) such that prices paid by different groups for the exact same product converge, the rich and poor, old and young, or other different demographic groups will continue to buy different products within the elementary index level. For example, high-income and low-income consumer units may tend to frequent different restaurants or hotels. Comprehensive subgroup inflation measures would therefore account for different consumption patterns at a very detailed level. They would also take into account “effective prices paid, spending shares on new and existing goods, and demand elasticities—all of which may vary across households, and in particular along the income distribution” (Jaravel, 2019, p. 7).
Creating a data collection apparatus along the lines implied above is far easier and more cheaply said than done. The key challenge in this proposition, with which BLS is intimately familiar, is that the data system currently underlying the CPI collects prices paid but does not link those prices to specific households. Put another way, information about consumers and how they budget their income is collected from a household survey, while price information is collected predominantly from retail outlets; thus, characteristics of purchasers cannot be linked with the prices they pay. Since retailers generally do not typically have full demographic information about their customers (although this is changing rapidly), the most direct route to a data source that combines these key pieces of information would involve “collecting the monthly price data, as well as expenditure patterns and demographic information, directly from consumers” (NRC, 2002, p. 229).
As described in Chapter 3, household-based data on purchases and prices paid for many items do exist in various commercial data sources that have been used in price measurement research. Research by Kaplan and Schulhofer-Wohl (2017), for example, used data from the Kilts-Nielsen Consumer Panel (KNCP) to estimate differential inflation rates, most prominently by income, at the level of the household.5 The authors found that
___________________
5 The project is a partnership between The University of Chicago Booth School of Business and the Nielsen Company in which marketing datasets are made available to academic researchers. The dataset “records the prices, quantities and specific goods purchased in 500 million transactions by about 50,000 U.S. households from 2004 through 2013.” www.chicagobooth.edu/research/kilts/datasets/nielsenIQ-nielsen.
Households with low incomes, more household members, or older household heads experience higher inflation on average, whereas those in the Midwest and West experience lower inflation [and that] over the nine years from the third quarter of 2004 through the third quarter of 2013, average inflation cumulates to 33 percent for households with incomes below $20,000 but to just 25 percent for households with incomes above $100,000 (p. 3).
Crucially, Kaplan and Schulhofer-Wohl found that the greatest source of heterogeneity in households’ inflation rates for the goods they track is variation in prices paid for the same types of goods—not from variation in broadly defined consumption bundles of the type that would be picked up in indexes based only on expenditure weight adjustments. Roughly two-thirds of the variation detected by the authors originated from differences in prices paid for identical goods while only about one-third was found to come from differences in the mix of goods within broad categories; and “only 7 percent of the variation arises from differences in consumption bundles defined by broad categories” (p. 2).
Employing a somewhat different approach, while using the same KNCP data, Jaravel (2019) also estimated inflation rates in the United States as a function of income. For this research, Jaravel assumed that all households within a given range of income (such as all households earning more than $100,000 per year) have the same consumption bundle and pay the same price for each good. Covering the period 2004–2015, Jaravel measured inflation inequality using a linked dataset in which spending shares are based on the CE and price changes (at the level of product categories) for most goods and services are based on the CPI data series. The matched CE-CPI dataset provides 256 detailed product categories. However, for consumer goods observable in the KNCP data—including food products, household supplies, and health and beauty products—he incorporated product-level data on both prices and quantities; these goods “account for about 30-40% of expenditure on goods, or about 15% of total expenditures” (Jaravel, 2020, p. 8).6 A key finding was that annual inflation was approximately 0.65 percentage point lower for households earning above $100,000 a year when compared with households making $30,000 or less per year. The headline finding of Wimer, Collyer, and Jaravel (2019)—who
___________________
6 Jaravel identified several key benefits to data that include barcodes. For example, he noted that “meaningful quality change” typically prompts a change in universal product codes (UPCs); additionally, discontinued UPCs (products) can be readily identified. Jaravel’s research on differential inflation faced by low- and high-income consumers in the UK uses data collected by the market research firm Kantar FMCG Purchase Panel, which is similar to Homescan in the United States, in which participants record UPCs for their purchase using a hand-held scanner.
used the Jaravel (2020) estimates based on the linked CE-CPI sample and Nielsen data to re-estimate recent trends in poverty and income inequality—was that, because of unmeasured inflation inequality, income inequality and poverty rates may be significantly underestimated for the United States over the period 2004 to 2018. For example, using this series for the lowest income quintile, three million additional people are found to have been living below the poverty line in 2018 compared with official numbers based on official CPI estimates.
The major limitation of scanner sources such as the KNCP data is that the scope of coverage is confined to goods sold in retail outlets. Unlike research based on the household expenditure surveys—such as noted above by Hobijn and Lagakos (2005)—the scanner-based research is unable to measure the impact on subgroup price inflation of quantitatively important expenditure categories such as medical care and housing “which have all been found to be important sources of inequality in inflation rates” (Kaplan and Schulhofer-Wohl, 2017, p. 3). As detailed in Chapter 4, shelter alone accounts for greater than 30 percent of the household spending basket in the CPI.
Due to this limitation of products covered by scanner data, researchers have turned to other sources, including surveys not traditionally used in the CPI. Larsen and Molloy (2021) examined differences in quality-adjusted rent growth for households at different points in the income distribution for the period 1985 to 2019. The authors estimated rent changes facing households in different income groups using data from the American Housing Survey (AHS)—a nationally representative panel that tracks housing units over time—on individual housing units, grouped by income of the residents. Their analysis accounts for differences in the price of housing services across groups as well as differences in the fraction of expenditures spent on housing. They did not detect large differences in inflation across income groups over their sample period. This result contrasts somewhat with the results in Moretti (2013), who calculated differences in shelter inflation rates by education group using information on variation across cities in rent growth and variation in location choices by education groups; he found higher shelter inflation for college-educated people over the period 1980 to 2000. However, after adjusting for changes in amenities, Diamond (2016) found lower shelter inflation for the college-educated population.
For medical care (discussed in Chapter 4), another area where prices faced, quantities purchased, and quality received are likely to differ by income group, insurance claims datasets provide a rich source of information. Wimer, Collyer, and Jaravel (2019) documented inflation inequality in health care using comprehensive claims data along with linked employer-employee datasets for Utah between 2012 and 2015, finding that “there
was higher inflation for treating conditions that affect low-income groups more, another source of inflation inequality.”7
BLS and other statistical agencies will also need to develop plans for obtaining price and quantity information needed for improving the measurement of inflation in other areas where electronic transaction data are not typically available. The service sectors represent a sizable part of the economy—and one where higher- and lower-income households often display very different consumer behavior—that currently is not well covered by electronic data sources.
6.3. OPPORTUNITIES AND NEXT STEPS
An empirical consensus is emerging that, at least during some periods, price inflation has varied across population subgroups as well as across locations. Although still nascent, research cited in the previous section convincingly makes the case that high- and low-income groups in particular likely experience differential inflation rates for at least some types of goods and services, and measuring differences in prices paid for the same or similar goods is an important part of the story. Among the possible explanations for this finding, all requiring further investigation, are liquidity constraints inhibiting low-income households from taking advantage of sales and bulk discounts (Orhun and Palazzolo, 2019); greater flexibility of high-income households to substitute toward alternative goods or outlets (Argente and Lee, 2020); and more rapid innovation in product categories that high-income households tend to purchase (Jaravel, 2019). The digital divide also factors into differential inflation rates faced by higher and lower income consumer units. Data from Adobe’s Digital Economy Index found online prices over the period 2014 to 2017 to be more than three percentage points lower than the headline inflation rate of 6.8 percent. Crucially, “shopping online is far more common among high-income people…and during the pandemic the practice has grown more prevalent” (Goolsbee, 2021). Another possible source of differential inflation rates is that outlets in low-income neighborhoods have fewer direct competitors given that consumers likely have lower mobility and ability to shop elsewhere. Research and policy making stand to benefit a great deal if these trends can be more accurately measured and, in turn, better understood.
The potential return from investments in developing income-defined subgroup price indexes is further enhanced by ongoing work at the Bureau
___________________
7 Jaravel notes other potential data sources that could be exploited for measuring inflation inequality in the space of digital “free” goods, including Google, Skype, Wikipedia, maps, messaging, music, and all smartphone apps. Large-scale online choice experiments could be used for this purpose, as in Brynjolfsson et al. (2020).
of Economic Analysis (BEA) to produce prototype statistics on the distribution of personal income across households, for which price deflators will be needed. BEA’s goal in estimating the distribution of personal income over time (the initial set of estimates does so by decile, quintile, top 1 percent, and 5 percent) is to “provide a new tool for assessing how households share in the nation’s economic growth.”8 Interest in price indexes and inflation rates appropriate for deflating these new measures of income and, more broadly, for measures of well-being (social welfare) will likely continue to grow. BEA also has research under way to develop Personal Consumption Expenditures statistics by income decile.
Recommendation 6.1: Because of the urgency of issues related to income and wealth inequality, social welfare, and poverty, developing price indexes for population subgroups along the income distribution should be a high priority for BLS. Identifying data sources that would ultimately allow production of price indexes by income quintile or, if possible, decile is a key part of this work.
Income-based CPIs, even if only experimental, would inform cost-benefit analyses, taxation policies, and understanding of secular macroeconomic trends, including structural change, changes in the labor share and interest rates, and labor market polarization. If a “Homescan-type” data source can be developed that ties purchases to households (as recommended in Chapter 3), it will open up a wide range of possibilities for creating a range of subgroup indexes that go beyond simply using different expenditure weights.9
Twenty years ago, the seemingly obvious first step in creating capacity to estimate accurate expenditure weights at subnational levels, and, in turn, facilitating subgroup CPIs, would have been to expand the CE. It is well documented that the survey’s current sample size does not allow for “production of non-urban-area indexes or regional price-level comparisons; nor does it support accurate price indexes for subpopulations such as the elderly, minorities, or the poor, particularly at subnational levels” (NRC, 2002, p. 252). Beyond price measurement, other national statistics such as poverty and savings rates that require data from the CE could also benefit from a larger national sample (Triplett, 1997).
___________________
8 Full documentation of the distribution of personal income project can be found on BEA’s webpage: https://www.bea.gov/data/special-topics/distribution-of-personal-income.
9 While this chapter emphasizes price indexes for subgroups defined by income level, there are other important population dimensions to consider. Price indexes for subgroups defined by age (e.g., older populations) that account for differences in prices paid should also be a high priority because of their potential applications to policy programs. As revealed by Regional Price Parities developed by BEA, there is also considerable regional dispersion of inflation rates.
While the above conclusions are no doubt correct, it has become less clear in recent decades that expanding the CE is the most effective route to building capacity for estimating subgroup price indexes or, as argued in Chapter 3, even to making the expenditure share weights for the flagship CPI more accurate. A clear cause for concern is the future viability of the CE—specifically, the dual problems of declining response rates and increasing costs—a point made repeatedly in this report.
Even more germane to the question of subgroup indexes, however, is the need to simultaneously collect both expenditure data and timely information on prices paid at the detailed item level. As evidence accumulates of differential price inflation experiences for similar (or identical) goods purchased by different households, the inadequacy of indexes constructed solely by re-weighting expenditure shares has become apparent. Indeed, indexes based on such partial information are just as likely to mislead as to enlighten because, in a sense, they only pretend to answer a question that they are not equipped to answer. For this reason, other directions should be pursued when planning the development of price indexes for population subgroups.
Recommendation 6.2: Even though the marginal cost of such exercises is not high, valuable CPI program resources should not be devoted to developing additional subgroup price indexes that simply entail a reweighting of upper-level expenditure categories.
The authoring panel of At What Price? argued that “BLS should explore collecting prices in a way that allows them to be associated with household characteristics,” a proposal that would require additional resources for data expansion (NRC, 2002, p. 241). Although the current panel agrees with this conclusion, the point made above—that putting all resources for developing subgroup price indexes into the CE would be the wrong way to go—is worth reiterating here. Since data are needed not only on broad expenditure shares, but also on within-strata shopping behavior and effective prices paid, BLS will need to pursue a more expansive data infrastructure for measuring differential inflation across the income distribution.
An important first step in BLS’s research agenda should be to identify and report on the most promising data sources for linking prices paid to the households (or groups of households) making the purchases. As described in Chapter 3, an admittedly ambitious long-term vision is to fund establishment of an in-house capacity for BLS to collect and coordinate electronic transaction data for tracking prices and product information for individual purchases. Such a program might include setting up a home scan project—perhaps, initially, as a small-scale pilot within the
CE—in which participants record their purchases or scan their final receipts. But several options are available for linking prices paid to particular households. In the shorter run, during the testing phase, it is likely that BLS will have to buy data;10 in the longer run the agency may be able to collect its own data directly.
As with other aspects of CPI modernization discussed in this report, the real long-term promise for creative initiatives for subgroup indexes comes with the increased availability of microdata—in particular, household-based scanner data and perhaps transactions data from credit/debit card purchases to help estimate expenditure weights—that contain information on prices that individual households actually pay and on details about the items purchased. These kinds of data allow comparisons of the prices paid by goods with the same barcode across households with different incomes or other characteristics.
Where possible, these data elements should be used in ways that complement the statistical system’s most important survey sources in a blended data infrastructure. For example, the ACS is a valuable source of information on household characteristics such as income and geography. Moretti (2013) used ACS data on rents to examine rent inflation by education group. At some point, it may become viable to link ACS records with data on household transactions from credit card and other electronic data sources. This kind of data integration, where prices of purchases are linked to specific households, would revolutionize statistical agencies’ capacity to develop subgroup price indexes.
While opening new doors for studying expenditure patterns at the granular levels needed to more fully measure differences in inflation by income group, electronic transactions data, at least as currently generated, do not cover all consumer expenditures; indeed, several key categories are missing. For this reason, as described by Jaravel and O’Connor (2020), the next generation of empirical studies of inflation inequality will need to draw not just from scanner data for tracking fast-moving consumer goods, but also from additional, alternative data sources on other sectors.
Recommendation 6.3: To identify and obtain the data necessary to estimate accurate subgroup price indexes, no one size will fit every category of goods and services. BLS will have to be creative and flexible in finding and blending different data sources.
___________________
10 The Nielsen Consumer (Homescan) Panel is the most prominent example of this kind of third party. The Homescan panel tracks the expenditures of about 55,000 households who scan the bar codes of their purchased items. Prices are then downloaded from the store where the item was purchased.
Exploiting commercial datasets on a range of household purchases will be essential. The above-described research linking individuals to their purchases strongly suggests the need for approaches that blend multiple data sources in a way that account for the full range of consumer expenditures. Especially important are those categories that are likely to impart disproportionate impacts on inflation measures. The goal should be to take advantage of both survey data, typically from statistical agencies, that cover the full consumption basket, including item categories for which electronic transaction data are still incomplete, and commercial data sources that allow deep analyses of price and product detail for specific sectors.
BLS’s research program will initially need to focus on a limited set of goods for which data on prices paid and incomes of purchasing households are available. As also recommended by NRC (2002), work on subgroup indexes, designed to investigate several alternative approaches, should be initially conducted for a selection of commodity categories and demographic groups. As this research develops, BLS should be open to publishing a range of experimental price indexes as warranted by research and user needs. As progress is made on developing subgroup price indexes, BLS will need to maintain a strong communications effort to help users understand the best ways to utilize newly developed indexes as well as their limitations. This communication strategy may be all the more important for subgroup index programs since they have significant implications if used for indexing.


