
2
The Potential of Alternative Data Sources to Modernize Elementary Indexes
The Bureau of Labor Statistics (BLS) has stated its strategic objective to “convert a significant proportion of the CPI [Consumer Price Index] market basket from traditional collection to nontraditional sources and collection modes, including harnessing large-scale data, by 2024” (BLS presentation to the panel, October 7, 2020). Implementing this goal will involve a paradigm shift in the way data inputs are evaluated in terms of fitness for use. Even with a continued role for surveys in the CPI data infrastructure (and in economic statistics broadly), BLS will have to take steps to reduce the program’s reliance on the “full probability sampling” approach. The agency will also need greater flexibility regarding how closely new data and methods must replicate what has been done historically.
This chapter focuses on the CPI’s elementary indexes, the most detailed item-location level at which prices are aggregated. Current methods are briefly reviewed, then alternative data sources—focusing on various types of scanner and web-scraped data—are assessed for their potential to improve the accuracy, coverage, and timeliness of elementary indexes. Challenges to implementing new data and new methods, of which BLS staff are keenly aware, are also considered.
2.1. CURRENT CPI METHODS AND DATA
The CPI’s elementary indexes aggregate over groups of goods or services that are “as similar as possible” and that are varieties that may be expected to display similar price movements (IMF et al., 2020). In the U.S. CPI, more than 100,000 items are sampled and aggregated into component
indexes. These basic indexes estimate the average price change for each of 243 items (241 commodities and services plus 2 housing item categories) within each of 32 geographic index areas for 7,776 (32 × 243) area-item combinations.1 Prices are collected for the more than 100,000 goods and services from about 23,000 retail establishments in 75 urban areas across the country.2 Even with this extensive data collection, only a small portion of the many goods, services, or varieties within an elementary index can be sampled.
The outlets that BLS selects to sample for the CPI are chosen independently for each geographic area with a probability proportional to each outlet’s reported expenditures from the Consumer Expenditure Survey (CE). The outlet sample is merged with an independent sample of items that consumers buy. The outlet and item samples are updated each year for roughly 25 percent of the item categories (or “strata”) in each primary sampling unit (PSU). For most commodities and services, price collection from the selected outlets takes place monthly in only the three largest geographic areas (Chicago, Los Angeles, and New York); it is conducted every other month in other PSUs. Expenditure weights are assigned at the item strata level—in the case of the Consumer Price Index for All Urban Consumers (CPI-U), for 32 metropolitan areas. For example, men’s shirts and sweaters sold in department stores in Chicago would be an elementary index. The price relative calculation for most of the item strata uses the geometric mean formula; the rest (most notably, for rent) continue to apply a Laspeyres-like formula in which the estimated quantities of the items purchased during the sampling period serve as weights.3
The above-described survey-based methodology, introduced in the 1978 CPI revision, had long been viewed as the “gold standard” for estimating price changes—and it has performed reliably for decades. However, as with other economic statistics rooted in the application of a 20th century survey-centric paradigm, the resulting estimates likely have become less precise over time, reflecting a number of factors. Among these factors are
___________________
1 BLS’s Handbook of Methods, updated November 2020, provides a complete description of how these data are coordinated in the construction of the CPI, see www.bls.gov/opub/hom/cpi/.
2 Among these 75 primary sampling units are 21 “self-representing” areas with a population greater than 2.5 million, plus Anchorage, AK, and Honolulu, HI.
3 BLS’s Handbook of Methods (www.bls.gov/opub/hom/cpi/) details all stages of the process including how the sampling units and stratification variables are determined, as well as the procedure for selecting outlets and sampling items within outlets. Specifications for the geometric mean and Laspeyres formulas used can be found here: www.bls.gov/opub/hom/cpi/calculation.htm. Current weights for detailed item categories—e.g., gasoline = 3.181—can be found in the monthly CPI news releases: www.bls.gov/news.release/archives/cpi_04132021.htm.
falling response rates and sampling errors.4 Until 2019, the Census Bureau conducted a Telephone Point of Purchase Survey (TPOPS) on behalf of the BLS to identify the places where households purchased various types of goods and services, forming the basis for the CPI outlet sample. In 2007, approximately 13,500 households completed the survey each quarter; by 2017, the number had fallen to 8,600. To address declining response rates to random digit dial telephone surveys and mitigate the associated increase in data collection costs, BLS moved the main questions from TPOPS to the CE.5 Therefore, in the current setup, information on where households shop (and, as before, about what they purchase) is obtained from the CE, which, in turn, is used to create the frame of specific outlets from which prices are then obtained and tracked. Unfortunately, over the last 10 years, response rates for the CE have likewise declined significantly. The CE-Interview unit response rate fell from 72.5 percent in October 2010 to 50.3 percent in December 2019, and the CE-Diary fell from 73.6 percent in October 2010 to 47.2 percent in December 2019. Response rates declined to even lower levels during early stages of the COVID-19 pandemic but have since bounced back some.6 As response rates declined, concerns about the representativeness of the sample grew. Sabelhaus et al. (2015), for example, found that households at the very high end of the income distribution are less likely to respond to the CE.
Second, in addition to nonresponse, lags associated with surveys collecting information about what consumers buy and where are of particular concern as they create some well-known biases in the elementary indexes.7 New item and outlet samples are selected on a continuous basis with about one-quarter of the sample updated each year. This means that there can be long lags before both new outlet types and new goods enter the CPI
___________________
4 BLS publishes standard error estimates for all of its indexes. As described in the International Monetary Fund manual (IMF et al., 2020, p. 297), sampling errors “can be split into a selection error and an estimation error. A selection error occurs when the actual selection probabilities deviate from the selection probabilities as specified in the sample design. The estimation error denotes the effect caused by using a sample based on a random selection procedure.” For fuller discussions, see White (1999), which describes the relationship between sampling error and bias estimates, and McClelland and Reinsdorf (1999), which examines the effect that small sample sizes have on indexes. They conclude that it has the effect of raising the expected values of an index based on nonlinear formulas, especially the geometric mean formulae and that more extensive use of large-sample scanner data sources may mitigate the problems.
5 For an overview of potential biases, see the following BLS article: www.bls.gov/cpi/notices/2017/methodology-changes.htm.
6 www.bls.gov/covid19/effects-of-covid-19-pandemic-and-response-on-the-consumer-expenditure-surveys.htm.
7 www.bls.gov/opub/btn/volume-1/pdf/consumer-price-index-data-quality-how-accurate-is-the-us-cpi.pdf.
in a way that reflects recent changes in buying patterns. Although this problem was acute during the COVID-19 pandemic, it is not a new challenge. One earlier example of this problem was the emergence of lower-cost warehouse retailers from which sales were slow to be reflected in the elementary indexes. According to one study, this delay may have imparted an annual bias in the CPI of about 0.05 percentage points during the late 1980s.8 More recent estimates of bias originating with outlet sampling are a bit higher (e.g., about 0.08 in Moulton, 2018), reflecting the increased popularity of online retail as a lower-cost option.9
Bias also emerges from lags in the introduction of new models or item varieties to the index, since an update of the sample of items to be priced occurs when the outlets are refreshed. Here, the bias is thought to be even higher (0.37 percentage points per year in both Lebow and Rudd, 2003, and Moulton, 2018) than that associated with outlet substitution. A key challenge is that, when samples are updated due either to “forced substitution” or overall sample refreshment, there are likely quality changes that, despite efforts by BLS to capture them, remain unaccounted for.
2.2. HOW ALTERNATIVE DATA SOURCES CAN IMPROVE INDEX ACCURACY, COVERAGE, AND TIMELINESS
The digital data revolution has given rise to the availability of information sources that—used in combination with, or in place of, existing surveys—have the potential to modernize price statistics. Alternative data sources that have been explored for price measurement purposes include point-of-sale (POS) data (obtained either directly from bricks-and-mortar or online retailers or from firms that aggregate the data), data generated from households scanning products at home, and data scraped from the web.
The various data sources amenable for use in price measurement differ in terms of the granularity and coverage of information they contain. Sometimes they only include prices, sometimes they include expenditures as well, and the amount of product detail that can be gleaned varies greatly. But all of these nonsurvey data sources, along with administrative sources, contain types of information that expand opportunities to develop a richer array of price indexes. For example, options for estimating representative statistics
___________________
8 This finding by Lebow and Rudd (2003) was admittedly based on “only sketchy evidence”—a single study (Reinsdorf, 1993, 1998) of food and gasoline prices.
9 Lags in updating the outlet sample can make the outlet sample unrepresentative as well. Outlet substitution bias, however, refers to something more specific: when procedures for bringing in the updated outlet sample assume that all price differentials between outlets are due to quality differences while, in reality, the outlets gaining market share tend to offer lower quality-adjusted prices (Reinsdorf, 1996).
at subnational levels have emerged, and sometimes at lower cost than is possible when reliant on traditional establishment and household surveys.
Recognizing their potential, efforts are under way at BLS (and even more so at some peer national statistical offices) to exploit nonsurvey data sources. Transaction data in particular—generated in real time for the universe of goods with product identifiers and with information on the outlet, price, quantity, and characteristics of the item—have the potential “to make small sample sizes an issue of the past and reduce sampling error” (Konny, Williams, and Friedman, 2019). Such data breadth and detail may help address concerns about sample representativeness heightened by falling response rates in the CE and underreporting by consumers of their expenditures.10 As the CPI program moves incrementally away from the current probability sampling approach, standard errors will become less relevant as the metric for assessing data reliability. New types of measurement error will be introduced when traditional in-store collection of prices for a small sample of products are combined with direct electronic capture of large volumes of transaction data.
New data sources also offer the potential to reduce some types of bias resulting from data lags. The traditional sampling framework that, by design, involves less than universal coverage can cause delays in (1) identifying new goods appearing in the market (and quality change associated with those goods); (2) recognizing shifts in outlets frequented by consumers (which may create outlet substitution bias); and (3) updating lower-level weights to reflect the composition of purchases made (which may create substitution bias). Nonsurvey data do not necessarily solve these problems. However, where the pace of new product introduction and old product disappearance are rapid (dramatically highlighted in the COVID-19 economy), surveys will not illuminate trends until the resulting data are processed and incorporated months or years later. In contrast, the arrival and exit of goods is immediately seen in both scanner and web-scraped data when a transaction occurs or is posted online.11 Likewise, when the places where consumers shop (including new and disappearing stores) are rapidly shifting, current CPI methods for sampling outlets can be inadequate.
___________________
10 Problematic elements in the CE, including response rate issues, are documented in Carroll, Crossley, and Sabelhaus (2015).
11 Other kinds of corporate data might also prove useful in detecting consumer trends. For example, information on revenues and numbers of rides completed from ridesharing companies could have provided an indication of how fast they were displacing taxi services and other forms of transportation. The issue is that if Uber or Lyft rides are less costly than taxis (as they often, but not always, are), and if BLS tracks taxi prices separately from the rideshare companies, then the drop in the price of urban transit will not be picked up as riders switch modes. Quality differences between the two transit modes figure in as well. The problem is that the “best practices” way to deal with this bias assumes no quality differences (i.e., perfect substitution) between taxi and ride-sharing options.
Statistical agencies in other countries that systematically use transactions (and web-based) data in the CPI were able to provide timely information about shifts in consumer expenditures during the first COVID-19 lockdown in the spring of 2020. The Australian Bureau of Statistics (ABS), for example, was well positioned to handle disrupted access to outlets as most of its direct data collection was already conducted online or over the phone. In fact, less than 2 percent of the Australian CPI (by expenditure weight) is collected by field staff in retail stores.12 By implementing computer-assisted data collection methods over the years, BLS has done an admirable job mitigating timing and accuracy problems with estimating price relatives for the elementary indexes; however, the agency was less well prepared for lockdown conditions due to its reliance on visiting retail outlets.
2.2.1. Scanner Data
Several companies specialize in producing commercial data based on either POS transactions from retailers (e.g., IRI Retail data on item-level sales at grocery stores and NPD data on consumer packaged goods) or data provided by households (e.g., item-level IRI Household data on grocery purchases, and Nielsen Homescan price and quantity information on packaged goods scanned by household). Integration of these data sources covering consumer transactions has been in the research (and occasionally) production pipelines of statistical agencies’ price measurement programs for decades. Twenty years ago, a Committee on National Statistics panel argued that “scanner technology has the potential to improve the entire process of data collection for the CPI computation” (NRC, 2002, p. 275). That study recommended research into how POS data could be used “both to select items for pricing and to replace the Commodities and Services Survey [where prices are actually sampled and recorded by BLS data collectors] and to quantify the improvement in the CPI.” The report alluded to how household-based scanner data could be used “to record UPCs [Universal Product Codes] and quantities, along with key-entering prices and or store names and addresses” (p. 275). Going back further, Reinsdorf (1996) successfully constructed a basic item-level index for coffee using scanner data. A Conference on Research on Income and Wealth publication on scanner data and price indexes (Feenstra and Shapiro, 2003) also documented opportunities and challenges in using scanner data for the CPI.
___________________
12 ABS published “a series of notes” to describe the agency’s “Methods Changes during COVID-19 period.” See www.abs.gov.au/articles/methods-changes-during-covid-19-period.
Point-of-Sale Data from Retailers or Data Vendors
Scanner data offer simultaneous information on prices and quantities while also making it feasible to vastly expand the coverage of product varieties and outlets. In so doing, small samples of a handful of items to represent broad product categories can, in the process, become a constraint of the past. When obtained from aggregators, the transactions data cover many more retailers than do the samples used by BLS.13 Many researchers have used POS data to estimate price indexes. In a recent example, Melser (2021) used Nielsen data covering a large share of U.S. national supermarket spending on 20 products; data were disaggregated by week, by store, and by universal product code or barcode.14
Their impressive coverage notwithstanding, data obtained from retailers typically require significant processing before they can serve as inputs into price index construction, as the literature using scanner-based methods also indicates. For example, the product codes used in scanner systems need to be matched (or classified) into entry-level item classes used by BLS. Similarly, care must be taken to ensure that the product codes used in the scanner data internally track identical items over time and across retailers.
When scanner data are obtained from aggregator firms, much of this processing is already done, reducing the production burden to a statistical agency. However, the procedures these firms use are proprietary, and it is often difficult to assess whether their classifications hold quality constant as would be needed for the CPI. Moreover, aggregators often calibrate their sample to industry totals from other official data, and information on those methods would also be needed to assess the quality of the data. Thus, effort would be needed to ensure transparency of alternatives data sources in the way that typically exists with the public collection of data. Finally, using aggregators as a data source has the added complication that the vendor
___________________
13 For a description of coverage of the Nielsen and NPD data, and of challenges created by enormous product turnover, see October 7, 2020, presentations to the panel, available at: www.nationalacademies.org/event/10-07-2020/docs/D124958ED038610E68986C71BEC8EA6D97CBF5F39C35.
14 Approximately 32 U.S. retail chains supply data to Nielsen, and on average, these chains have 22,870 separate stores. The average number of products in each of the 20 elementary categories was 6,031; on average, 1,690 of these varieties were available in any given month. On average, 196 cities are represented. The total number of price observations was 20 × 292,586 = 5,851,720. While the size of the Nielsen database is enormous, the number of missing products in any given month is also still enormous.
Nielsen data are made available to researchers through a collaborative arrangement with the Chicago Booth Kilts Marketing Center. Data subscription prices, for individuals and institutions, can be found here: www.chicagobooth.edu/research/kilts/datasets/nielseniq-nielsen/pricing.
could cease supplying the data or the cost of acquiring the data could become prohibitively expensive (the so-called “holdup” problem).
Household Scanner Data
In addition to POS data, some companies produce datasets containing information recorded by individuals on their purchases at home using a scanner provided by the vendor. For food at home, for example, both IRI and Nielsen have such panels, some of which have been used in price measurement research.15 One important benefit of these datasets is that they provide information for purchases made at retailers that do not participate in their POS programs. Perhaps more importantly, as detailed in Chapter 6, household scanner data contain information (e.g., demographics) on the characteristics of those participating in data collection that statistical agencies could potentially use to construct price indexes for different population subgroups. Such information is less important for construction of the headline CPI, which includes broader swaths of the population (e.g., all urban consumers). A potential problem with data obtained from consumer panels is that, as noted in Konny, Williams, and Friedman (2019), the types of consumers willing to participate and spend time scanning purchases may not be representative of consumers overall. For example, they may tend to be shoppers who value the incentives provided to participants.
BLS Experience Using Scanner Data
BLS has historically investigated the role of scanner and web-scraped data mainly as a way of obtaining price quotes, perhaps more easily than in-store price checking by field staff, within the current measurement framework. BLS initiatives incorporating scanner data in the CPI program have focused on the food at home category. A decade ago, BLS purchased historical Nielsen Scantrack data to support research comparing the performance of indexes based on the scanner data with those based on traditionally sourced data.16 The goal of this work was to assess the feasibility of using the Scantrack data—which covered around two million UPCs—as a replacement for some food at home item categories in the CPI. The Nielsen
___________________
15 Hausman and Leibtag (2010) used the A.C. Nielsen Homescan consumer panel data to “identify the price differentials for twenty food product categories between supercenters, mass merchandisers, and club stores.” In so doing, they estimated that, at the time, the CPI measure of inflation of food at home was too high because it failed to completely capture consumer gains from the growth of low-price, high-volume superstores.
16 The Nielsen data covered the period September 2005 to September 2010 and included totals for the quantity and dollar amount of merchandise sold by UPC, www.bls.gov/osmr/research-papers/2013/pdf/st130070.pdf.
data—which omitted convenience stores, bakeries, butchers, smaller grocery stores, warehouse stores, and gas stations—included product descriptors and average prices for each observation. At the time, because of the significant purchase cost of real-time data, BLS concluded that it was “less expensive to collect data in stores than to pay for Nielsen Scantrack for the real-time data and geographic and outlet detail needed to support the monthly CPI” (Konny, Williams, and Friedman, 2019, p. 17).
However, over the past decade, as in-store pricing and CE surveys have become less sustainable, BLS has improved its capacity to handle transactions data when a company’s categorizations do not match CPI item categories. The agency has gained experience through its work with retailers—specifically, a department store (anonymized as CORPX) and a drug store (anonymized as CORPY). The process involves developing concordances between CPI item categories and those available in the alternative data source. In the case of CORPX, BLS has developed a machine learning system to assist in these categorizations, which has “greatly improved [their] ability to handle large datasets with hundreds of thousands of items” (Konny, Williams, and Friedman, 2019, p. 6). The CORPX data, provided monthly, include price and sales revenue information for each product sold in the store’s outlets across the geographic areas covered in the CPI so that match-model price relatives can be estimated. Even though BLS does not refer to the source as “scanner data,” the CORPX data are very similar to the data obtained through barcode scanning by national statistics offices in other countries such as the Office for National Statistics (ONS) in the United Kingdom.
Use of Scanner Data by Other Statistical Agencies
Statistical agencies in other countries and academic researchers have led the efforts demonstrating the feasibility of using alternative data sources to replace aspects of the existing sample-based structure for price measurement.17 Across statistical agencies internationally, the motivations behind this work have been diverse, ranging from cost containment to the need to more quickly capture effects associated with the arrival of new goods and outlets, or the changing composition of spending patterns. For BLS, lessons learned from these efforts will have to be adapted to the unique legal and
___________________
17 This section references only a small sample of the national statistical offices advancing the use of alternative data sources in their CPI programs. A more complete and detailed review of the use of scanner data and web-scraped data for price measurement—in this case focusing on outlier detection methods used—can be found at: www.niesr.ac.uk/sites/default/files/publications/NIESR%20DP%20523.pdf.
budgetary context of the United States and, as discussed in Chapter 1, to the decentralized nature of the statistical system.
Most agencies that have used scanner data have done so, initially, as an alternative for price quotes. For example, in Australia, ABS implemented a three-stage model for integrating transaction data that involved: (1) replacing in-store price quotes by (unit value) prices from transactions datasets without changing methods or samples; (2) enlarging the samples; and (3) using the “universe” of products and implementing new methods. The ABS project took several years, and the third stage required overhauling the agency’s information technology (IT) system. The ONS followed a similar timeline: (1) researching the methods required to process alternative data sources in 2020; (2) developing systems for processing alternative and traditional data sources in 2020–2021; (3) conducting index impact analyses for priority items in 2021 and a parallel run to produce experimental aggregate measures planned for 2022; (4) estimating aggregate measures of consumer price statistics in 2023; and (5) rolling out the use of alternative data sources to new items within the inflation basket in 2024 and beyond.18
The methodological changes resulting from these research efforts have been dramatic. For example, Statistics Canada reported that, as of March 2021, 50 percent of collected prices originate from alternate data sources (which encompass more than scanner data), representing 20 percent of the CPI Basket Weight. The agency is aiming to collect 70–80 percent of its price quotes from alternative data sources, representing 55 percent of basket weight, by March 2023.19
ABS uses scanner data from retailers to obtain prices for about 16 percent of Australia’s CPI by item weight. Covering approximately 84 percent of all expenditures at supermarkets, these data offer nearly a “census” of sales at these outlets. The data include product descriptions as well as information on quantity of items sold, dollar value of items sold, and geographical location.20 Scanner data enabled a chained formula to be constructed for that portion of the CPI as well. As discussed in the next section, ABS also uses web-scraped prices for about five percent of the CPI by item weight (alcoholic beverages, clothing, and car parts are major categories) and
___________________
18 www.ons.gov.uk/economy/inflationandpriceindices/articles/introducingalternativedatasourcesintoconsumerpricestatistics/may2020.
19 October 7, 2020, presentation to the panel by Heidi Ertl, Director of Consumer Prices, Statistics Canada, www.nationalacademies.org/event/10-07-2020/improving-cost-of-livingindexes-and-consumer-inflation-statistics-in-the-digital-age-meeting-6.
20 www.abs.gov.au/statistics/research/recent-applications-supermarket-scanner-data-national-accounts.
administrative sources for another 22 percent (electricity, gas, childcare, fuel, pharmaceuticals, and insurance).21
The ONS is likewise moving forward with incorporating POS transaction data from retailers, along with web-scraped and administrative data. As has been the case for other countries, one important research task has been to map item classification. This research focuses on ensuring that the right products are in place for the various datasets to produce an index for specific items as defined in the ONS CPI.22
While scanner data provide a useful source of price quotes to fold into the existing production system, such data also contain information on quantities that may be used to estimate elementary price indexes directly. Transaction data can be aggregated by expenditures and quantities sold at the UPC level to form a unit value that serves as the price; scanner data from aggregators are already aggregated to the UPC level. The resulting price and expenditure data can be used to generate superlative indexes (Ehrlich et al., 2021) or to obtain hedonic price indexes.
Indeed, a number of national statistical offices are at comparatively advanced stages of their data modernization programs, bypassing the current survey-based production system and calculating price indexes directly from alternative data sources. Statistics Norway began research to use scanner data to compute the subindex for food and nonalcoholic beverages in 2005. Statistics Netherlands introduced supermarket scanner data into its CPI in 2002 (described in Chessa, 2016; de Haan, Willenborg, and Chessa, 2016). Beginning around 2008, Statistics New Zealand began researching use of scanner data to directly estimate price change for products sold by supermarkets and for consumer electronics.23 Its research focused on overcoming, with the use of scanner data, volatility of prices and quantities, due
___________________
21 October 7, 2020, presentation to the panel by the ABS. An overview of methods used to incorporate scanner data into the ABS’s multilateral CPI framework—including how the agency has gone about implementing data changes (e.g., communication with external users, research conducted, input from international experts)—can be found here: www.abs.gov.au/AUSSTATS/abs@.Nsf/39433889d406eeb9ca2570610019e9a5/40fc971083782000ca25768e002c845b!OpenDocument.
22 Details of the UK ONS experience experimenting with multilateral indexes for scanner data can be found in “Using alternative data sources in consumer price indices: May 2019” www.ons.gov.uk/economy/inflationandpriceindices/articles/usingalternativedatasourcesinconsumerpriceindices/may2019.
23 Statistics New Zealand has since implemented a hedonic multilateral method for consumer electronics based on scanner data purchased from market research company GfK. They have not (yet) implemented scanner data from supermarkets.
to discounting, seasonality, and the churn of new products entering and old products leaving the market.24
2.2.2. Web-Scraped Data
Scanner data are not available for all commodities. For some items, notably goods purchased online or goods where one firm dominates the market (e.g., smartphones), scraping price data available on the internet provides an alternative to the traditional survey-based methods. Web-scraping refers to the process whereby price and product information is collected automatically from websites on the internet using software that simulates human web-surfing activity. The objective is to transform unstructured website data into structured data for CPI construction (or other) purposes. The main drawback with the use of web-scraped data for official price measurement is that while prices of available products are known and can be measured almost continuously, methods are lacking for establishing their relative importance in the consumption basket.25 This means that it is not possible, using web-scraped data alone, to construct the superlative indexes that are viewed as a superior approach to constructing index numbers.26
The most prominent U.S. player in the web-scraping data collection space is not a statistical agency, but MIT’s Billion Prices Project and spinoff company PriceStats. PriceStats currently tracks about 25 million prices per day from 1,100 retailers in 50 countries. In the United States alone, it collects two million prices per day in real time on a daily basis from not only online retailers such as Amazon.com, but also from the websites of traditional and large multi-channel retailers that sell both online and offline.27 Product categories include food and beverage, clothing, housing, recreation, household products, and health. Among the data elements collected are price, product description, and product attributes. The country-by-country inflation series contain daily averages of price changes across multiple categories and retailers, by sector. PriceStats has the kind of expertise collecting and processing online data in a production environment that is similar to what BLS would need to set up if it plans to emulate the approach to construct some of its elementary indexes. Even so, academic research of
___________________
24 unece.org/fileadmin/DAM/stats/documents/ece/ces/ge.22/2014/WS4/WS4_11_New_Zealand_CPI_scanner_data.pdf.
25 There is, however, some price measurement research geared toward approximating expenditure weights for web-scraped data. See, for example, Thomas and Ayoubkhani (2019) along with foundational work to model sales quantities by Chevalier and Goolsbee (2003).
26 See the appendix to this chapter on the use of multilateral methods for blending alternative data sources, including web-scraped data, to estimate price relatives.
27 Similar data can also be found at www.pricestats.com/approach/data-composition.
price measurement does not produce “official statistics” and so there is greater freedom to delve into experimental methods that are only suggestive of approaches that BLS could consider.
Unlike scanner data, the web offers listings of prices (not prices actually paid) with no information on the relative importance of the different offers. An important benefit of web-scraped data is that it is more accessible and is often easier and certainly quicker to obtain than are data from retailers (which can take months or years). Additionally, the approach offers real promise in addressing the timeliness problem—if data processing can be automated, time lags can be almost eliminated.
BLS Experience with Web-Scraping
Until recently, BLS had only used web-scraping in the CPI for research purposes and to collect supplemental observations used in constructing hedonic models (Konny, Williams, and Friedman, 2019). However, beginning in March 2020, due to initial COVID-19 shutdowns, BLS had to improvise as the monthly, in-person collection of price data from retailers and businesses by field staff came to a halt. Price checkers, who could no longer go to stores, had to switch to filling up virtual carts online to check prices. This process (brought on as a stopgap measure in the face of the immediate crisis, and not fully web-scraping) mimicked the in-store price checking activity, but it would need to be automated (perhaps using PriceStat methods as the model) if timeliness and efficiency gains in data collection are to be realized.
A first step toward integrating web-scraped price data involves performing research to assess the extent to which pricing is the same in-store and online and whether the two sets of prices move in a highly correlated fashion.28 BLS has some experience with this kind of work when it researched comparisons between CPI’s current data collected on the price of motor fuels and web-scraped data from a tech company that crowd-sources fuel prices from around 100,000 gas stations across the United States. Preliminary research showed that a Jevons price index based on these data performed almost identically to the conventional CPI’s gasoline index, despite the fact that the data were not weighted—at the time of this research, the CPI used TPOPS to weight gas stations (Konny, Williams, and Friedman, 2019). BLS has also been engaged in this kind of research, for example, on residential telephone and telecom services and airline prices
___________________
28 Cavallo (2017), investigating the similarity of online and offline prices using evidence from large multi-channel retailers, found that “price levels are identical about 72 percent of the time.”
where, for the latter, web-based pricing “enables the CPI to track a more defined trip month-to-month,” according to a BLS fact sheet.29
A key question for BLS’s web-scraping research is to investigate how alternative data sources can be used to weight products/clusters in the absence of expenditure and quantity information. Questions include: What do the “weights” of the data source or the retailer represent? In turn, how should the price indices within and across data sources be aggregated? (Claude Lamboray, Eurostat, presentation to the panel, October 7, 2020). These limitations of web-scraped data suggest a blended approach. Scanner data can be used to establish weights for some categories. Alternatively, BLS may be able to collect useful information by contacting retailers and asking about their bestselling products in different categories. This is currently done by the price inspectors when they visit a physical store, so it would not mark a drastic change in approach. The advantage of this kind of blending would be that the weights could be obtained at low frequency (e.g., once per quarter or semester), while the scraping provides data at higher frequencies.
Work at Agencies Internationally
Relative to BLS, a number of national statistical offices in other countries have pushed forward more aggressively with web-scraping in their CPI programs. These initiatives, which typically focus on repricing products already in the index, have been motivated in part by the increased share of retail spending that is being transacted online and the need to monitor prices for these outlets. As highlighted in two studies of the UK, the UK Consumer Price Statistics Review (Johnson, 2015) and the Independent Review of UK Economic Statistics (Bean, 2016), opportunities abound to improve the efficiency and quality of collection methods. On the quality side, price data from the web can be collected in a timelier manner than is possible when relying on surveys or third-party scanner data to be processed. On the cost side, web-scraping can automate price collection for some goods and services, which can potentially reduce costs and increased coverage.
Statistics Belgium scrapes around six million prices per month in categories such as clothing, footwear, hotel reservations, airfares, international train travel, secondhand cars, consumer electronics, books, and video games. Several of these categories are already incorporated into the country’s official CPI (Kevin Van Loon, Statistics Belgium, presentation to the panel, October 7, 2020).
ABS has been incorporating web-scraped prices progressively into its CPI since March 2017, currently using primarily a direct replacement
___________________
29 See BLS Fact Sheet: www.bls.gov/cpi/factsheets/airline-fares.htm.
strategy. It is the primary data approach for some significant item categories such as alcohol and tobacco (7.3 percent weight), clothing and footwear (3.5 percent), furniture and household equipment (3.7 percent), and recreation and culture (12.7 percent). Much of the current web-scraping is currently carried out manually, but the agency is moving forward toward automation. The agency is now looking into the potential for Application Programming Interfaces to access pricing information that can be more straightforward than maintaining web-scraping code over time.30
2.3. FUTURE DIRECTIONS
2.3.1. Challenges
The most obvious obstacle to past efforts to incorporate alternative data sources into the CPI has been the (sometimes) prohibitive cost of acquiring scanner data, particularly those obtained from aggregator firms. As noted above, this has been cited by BLS as the main reason for not moving more quickly to replace in-store price quotes with scanner data from commercial firms (Konny, Williams, and Friedman, 2019). Even if affordable, using data processed by a third party involves uncertainty about how the data were compiled and processed.
On the methodological front, a pervasive problem with alternative data sources compiled by aggregators is that the data are collected for “nonstatistical” purposes and are not necessarily representative. Many commercial data sources containing price and expenditure information useful for price measurement rely on convenience samples that have coverage patterns that differ from those in currently used sources. For example, an Economic Research Service study by Levin et al. (2018) assessed how well totals from the (unweighted) IRI scanner data for food align with data based on other sources, including products from the Census Bureau (e.g., the Economic Census and County Business Patterns). The researchers found differences that suggest the data would likely benefit from the construction of post-stratified survey weights.
Typically, any adjustments made by the vendor to achieve a representative sample (controlling to totals, weighting, etc.) are not transparent. More generally, statistical agencies do not control the creation and curation of the data and aggregated datasets are manipulated before they are made available. Vendors have different priorities than national statistical offices (NSOs) so may make adjustments that are useful for their own purposes but not so helpful for NSOs. Often, there are no clear incentives for providers to be transparent about methods/changes. Not knowing what scanner data
___________________
aggregators have done during production of data—there is often a lack of documentation or transparency—is a major shortcoming for use in production of official statistics.
Aside from concerns over representativeness, coverage, and other issues described above, statistical agencies’ experience with scanner sources has also revealed methodological challenges that must be tackled. In particular, indexes constructed using high-frequency scanner data can suffer from a “chain drift” problem that introduces biases in the indexes. However, new approaches have been developed (such as multilateral methods, described in the appendix to this chapter) and adopted by some statistical agencies to deal with the chain drift problem.31
Web-scraped data also present challenges. The array of issues that require attention before these data can be routinely integrated in the official CPI are summarized in Table 2-1, reproduced from Auer and Boettcher (2017). Nonsurvey data—whether from retailers or from the web—are typically organized using hierarchies that do not always line up easily with the CPI nomenclature so concordances must be constructed to bridge categories in the new data source to the CPI. Another issue common to both sources is that raw price quotes typically contain outliers so that consistent and transparent methods must be applied to avoid undue volatility in the resulting price indexes.32 Some of the challenges listed depend on the type of retailers being scraped. For example, issues with the relevance criterion (“are products offered really sold and by whom”) can apply to data scraped from online marketplaces such as eBay and Walmart Marketplace Sellers where individual sellers can publish postings; BLS can control this by scraping only goods on, as an example, the Walmart.com website and exclude marketplace sellers altogether.
To extract all available metadata from websites also requires continuous monitoring. For example, scripts need to be adapted when websites change to avoid periods without data.33 In so doing, federal agencies need to obey legal restrictions on individual websites, such as terms of use.
___________________
31 Index chain drift is defined by the difference in the performance of a fixed base price index and a chained index (Klick, 2017). Chain drift can trend upward, as found by Feenstra and Shapiro (2003) in a study using scanner data on canned tuna to compile a weekly chained Törnqvist index. It can also trend downward, as found by de Haan (2008) in a study using scanner data from a Dutch supermarket chain on detergents. The international price statistics community appears to have reached a consensus that multilateral methods, such as those proposed by Ivancic, Diewert, and Fox (2011), offer an approach that provides drift-free, superlative-type indexes (Kalisch, 2017).
32 For a detailed description of outlier detection methods for alternative data sources used in price measurement, see www.niesr.ac.uk/sites/default/files/publications/NIESR%20DP%20523.pdf.
33 In a presentation to the panel, Alberto Cavallo and Pilar Iglesias. www.pricestats.com/approach/data-composition.
TABLE 2-1 Novel Quality Problems and Measurement Methods with Web-Scraped Data
| Input data quality criteria | Web-scraped data | |
|---|---|---|
| Novel quality problem (for consumer price statistics) |
Measurement method | |
| Relevance | Representativeness of online data (are products offered really sold and by whom?) | Information by data providers; otherwise unresolved |
| Accuracy | Website content may be IP-specific (a user who frequently checks a website or a web-scraper might lead to different price displays than first-time users) | Comparison of automatically and manually collected data |
| Timeliness/Punctuality | The amount of data makes it difficult to judge data quality within a reasonable amount of time | Quantitative instead of qualitative processing of data |
| Accessibility | Websites might identify web-scrapers and block them | Unresolved |
| Completeness | Websites change frequently Relevant variables and URLs might not be identified and scraped | Number and level of target values are measured against historical values from previous data collection activities |
| Clarity/Interpretability | No new quality problem | |
SOURCE: Auer and Boettcher (2017). Reprinted with permission.
Statistical agencies have begun to grow out staffs with the right skill set to carry out these processes.
Finally, replacing traditional price collection with data obtained from vendors could lead to dependency of the statistical agency on the data providers; even with strong contract provisions, these data could be changed or discontinued without notice. In the future, it may be possible for agencies to set up their own scanner data and web-scraping operations, but such a system is some ways off. The more immediate tasks would be to set up contracting arrangements that make sense for both BLS and data providers, ensure confidentiality given the sensitivity of the data, set up arrangements that ensure reliability of sources, and create contingency plans in the case of disruptions in the supply of CPI input data.
As it moves toward a new paradigm for data quality assessment (Box 2-1), BLS will be able to draw from quality evaluation frameworks developed elsewhere. One example is the framework developed by the Statistical Office of the European Union (Eurostat, 2013), which includes five major output quality components: relevance, accuracy and reliability,
timeliness and punctuality, accessibility and clarity, and coherence and comparability. In practice, BLS will continue to perform very granular comparisons to “validate” new data sources by comparing indexes estimated from them with those estimated in the official index.34
For most kinds of nonsurvey data, there is little in the way of “agreed-upon techniques for assessing the validity, reliability, and robustness of the inferences made” (NASEM, 2020, p. 128). That said, increased attention is now being given to measuring the quality of administrative and commercial data, and how that quality compares with currently used survey sources. Statistical agencies are being pushed to move beyond frameworks such as Total Survey Error (TSE), which parses potential sources of error and variance broadly into sampling and nonsampling errors (Biemer, 2010; NASEM, 2020, pp. 129–130). TSE metrics of precision (the basis of current quality assessment) are highly focused on response rates and, thus, not relevant for evaluating alternative types of data (e.g., scanner, web-scraped) that are and will become increasingly useful in CPI construction.
An example of a more expansive framework is the Total Error Framework (TEF), which broadens the nonsampling error component to include measures of error associated with commercial and other types of data and
___________________
34 The Census Bureau has performed similar exercises with NPD scanner data, comparing store-level revenue data to that reported in their trade surveys. As expected, coverage is a major issue. The Census Bureau only purchased data for stores that were “most relevant” for their purposes and, currently, have 20 retailers (each with many outlets) that have given NPD permission to provide the data to Census (for details, see www.nber.org/system/files/chapters/c14270/c14270.pdf.
suggests methods for comparing errors in big datasets to errors in survey datasets.35 An important aspect of data quality for transactions data like scanner data and payments data is gaps in the coverage of the population of interest. The set of missing observations due to nonreporting may change from month to month, and information on which observations are missing from the dataset may be unavailable or incomplete. This can make it challenging to control for coverage changes.
2.3.2. Opportunities
Overall Strategy for Integrating Alternative Data
To date, transaction data have typically been integrated incrementally within BLS’s existing CPI infrastructure opportunistically or when pressure to do so has arisen because of a problem with a conventional data source. One notable exception is BLS’s use of the JDPOWER data on transaction prices and real-time expenditures for light vehicles, which does not rely on the usual sample-based methods for selecting outlets and vehicles to price. The most common application among statistical agencies has been to match and replace price quotes previously obtained by field staff at outlets with electronic POS data. Going forward, BLS will need to progress in areas where reliable data may already be present, but where benefits in terms of cost, detail, or accuracy may emerge from pursuing alternative sources.
Recommendation 2.1: BLS should embark on a broad-based strategy of accelerating and significantly enhancing the use of transactions data and other alternative data sources in CPI compilation. Embracing alternative data sources now, and moving forward aggressively with research for their integration, will ensure that the accuracy and timeliness of the CPI will not be compromised in the future. The data modernization strategy will involve:
- Identifying promising alternative data sources and then prioritizing the work needed to evaluate and incorporate these data into the items/strata where they can be applied;
- Continuing development of a robust research agenda that supports incorporation of alternative data and associated new methodologies more broadly beyond just price quote replacement;
- Continue research assessing the quality of new types of data;
___________________
35 For a description of this framework, see Total Error in a Big Data World: Adapting the TSE Framework to Big Data (academic.oup.com/jssam/article-abstract/8/1/89/5728725?redirectedFrom=fulltext). For a broad-based discussion of quality assessment frameworks for statistics using multiple data sources, see NASEM, 2017, Chapter 6.
- Developing staff expertise that includes more data scientists and other specialists;
- Creating a cross-agency strategy for gaining access to data—from third-party providers and, if possible, direct feeds from the largest retailers—with the possibility of joint contracts across statistical agencies;
- Carrying out a strong communication strategy to inform stakeholders of plans and implementation details.
The kind of data modernization envisioned will require upfront new investments in data acquisition, updating of production procedures and IT systems, and staff training. BLS analysts have extensive expertise for conceptualizing and measuring different error sources in conventional data sources but, for nonsurvey data, “expertise and training is also needed in computer science for processing, cleaning, and linking datasets and the errors that can arise in these operations” (NASEM, 2017, p. 127). In the future, CPI staff skills will need to shift (at least partially) away from those needed to obtain structured price information and toward those needed to process unstructured price data.36
After these initial investments, once the agency transitions into a routine maintenance phase, cost savings are possible—particularly as transaction and online data allow a shift from labor-intensive manual (field-based) to automated data collection processes.37 Even if savings are not guaranteed, BLS should not be deterred. Given its wide use by markets and in policy making decisions, the primary objective should be production of an accurate CPI. BLS will need support in the funding process so that near-term costs do not obscure the potential longer-term benefits of developing new data sources. While BLS has certainly made progress using transaction data to replace price quotes, the agency has the opportunity to go much further.
Recommendation 2.2: BLS should accelerate its research identifying alternative data sources that could potentially be integrated to replace price quotes collected within the current framework. As part of a
___________________
36 Auer and Boettcher (2017) included a detailed discussion of the ways in which price statisticians must re-think index compilation procedures when using web-scraped and scanner data. See, specifically, the section on “Assuring Data Quality of Large New Data Sources.” This report lists specific skill areas that need to be covered when migrating toward alternative data-based price measurement programs. These include expertise in big data platforms, analytics engines and programming languages, visualization and reporting applications, data warehousing, security frameworks, web crawling tools, and storage infrastructure.
37 The field-based labor force for the CPI program includes around 80 full-time and 425 part-time data collectors working in 75 cities in 43 states.
proactive plan for modernizing the data infrastructure used in elementary index construction, BLS should develop, apply, and communicate clear criteria for identifying and prioritizing new data sources for various item categories of the CPI.
As documented above and in the many references cited, the potential for an expanded role for scanner data in particular has been broadly recognized, including by BLS. Based on documentation from the companies NPD, IRI, and Nielsen, Table 2-2 provides a sense of the item coverage in some of the large scanner datasets. These product categories are quite broad and sometimes exclude items—for example, NPD does not collect data on cell phones. And even scanner datasets that have good item coverage do not always have comprehensive retailer coverage. For example, Home Depot and some other home improvement stores do not participate with NPD; prior to 2011, Walmart did not participate with IRI and Nielsen, and the data vendors had to visit the retailers (just like BLS does) to get pricing.38
The most obvious limitation of POS scanner datasets is that their coverage is constrained to goods only (packaged goods, actually) so services, which amount to about 60 percent of the CPI, are not covered. This means that if scanner data cover about half of the CPI relative importance for goods, the total amounts to a bit less than one-fourth of the overall CPI. However, the missing goods are mainly vehicles, nonpackaged food, and energy, where other alternative data sources may be helpful. For food, the Homescan products (done by consumers at home, not the store-based POS data) provide full coverage of retailers that could be used to fill some gaps. Likewise, a big advantage of web-based data is that they include many types of services.
TABLE 2-2 Potential Scanner Data Coverage of CPI Items
| CPI ITEMS | RELATIVE IMPORTANCE | |
|---|---|---|
| All CPI items | Available in scanner data* | |
| Food | 14.2 | 7.9 |
| Energy | 5.8 | 0.0 |
| Commodities less food and energy commodities | 20.3 | 12.1 |
| Total | 40.2 | 20 |
NOTE: Totals are based on Nielsen Homescan IRI point-of-sale and NPD data.
___________________
38 www.wsj.com/articles/SB10001424053111904233404576460164032135744.
Assessing Data Fitness for Use
Paramount among the challenges in shifting away from traditional data collection is evaluating the quality of the new replacement data. The CPI samples have traditionally been designed with the goal of representative coverage of the full population of goods and services consumed by U.S. urban households, although in practice there have been some gaps in coverage, such as for new goods. New data sources may offer tradeoffs in which there is improved coverage along some dimensions (for example, the number of items or geographic coverage) that must be traded off against reduced coverage along other dimensions (for example, the number or variety of outlets). In some instances, large, quickly available samples that were not designed with representativeness in mind may be preferrable to small samples that were designed to be representative, particularly if they are not timely. A sample representative of the population five years ago, for example, may not be that useful today. Unfortunately, assessing data quality tradeoffs along these dimensions is not simple.
BLS has already stated that, for purposes of expanding the number of expenditure categories to which alternative data sources could be applied, their priority will be “based on factors such as index quality issues, relative importance, size of sample, alternative data source availability” (Konny, Williams, and Friedman, 2019, p. 25). Other important data characteristics include the following: detail of product coverage,39 geographic coverage (there is a question of whether BLS should scale back on geographic sampling, especially for items for which activity is shifting online), capturing transaction (as opposed to list) prices, timeliness and frequency, and nature of sample (random versus convenience, census versus subset). Some of the criteria for evaluating data quality—perhaps especially timeliness and other dimensions of granularity—have often been undervalued as indicators of quality but are “increasingly more relevant with statistics based on multiple data sources” (NASEM, 2017, p. 117).
Recommendation 2.3: In the context of CPI construction, which will increasingly rely on data blended from multiple sources, BLS should regularly publish information on the characteristics of alternative data they plan to incorporate. Important quality indicators include the following: number of products covered, number of observations/price quotes, type of price quote (listed price, transaction price, etc.), how many matches of products can be made across periods, extent of coverage within
___________________
39 Product coverage and completeness testing are particularly important given the substrata approach that BLS is thinking of adding, as is capacity to capture rapid item disappearance and appearance or churn.
and across expenditure categories, frequency of updates, and level of product detail.
This kind of documentation is a component of the transparent communication strategy identified in Recommendation 2.1. A National Bureau of Economic Research paper (Konny, Williams, and Friedman, 2019) is a great example of what is needed, but on an ongoing basis—perhaps every six months.
Developing Parallel Series
A strong research program must accompany the transition to a mixed data infrastructure for the CPI.
Recommendation 2.4: BLS should accelerate testing of indexes constructed from alternative data sources and new methodologies. Before BLS incorporates alternative data for specific item categories into the official CPI, it will be important to maintain a significant overlap period (perhaps as long as two years) during which parallel indexes based on new data sources can be tested and compared against their traditionally constructed counterparts.
The overlap period also allows significant changes to CPI methodology and data sources to be vetted with the public and user communities. BLS might also consider a comment period for particularly important changes to methodology.
An illustrative example of parallel series can be found with BLS’s own work (described above) using comprehensive transactions data from a department store that included an assessment of how the CPI would have performed if those data had been used in an earlier period. Currently—while the nonsurvey data and survey-centric worlds still very much overlap—statistical agencies have the opportunity to make these kinds of comparisons. If current surveys become obsolete (due to costs, deteriorated response rates, etc.), the opportunity to test parallel series will be lost.
Multilateral Methods; Measuring Quality Change
BLS will no doubt continue its research using already obtained scanner data sources as a laboratory to test how the data perform and methods for blending those data in a way that is statistically sound and usable in the CPI program. The panel recommends that BLS develop a robust research agenda that supports incorporation of alternative data more broadly beyond just price quote replacement. This will require accelerating research evaluating the role of the leading multilateral index approaches
designed to maximize and automate the use of alternative data sources for the construction of new elementary indexes that do not require the usual survey-based paradigm (the methods are described in the appendix to this chapter).
Recommendation 2.5: BLS should prioritize experimenting with and getting up to speed on the use of multilateral indexes for scanner data and web-scraped data.
One question that BLS will confront is whether the leading multilateral index approaches (especially those already in use at NSOs) can be applied and used in real-time without the need to revise the indexes. BLS can benefit extensively from the work already done on the topic by Statistics Netherlands, Statistics New Zealand, and ABS.
A key element of the multilateral research program involves assessing the capacity of alternative data sources to identify product attributes and apply quality change estimates. Where rapid quality changes are common, such as for high-tech items, combining datasets that include product codes and identify product characteristics in detail provides rich opportunities for improving measurement. Such data can sometimes be extracted from retailers’ or manufacturers’ websites to perform quality adjustments.40 In these cases, alternative data sources can be incorporated into work on hedonic methods, such as those developed by Erickson and Pakes (2011), to adjust for unobserved characteristics and that correct for sample selection effects.41 These approaches will require gaining expertise in multilateral indexes so that they can continue to be evaluated as they develop.
Recommendation 2.6: A major component of BLS’s research effort to experiment with using scanner data and web-scraped data should be assessing their potential for quality change adjustments. Initially, this work could be part of an effort to replace price quotes from traditional data, though ultimately the use of new alternative data likely will lead to the need for new methodologies for adjusting for quality change. Top priorities should be items with large expenditure shares and items undergoing rapid technical change.
Methodological improvements along these lines could be consequential when high expenditure items are involved. Accordingly, communications
___________________
40 See, for example, Bajari et al. (2021), which uses product descriptions from Amazon to estimate hedonic price functions and, in turn, Fisher Price Indexes for the period 2013–2017.
41 As described in the appendix to this chapter, recent research has attempted to perform quality adjustment at scale, often with the use of scanner data.
goods and services (internet, streaming, mobile, and cable) is a good example—and appear to be near the top of BLS’s priorities.42 Statistics agencies in other countries have likewise been exploring the value of alternative data sources for measuring quality change.43
Automating Web-Scraping
As noted above, during the COVID-19 shutdowns when monthly in-store collection of price data was not possible, price checkers had to switch to filling up virtual carts to check prices.44 This process—brought on as a stopgap measure in the face of the immediate crisis and which only mimicked the in-store price checking activity—needs to be automated.
Recommendation 2.7: Converting opportunities for permanently automating web-scraping of price data should be a high priority for the CPI. In evaluating the usefulness of web-scaped data for elementary index estimation, food, electronics, and apparel should be priority categories. Data for these categories are readily available with a large share of transactions already online, and work by other statistical agencies and private-sector organizations have demonstrated feasibility. In the short term, BLS could consider obtaining web-scraped data from outside vendors, but ultimately BLS should develop automated web-scraping methodologies within the agency. As progress is made, internet and traditional outlet prices can be compared during a testing period.
Automated methods similar to those developed by PriceStats should be adopted for processing web-scraped data.45 As alluded to above, most of the data scraped by PriceStats comes from the websites of companies that
___________________
42 Brown, Sawyer, and Bathgate (2020) review the “directed substitution approach” used in the CPI for smartphones and the hedonic models used for quality adjustment of telecommunications services. The directed substitution method for smartphones, which BLS began using in the CPI in 2018, rotates in quality-adjusted prices of new models every year, or even every 6 months.
43 For example, in work measuring price change for consumer electronics using scanner data, Statistics New Zealand has been employing time-dummy hedonic models. www.stats.govt.nz/methods/measuring-price-change-for-consumer-electronics-using-scanner-data. See also the appendix to this chapter on multilateral methods for a discussion of quality-change measurement in the context of scanner and web-scraped data (Léonard et al., 2015).
44 At the same time, response rates to the Commodities and Services Pricing Survey and to the Housing Survey also dropped off.
45 PriceStats has already begun collaborating with other statistical agencies about how to operationalize web-scraping in CPI programs. For example, the company has shared data with the UK’s ONS and several other (smaller) agencies during 2020; they also have a long-standing contract with Statistics New Zealand.
sell both online and offline. This is important for BLS because it means that the same retailers that its current price inspectors visit physically can also be web-scraped. BLS could focus first on these retailers so that the only thing that changes is the “channel” from which the data are collected, not the retailer type. Later on, BLS can consider scraping online-only retailers, which are likely to have more differences in pricing behaviors. A big opportunity exists for BLS to realize that it can sample the same retailers it does today but using a new technology.
While collection and processing of transaction data can be difficult for a statistical agency to perform internally, a staff with the appropriate skills could soon be web-scraping much more easily. They would have to replicate what firms like PriceStats are doing. Ideally, to become viable for production use—which includes the need to maintain public confidence in the data and to tailor the program specifically to CPI specifications—this capacity would be developed in-house at BLS. During the research phase, however, while internal expertise in web-scraping methods is still being developed, BLS will likely need to contract with outside experts. Likewise, this research will benefit from interaction with other NSOs and measurement economists working outside of statistical offices.
For construction of elementary indexes, item categories of the web-scraped price data also must be mapped to the item strata as defined by statistical agencies. This mapping needs to be automated in the production process—a task at which supervised machine learning methods excel—and extensive data cleaning and maintenance will be needed to keep up with changing websites. Some of this can be done with algorithms that flag irregularities, but considerable human effort is also required at various stages of production.
Research will be needed to test the performance of web-scraped data, particularly how closely online pricing tracks in-store pricing. The testing will need to be sensitive to website content that is IP-specific (e.g., price displays may be different for frequent website visitors than for first-time users). It should be fairly straightforward to periodically check to see how closely a firm’s online prices trend with in-store prices. An obvious limitation regarding comparisons of the similarity of online and brick- and-mortar retailer prices is that it requires the presence of both for each firm. However, this point might be deemphasized to the extent that online prices should be different from in-person prices due to the costs of delivery (less the costs of making a sale). Both online and in-person purchases are relevant in constructing a CPI, but it would be impractical to devote scarce agency resources to estimating a comprehensive tabulation of all household purchases. Some retail chains have both online and in-store sales, and comparisons can be made to test the nature of any systematic price differences.
Longer-Term Data Visions
For the foreseeable future, representative surveys will continue to play an important role in federal statistics. It is important to also think about what the consumer economy and, in turn, the perfect data for tracking it, will look like in 10 or 20 years. In the not-so-distant future, most transactions in the economy will be electronic and will produce a trail of data useful for measuring prices and quantities of goods and services. In China, for example, virtually all transactions are already electronic, and this vision is quickly becoming a reality.
Beyond the more obvious transactions data sources, peer-to-peer payment platforms (like Venmo and PayPal) are creating additional opportunities for tracking consumer spending, but they come with major challenges with access and privacy issues. Tracking electronic payment data could be especially helpful to identify price trends in new or changing services, as occurred with the rise of the ride-share sector dominated by Uber and Lyft. For example, consumer expenditure survey limits respondents to categorizing these intracity transportation services under the “taxi fare” category. The transaction data would allow BLS to track such rapidly changing categories and perhaps speed up adoption of new or adjusted categories. Market research companies also construct consumer panels to collect timely data on spending. One such company, Traqlinem, conducts 150,000 interviews per quarter and releases spending data within a month of the end of the quarter, along with weights to balance the responses.
Merchant data should also continue to be investigated for use in price measurement. Online transactions collected by the software company Adobe (Lasiy, White, and Pandya, 2020) have been used to produce timely estimates of spending and quantities purchased of certain goods. Launched in 2016, the company’s Digital Price Index (DPI) initially covered a narrow range of goods and services, but now includes product categories including nonprescription medicines, consumer electronics, food, airfares, and furniture. The data behind Adobe’s DPI, sourced through Adobe Experience Cloud, represents 80 percent of all online transactions from the top 100 U.S. retailers, including aggregated, anonymous data from 15 billion website visits and 2.2 million products sold online. Goolsbee and Klenow (2018) accessed data for millions of transactions from Adobe Analytics (a service provider to many of the leading online retailers) to compare inflation rates for online sales with those estimated from traditional matched model, CPI-type indexes. They found online inflation to be lower by about 1 percentage point for the period 2014–2017. The authors had access to quantity data, they were able to examine the importance of several issues raised in this report. For example, using the high-frequency data, they were able to directly test for chain drift and to assess the magnitude of the new
goods problem (50 percent of online purchases were found to be of goods that did not exist in the data in the previous year).
The greatest flexibility in producing a wide range of price indexes is possible when transaction-level data for both prices and quantities are available in real time for the universe of goods with product identifiers, information on the outlet, and characteristics of the commodity (good or service). The quantity piece is the most difficult to obtain but—as has been demonstrated in the COVID-19 economy, where baskets have changed extremely rapidly—it is incredibly important information to have in a timely manner. To ready the CPI for this future data environment, modernization will need to focus on integrating multiple (public/commercial, survey/nonsurvey) data sources. The ability to integrate electronic transactions data—ideally, data that are linked to households making purchases—represents the ideal scenario for price measurement.
APPENDIX 2A: MULTILATERAL METHODS FOR PRICE MEASUREMENT
Scanner Data
Prices and quantities from scanner datasets provide an opportunity to construct timely price indexes using superlative index formulas such as Fisher or Törnqvist. If the datasets also have information on characteristics (attributes) of the product, then these indexes can be improved to better account for quality change with hedonic techniques to impute prices at entry to and exit from the market.
Chained versions of superlative price indexes—the recommended approach in case of high product churn—can suffer from chain drift, for example when consumers stock up goods that are on sale (see, for example, Feenstra and Shapiro, 2003; Ivancic, 2007). Chain drift occurs when the trend of the period-on-period chained version of a price index differs in a systematic fashion from that of the bilateral version of the index that compares directly the prices of two periods.46 These differences are problematic, because ideally one would like to make comparisons that are transitive, or independent of the order in which periods are compared. While a fixed-weight index, such as the CPI-U, is transitive, it suffers from substitution bias that can be avoided with a superlative index. Multilateral index number methods, which were originally developed for spatial price comparisons, have been adapted to deal with the chain drift problem. These methods have emerged as “best practices” to exploit scanner data for price measurement.
In contrast to bilateral index methods that compare prices across two time periods, multilateral index methods make price comparisons across three or more time periods (Chessa, 2016). Specifically, multilateral index methods use all bilateral product matches across all periods, weighted by their market importance (expenditure share). Usefully, the calculation assigns expenditure weights in a way that automatically gives greater importance to price changes of products with larger sales. Multilateral price indexes are transitive, or path-independent, implying that the chained versions of the indexes are equal to the direct, bilateral indexes. Thus, they are free from chain drift by construction.47
___________________
46 De Haan (2008, p. 15) showed that when the price of a detergent product went on sale in the Netherlands at approximately one-half of the regular price, the volume sold shot up approximately 1,000-fold. van Kints, de Haan, and Webster (2019) and de Haan and van der Grient (2011) explored the magnitude of volume fluctuations due to promotional sales, which led Ivancic, Diewert, and Fox (2011) to propose the use of multilateral indexes with a rolling estimation window to mitigate the chain drift problem.
47 Chapter 10 in the recently updated Consumer Price Index Manual (International Monetary Fund, 2020) provides a full description.
GEKS
The GEKS index48 offers a method to create transitivity in a set of bilateral indexes, for example based on the Fisher formula.49 Suppose the whole estimation window consists of T + 1 time periods t = 0,…,T. So, there are T + 1 possible base periods b for (direct) bilateral price comparisons across the window. In the bilateral price index (which uses both the current and base period quantities for weighting) going from period b to period t is denoted by Pbt; note that b can be greater than t. Assuming the bilateral index satisfies the time reversal test, i.e., Pbt = 1/Ptb,50 the price change between period 0, the index reference period (where the index=1), and the comparison period t (t = 1,…,T) can be measured by P0t(b) = Pbt / Pb0 = P0b × Pbt for each b. If all base periods b are deemed equally valid, then taking the geometric mean of P0t(b) across all possible b seems a reasonable thing to do. This leads to the GEKS price index:

Notice that the GEKS index between period 0 and the last period T is based on all the possible bilateral price indexes in the intervening periods. Hence, GEKS makes use of all the matches in the dataset.
For scanner data from supermarkets, the bilateral indexes in GEKS are typically matched model (maximum overlap) superlative price indexes. Ivancic, Diewert, and Fox (2011) used matched-model Fisher price indexes as elements in GEKS. De Haan and van der Grient (2011) used matched-model Törnqvist price indexes instead. ABS (2016) and the statistical agencies of Norway and Belgium have implemented matched-model GEKS-Törnqvist for the treatment of scanner data from supermarkets. The geometric form of the Törnqvist facilitates decomposition analyses, such as the decomposition of changes in the GEKS-Törnqvist index into the contributions of the various products (Webster and Tarnow-Mordi, 2019).
___________________
48 The acronym GEKS is based on the surnames of the “inventors,” Gini (1931), Eltetö and Köves (1964), and Szulc (1964).
49 There are other transitive multilateral index methods available, such as the weighted Time Product Dummy and Geary-Khamis. The GEKS method, when used with Fisher or Törnqvist bilateral indexes, is more flexible than the weighted Time Product Dummy or Geary-Khamis methods, because it is based on superlative bilateral price indexes, and can deal with different degrees of product substitution.
50 The time-reversal test is satisfied, for example, by the superlative Fisher and Törnqvist indexes.
GEKS and Hedonic Imputations
When product churn is high, imputed versions of price indexes are recommended to deal with the “missing prices” of unmatched new and disappearing products. There are several ways to impute the “missing prices,” which are surveyed by Diewert (2021a). One method would be to use inflation-adjusted prices (carried forward or carried backward), as suggested by Diewert, Fox, and Schreyer (2017). This method is similar to traditional imputation methods that do not use any information on product characteristics.
When quality change due to technological improvement is important, it would be preferable to apply hedonic imputations or to estimate reservation prices. If bilateral hedonic imputation price indexes are used in a GEKS context (rather than bilateral matched-model price indexes), the resulting GEKS indexes will be explicitly adjusted for quality changes. De Haan and Krsinich (2012, 2014) proposed using bilateral weighted Time Dummy Hedonic (TDH) regressions, which are estimated on the pooled data of the two periods compared (for each of the bilateral comparisons). They showed that a specific set of expenditure-share weights in the hedonic regression produces a bilateral TDH index that equals a bilateral hedonic imputation Törnqvist price index. Using these weighted bilateral TDH indexes as inputs in GEKS thus gives rise to a hedonic imputation GEKS-Törnqvist index. Statistics New Zealand implemented this method for scanner data on consumer electronics goods purchased from market research company GfK.
The choice of method, and whether to impute the missing prices, can be numerically important. Figure 2A-1 shows the performance of three different price indexes for televisions—the chained matched-model Törnqvist index, the matched-model GEKS-Törnqvist index, and the Imputation GEKS-Törnqvist index proposed by de Haan and Krsinich (2012)—estimated from scanner data provided by a large Dutch retailer. The analysis clearly demonstrates that the hedonic imputations had a significant impact as discussed by de Haan and Daalmans (2019). In short, the chained Törnqvist index suffers from chain drift that pulls it down. The index with imputations lies well above the Törnqvist index without imputation. While this result may come as a surprise to those accustomed to hedonic-type adjustments leading to more rapid price declines, de Haan and Daalmans provide a ready explanation in terms of retailers’ pricing strategies.
Revisions
When the sample period is extended and new data become available, previously estimated multilateral indexes will change (though often
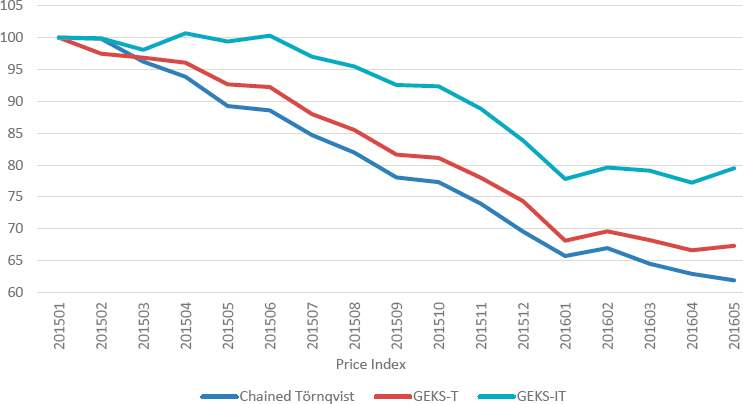
SOURCE: de Haan and Daalmans (2019).
slightly), which is problematic because the headline CPI cannot be continuously revised. Various approaches have been proposed to extend a multilateral time series without revising the published price index numbers. Rolling window methods are the most popular of these.
Rolling window methods estimate multilateral price indexes on a window of fixed length that is shifted forward each month (or quarter). The results of the latest window are then spliced onto the existing time series. For example, the most recently estimated month-on-month GEKS index movement can be spliced onto the index level of the previous quarter. There are several splice methods available, with the mean splice variant perhaps the most preferred (Diewert and Fox, 2020b). As its name suggests, the mean splice method takes the mean of the indexes that result from using all the possible splice periods; hence, it is independent of the choice of splice or link period. For supermarket scanner data, ABS implemented rolling window matched-model GEKS-Törnqvist with a mean splice (ABS, 2017).
Implementation Issues
Aggregation Level
Like bilateral methods, multilateral methods can be implemented at different levels of product aggregation. The additive Geary-Khamis and approximately weighted time product dummy (TPD) methods should only be applied at detailed aggregation levels where substitution possibilities are
high; that is, for relatively homogeneous product categories consisting of products with similar attributes. Low-level Geary-Khamis or TPD indexes should preferably be aggregated up using Fisher or Törnqvist weighting to account for upper-level substitution.
The more flexible GEKS method can be applied either directly at the upper level or at lower levels (combined with Fisher or Törnqvist upper-level weighting). The choice could also depend on practical issues—for example, if there is a lack of meta data to classify products into more or less homogeneous clusters. When supplemented with hedonic imputations, it seems natural to apply GEKS at the same level as where the hedonic models are estimated.
Defining the Product
An important aspect in the construction of price indexes is the choice of product identifier. Individual goods in scanner data are typically identified by barcode. Some products with different barcodes, however, are similar from the consumers’ point of view. Also, barcodes often change if unimportant characteristics change, such as type of packaging. In this case, matching at the barcode level would overstate product churn; additionally, price changes due to re-launches of comparable products with different barcodes will not be observed (Dalén, 2017). Such disguised price changes are often upward in which case missing them produces downward bias in the index. This is true for both bilateral and multilateral index number methods.
Statistical agencies sometimes receive Stock Keeping Units (SKUs) from the data providers that allow them to calculate unit value prices across SKUs rather than individual barcodes. This mitigates the above issues. In some instances, even SKUs may be too detailed so that matched-model methods, including GEKS, can yield biased results. Product descriptions in the scanner datasets could potentially be used to identify goods by cross-classifying important categorical attributes. Statistics Netherlands follows this approach when broadly defining products in scanner datasets for a number of product categories where a multilateral method (Geary-Khamis) is used, such as t-shirts and other apparel items (Chessa, 2016).
Similarity Linking
While multilateral methods have emerged as best practices for the treatment of scanner data, they have two potential drawbacks. First, multilateral methods do not satisfy the multiperiod identity test: when prices return to their initial level, multilateral price indexes, including GEKS, are not necessarily equal to 1. At least from a theoretical perspective, violation of the
identity test is problematic. Second, the transitivity property is no longer satisfied when a rolling window extension approach is used: that is, rolling window GEKS (or other multilateral) indexes are not necessarily free from “link drift.”
To deal with these two drawbacks, Diewert (2021b) proposed using similarity linking. The set of prices in the current (most recent period) is compared with the set of prices in each of the previous periods. Using some measure of relative price (dis)similarity, the prior period with the most similar prices is selected. Then, a bilateral superlative price index going from this period to the current period is constructed and linked to, or spliced onto, the index value in the selected period. To extend the time series, this method simply enlarges the window by adding new data (the “comprehensive window approach” mentioned earlier), not a rolling window approach.
Similarity linking can be seen as an alternative to rolling window GEKS-Fisher or GEKS-Törnqvist with better axiomatic properties. Also, because the time series is extended without a rolling window approach, link drift cannot occur. Different choices of (dis)similarity measure are possible. Diewert (2021b) advocated a predicted share method for price similarity linking. This method takes into account the matched products’ expenditure shares, i.e., price comparisons with few matched products, which are likely to be unreliable, will have a small weight. The predicted share similarity linking method thus seems useful when there is a high degree of product turnover. It is also promising for the treatment of strongly seasonal goods, i.e., products that are only available in particular months of the year, such as fresh fruit and vegetables. Diewert, Finkel, and Sayag (2021) applied this method using data from Israel for fresh fruits and compared the resulting indexes with a wide variety of alternative indexes.
Diewert (2021b) showed how similarity linking can be applied when only price information is available, including web-scraped data, as an alternative to rolling window TPD. For the Israeli seasonal data, Diewert, Finkel, and Sayag (2021) compared the modified (for price data only) predicted share indexes to the multilateral TPD and GEKS-Jevons indexes. The seasonal fluctuations in the similarity linked indexes were far smaller than the fluctuations in the two alternative indexes.
So far, no national statistical agency has implemented similarity linking in the CPI, with the exception of Statistics Canada in a specific application.51 More research is needed to examine how these methods, and in par-
___________________
51 Statistics Canada implemented the predicted share method of linking its Adjusted CPI for the current month to a previous month; see O’Donnell and Yélou (2021). The Adjusted CPI was introduced as an analytical series in an attempt to deal with rapidly changing monthly expenditure shares (at the upper level) induced by the COVID-19 pandemic.
ticular the preferred predicted share method, will perform on large scanner data or web-scraped datasets. It would also be interesting to explore how hedonic imputations can be incorporated if explicit quality adjustment is deemed necessary.
APPENDIX 2B: RESEARCH ON EFFORTS TO PERFORM QUALITY ADJUSTMENT AT SCALE
Prices for goods in an elementary index can rise when prices of identical goods change (pure price change) or when goods improve (quality change) and higher prices reflect that higher quality. In a COLI context, the quality change challenge is to identify quality changes in order to construct a price index that only tracks pure price changes that affect welfare and not quality changes.
Some of the recent methodological advances in adjusting for quality change by academics have taken a demand-based approach, making explicit assumptions about the nature of the underlying utility function. In some cases, that approach requires estimated utility parameters for the index construction. For example, Feenstra (1994), and more recently Redding and Weinstein (2020), assume a Constant Elasticity of Substitution (CES) utility specification to construct the implied price indexes.52 A recent application of the Redding–Weinstein approach found implausible results, suggesting that this approach remains a work in progress. Overall, these demand-based methods are not used by statistical agencies because a price index that is heavily dependent on the assumption that consumers choose expenditures to maximize a CES utility function would not be reliable enough for official purposes.
At the same time, another strand of the literature is based on econometrics rather than a demand model and data on expenditure shares. In this literature the hedonic coefficients are not tied to any underlying consumer preferences and do not necessarily have an intuitive interpretation. Instead, the hedonic regression is viewed as a reduced form whose coefficients reflect changes in both demand- and supply-side factors (Pakes, 2003). Under this view, the primary purpose of a hedonic regression is to predict prices, in which case choices about the specification are all about the predictive power of the regression, not the sign and magnitude of the coefficients.
This approach is related to the “imputation method” that has been around for decades. The chapter on hedonics in Berndt’s (1991) econometrics textbook shows how hedonic regressions can be used to predict prices missing in the period before entry or after exit to allow the inclusion of those prices in the index. Recently, these imputation indexes and how
___________________
52 As the name implies, with CES, the ratio between proportional changes in relative prices and proportional changes in relative quantities is always the same. The theoretical appeal of the Redding–Weinstein method has been debated because it violates many of the basic axioms for price indexes by allowing changes in tastes to affect the price index in the same way as price changes. Moreover, Diewert and Feenstra (2017) argued that the infinitely high implicit “demand reservation prices” of the CES model can result in overadjustment for new and disappearing varieties.
they compare to other approaches have been studied, particularly in the context of scanner data (de Haan and Krsinich, 2012, 2014; Silver, 2010) and have been empirically implemented in other “big data” contexts (see, for example, Bajari et al., 2021; Ehrlich et al., 2021).
Recent innovations to these imputation methods have centered on (1) handling unobserved characteristics, and (2) improving methods to estimate hedonic equations at scale. Erickson and Pakes (2011) developed a method that allows for accounting for changes in unobserved characteristics. Ehrlich et al., (2021) folded this method into their strategy for constructing price indexes with scanner data.53
The other direction taken in recent work has been in leveraging new artificial intelligence (AI) techniques to develop improved methods that yield more precise predictions from hedonic regressions. Bajari et al., (2021) conducted the seminal work in this area: In the context of superlative index formulas, they show that it is possible to apply these new approaches to obtain reasonable measures of price change at scale. That is, their methods lend themselves to automation and, in principle, do not require the human intervention of the traditional methods. Ehrlich et al. (2021) and Firooz, Zheng, and Wang (2022) contain recent implementations of these novel methods.54
A very recent paper (Ehrlich et al., 2021) attempts to implement both demand-based and reduced-form approaches to scanner data. The authors applied an approach that Redding and Weinstein applied to several classes of IT goods and found that the approach yielded implausible results. They applied a second approach that combined the machine learning estimation methods introduced by Bajari et al. (2015) with econometric methods that allow for unobservable characteristics based on Erickson and Pakes (2011). Empirical works like these provide much needed perspective on the relative merits of these new contributions.
___________________
53 The ability of the method to measure quality improvements at the time of entry of new varieties is an open question.
54 Another promising feature of some of these AI methods is that they do not require a structured variable with which to represent characteristics. Instead, they can use unstructured text in product descriptions and AI picture representations of the products.
This page intentionally left blank.


