
5
Modernizing Difficult-to-Measure Expenditure Categories: Medical Care
5.1. MOTIVATION
Medical care is a large, growing, and at times rapidly changing expenditure category, and identification and measurement of the sector’s prices and quantities are conceptually complex. The domain of medical care in the Consumer Price Index (CPI) is limited to prices for goods and services on which consumers make direct out-of-pocket outlays: (1) health insurance; (2) prescription drugs; (3) over-the-counter drugs and medical supplies; (4) services from physicians, dentists, and other medical professionals; and (5) hospitals and related services.
For the CPI, the expenditure weight assigned to medical care reflects the share of medical services directly purchased by consumers. Health insurance premiums (individually purchased, Medicare Parts B and D premiums, employee share of employer-sponsored insurance) and direct payments (retail purchases, deductibles, copayments, and coinsurance) are therefore in scope while Medicaid, Medicare Part A, Veteran’s, and employer-paid health insurance premiums are out of scope.
The focus on consumer purchases renders the weight of health care in the CPI much lower than it is in the National Income and Product Accounts (NIPA), which covers the entire health care sector (not just the goods and services purchased directly by consumers). Reflecting these different objectives, the weight of medical care in Personal Consumer Expenditures (PCE) inflation in 2020 was 22.3 percent whereas the weight in CPI inflation was just 8.9 percent (Figure 5-1).
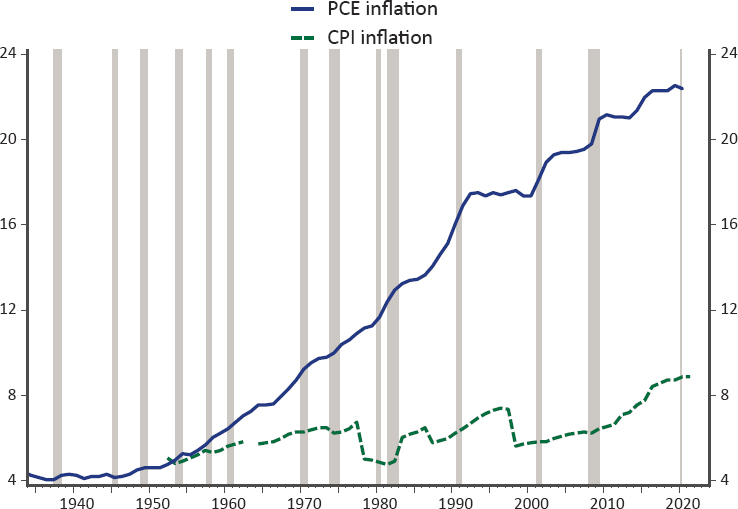
SOURCE: Panel-generated using BLS data.
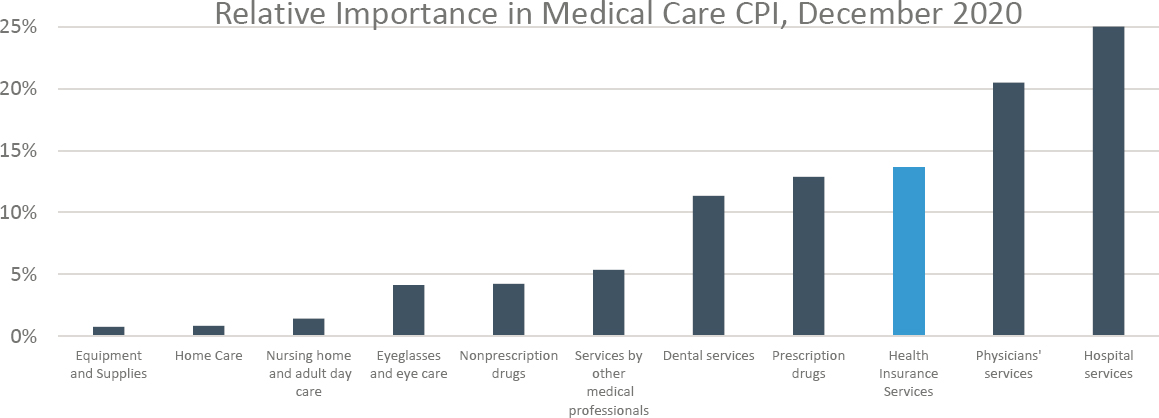
Within the more limited scope of the CPI, health insurance premiums are of primary importance, accounting for around 70 percent of consumers’ medical care expenditures (see Figure 5-2). However, as described below, most of consumers’ payments for health insurance premiums are reassigned to the other medical expenditure categories. Three other major categories—medical services, drugs, and medical supplies paid directly by consumers—make up the balance.
Accordingly, the primary focus of the panel in the area of medical care is assessing the current methodology of the Bureau of Labor Statistics (BLS) for measuring health insurance costs faced by consumers. In particular, we focus on the pros and cons of two different conceptual frameworks for pricing health insurance: the indirect method, currently used in the CPI, and the direct method, currently used in the Producer Price Index (PPI) for health insurance. This chapter also considers how various data sources (insurance filings, claims data, hospital data, scanner data on drugs, etc.) could be used to improve the coverage, detail, and timeliness of the CPI medical care index more broadly, more or less within the current framework.
BLS collects many medical care services prices through its commodities and services survey although it receives a large volume of data on
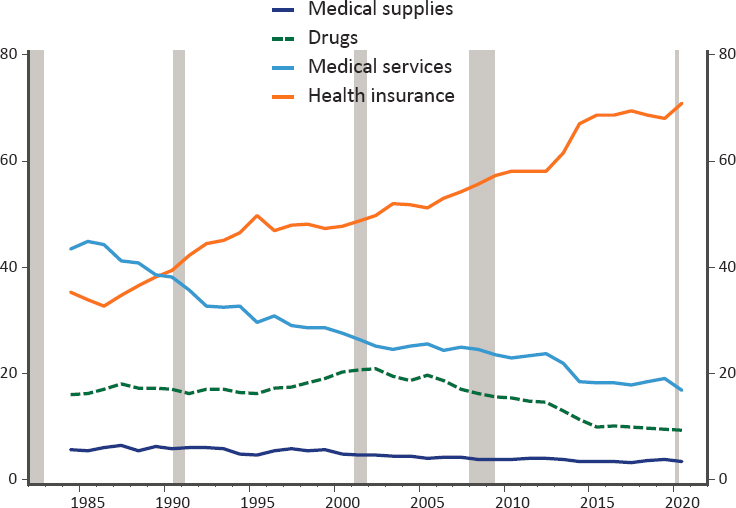
SOURCE: Panel-generated using BLS data.
prescription drug prices from one firm.1 As discussed in Chapter 2, there are growing concerns that BLS’s current surveys are becoming less viable and producing less accurate data over time. The medical component of the CPI currently has the lowest response rate among the different commodities and services groups. As shown in Figure 5-3, that rate has dropped significantly—down to around 40 percent over the past decade—reflecting physicians and hospitals that are not responding to requests for price information about their services.
Much previous work has been devoted to conceptual measurement questions related to how health care prices should adjust for quality change. The productivity literature has developed a conceptual framework for defining the inputs of medical care in such a way that they can be tied to the outputs and then prices appropriately quality adjusted to reflect resulting improved health outcomes.2 Much of this work has been developed in the
___________________
1www.bls.gov/cpi/factsheets/medical-care.htm.
2Dauda, Dunn, and Hall (2019) examined quality-adjusted prices and productivity for three acute conditions; Dauda, Dunn, and Hall (2020) evaluated 8,000+ cost-effectiveness studies; Romley et al. (2019) conducted event studies for eight conditions; Sheiner and Malinovskaya (2016) and Cutler et al. (2020) examined productivity for the Medicare population.
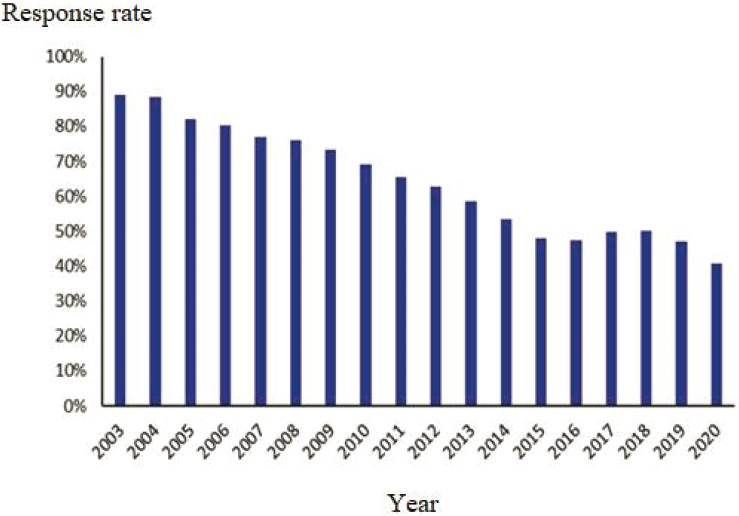
SOURCE: Panel-generated, from BLS data (www.bls.gov/cpi/tables/response-rates/home.htm#Archived%20Response%20Rates).
context of national income accounting and, for reasons discussed in Section 5.3 and elsewhere (NRC, 2002), may not be completely translatable to the CPI. One argument for a more limited approach to quality adjustment in the CPI is that the uses to which it is put—for example, to index payments to reflect cost-of-living changes on an annual basis—are distinct from that of measuring health care inputs/outputs as covered in the PCE (to reflect welfare).
Because the specifications of a broader health/health care account have been articulated elsewhere, and because the charge here is to provide guidance targeted at data modernization, this report does not delve deeply into quality change measurement for the sector. It is worth reiterating, however, that alternative data sources could be helpful for gauging quality change, allowing for a more careful and detailed tracking of the characteristics of medical care inputs that consumers purchase—such as insurance policies—and of the outcomes experienced by consumers who undergo various medical procedures and other treatments.
5.2. PRICING HEALTH INSURANCE
Due to its relatively high expenditure share of medical care costs, accurately tracking the prices of medical services purchased through health insurance is of critical importance to accurately estimating price changes faced by consumers. We discuss two different options for pricing health insurance—the indirect pricing method currently used in the U.S. CPI and the direct method used for the PPI, highlighting the pros and cons of each. As explained below, the direct approach involves estimating total health insurance premium prices, while the indirect approach involves pricing health insurance using information about retained earnings blended with changes in the price of medical care.
5.2.1. The Indirect Method
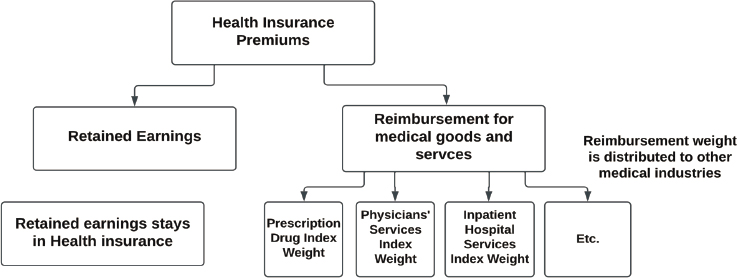
The CPI decomposes spending on health insurance policies into two components: (1) the expenditures related to the provision of services provided by health insurance companies—insurance, claims processing, and utilization management; and (2) the expenditures used to pay medical providers for care, as shown in Figure 5-4. In this conceptualization of health insurance, the insurance company can be viewed as acting as an intermediary that does the actual purchasing of medical services and then “sells” these services to households. Households thus are viewed as purchasing medical services from medical providers, albeit indirectly, and purchasing insurance services from the insurance company. BLS allocates the part of the health insurance premium that goes to paying for medical services—which amounts to roughly 80 percent—away from the “health insurance” category and into the medical services categories. The remaining 20 percent—the premium less the cost of the medical benefits, or what BLS calls “retained earnings”—is labeled as “health insurance.”3 Note that retained earnings include not only profits earned by the insurance company, but also all nonmedical costs, including claims processing, advertising, and taxes.4
Figure 5-5 shows the relative importance of the components of health costs in the CPI after this reallocation has been done. Once the medical
___________________
3 Sometimes confusion arises in discussions of health insurance prices because, for the PPI, the price of health insurance refers to the price of the whole health insurance policy, without any reallocation, whereas for the CPI, it refers to the prices of only the services directly provided by the health insurer.
4 There may also be some confusion related to the term “retained earnings,” which in this usage differs from its more standard usage in accounting. It can be thought of as the implicit service charge for the services provided directly by the health insurance industry, net of the medical services that are bundled with the premium.
SOURCE: BLS, www.bls.gov/cpi/factsheets/medical-care.htm.
expenses paid for through insurance are relocated to medical care, health insurance is a much smaller share of the medical care CPI—just 14 percent in December 2020 (as opposed to the “pre-reallocation” 70 percent shown in Figure 5-2). To calculate the medical CPI, BLS obtains price quotes for each of the listed components and weights them accordingly. For example, for physician services, BLS obtains prices for the same service at the same physician over time. To calculate the price of health insurance services, BLS uses estimates of changes in the ratio of insurance company retained earnings to medical benefits, which they collect once a year.5 This annual relative is converted to a monthly relative for the regularly published CPI by assuming a smooth change in prices over the year.
Several concerns have arisen concerning use of this indirect method. One is that the data on retained earnings are compiled annually and are available only with a considerable lag (about 10 months). To address this problem, the CPI program is considering the use of quarterly data on retained earnings instead of the annual data currently used.
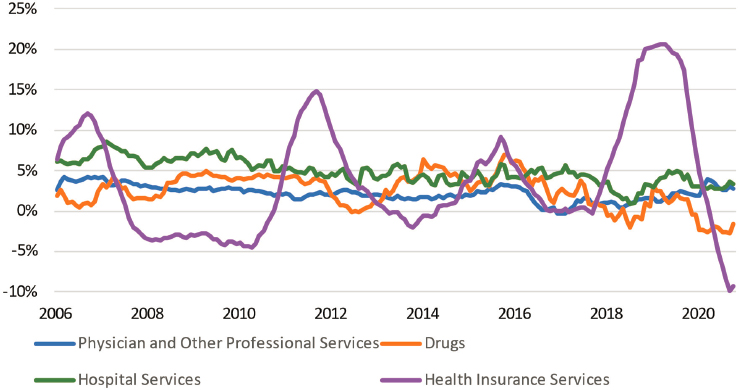
Additionally, the insurance component of medical care is volatile. As shown in Figure 5-6, there is much more volatility in the prices of the health insurance component than in the other medical service components. This volatility likely stems from the fact that retained earnings are a residual and a relatively small share of the health insurance premium. Thus, unexpected changes in utilization from year to year could lead to large swings in the ratio of retained earnings to medical expenditures and therefore to the price of health insurance in the CPI. For example, when utilization increases more than expected, retained earnings will fall and retained earnings as a share of medical expenditures will fall even more. In contrast, expected
___________________
5 The method is described in detail in BLS (2001) and in the CPI Medical Care Fact Sheet.
SOURCE: Panel-generated using BLS data.
SOURCE: Panel-generated using BLS data.
changes in utilization will boost the premium and not have much effect on retained earnings. This volatility was likely a particularly big issue in recent years given turmoil in the individual and exchange-based health insurance market associated with the Affordable Care Act (ACA).
Finally, the approach does not attempt to adjust for changes in the quality and quantity of the insurance services provided. For example, if the risk of catastrophic medical expenses increases over time, the value of insurance would likewise increase, even holding expected medical expenses constant. Similarly, if a particular policy increased in price because it lowered the probability of “surprise billing,” that price increase should be viewed as an increase in quality, not an increase in price as would be recorded in the CPI.
5.2.2. The Direct Method
BLS uses the direct method to measure the prices of health and medical insurance carriers in the PPI. Unlike the indirect method, the direct method prices health insurance premiums as a whole rather than as a residual. The method involves, first, selecting a set of health insurance policies to price, then, for each policy, tracking the price of the policies over time holding constant the age, health conditions of the applicant, coverage, deductibles, and copays.
A data issue for the direct method is that identical policies are not always available (or offered) for comparison from one period to the next. In such cases, BLS asks the insurance companies to assign a value to the risk change associated with the change in policy characteristics to maintain constant quality. Since policies are repriced when they are renewed, companies should in principle be able to provide this information in the rate determination for a given year. Broadly speaking, it is a challenge to estimate the health insurance value to consumers in terms of risk management.
5.2.3. Comparing the Methods
A key question is whether BLS should switch its CPI approach of pricing insurance from the current indirect method to a direct method more akin to that used in the PPI. Of course, the appropriate price index will depend on what it is used for. As discussed below, from a cost-of-living perspective, an increase in spending on health insurance that reflects increased health care expenditures from improvements in technology is an increase in real spending, not in prices. Because the CPI is intended to be a conditional cost-of-living measure, an ideal index would fully control for changes in quality and utilization over time, and we evaluate the two methods under this framework.6
It is worth noting that BLS has been weighing the relative merits of the different approaches to pricing health insurance for some time. In response to the Boskin Commission’s (Advisory Commission to Study the Consumer Price Index, 1996) estimation of an annual upward bias of 3 percentage points for hospital and related services in the CPI, BLS began investigating approaches to addressing problems cited in that report, which mainly had to do with the difficulty of capturing the benefits of new and improved technologies and treatment methods. One approach was the direct pricing of health insurance done through the collection and quality-adjustment of health insurance premiums data. But, at the time, BLS decided that “the problems of adjusting premiums for utilization and other quality changes were prohibitive” (Greenlees, 2006, p. 33).
___________________
6 Exactly how to control for quality is a very complicated issue, particularly because the health care system tends to allow the consumer limited choice about the quality of health care. Thus, an improvement in quality that is worth its cost to the average consumer and hence counted as a price decrease may be viewed as a price increase by consumers who do not value the improvement as highly.
When it comes to an appropriate index for benefits like Social Security or child tax credits, policy makers may want to ensure that increases in the “costs” of health care—even if stemming from improvements in health care—lead to an increase in benefits such that households would be able to afford both the improved health care and the same basket of non-health goods as before. We view that as a policy question that is beyond the scope of this chapter.
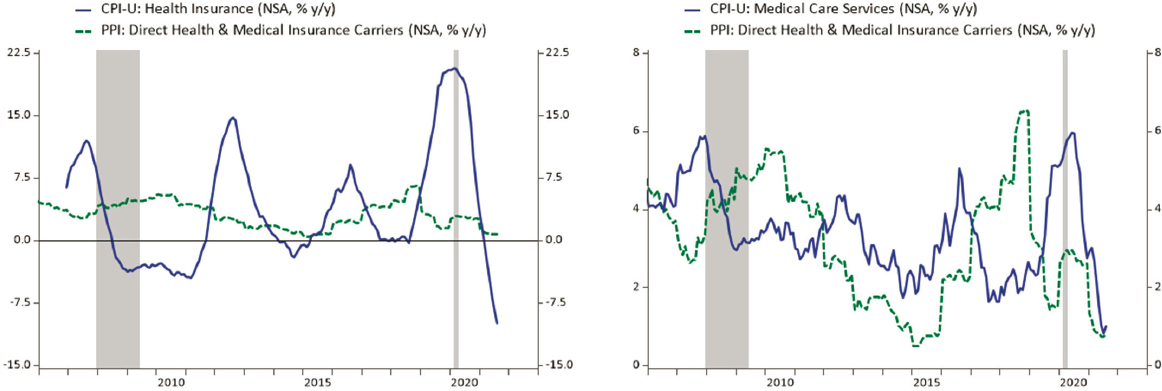
As noted, one source of discomfort with the indirect method is the volatility of the price relative for health insurance in the CPI. Indeed, comparing price change for health insurance in the CPI to that as measured by the PPI (Figure 5-7, left panel), the latter appears less volatile. But this is not a valid comparison because, as noted above, health insurance services in CPI are quite different in scope from health insurance services in the PPI. The PPI prices the whole policy rather than splitting it into health insurance and benefits components as is done in the CPI.7 A more relevant comparison would be between the PPI and estimates of CPI price changes for the whole insurance policy using a weighted average of the health insurance component and the medical price components. However, BLS does not publish the data necessary to perform that calculation.8 As shown on the right side of Figure 5-7, when comparing total medical services in the CPI (which include health insurance costs) to the PPI health insurance index, no obvious pattern of differences in variability emerges.
Conceptual Comparison
The indirect and direct methods differ conceptually in three ways, which are described mathematically in Appendix 5A. In order to provide a meaningful conceptual comparison between the two methods, we focus on the “whole policy” price under the indirect method—that is, the weighted average change in the price of CPI “health insurance services” and the price of the medical services financed by health insurance. This is the price change the indirect method implicitly uses for the change in price of health insurance policies and is directly comparable to the price change under the direct method.
Three conceptual differences between the direct and indirect methods are as follows:
- Although the measurement ideal of both methods is the same—to track prices of constant quantity, constant quality insurance policies—the direct method prices a fixed health insurance policy in such a way that adjustment for expected changes in utilization
___________________
7 The scope of the PPI and the CPI differ in other ways as well. For example, since the PPI includes all revenue received by insurers, employers’ contributions are in scope. These contributions are excluded in the CPI, as is Medicaid, much of which is provided by commercially managed care companies that are within scope of the PPI. And, of course, the CPI Medical Care index also includes prices of items not paid for by insurance.
8 It is difficult to even do a rough estimate because the shares of different components—hospital, physician, health insurance, drug, etc. in covered medical expenses—have shifted a lot over time.
SOURCE: Panel-generated using BLS data.
- is limited,9 while the indirect method attempts to capture the pure price changes in health insurance as distinct from quantity changes.
- The indirect method is an ex-post measure. Because it relies on retained earnings, it asks: What were the costs of insurance per unit of health care that a consumer experienced? The direct method is an ex-ante method, capturing what the consumer actually paid for insurance, which does not depend on whether utilization turned out to be unexpectedly high or low.
- The indirect method relies on BLS’s price measures for underlying medical services while the direct method does not. As discussed below, in some cases, the direct method will do a better job of capturing cost savings that are the result of substitution between medical goods and services.
- As we discuss below, neither method is an ideal measure of health insurance price inflation, but the panel believes that the indirect method is on the whole less likely to conflate quality/quantity changes with price changes.10
Changes in Utilization
The direct method simply prices health insurance policies, holding fixed aspects like the demographics of the policy holder and the financial attributes of the policy—coinsurance, deductibles, and the like. If health utilization increases over time for a given set of policy attributes, the direct method will attribute those increases to health insurance prices. In contrast, under the indirect method, expected changes in utilization that do not affect retained earnings per unit of medical care are not counted as an increase in the “whole price” of health insurance (the health insurance services plus the medical services financed through insurance). That is because the indirect method is based only on the price of medical services—e.g., the price of a cataract operation—and the retained earnings of insurance companies. An increase in premiums because an insurance company expects to pay for more cataract operations, for example, will not show up as higher medical price inflation using the indirect method, but it will using the direct method.
Indeed, Appendix 5A shows that, abstracting from data issues, the direct method price relative is equal to the indirect method price relative multiplied by a factor reflecting the growth in utilization. When utilization
___________________
9 The direct method used for the PPI does attempt to hold constant expected utilization tied to individual risk factors. However, exogenous factors shifting utilization independent of enrollee characteristics (e.g., introduction of a new treatment) will generally not be captured.
10 Indeed, the problem of not measuring the quality/quantity of financial protection offered by the insurance policy is common to both approaches.
increases from one period to the next, the direct method will show a larger increase in prices than the indirect method; the converse is true when utilization falls.
A key question is the extent to which changes in health insurance costs over time result from improved quality or increased quantity of the health services covered by that insurance, and the extent to which they represent increases in prices for the same treatments. Most economists believe that the increase in health spending over time is largely the result of improvements in technology, rather than increased costs for the same services (Smith, Newhouse, and Freeland, 2009). Some new technologies are more expensive but also have better outcomes. For these technologies, spending increases over time both because treatments are more expensive and because the improved outcomes may make the treatments helpful for more patients. For example, the technologies used in renal dialysis therapy have gotten more expensive but better over time, leading to shorter treatment times and lower side effects. As a result of these improved outcomes, the clinical criteria for prescribing such therapy have expanded, leading to a dramatic rise in the number of dialysis treatments over the past 30 years (CBO, 2008; CDC, 2021). Other technologies lower treatment costs per patient, but still lead to higher health spending because of their wider use. For example, improvements in cataract surgery greatly reduced the cost of treatment but led to a four-fold increase in the incidence of the surgery (Shapiro, Shapiro, and Wilcox, 2001) and increased spending on cataract treatments overall.
A consumer buying health insurance in 2022 is getting a lot more insurance than they were in 2000—they are getting more and better treatments if they have cancer, have a heart attack, get hepatitis, or have other conditions. These services should be viewed as an increase in the real quantity of health care consumed—or, equivalently, as an increase in the quality of the health insurance policy—not an increase in prices. But because the direct method simply prices a “health insurance policy” with a set of attributes, it will attribute most of these increases in the quantity and quality of health services to health insurance inflation.
When major changes in technology occur that are expected to significantly increase health spending (e.g., the new drugs to treat Hepatitis C), BLS asks insurance companies to price coverage with and without the cost of the new technology so that they do not attribute the increased premium to prices, but it is not clear how effectively this is done. Furthermore, most increases in utilization are less dramatic and unlikely to be picked up in this manner. For example, the improvements in cataract surgery described above occurred gradually throughout the 1970s, 1980s, and 1990s, and it is very unlikely that the direct method would adjust for these types of quality and quantity changes.
Ex-Ante versus Ex-Post Utilization
The indirect method is an ex-post measure of the price of health insurance services—it is based on insurance companies’ actual profits after the fact. If utilization is unexpectedly high, insurance companies will have lower retained earnings because they will have paid out more of their earned premium income through claims; if utilization is unexpectedly low, the converse will be the case (in contrast, if utilization is expected to be high, that will show up in premiums and not retained earnings).
Thus, the indirect method asks: What were the costs of health insurance services per unit of medical services for someone who bought a health insurance policy in a particular year? If utilization was unexpectedly very high, the measured price of insurance services per unit of health care will be low (both because the numerator of the price [retained earnings] is low and the denominator [quantity of health services] is high), and if utilization was very low, the measured price of insurance will be high.
But the price a consumer faces when choosing whether or not to buy a policy is an ex-ante price—consumers have to purchase insurance before they know whether there will be a bad flu season or some other unexpected occurrence that affects utilization (like COVID-19). When they purchase insurance, they are buying a product that will pay for (some of) their expected health care expenses and for protection from a catastrophic financial loss due to a large medical expense that might happen in the future.
The direct method, in contrast, is an ex-ante price—it simply measures the price a consumer pays for a particular health policy at a given time (holding constant, to the extent possible, the features of that policy like deductibles and coinsurance).11 If there is a bad unanticipated flu season, the direct method will not show a lower price of health insurance. From this perspective, the direct method seems preferable and akin to how other “composite” goods and services are priced. For example, the cost of a gym
___________________
11 BLS uses the direct method to price other types of insurance in the CPI—e.g., auto and homeowners’ as well as property and casualty insurance. To price those policies, BLS holds the characteristics of the insured property constant, like the type of car for auto insurance and the size of the house for homeowners’ insurance. In these cases, there is less concern that ongoing quality changes in the methods used to address damages—e.g., in the methods used to repair cars—will lead to quality changes being assessed as price changes. One potential counterexample is the effects of climate change on homeowners’ insurance. If climate change boosts insurance premiums because it increases the severity and frequency of damages, it is unclear whether the CPI should treat those higher premiums as higher prices, and how much they should be viewed as higher quality, since any given insurance policy will be providing a greater degree of financial protection and expected payouts.
membership does not depend on how many times people visit the club.12 As discussed below, however, health insurance companies are sometimes required to provide rebates to their customers if utilization turns out to be too low relative to premiums.13
The ex-post perspective creates volatility in the index, but it does not bias it. Years of higher-than-expected utilization will be balanced by years of lower-than-expected utilization and higher costs.
Quality Adjustment Problems Using the Indirect Method
Although the discussion above suggests that the indirect method is less likely to conflate increases in quantity and quality with prices, it is not perfect. The indirect method relies on CPIs from BLS for physician services, hospital services, prescription drugs, and other costs to capture the changing prices of the medical services provided through health insurance. The prices of medical services as measured by BLS do not fully control for changes in the quality of the services (Dunn, Rittmueller, and Whitmire, 2015), meaning that the indirect method will still ascribe some increases in quality to higher prices. For example, the consumer price index for hospital services might price the costs of a hospital stay for a particular cause—say a hip replacement—over time. If the outcomes from hip replacements are improving because of new technologies that cost more, this increase in quality will not be captured and will instead appear as a price increase for hospital services. Of course, both the direct and indirect methods will miss this quality improvement.
But there is one situation in which the direct method may better capture quality changes than the indirect method. In the direct method, a switch from one form of treatment to another—say a switch to medical management from surgery, or a cost-saving switch from inpatient to outpatient care—will count as a lower price of health insurance, whereas in the indirect method (which relies on CPIs from BLS that view inpatient and outpatient care as separate services), it will not. In other words, the
___________________
12 We adhere to the view of the CPI as a “conditional cost of living index” where the conditions would include whether or not there was a bad flu season or pandemic. Thus, we do not think it is a problem for consumers to appear “better off” from the purchase of insurance during a pandemic—the pandemic made people worse off, but the insurance itself made them better off. Our point is more about the knowledge people have when they choose to purchase insurance. If they do not anticipate the pandemic, then they will not view insurance as having a low price even if, ex post, after the pandemic began, it is clear that they are much better off from having the insurance.
13 The question of how to treat rebates makes this discussion of ex ante versus ex post approaches more complex. We turn to those issues below.
direct method solves the outlet substitution bias that plagues many other categories of spending in the CPI.
It is an empirical question which method overstates the true rise in health insurance costs more. The indirect method does not count increases in utilization over time as price increases, but it also does not capture any savings from some cost-saving shifts in treatments. Examining changes in total spending by illness for a group of commercially insured individuals from 2003 to 2007, Dunn, Liebman, and Shapiro (2014) examined changes in the costs of treatments for specific conditions over time—thus capturing any costs changes from modifications in the location or method of treatment—and found that the shift toward greater intensity of service use outweighed the savings from shifting forms of care; however, over this time period, the number of treatment episodes per beneficiary increased 1.7 percent per year. Thus, for this population and time period, the direct method (which would include the increase in the number of treatments as an increase in price) would have overstated inflation in health insurance costs substantially more than the indirect method.
In an attempt to provide more intuition about the two methods, Table 5-1 provides some examples of how different types of changes in health spending affect measured health prices using the indirect and direct methods. We distinguish between changes that were anticipated (and hence are reflected in the premium and do not affect retained earnings) and unanticipated (in which case they are not reflected in the premium and hence affect retained earnings).14 We compare the treatments under the two methods to those that would be captured by a theoretically ideal CPI.
The indirect method handles anticipated changes in medical care prices and utilization (shown in the first two rows of Table 5-1) appropriately, and it also handles unanticipated changes in medical care prices (row 6) appropriately. However, in the case of an unanticipated increase in utilization (row 5), the indirect method registers a spurious decline, while in the cases of anticipated or unanticipated changes in treatment technologies that reduce the cost of treating a disease (rows 3 and 5), the indirect method overstates inflation. Note, however, that the distortions to the indirect method from unanticipated changes do not affect the behavior of the index over the long run, as expectations will eventually catch up with current conditions.
Neither the direct nor indirect method will capture changes in consumer welfare arising from quality improvements that exceed their price (rows 4 and 8). To get this right would require a very different approach to price measurement, similar to that used in Cutler et al. (2020), Dauda, Dunn, and Hall (2020), and Sheiner and Malinovskaya (2016).
___________________
14 In these examples, we assume retained earnings are a constant share of anticipated medical spending.
TABLE 5-1 Impact of Changes in Health Spending on Measured Health Prices Using the Indirect and Direct Methods
| Effects of Increases in Health Care Spending on “Total Health Insurance” Prices Depending on Source of Increase and Method | ||||||
|---|---|---|---|---|---|---|
| Source of Spending Increase | Effect on Premium | Effect on Retained Earnings | Effect on Measured Prices of Medical Goods and Services | Effect on Health Insurance Price Direct Method | Effect on “Total Health Insurance Price” Indirect Method | Effect on Theoretically Ideal CPI |
| Anticipated increased utilization (more surgeries, more tests, etc.) | Higher | None | None | Higher Price | None | None |
| Anticipated higher prices of physicians and other providers | Higher | None | Higher | Higher Price | Higher Price | Higher Price |
| Anticipated cost-saving change in form of care (inpatient to outpatient, drugs instead of talk therapy, etc.) | Lower | None | None | Lower Price | None | Lower Price |
| Anticipated increased price and quality/intensity of care within a service that BLS prices like a doctor’s visit, hip replacement, stent, etc. | Higher | None | Higher | Higher Price | Higher Price | Ambiguousa |
| Unanticipated increased utilization (more surgeries, more tests, etc.) e.g., a bad flu season | None | Lower | None | None | Lower Price | None |
| Unanticipated higher prices of physicians and other providers | None | Lower | Higher | None | Noneb | None |
| Unanticipated cost-saving change in form of care (inpatient to outpatient, drugs instead of talk therapy, etc.) | None | Higher | None | None | Higher Price | None |
| Effects of Increases in Health Care Spending on “Total Health Insurance” Prices Depending on Source of Increase and Method | ||||||
|---|---|---|---|---|---|---|
| Source of Spending Increase | Effect on Premium | Effect on Retained Earnings | Effect on Measured Prices of Medical Goods and Services | Effect on Health Insurance Price Direct Method | Effect on “Total Health Insurance Price” Indirect Method | Effect on Theoretically Ideal CPI |
| Unanticipated increased price and quality/intensity of care within a service—e.g., doctor’s visit, hip replacement, stent—that BLS prices | None | Lower | Higher | None | Higher Price | Ambiguousc |
a If value of increased quality/intensity exceeds its price, Lower Price. If value is equal to price, No Change. If value is lower than price increase, Higher Price.
b When prices are unexpectedly higher, retained earnings are unexpectedly low, offsetting the price increase. This can be seen by noting that prices do not appear in the comparison between direct and indirect methods (see Appendix 5B).
c If increased quality is valuable, the effect is a lower price. If increased intensity is not valuable (ineffective treatment), the effect is a higher price.
Choice of Providers Available to the Insured
Neither the direct method nor the indirect method as currently implemented by BLS fully accounts for the quality of health insurance services, which can include the provision of 24-hour hotlines, good customer service, and, most especially, the breadth of the provider network. The indirect method will capture the difference in claim rejections by different insurers and, to some extent, out-of-network generosity as these will affect the share of the premium that is in retained earnings.
A Suggested Alternative Indirect Method
As shown in Appendix 5B, the indirect method—as currently implemented by BLS—prices the cost of health insurance services per unit of health care. If the services provided by health insurance are considered as primarily related to claims processing and other administrative costs, this makes sense. The cost of insurance is like a markup on the cost of the health care.
Another approach would be to view the quantity of health insurance purchased as simply one per policy. Under that approach, the health insurance costs would simply be the ratio of retained earnings per policy, rather than retained earnings per unit of health care. The appeal of this alternative approach is that it recognizes that health insurance is valuable regardless of whether any health care is used at all: in other words, part of the policy reflects the financial protection it provides. In addition, having health insurance also allows a consumer access to the prices negotiated by insurance companies, which tend to be lower than those charged to uninsured consumers.
With this alternative methodology, it would still be the case that when utilization is unexpectedly low, health insurance would appear expensive, because retained earnings would be high. But the effect would be smaller than under the current implementation, when not only are retained earnings low, but also retained earnings per unit of health care is particularly low.
Scope and Compositional Effects
The direct method prices particular health insurance policies for a fixed pool of insured people—that is, BLS asks the insurance company for the price of health insurance for a set of workers (50-year-old smoker, 30-year-old married woman, etc.) for a fixed policy with a fixed structure of copayment, deductible, and out-of-pocket maximums. Thus, changes in the demographic composition of the population or the types of plans
offered will not result in changes in the cost of health insurance using the direct method.15
By contrast, as currently implemented, the indirect approach takes a unit value approach—it simply lumps together all health insurance policies and measures the ratio of retained earnings to benefits, regardless of whether these policies are for large employer-sponsored insurance, individual plans, plans sold on the ACA marketplace or in the small-group market, or Medicare Advantage Plans (in scope for services paid out of Medicare Part B, etc.). If different plans have different retained earnings ratios, then changes in the composition of plans will lead to changes in measured prices. For example, the ratio of retained earnings to premiums is higher for individual plans (around 20 percent) than for group plans (around 15 percent), so changes in the composition of the industry affect the growth rate of the health insurance CPI, which pools all plans (Cicala, Lieber, and Marone, 2019). To the extent different plans have different retained earnings ratios because they offer products with different levels of service (e.g., if individual plans are more expensive because, on average, they insure higher-risk people), the unit value approach may be biased.
Two additional problems are that the plans for which there are data are (1) not representative of the plans in scope for the CPI and (2) not weighted properly based on their weight in the CPI. The data used by BLS to calculate health insurance prices are based on insurance filings with state insurance commissioners. Self-insured employers (employers that pay for medical costs directly, even if they hire an insurance company to manage their health plan) are not subject to state insurance regulation and do not post information with insurance commissioners. However, they are in scope for the CPI, in that the premiums and out-of-pocket costs of workers with insurance from a self-insured employer are counted in the medical expenditure weight in the CPI. About two-thirds of workers with employer-sponsored insurance are in self-insured plans, so this is a significant omission (Kaiser Family Foundation, 2020a).16 Because employers with self-insured plans pay the medical expenses of their employees directly, there is no way in which a survey can capture “retained earnings.” However, because workers in self-insured plans are almost all working for large employers (because large employers are much more likely to self-insure and because they employ many more workers), retained earnings from large employers’ commercial health insurance plans could be useful as a proxy.
___________________
15 Some important changes are not well accounted for, however, including changes in the choice of health care providers who are in network.
16 Companies that act as a servicer for self-employed plans are likely in the PPI, although their weight is likely to be very low because their revenues will not include any costs of medical care.
An additional problem is that the CPI weights reflect the costs of health insurance plans covered by individuals’ out-of-pocket costs—this includes the entire cost of the policy when it is purchased on the individual market, the after-subsidy cost to households who get their health insurance through the ACA exchanges, and the employee’s share of the policy when it is purchased in the employer’s market.17 The current method simply lumps together all of the sold policies, regardless of their weight in the CPI. If retained earnings ratios vary systematically with the type of plan purchased, this will distort the CPI.
Timeliness
One disadvantage of the indirect method is that retained earnings are only measurable after the fact. That is, when an insurance company sells a policy, the company does not know what its retained earnings (premiums less benefits) will turn out to be. Furthermore, because of data constraints, the data for the ratio of retained earnings to benefits are calculated with a long lag. In particular, much of the retained earnings data come from the National Association of Insurance Commissioners (NAIC) Statistical Compilation of Annual Statement Information for Health Insurance Companies, which is usually published in October or November of the year following the year in reference. For example, aggregate retained earnings for the year 2020 would not be published by NAIC until October or November of 2021.
As noted above, BLS brings the changes in the measured price of health insurance gradually—by taking the 12th root of the annual change in the ratio of retained earnings to benefits.18 Thus, it takes another year before the full cost of health insurance is included in the level of the CPI—making it a very lagged indicator. The majority of people with insurance have plans that start in January. For example, 74 percent of people with employer-provided insurance have plans that start in January, and premiums change
___________________
17 An additional complication is the tax treatment of health insurance. Most workers who pay a part of their health insurance premium do so through a tax-preferred vehicle, so that the true out-of-pocket cost is lower than the cost of the premium. The CPI does not typically account for tax subsidies—for example, it does not lower the share of housing in the consumption basket because of its favorable tax treatment. But because people getting their health insurance through the ACA exchanges pay a “premium” that is really a market-based premium less a tax subsidy, the weight in the consumption basket will reflect spending after taxes, whereas the weight for premiums paid for employer-sponsored insurance will be a pretax weight, thus overweighting that component.
18 If the ratio of retained earnings to benefits increases six percent from one year to the next, the BLS assumes that prices rise roughly 0.5 percent per month—so that by the end of the year, the total increase in price will be six percent. But policy increases happen at the beginning of the policy year and all at once, so this method somewhat understates the level of prices.
for ACA and Medicare Advantage plans in January as well (Kaiser Family Foundation, 2020b). Thus, price increases occur in January for most people. However, because of the nine- to 10-month lag in the information on retained earnings, and the 12 months it takes for the prices to be fully incorporated, there is a 21- to 22-month gap between the actual price change and when it is fully reflected in the CPI.
Rebates
The ACA included a provision that limits the amount of premium income that insurers can keep. If the Medical Loss Ratio (ratio of benefit payments to premiums) is less than 80 or 85 percent (depending on the market) over a three-year period, the insurance company has to rebate the difference to the policy holders in the third year (for example, rebates paid in 2021 are calculated using insurers’ financial data from 2018 to 2020; the policy holders in 2020 receive the rebates using that calculation).
Rebates clearly lower the price of health insurance, and policy holders may expect rebates, so rebates may even lower the price of health insurance consumers perceive when they buy it. Thus, it seems that rebates should be deducted from the cost of the policy after the fact. The direct method used by the PPI does subtract rebates from the cost of the policy, but it subtracts them in the year they are paid, rather than the year in which they were “earned” (for example, rebates paid in 2021 are subtracted from 2021 health policy prices, rather than those in 2020). Currently, the CPI does not include any rebates—the retained earnings used in the calculation are pre-rebate. The data on rebates used in the PPI should be used to adjust retained earnings in the CPI.
Falling Response Rates
As discussed above, survey response rates from health providers have been falling in recent years, making the prices on which the indirect method relies increasingly variable and possibly unrepresentative. An alternative source of data that might in the near future prove useful in countering this deterioration of information stems from recent federal efforts to improve transparency in the health care sector. One such initiative is the Hospital Price Transparency rule, which requires hospitals to display files on their websites containing payer-specific negotiated charges and cash prices for at least 300 of their services. To date, compliance with this requirement has been extremely low.19 However, in a bid to improve compliance, the Biden
___________________
19 Documentation of this point can be found here: https://healthcareexecintelligence.healthitanalytics.com/news/hospitals-fall-short-of-price-transparency-rule-compliance.
Administration sharply increased the penalty for noncompliance, with the higher penalties beginning on January 1, 2022.20 The Health Plan Price Transparency Initiative similarly requires insurers to post prices for a wide variety of medical goods and services; that requirement begins on July 1, 2022. If successful, both of these initiatives could provide a readily available, low-cost source of price information for medical services.
In addition, BLS has been exploring the use of claims data in order to capture prices. That work, though preliminary, shows promise, especially for pricing physician services.
5.3. OPPORTUNITIES AND CHALLENGES
For the medical care component of the CPI, the most immediate methodological decision facing BLS is whether to continue pricing insurance using the indirect (retained earnings) method or begin migrating to a direct pricing approach. As discussed above, neither the direct nor the indirect method is conceptually ideal. The advantages of the direct method over the indirect method include the fact that the direct method reflects the price of insurance that consumers face at the time of purchase, that it is timelier, and that it will capture cost savings arising from shifts in the form of medical care—e.g., from an inpatient hospital to outpatient. However, a major downside of the direct method is that, without corrections, it will mislabel increases in utilization—either reflecting increased usage of existing medical treatments or of newly introduced treatments—as changes in prices rather than quantities; the indirect method will not count increased utilization as a price increase. Given that increased utilization has been an important source of increased health spending over time, this deficiency seems important enough to give the advantage to the indirect method.
In addition, if the ultimate goal is to fully quality adjust changes in health care over time, it would be impossible to do that without “getting under the hood” of the health insurance package and pricing (and quality adjusting) the underlying medical services separately from the health insurance services, which only the indirect method does.
Recommendation 5.1: The indirect method has practical advantages and therefore should, in the short to medium run, continue to be the method for pricing health insurance in the CPI.
The above recommendation notwithstanding, the panel recognizes that falling response rates are making reliance on the indirect method increasingly
___________________
20www.cms.gov/newsroom/press-releases/cms-oppsasc-final-rule-increases-price-transparency-patient-safety-and-access-quality-care.
difficult. Furthermore, the panel was unable to compare the differences between the indirect and direct methods empirically. Thus, this choice needs ongoing attention.
Recommendation 5.2: BLS should explore the historical differences between the indirect and direct methods doing a true apples-to-apples comparison. A “whole health insurance price deflator” that is a weighted average between the CPI’s current health insurance deflator and the various deflators for the medical services financed by insurance should be calculated and compared to the deflator used in the direct approach. If this research reveals that the two approaches do not differ greatly historically (particularly after our recommended improvements to the indirect method, discussed below), BLS could revisit its reliance on the indirect method.
Initially, work on the direct pricing of health insurance would be conducted as a research series (as opposed to a published series). Researchers should have access to working papers on the topic.
Recommendation 5.3: BLS should publish the whole health insurance price (the weighted average of the health insurance deflator and the medical services deflator)—either in addition to or perhaps instead of the insurance component separately. The volatility shown in the insurance services component of the total health insurance price index has been a source of concern for users.
We show in Appendix 5A that part of this volatility may reflect unanticipated price changes that do not affect the total health insurance price index but move the price of insurance services and medical services in opposite directions. Furthermore, there is a great deal of confusion about what the health insurance services component of the CPI is capturing, with many people believing it is the “whole health insurance premium”—like the PPI—instead of just the health insurance services component. This is particularly problematic given the differences between what is being priced in the PPI for health insurers and the CPI for health insurance. Publishing the whole health insurance premium index will provide useful information to users and will serve to clear up confusion among users.
Recommendation 5.4: BLS should consider a number of potential improvements to the indirect approach. To better capture what the consumers actually pay for insurance, and which does not depend on utilization rates, BLS should explore using a multiyear rolling average of retained earnings per unit of health services (where retained earnings
equal premiums, less medical expenses), rather than an annual value. This approach will mean that actual changes in the cost of health insurance—stemming from changes in regulation, market structure, or technology—will show up more slowly in the CPI. But these could be worth it to solve the problem of excess volatility.
Such a method is used by the Bureau of Economic Analysis (BEA) and indeed in the national accounts of most countries for property and casualty insurance. In particular, the price of these insurance services is approximated by a geometrically weighted moving average of past ratios of retained earnings to benefits. The weight on the most recent year is 0.3, the weight of the preceding year is (0.3) × (0.7), and so on (Chen and Fixler, 2003). BLS should assess the effects of such a change on the volatility of both the pure insurance services component of the index and the whole health insurance index that includes the medical components.
Ideally, information on retained earnings should be obtained by type of health insurance plan, instead of using a unit value approach. To the extent that different types of plans have different retained earnings ratios because of the costs to the insurer of covering them, changes in the composition of the insured should not be captured as a price change.
Recommendation 5.5: BLS should conduct research into pricing different plan types separately, and then weighting the price changes by the out-of-pocket payments for each. In addition, the current approach completely omits the price of health insurance provided by self-insured employers, even though costs borne by the employees of these firms is included in out-of-pocket spending. Because most self-insured plans are very large employers, BLS should impute prices for these plans using the retained earnings of large commercial plans.
Also, currently, there is a very long lag between the time the actual prices of health insurance change and their incorporation into the CPI. Shortening this lag would improve the accuracy and timeliness of the index.
Recommendation 5.6: For the purpose of tracking changes in health insurance prices, BLS should consider migrating from using annual data on profits net of premiums to quarterly data. This would allow changes in retained earnings to be incorporated more quickly. The use of multiyear rolling averages (Recommendation 5.4) would help smooth out any noise in the quarterly patterns of retained earnings.
A first step in this work is to test the performance of estimates based on disaggregated financial statement data against those based on the lagged
annual compendium published around October or November of the following year.
BLS should also consider changing the medical prices used in the health insurance services part of the health insurance deflator to match the timing of the retained earnings. That is, if the change in the ratio of retained earnings to benefits is lagged, the medical price changes used in the health insurance calculation should be equally lagged. (See the analysis in Appendix 5A.) In this way, the deflator would represent (lagged) health insurance services per unit of real medical expenditures. Alternatively, BLS could consider changing its conception of health insurance services as simply the price for the insurance component of the health care policy. That would just be the changes in retained earnings per policy over time, rather than dividing by the quantity of health services. This would bridge some of the gap between the direct method and the indirect method.
BLS should also account for the effects of rebates on the price of health insurance. The ACA requires that plans provide rebates to beneficiaries if their average medical loss ratio (basically the ratio of medical benefits to premiums) over a three-year period is less than 80 or 85 percent, depending on the plan. The rebate is provided to people who were policy holders in the third year of that three-year average. Under the current methodology, that rebate is ignored in the CPI.
Recommendation 5.7: In estimating the price of health insurance, the BLS should subtract rebate payments from retained earnings.
Even the direct method, which is an ex-ante measure, includes rebates, even though they change the price of health insurance ex-post. But because the average rebate is positive (the rebate is one-sided—it is either zero or positive), consumers may expect rebates when they purchase insurance and so subtracting rebates may be reasonable even with an ex-ante perspective. And because the indirect method is already an ex-post measure of health insurance costs, it seems clear that the measure of retained earnings used in the calculation should be after subtracting rebates. BEA has bought information on rebates that should be accessible by BLS as well.
Recommendation 5.8: As the data ecosystem continues to evolve, research by BLS should continue evaluating how to accelerate incorporation of claims data, hospital data, health plan data, and scanner data on drugs to improve the coverage, detail, and timeliness of price and quantity information in the medical care component of the CPI. Given the large cost in both time and money associated with using claims data, BLS should combine the efforts of those producing PPIs with those
producing CPIs. In addition, there should be collaboration between the CPI and PPI on adjusting health care prices for quality change.
A pilot program is currently under way at BLS indicating promising uses of claims data. A first study from the program used data from a single insurance company in a single market (Bieler et al., 2019).21 Building from this work, BLS is expanding the pilot study using a national claims database covering all CPI areas. The research includes multiple insurance companies, and the results look promising for pricing physician services and outpatient hospitals. The next steps will involve evaluating the possibility of using these claims data as a replacement for manually collected private insurance quotes, determined at the regional level. This will likely involve developing and refining a methodology for blending the new and traditional data.
Indeed, even though BLS research has shown that claims data are not representative, the agency has been revisiting use of this source in large part because of declining respondent cooperation. The pilot study was created in part to test blending the new data with the survey-collected data that did not need to rely on a participant company.
Recommendation 5.9: BLS should investigate the use of prices that hospitals and insurers post on their websites to comply with transparency requirements. If hospital compliance improves, and if the insurer initiative is successful, these could be useful sources of data on prices of medical goods and services.
Another motivation for acquiring and developing agility using claims data is that these data are crucial for constructing disease-based price indexes that can eventually be used to quality adjust health care prices. As noted in much of the literature on health care quality, the only way to properly account for the changing quality of health care is by tracking outcomes, and a first necessary step in such an endeavor is to track nominal spending by disease, which can then be deflated by an index that accounts for changes in outcomes from treatments for that disease over time. Of course, accounting for changes in outcomes over time is fraught with conceptual and data challenges. But there have been some major advances in recent years (e.g., Cutler et al., 2020; Dauda, Dunn, and Hall, 2020), and it is possible that these types of quality adjustments might be feasible in the future.
___________________
21Bieler et al. (2019) reported on BLS work testing the potential of insurance claims data to supplement manual price collection in the CPI medical indexes. The authors constructed price indexes using “data purchased from an insurance company for a large city and compare them to the CPI medical indexes for that city” with the aim of assessing their feasibility for use on a larger scale.
BEA has led the way with development of satellite health accounts but, as discussed above, the measurement objective of the CPI (tracking prices faced by consumers) differs from that of the national accounts.22 BLS also has undertaken important initiatives. BLS has created experimental disease-based prices that bundle medical care inputs by treatments for specific diseases or conditions.23 In addition, BLS has produced experimental indexes at the International Classification of Diseases (ICD) chapter level with monthly updates since 2016. In 2020, BLS began producing experimental indexes at the subchapter level for common diagnoses (114 conditions). Conceptual issues aside, data demands make it unlikely these methods will be brought into the production of the CPI any time soon. The primary data source for the BEA and BLS disease-based price indexes is the Medical Expenditure Panel Survey, which is not timely and has a relatively small sample size particularly for calculating price indexes for less common medical conditions. To address these deficiencies, BLS must acquire and research integration of claims data for this use.
___________________
22 For more information on satellite accounts, see https://www.bea.gov/news/blog/2015-0122/introducing-new-bea-health-care-satellite-account.
23 Although BLS calls these experimental indexes “prices,” they are better understood as a measure of spending by disease that shifts over time because of higher prices and changing quality.
APPENDIX 5A: COMPARISON OF INDIRECT AND DIRECT METHODS OF PRICING HEALTH INSURANCE
Indirect Method Conceptual Framework
The indirect method decomposes the health insurance premium into two types of goods and services: the services provided by health care providers, and the services provided by the insurance company, which include risk bearing, cost management, price negotiation, claims processing, utilization review, etc.
| HI Premium = HI Services + Medical Benefits | (eqn. 5.1) |
Each of these pieces, in turn, has a price component (P) and a quantity component (Q):
| HI Premium = PHIQHI + PMQM, | (5.2) |
where HI denotes the services provided by health insurers, and M denoted medical services.
Implicitly, BLS’s methodology assumes that the quantity of health insurance services is equal to the quantity of medical services:
| QHI = QM | (5.3) |
Therefore,
| HI Premium = (PHI + PM)QM. | (5.4) |
The interpretation of this formulation is as follows: For every medical service someone purchases through health insurance, they pay a price for the health insurance services provided and a price for the medical services.24
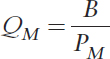
From above, HI Services are equal to the HI Premium, Prem, less the Medical Benefits. This is the definition of retained earnings (RE)—the part of the premium that the health insurance company does not pay out in medical benefits.
___________________
24 As we discuss in the text, the assumption that the quantity of health insurance services is equal to the quantity of medical services might be reasonable for some types of services (e.g., claims processing), but may not appropriately capture the value of the financial risk protection associated with health insurance (e.g., health insurance provides valuable financial protection even if one never purchases any medical services, just as fire insurance is valuable even if a consumer does not experience a fire).
Next, call the Medical Benefits B, where
| B = PMQM | (5.5) |
Then,
| HI Services = PHIQHI = PHIQM = Prem – B = RE | (5.6) |
And:
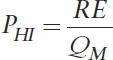 |
(5.7) |
The real quantity of medical benefits, QM, is calculated by deflating spending on Medical Benefits, B, by the medical price deflator:
 |
(5.8) |
Putting it all together yields the following:
 |
(5.9) |
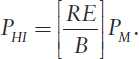
The price relative for health insurance would therefore be:
 |
(5.10) |
This price relative is only for the component of health insurance that reflects services provided by the health insurance company.
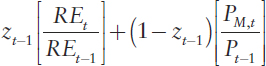
To compare the indirect method to the direct method, it is necessary to calculate the implied price index for the whole health insurance premium under the indirect method. Call the ratio of retained earnings to the health insurance premium z, where ![]() Then the price relative for the whole health insurance premium would be:25
Then the price relative for the whole health insurance premium would be:25
___________________
25 As a Laspeyres aggregation of the component relatives, this expression is an approximation of true premium inflation. The aggregation weights (share of retained earnings and the share of benefits spent on each type of medical service) are fixed at t-1 values so, if these weights change over the period, this approximation will differ from true premium inflation.
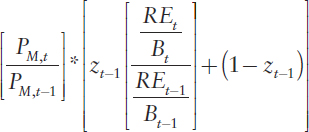 |
(5.11) |
This expression can be rewritten as follows:26
Price Relative for Whole Health Insurance Policy
That is, under the indirect method, the increase in the total cost of health insurance is equal to the increase in the premium cost per unit of health services.
Indirect Method Implementation
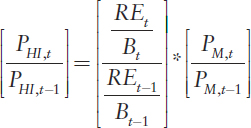
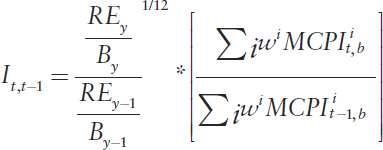
The HI Index in the monthly CPI is calculated as follows:
 |
(5.12) |
___________________
26 The algebra is as follows:
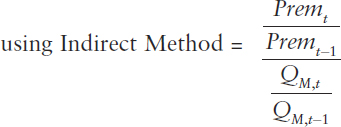
Where MCPIit,b is the medical care price index for medical service i in month t, wi is the share of insurance payments on service i, b is the base period and y is the year for which retained earnings are measured.
The second term is just the price relative for medical services from above, ![]() Thus, the only difference in the implementation of the framework from equation (5.1) is that retained earnings are measured annually, so the 12th root is taken, and because of data constraints, the data for the ratio of retained earnings to benefits are calculated with a lag. In particular, much of the retained earnings data come from the National Association of Insurance Commissioners Statistical Compilation of Annual Statement Information for Health Insurance Companies, which tends to be published in October or November of the year following the year in reference. For example, aggregate retained earnings for 2020 would not be published by NAIC until October or November of 2021.
Thus, the only difference in the implementation of the framework from equation (5.1) is that retained earnings are measured annually, so the 12th root is taken, and because of data constraints, the data for the ratio of retained earnings to benefits are calculated with a lag. In particular, much of the retained earnings data come from the National Association of Insurance Commissioners Statistical Compilation of Annual Statement Information for Health Insurance Companies, which tends to be published in October or November of the year following the year in reference. For example, aggregate retained earnings for 2020 would not be published by NAIC until October or November of 2021.
As we note in the text, this makes the interpretation of the HI index somewhat more difficult, because it is no longer exactly retained earnings per quantity of benefits (since the benefits from period y are being deflated by prices from month t).
Comparison with Direct Method
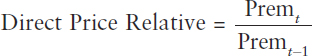
The price index for the direct method for a given type of insurance policy is:
 |
(5.13)27 |
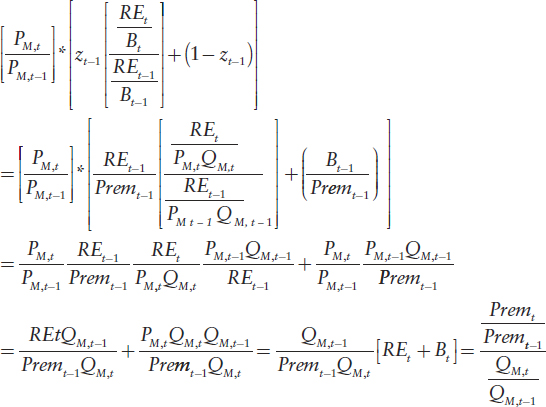
Calling the indirect price relative for the whole health insurance policy Ind and the direct price relative D—and abstracting from the fact that the indirect method does not measure the change in retained earnings on a policy-by-policy basis, and instead uses a unit cost method—one can see that:
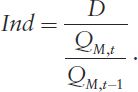 |
(5.14) |
Apart from the differences in timing due to data constraints discussed above, the indirect method price relative is equal to the direct method price relative
___________________
27 Ideally, the direct method would hold expected utilization constant, so that the indirect and direct method would be conceptually quite similar. And, as noted earlier, BLS makes some effort to adjust the premium when large changes in technology are introduced but does not adjust for the small continuous changes that occur in health care. We ignore the BLS quality adjustments for large technological changes in this exposition.
divided by the growth rate of real medical services provided through that policy. If the price of a health insurance policy increases 10 percent, and utilization also increases 10 percent, the direct method would show a price increase of 10 percent, whereas the indirect method would show no price increase at all.
Considering Uncertainty
As discussed in the text above, the two methods will produce different results depending on whether changes in prices and quantities are expected or unexpected, because that will determine whether they are incorporated by insurance companies when setting premiums.
Expected price changes: Expected price changes for medical care services increase the premium, thus boosting both direct and indirect method prices.
Unexpected price changes: Unexpected price changes for medical care services typically do not affect premiums or utilization very much.28 Thus, they have no effect on either the indirect or direct method prices for the whole insurance policy. Note, however, that unexpected increases in price will lower the health insurance component of the whole health insurance policy using the indirect method (because they lower retained earnings), but that will be offset by an increase in the medical care component. In practice, this may not occur right away due to the timing mismatch between the retained earnings and price adjustments. Moreover, changes in one direction in a year may be offset the following year by change in the opposite direction if health insurers respond to the prior period’s unexpected change in retained earnings. These unexpected price changes may be a reason that the health insurance component appears so volatile while the whole health insurance policy deflator is not.
Expected increases in utilization: Expected increases in utilization, unless captured in the quality adjustment, will boost premiums and, in turn, the deflator used in the direct pricing method. However, because the indirect captures changes in the premium per unit of real health services, expected increases in utilization will not affect the whole health insurance policy deflator using the indirect method.
Unexpected increases in utilization: Unexpected increases in utilization will not affect premiums, and so will have no effect on the deflator using the direct method. However, because premiums do not increase but utilization does, this will appear as a reduction in indirect method prices.
___________________
28 Small effects could be observed since, although patients may not have much exposure to the full price, they have some and demand is not perfectly inelastic.
APPENDIX 5B: AN ALTERNATIVE FORMULATION OF THE INDIRECT METHOD
As noted in Appendix 5A, the current indirect method assesses the price of health insurance as the costs per unit of real health goods and services. That is, spending on health insurance services = PHIQM, where PHI is the price of health insurance services and QM is equal to the real quantity of medical goods and services paid for by a policy. This assumption that the quantity of health insurance services is equal to the quantity of medical services might be reasonable for some types of services (e.g., claims processing), but may not appropriately capture the value of the financial risk protection associated with health insurance (e.g., health insurance provides valuable financial protection even if a consumer never purchases any medical services, just as fire insurance is valuable even if the consumer does not have a fire).
Thus, an alternative is to consider the quantity of health insurance services as equal to one per policy. Then, when using the indirect method, the change in the price of health insurance services would simply be the change in retained earnings per policy.
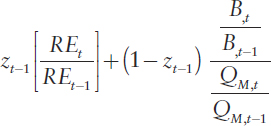
In particular, using the notation from Appendix 5A, this would then make the Alternative Price Relative for Whole Health Insurance Policy using the Indirect Method equal to:
 |
(eqn 5.1) |
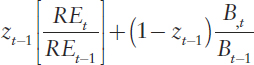
Or, alternatively, as:
 |
(5.2) |
Conceptually this is simple: If 20 percent of a health insurance policy pays for health insurance services, and 80 percent for medical services, then the deflator would put a 20 percent weight on the percent change in retained earnings per policy and an 80 percent weight on the change in the prices of medical services.
This formulation would partially bridge the gap between the indirect and the direct methods, as can be seen by comparing equation (5.2) with the formulation of the direct method:
Direct method:
 |
(5.3) |
The comparison between the two equations shows that under this alternative formulation, the pricing of the insurance component of the indirect method and the insurance component implicit in the direct method would be the same—they would both measure the changes in the cost of insurance services to each policy holder.
This page intentionally left blank.


