
7
Applications of the Dietary Reference Intakes for Energy
Dietary Reference Intakes (DRIs), including the Estimated Energy Requirement (EER), have primary applications in planning and assessing dietary intakes for both individuals and groups. The overarching goal is to achieve intakes that are adequate (i.e., that meet the requirement for a nutrient and thus prevent adverse effects of inadequacy) but not excessive (i.e., that have potential to lead to adverse effects of overconsumption). For energy, adequacy refers to the energy required to maintain an individual’s current level of physical activity and body weight and composition (or an appropriate rate of weight gain during growth and pregnancy)—this value for energy is what is predicted by the EER equations. Excessive intakes of energy would result in weight gain, and inadequate intakes of energy would result in weight loss. Weight gain or weight loss may be desirable in some cases, but EER prediction equations are not designed for those goals.
In this chapter, the committee examines appropriate uses of the calculated energy expenditure equations to predict EERs of the general population, including individuals and groups. It then discusses the use of body weight stability and status, rather than self-reported energy intake, to assess adequacy of energy intake. Finally, the updated EERs are compared to previous values from the IOM (2002/2005) report on DRIs for macronutrients and energy.
PLANNING ENERGY INTAKES
The objective of dietary planning is to establish a diet with low risk of inadequacy and of excess. As described in IOM (2003), for
most nutrients this is attained for individuals by planning a nutrient intake that meets the Recommended Dietary Allowance (RDA) for the individual’s age/sex group (and therefore, meets or exceeds the requirements of 97 to 98 percent of individuals in that age/sex group) and remains below the Tolerable Upper Intake Level (UL), a point at which the risk of an adverse health effect increases beyond an acceptable level. Thus, a safe range of intake exists between the RDA and the UL, a range that is quite broad for many nutrients. For groups, the goals of an acceptably low prevalence of inadequacy and of excess are met by planning the usual intake distribution such that it has an acceptably low proportion (e.g., 2–3 percent), with usual intakes below the Estimated Average Requirement (EAR) and a minimal proportion with usual intakes above the UL.
This approach is not appropriate for energy for several reasons. First, there is no safe range of intake because energy intakes outside of requirements lead to either weight gain or loss. Accordingly, energy has neither an RDA nor a UL, which are intake values. Rather, energy has an EER equation, which was developed to predict an appropriate energy intake. Identifying an RDA for energy would be infeasible. By definition, this value would exceed the requirements of 97 to 98 percent of individuals and would lead to weight gain in those individuals. Second, whereas intakes above an individual’s requirement do not lead to adverse effects (provided they are below the UL) for most other nutrients, this is not true for energy because intakes above the requirement would lead to weight gain. Third, unlike intake recommendations for most other nutrients—which apply to all individuals in an age/sex group (e.g., men aged 31–50 years)—the EER equations are specific for sex, age, height, weight, and physical activity level (PAL). Therefore, EERs for individuals within an age/sex group can vary considerably, and actual energy needs vary even among individuals of the same sex, age, height, weight, and PAL category (and thus the same EER), because some individuals will require considerably more energy than predicted by their EER and others will require less.
Therefore, planning for energy intakes of individuals and groups using the EER should be considered as a two-step process: (1) select the appropriate EER equation to use for the individual or group (this includes identifying the correct PAL category) and calculate the EER; and (2) monitor body weight over time and adjust energy intake as needed to maintain an appropriate body weight. Because a critical element in selecting the appropriate EER equation is identifying the correct PAL category, this step is described in the following section along with descriptions of the planning process for individuals and for groups.
Selecting the Appropriate Physical Activity Level Category
Perhaps the most challenging aspect of using the EER equations is selecting the appropriate PAL category, which must be done for individuals aged 3 years and above. PAL represents the ratio of total energy expenditure (TEE, as determined in doubly labeled water [DLW] studies) to measured or calculated basal energy expenditure (BEE) or resting energy expenditure (REE). As described in Chapter 5, the committee identified four PAL categories (inactive, low active, active, and very active) based on approximate quartiles of the PAL distributions among age groups of participants in DLW studies. Those with a PAL in the bottom quartile of the distribution for an age/sex group were identified as inactive, those with a PAL in the second quartile as low active, those in the third quartile as active, and those in the fourth quartile as very active. Separate equations to predict the EER were developed for each PAL category.
In this context, the four PAL categories reflect energy expenditure (kcal/d). The inactive category reflects a level of TEE covering basal metabolism, diet-induced thermogenesis (DIT), and a minimal level of physical activity required for activities of daily living. The low active, active, and very active categories reflect increasing levels of physical activity through occupational and recreational activities. Notably, the PAL categories do not correspond to the physical activity guidelines for health of Americans and Canadians (Canadian Society for Exercise Physiology, 2021; DHHS, 2018). Those guidelines recommend, for example, that adults obtain a minimum of 150 minutes of moderate-to-vigorous activity (e.g., brisk walking) or 75 minutes of vigorous activity (e.g., running) per week, as these activity levels are associated with health benefits. It is not possible to classify an individual’s PAL category, however, based on whether the person meets the recommended levels of physical activity.
Under ideal circumstances, evidence would be available to show strong associations between PAL as assessed in DLW studies and outputs from more readily available methods of assessing physical activity, such as steps (from a pedometer) or self-report measures based on physical activity questionnaires. As described in Chapter 6, some studies have detected statistically significant associations, but in many cases, the correlations at the individual levels are weak or, in some cases, not significant. At present, it appears that a valid, reliable tool does not exist to enable accurate classification of an individual’s PAL category.
Nonetheless, a descriptive analysis of daily activity patterns (Table 7-1) can provide guidance for classifying an individual’s PAL category. Of note is that individuals in the “inactive” PAL category are not completely sedentary but are minimally active beyond what is involved in daily living and do little or no occupational physical activity. The “low active”
TABLE 7-1 Example of Daily Activities Associated with Physical Activity Level (PAL) Categories in Adults
| Activities of daily living (ADL) for all activity levels | Inactive (PAL ~1.4) | Low active (PAL ~1.6) | Active (PAL ~1.75) | Very active (PAL ~2.05) |
|---|---|---|---|---|
| 30 minutes walking; plus ~90 minutes light to moderate activity (household tasks, vacuuming, raking the lawn, etc.) | ADL only | ADL + 60–80 minutes walking (3–4 mph) | ADL + 30–50 minutes walking (3–4 mph) + 45 minutes moderate cycling + 40 minutes doubles tennis | ADL + 45 minutes moderate cycling + ~25 minutes jogging (10 min/mile) + 60 minutes doubles tennis |
NOTE: ADL = activities of daily living; mph = miles per hour; PAL = physical activity level. Ranges for PAL categories: inactive: 1.0 ≤ PAL < 1.53; low active: 1.53 ≤ PAL < 1.68; active: 1.68 ≤ PAL < 1.85; very active: 1.85 ≤ PAL < 2.50.
SOURCE: Modified from Table 12-2, IOM, 2002/2005.
category involves an additional 60 to 80 minutes of moderate intensity activity (walking), and the “active” adds 30 to 50 minutes of moderate intensity activity (walking) and 85 minutes of vigorous activity (cycling and tennis). Finally, the “very active” category entails the addition of more than 2 hours of vigorous activity (cycling, jogging, and tennis). Other activities could be substituted for those shown; the intent of the example is to provide a general indication of the amount and intensity of activity associated with each PAL category.
The examples in Table 7-1 may be most appropriate for individuals in occupations that require little physical exertion or movement, such as office work. Additional guidance that incorporates occupational activity is available from the analysis by Black et al. (1996) of 574 DLW measurements of individuals aged 2 to 95 years. They used the robust data set to examine the relationship between lifestyle activity and PAL to summarize activity associated with different PAL categories as: 1.2 equates to chair-bound or bedbound; 1.4 equates to sitting without moving and with little or no strenuous leisure activity; 1.6 to 1.7 includes discretion to move but little or no strenuous leisure activity; 1.8 to 1.9 equates to standing with substantial movement (a factor of 0.3 is added for significant levels of strenuous leisure activity); and 2.0 to 2.4 equates to strenuous work or highly active leisure. The respective PAL categories for these estimated levels of activity are inactive (1.2–1.5), low active (1.6–1.7), active to very active (1.8–1.9), and very active (2.0–2.4).
A limitation of this data set is that job functions have changed over the past 30 to 40 years and therefore, the rankings may not be as relevant
to current occupations. Nonetheless, the data indicate that an occupation must involve substantial movement or strenuous recreational activity must be added to seated work to move an individual into the active or very active category.
The examples in Table 7-1 apply primarily to adults. Normative data for step counts are available for both Canadian and U.S. children (Craig et al., 2010; Tudor-Locke et al., 2009) and indicate that daily steps are higher in boys than in girls and decline with age between 6 and 18 years. The U.S. data would allow calculation of quartiles of step counts by age and sex, and if it were established that step counts in children were strongly associated with PAL as assessed by DLW, this could provide a method of identifying a PAL category. However, as is seen in adults, step counts were only weakly associated with PAL in children, particularly in girls, as shown in a study of Korean schoolchildren (Park et al., 2016). Accordingly, step data may not be optimal for assigning a PAL category.
In the IOM (2002/2005) report on energy, estimates were made of the amount of time a child would need to spend walking at 2.5 mph to move from the inactive PAL category to the low active, active, or very active categories. While not intended to suggest that children would walk for these amounts of time (very active children would likely be doing other activities of higher intensity for shorter periods of time), it indicated the volume of activity associated with various PAL categories. That approach was applied to the updated EERs for reference U.S. boys and girls aged 3 to 18 years (Tables 7-2 and 7-3).
Overall, although uncertainty is common when choosing a PAL category and by extension, when identifying the most appropriate EER equation for either a child or an adult, the planning process for energy intakes includes monitoring body weight and adjusting intake as needed.
Planning Energy Intakes of Individuals
Although EER equations are developed to meet the energy requirements for weight maintenance, the inherent individuality of energy requirements means that an energy intake equal to the calculated EER for an individual could result in weight maintenance (if the person’s energy requirement was close to the calculated EER), weight gain (if the person’s energy requirement was below the calculated EER), or weight loss (if the person’s energy requirement was above the calculated EER). Additional considerations are involved when planning energy intakes for the life stages of pregnancy and lactation and for other individuals whose energy requirements are not specifically addressed by the EER equations (including those seeking to lose or gain weight, as well as individuals with extremely high levels of physical activity). Additional considerations
TABLE 7-2 Minutes of Walking at 2.5 mph (4 km/h) to Move Between Physical Activity Level (PAL) Categories, Boys 3–18 Years
| Age (y) | Weight (kg)a | Difference in EER between activity categories (kcal/d)b | Energy cost to walk at 2.5 mph (kcal/kg/min)c | Walking time at 2.5 mph to move between PAL categories (min/d)d | ||||
|---|---|---|---|---|---|---|---|---|
| Low active to inactive | Active to inactive | Very active to inactive | Inactive to low active | Inactive to active | Inactive to very active | |||
| 3 | 15.5 | 142 | 138 | 167 | 0.092 | 100 | 97 | 117 |
| 4 | 17.8 | 130 | 152 | 205 | 0.089 | 82 | 96 | 129 |
| 5 | 20.5 | 119 | 170 | 249 | 0.087 | 67 | 95 | 140 |
| 6 | 22.5 | 109 | 182 | 282 | 0.084 | 58 | 96 | 149 |
| 7 | 26.2 | 100 | 207 | 340 | 0.082 | 47 | 96 | 158 |
| 8 | 29.5 | 98 | 228 | 386 | 0.079 | 42 | 98 | 166 |
| 9 | 31.8 | 95 | 244 | 421 | 0.077 | 39 | 100 | 172 |
| 10 | 38.7 | 123 | 293 | 501 | 0.074 | 43 | 102 | 175 |
| 11 | 44.6 | 133 | 333 | 578 | 0.072 | 41 | 104 | 180 |
| 12 | 46.4 | 122 | 345 | 609 | 0.069 | 38 | 108 | 190 |
| 13 | 55.4 | 144 | 407 | 723 | 0.067 | 39 | 110 | 195 |
| 14 | 59.9 | 148 | 438 | 784 | 0.064 | 39 | 114 | 205 |
| 15 | 66.1 | 180 | 482 | 852 | 0.062 | 44 | 118 | 208 |
| 16 | 66.8 | 186 | 488 | 860 | 0.059 | 47 | 124 | 218 |
| 17 | 72.1 | 213 | 525 | 918 | 0.057 | 52 | 128 | 223 |
| 18 | 71 | 202 | 517 | 908 | 0.054 | 53 | 135 | 237 |
NOTES: d = day; EER = estimated energy requirement; h = hour; kcal = kilocalorie; kg = kilogram; km = kilometer; min = minute; mph = miles per hour; y = year. See Chapter 5, Table 5-15 for EER equations.
a Reference weights from the National Health and Nutrition Examination Survey; (see Table 7-7).
b EERs for boys of reference height and weight for each PAL category are shown in Table 7-7. Differences are calculated by subtracting the EER for the inactive category from the EER for each of the other activity categories.
c Walking costs determined from treadmill testing (Puyau et al., 2002; Treuth et al., 1998, 2000, 2003).
d Calculated as: (Difference in EER between activity categories [kcal/d])/{(Energy cost to walk @ 2.5 mph [kcal/kg/min]) × (body wt [kg])}. For example, for an 18-year-old to move from inactive to low active, 53 minutes/day = 202 kcal/(0.054 kcal/kg/min × 71 kg).
SOURCE: Modified from Table 12-6 (IOM, 2002/2005).
TABLE 7-3 Minutes of Walking at 2.5 mph (4 km/h) to Move Between Physical Activity Level (PAL) Categories, Girls 3–18 Years
| Age (y) | Weight (kg)a | Difference in EER between activity categories (kcal/db | Energy cost to walk at 2.5 mph (kcal/kg/min)c | Walking time at 2.5 mph to move between PAL categories (min/d)d | ||||
|---|---|---|---|---|---|---|---|---|
| Low active to inactive | Active to inactive | Very active to inactive | Inactive to low active | Inactive to active | Inactive to very active | |||
| 3 | 14.9 | 33 | 95 | 142 | 0.095 | 23 | 67 | 100 |
| 4 | 17.7 | 59 | 123 | 208 | 0.091 | 37 | 76 | 129 |
| 5 | 19.7 | 87 | 151 | 276 | 0.088 | 50 | 87 | 159 |
| 6 | 22.4 | 112 | 178 | 340 | 0.085 | 59 | 93 | 179 |
| 7 | 25.7 | 124 | 197 | 374 | 0.081 | 60 | 95 | 180 |
| 8 | 28.3 | 144 | 220 | 426 | 0.078 | 65 | 100 | 193 |
| 9 | 33.4 | 161 | 249 | 477 | 0.074 | 65 | 101 | 193 |
| 10 | 39.5 | 172 | 276 | 516 | 0.071 | 61 | 98 | 184 |
| 11 | 43.6 | 200 | 310 | 589 | 0.068 | 67 | 105 | 199 |
| 12 | 52.1 | 194 | 331 | 598 | 0.064 | 58 | 99 | 179 |
| 13 | 52.2 | 209 | 343 | 631 | 0.061 | 66 | 108 | 198 |
| 14 | 59.5 | 207 | 364 | 645 | 0.058 | 60 | 105 | 187 |
| 15 | 58.1 | 206 | 359 | 638 | 0.054 | 66 | 114 | 203 |
| 16 | 61.8 | 204 | 368 | 643 | 0.051 | 65 | 117 | 204 |
| 17 | 65.1 | 199 | 375 | 641 | 0.047 | 65 | 123 | 209 |
| 18 | 62.7 | 204 | 371 | 646 | 0.044 | 74 | 134 | 234 |
NOTES: d = day; EER = estimated energy requirement; h = hour; kcal = kilocalorie; kg = kilogram; km = kilometer; min = minute; mph = miles per hour; y = year. See Chapter 5, Table 5-15 for EER equations.
a Reference weights from NHANES (see Table 7-8).
b EERs for girls of reference height and weight for each PAL category for are shown in Table 7-8. Differences are calculated by subtracting the EER for the inactive category from the EER for each of the other activity categories.
c Walking costs determined from treadmill testing (Puyau et al., 2002; Treuth et al., 1998, 2000, 2003).
d Calculated as: (Difference in EER between activity categories [kcal/d])/{(Energy cost to walk @ 2.5 mph [kcal/kg/min]) × (body wt [kg])}. For example, for an 18-year-old to move from inactive to low active, 74 minutes/day = 204 kcal/(0.044 kcal/kg/min × 62.7 kg).
SOURCE: Modified from Table 12-7 (IOM, 2002/2005).
of clinical situations (e.g., individuals with clinical conditions or using medications that may affect energy expenditure, or patients who are critically ill or postsurgery) are discussed in Chapter 8.
The following steps show the process for determining an EER for exemplar age/sex and life-stage groups.
Step 1. Select the EER equation and calculate the EER. The EER equations are summarized in Chapter 5 and organized by age/sex group and PAL category (see Table 5-15 for children and adolescents and Table 5-16 for adults). The EER for an individual is calculated by inserting the person’s age, height, and weight into the appropriate EER equation.
Nonpregnant, Nonlactating Women
For example, the EER for a 22-year-old woman who is 165 cm in height, weighs 63 kg, and is determined to have a low active PAL based on the guidance provided above is calculated as follows:
This calculated EER represents the average requirement of women with these values for age, height, weight, and PAL category. Like other nutrients, however, requirements for energy vary—even among individuals with the same age, height, weight, and PAL category. The extent of variability is indicated by the standard error of the predicted value (SEPV), provided for each EER equation in Table 5-8. The SEPV reflects how much an individual’s requirement may vary from the value predicted by the EER equation. Assuming that this variation is normally distributed (and based on characteristics of the normal distribution), this means that ~68 percent of individuals with given characteristics will have an energy requirement within 1 standard error of the value predicted by the EER equation, and almost everyone with those characteristics (~95 percent) would have energy requirements within 1.96 SEPV of the value predicted by the equation.
For women aged 19 years or more, the SEPV is 241 kcal/d. For the woman with an EER of 2,275 kcal/d in the above example, this means that ~68 percent of women with her characteristics would have an actual energy requirement between 2,034 and 2,516 kcal/d (the EER of 2,275 +/–241 kcal), and that 95 percent of women with those characteristics would have actual energy requirements between 1,803 and 2,747 kcal/d (the EER +/– [1.96 × 241]). Thus, it is possible that the woman in the example
would have an actual energy requirement reasonably close to the EER. It is also possible that her individual requirement could be considerably less than or more than the EER. For individuals whose energy requirements differ from the EER, providing energy intakes equal to the EER would lead to weight gain or loss over time.
Adolescent Male
The second example is a 15-year-old boy who is 170 cm in height, weighs 66 kg, and is determined to have an “active” PAL. His EER is calculated as follows:
Young Child
The third example is for a young child for whom PAL is not included in the equation. The EER for a 2-year-old boy who is 98 cm in height and weighs 15.5 kg, is calculated as follows:
Older Adult Female
The fourth example is for 70-year-old woman who is 157 cm in height, weighs 70 kg, and is determined to have an “inactive” PAL. Her EER is calculated as follows:
Step 2. Monitor body weight over time and adjust intake as required. Because an individual’s actual energy requirement may vary considerably from the EER, it is important to monitor body weight over time. If undesired weight gain or loss occurs, energy intake should be adjusted incrementally to maintain the desired weight. In the case of some individual dietary planning applications, using the EER equation to estimate an individual’s energy requirement may not be necessary. If the individual is maintaining body weight (or normal rate of growth) and desired level of physical activity, it can be assumed the usual energy intake meets requirements, and planning for other elements of the diet could proceed without identifying a specific energy intake.
Pregnant and Lactating Women
Planning energy intakes during pregnancy and lactation follows the same general procedures as described above, with additional considerations for these life stages reflected in the EER equations.
Step 1 for Pregnancy. Select the appropriate EER equation and calculate the EER. During the second and third trimesters of pregnancy, calculating the EER for pregnancy requires an individual’s current height, weight, age, PAL category, prepregnant body mass index (BMI), and the number of gestational weeks. During the first trimester (conception to 13 completed weeks) a woman’s EER is the same as her nonpregnant EER for a given PAL category; accordingly, the pregnancy equations are not used. This is because the embryo and placenta are forming through cell division and differentiation, which does not require extra calories (IOM and NRC, 2009).
During the second and third trimesters, the EER equation includes an increment for the deposition of new tissue necessary to support the products of conception (e.g., fetus, placenta, breast and uterus tissue growth, plasma volume expansion) (see Table 5-17). The increment varies depending on a woman’s prepregnant BMI (underweight, +300 kcal/d; normal weight, +200 kcal/d; overweight, +150 kcal/d; obese, –50 kcal/d). It is also possible that a woman’s PAL category may change as the pregnancy progresses. Thus, selecting the appropriate EER equation for pregnancy is based on current physical activity level, weight, age, height, and weeks of pregnancy, plus the appropriate extra calories per BMI category needed for energy deposition.
The IOM gestational weight gain recommendations apply to all women, regardless of age (IOM and NRC, 2009). In the case of women who become pregnant during adolescence, the age-appropriate and PAL-appropriate EER equation should be used for the first trimester and the
pregnancy equations for the second and third trimesters, according to the individual’s physical activity level. Additional calories for energy deposition are added according to the woman’s prepregnancy BMI (i.e., underweight, +300 kcal/d; normal weight, +200 kcal/d; overweight, +150 kcal/d; obese, –50 kcal/d). Two examples of how the EER would change during pregnancy are shown in Box 7-1; one for a woman with a prepregnant BMI in the normal range and one for a woman with a prepregnant BMI in the obese range. These examples also illustrate the differences between the new EER compared to the 2005 EER.
Step 2 for Pregnancy. Monitor body weight and rate of weight gain for the pregnant woman and adjust energy intake as required. During pregnancy, it is crucial that weight gain is monitored, and energy intake is adjusted as required to achieve the appropriate rate and amount of weight gain throughout pregnancy to avoid adverse outcomes for the mother and/or child (Goldstein et al., 2017).
Step 1 for Lactation. Select the appropriate EER equation and calculate the EER. To plan for energy intake during lactation, the EER equation for the appropriate PAL category for women aged 19 years and older is used (or for adolescents, the EER equation for girls), to which an increment is added (see Tables 5-18 and 5-19). The increments are based on the energy cost of producing milk and energy mobilized among women who are exclusively breastfeeding during the first 6 months of lactation (a net of 404 kcal/d for months 0 to 6 postpartum) and then partially breastfeeding beyond 6 months (380 kcal/d for months 7 to 12 postpartum), as described in Chapter 5. This additional energy cost assumes a gradual weight loss of 0.64 kg/month in the first 6 months postpartum. Box 7-2 shows examples of changes in EER for two women of different BMI status during the postpartum period.
Step 2 for Lactation: Monitor body weight and adjust energy intake as required. Because an individual’s actual energy requirement may vary considerably from the EER, it is important to monitor the rate of weight loss for the postpartum woman and adjust energy intake as required or desired to allow for quicker return to prepregnancy weight. As women resume work and leisure physical activity, energy expenditure may increase but this can be offset by decreased energy needs attributable to partial breastfeeding and the introduction of complementary foods to the infant over the course of the postpartum period. Evidence exists to support greater weight loss during the postpartum period without compromising the volume or quality of breast milk if no additional calories are consumed beyond the nonpregnant EER (Lovelady, 2011).
Individuals Seeking to Lose or Gain Weight
The EER equations reflect estimated requirements for weight maintenance (and normal growth, if applicable), irrespective of body weight status and do not predict energy requirements for those seeking to lose or gain weight. However, the equations can be used to identify energy intakes that would likely lead to weight gain or loss. By adding or subtracting 1.96 × SEPV (see Table 5-8) to (or from) the EER, energy intakes can be identified that would exceed or would be inadequate to maintain weight in almost all individuals with specified characteristics.
For example, consider a 45-year-old man with a low active PAL who is 1.75 m in height, weighs 100 kg, and wants to lose weight. His EER would be calculated as 3,041 kcal. The SEPV for men aged 19 years or older is 342 kcal. Thus, an energy intake of 3,041 – (1.96 × 342), or 2,371 kcal, would be predicted to lead to weight loss in almost all men with his characteristics. Conversely, for a man of the same age, height, and PAL category, but
who weighs 55 kg, EER would be calculated as 2,368 kcal. If he wanted to gain weight, an energy intake of 2,368 + (1.96 × 342), or 3,038 kcal, would be predicted to lead to weight gain in almost all men with his characteristics. These values might be used to identify starting points for weight change and would subsequently be modified as required to maintain an appropriate rate of weight loss or gain. While negative energy balance is a prerequisite for weight loss and positive energy balance is a prerequisite for weight gain, body weight management is a multifaceted process that includes many other aspects in addition to modifying energy intake (e.g., Wharton et al., 2020).
Individuals with Extremely High Physical Activity Levels
By definition, the EER equations do not predict energy requirements of those with a PAL greater than 2.5, and individuals undergoing strenuous physical activity for prolonged periods of time (e.g., elite athletes undergoing heavy training) often have PAL values in excess of this threshold (e.g., Westerterp, 2018). Accordingly, they would not meet their energy requirements if they consumed an energy intake equal to their calculated EER, even using the equations for those with a very active PAL.
Planning Energy Intakes of Groups
Planning energy intake levels for groups is challenging, as group members may vary considerably in terms of age, sex, body size, and physical activity level, and planners may or may not have access to the individual characteristics of group members. As with planning energy intakes for individuals, the process includes selecting the appropriate EER equation (or equations) to calculate EER, followed by monitoring body weight over time and adjusting the energy content of the food provided as required.
All Age/Sex Groups
Step 1. Select the EER equation, and calculate the EER. The EER equations can be used in the initial stage of planning for the energy intakes of groups, although the approach differs depending on whether the planner has access to complete data on the individual characteristics of all group members (i.e., sex, age, height, weight, and PAL category) and whether the members of the group are homogeneous in terms of sex, age grouping, and PAL category (i.e., whether all group members would use the same EER equation). An overview of how this could be accomplished in each situation is described in Table 7-4.
Tables 7-5 through 7-14 show EERs for Americans and Canadians of median height and weight, for their sex/age group. The first series of tables (Tables 7-5 to 7-10) present values for Americans by age group and by sex, and the second series (Tables 7-11 to 7-14) presents values for Canadians. Because many groups include members from all weight status categories (i.e., underweight, normal weight, overweight, and obese), these tables show EERs based on median heights and weights of the overall population. However, additional tables showing EERs calculated separately by weight category (i.e., based on median heights and weights of individuals who are underweight, normal weight, overweight, and obese) are provided in Appendix M for Americans and Canadians. These may be useful if the planner knows that most or all group members fall into a specific weight status category.
Data on reference heights and weights for Canadian children aged less than 3 years were not available. Based on similar heights and weights of U.S. and Canadian children at 3 years of age, however, it appears reasonable to apply the U.S. reference values to Canadian infants and toddlers aged less than 3 years.
The committee identified a number of limitations in the approach to planning energy intakes of groups (Table 7-4) with respect to the variability of energy requirements among group members. As for individuals, the EER will closely approximate the actual requirements of some group
TABLE 7-4 Application of the EER Equation to Plan Energy Intakes of Groups
| Complete data on age, sex, height, weight, and PAL category available to planner | Groups are similar in age grouping, sex, and PAL category | |
|---|---|---|
| Yes | No | |
| Yes | Example: Low active male prison inmates aged 19 years or older Use mean or median values for height, weight, and age of group members to calculate the mean or median EER for the group |
Example: Inactive older male and female adults living in a residential care facility (sex differs). Use mean or median values for height, weight, and age of men and women to calculate mean or median EERs for each sex separately Determine a weighted EER by using the proportions of men and women. For example, if 30% men and 70% women, weighted EER = (0.3 × male EER) + (0.7 × female EER) |
| No |
Example: Women aged ~30–50 (no data on individual age, height, and weight) participating in a 1-week yoga camp. Women will likely be “active” at the camp. Use EER for reference individual in this age/sex PAL group (see Table 7-10 or 7-14, which shows EERs for reference U.S. and Canadian women) |
Example: School lunch program for primary school boys and girls age 6–12 years Determine median age of group (e.g., 9 years) Choose a PAL category using any available information Use EERs for reference individuals of median age in selected PAL category (see Tables 7-7 and 7-8 for U.S. or Tables 7-11 and 7-12 for Canadian boys and girls) to calculate EERs for age/sex groups Determine a weighted EER using the proportions of boys and girls in the group |
NOTE: EER = estimated energy requirement; PAL = physical activity level.
members but will overestimate or underestimate the actual requirements of others. The implications will vary depending on whether individual group members can choose the amounts of food they receive (e.g., they can have larger or smaller portions of food items as desired), or whether there is no choice and everyone in the group receives an identical amount
TABLE 7-5 Estimated Energy Requirements (EER), U.S. Boys Aged 0–35 Months, Based on Median Length/Height and Weight by Age
| Age Group (mo)b | Median Length/Height and Weighta | EERc (kcal/d) | |||
|---|---|---|---|---|---|
| Length/Height (cm) | Length/Height (in) | Weight (kg) | Weight (lb) | ||
| Birth–2 | 56.5 | 22.2 | 5.0 | 11.0 | 566 |
| 3–5 | 64.4 | 25.4 | 7.2 | 15.8 | 589 |
| 6–8 | 69.5 | 27.4 | 8.9 | 19.5 | 675 |
| 9–11 | 73.0 | 28.7 | 9.4 | 20.8 | 745 |
| 12–14 | 76.4 | 30.1 | 10.4 | 22.9 | 821 |
| 15–17 | 79.2 | 31.2 | 11.1 | 24.4 | 881 |
| 18–20 | 82.6 | 32.5 | 11.8 | 26.1 | 952 |
| 21–23 | 86.4 | 34.0 | 12.3 | 27.1 | 1,027 |
| 24–26 | 87.9 | 34.6 | 12.6 | 27.7 | 1,058 |
| 27–29 | 91.4 | 36.0 | 13.7 | 30.2 | 1,136 |
| 30–32 | 93.3 | 36.7 | 14.6 | 32.1 | 1,183 |
| 33–35 | 94.9 | 37.4 | 14.7 | 32.5 | 1,213 |
NOTE: cm = centimeter; d = day; in = inch; lb = pound; kcal = kilocalorie; kg = kilogram; mo = month.
a For U.S. population, based on NHANES 2015–2018, estimated for age group.
b Age used to predict EER is based on specific age: birth–2 mo: 1 mo; 3–5 mo: 4 mo; 6–8 mo: 7 mo; 9–11 mo: 10 mo; 12–14 mo: 13 mo; 15–17 mo: 16 mo; 18–20 mo: 19 mo; 21–23 mo: 22 mo; 24–26 mo: 25 mo; 27–29 mo: 28 mo; 30–32 mo: 31 mo; 33–35 mo: 34 mo.
c Uses EER equations for boys, 0–2 years.
TABLE 7-6 Estimated Energy Requirements (EER), U.S. Girls Aged 0–35 Months, Based on Median Length/Height and Weight by Age
| Age Group (mo)b | Median Length/Height and Weighta | EERc (kcal/d) | |||
|---|---|---|---|---|---|
| Length/Heigh (cm) | Length/Height (in) | Weight (kg) | Weight (lb) | ||
| Birth–2 | 55.9 | 22.0 | 4.9 | 10.9 | 531 |
| 3–5 | 62.6 | 24.7 | 6.7 | 14.8 | 546 |
| 6–8 | 67.5 | 26.6 | 7.9 | 17.4 | 604 |
| 9–11 | 71.5 | 28.2 | 8.9 | 19.6 | 689 |
| 12–14 | 75.8 | 29.9 | 10.1 | 22.2 | 780 |
| 15–17 | 77.9 | 30.7 | 10.3 | 22.7 | 817 |
| 18–20 | 82.2 | 32.4 | 10.9 | 24.1 | 881 |
| 21–23 | 84.9 | 33.4 | 11.8 | 25.9 | 956 |
| 24–26 | 87.7 | 34.5 | 12.3 | 27.0 | 1,011 |
| 27–29 | 89.2 | 35.1 | 12.6 | 27.8 | 1,051 |
| 30–32 | 92.0 | 36.2 | 13.4 | 29.6 | 1,122 |
| 33–35 | 94.4 | 37.2 | 14.2 | 31.3 | 1,192 |
NOTE: cm = centimeter; d = day; in = inch; lb = pound; kcal = kilocalorie; kg = kilogram; mo = month.
a For U.S. population, based on NHANES 2015–2018, estimated for age group.
b Age used to predict EER is based on specific age: birth–2 mo: 1 mo; 3–5 mo: 4 mo; 6–8 mo: 7 mo; 9–11 mo: 10 mo; 12–14 mo: 13 mo; 15–17 mo: 16 mo; 18–20 mo: 19 mo; 21–23 mo: 22 mo; 24–26 mo: 25 mo; 27–29 mo: 28 mo; 30–32 mo: 31 mo; 33–35 mo: 34 mo.
c Uses EER equations for girls, 0–2 years.
TABLE 7-7 Estimated Energy Requirements (EER) for Overall Population, U.S. Boys Aged 3–18 years, Based on Median Height and Weight for Age and Physical Activity Level (PAL) Category
| Age (y)c | Median Height and Weighta | EER (kcal/d)b | ||||||
|---|---|---|---|---|---|---|---|---|
| Height (cm) | Height (in) | Weight (kg) | Weight (lb) | Inactive PAL | Low active PAL | Active PAL | Very active PAL | |
| 3 | 99.2 | 39.1 | 15.5 | 34.1 | 1,078 | 1,220 | 1,216 | 1,245 |
| 4 | 105.4 | 41.5 | 17.8 | 39.2 | 1,188 | 1,318 | 1,340 | 1,393 |
| 5 | 112.4 | 44.3 | 20.5 | 45.1 | 1,318 | 1,437 | 1,488 | 1,567 |
| 6 | 118.0 | 46.5 | 22.5 | 49.5 | 1,421 | 1,530 | 1,603 | 1,703 |
| 7 | 126.1 | 49.6 | 26.2 | 57.6 | 1,578 | 1,678 | 1,785 | 1,918 |
| 8 | 131.8 | 51.9 | 29.5 | 64.9 | 1,700 | 1,798 | 1,928 | 2,086 |
| 9 | 136.4 | 53.7 | 31.8 | 70.0 | 1,803 | 1,898 | 2,047 | 2,224 |
| 10 | 141.1 | 55.6 | 38.7 | 85.1 | 1,959 | 2,082 | 2,252 | 2,460 |
| 11 | 148.3 | 58.4 | 44.6 | 98.1 | 2,134 | 2,267 | 2,467 | 2,712 |
| 12 | 153.9 | 60.6 | 46.4 | 102.1 | 2,234 | 2,356 | 2,579 | 2,843 |
| 13 | 163.6 | 64.4 | 55.4 | 121.9 | 2,482 | 2,626 | 2,889 | 3,205 |
| 14 | 170.0 | 66.9 | 59.9 | 131.8 | 2,623 | 2,771 | 3,061 | 3,407 |
| 15 | 172.7 | 68.0 | 66.1 | 145.4 | 2,744 | 2,924 | 3,226 | 3,596 |
| 16 | 172.6 | 68.0 | 66.8 | 147.0 | 2,755 | 2,941 | 3,243 | 3,615 |
| 17 | 174.9 | 68.9 | 72.1 | 158.6 | 2,859 | 3,072 | 3,384 | 3,777 |
| 18 | 175.5 | 69.1 | 71.0 | 156.2 | 2,856 | 3,058 | 3,373 | 3,764 |
NOTE: cm = centimeter; d = day; in = inch; lb = pound; kcal = kilocalorie; kg = kilogram; y = year.
a For U.S. population, based on NHANES 2015–2018, estimated for each age by year.
b Uses EER equations for boys, 3–18 years
c For ages 3–8 years: inactive: 1.0 ≤ PAL < 1.31; low active: 1.31 ≤ PAL < 1.44; active: 1.44 ≤ PAL < 1.59; very active: 1.59 ≤ PAL < 2.5. For ages 9–13 years: inactive: 1.0 ≤ PAL < 1.44; low active: 1.44 ≤ PAL < 1.60; active: 1.60 ≤ PAL < 1.77; very active: 1.77 ≤ PAL < 2.5. For ages 14–18 years: inactive: 1.0 ≤ PAL < 1.57; low active: 1.57 ≤ PAL < 1.74; active: 1.74 ≤ PAL < 1.94; very active: 1.94 ≤ PAL < 2.5.
TABLE 7-8 Estimated Energy Requirements (EER) for Overall Population, U.S. Girls Aged 3–18 years, Based on Median Height and Weight for Age and Physical Activity Level (PAL) Category
| Age (y)c | Median Height and Weighta | EER (kcal/d)b | ||||||
|---|---|---|---|---|---|---|---|---|
| Height (cm) | Height (in) | Weight (kg) | Weight (lb) | Inactive PAL | Low Active PAL | Active PAL | Very Active PAL | |
| 3 | 96.9 | 38.1 | 14.9 | 32.8 | 1,075 | 1,108 | 1,170 | 1,217 |
| 4 | 104.6 | 41.2 | 17.7 | 38.9 | 1,166 | 1,225 | 1,289 | 1,374 |
| 5 | 112.1 | 44.1 | 19.7 | 43.3 | 1,241 | 1,328 | 1,392 | 1,517 |
| 6 | 119.3 | 47.0 | 22.4 | 49.3 | 1,325 | 1,437 | 1,503 | 1,665 |
| 7 | 123.7 | 48.7 | 25.7 | 56.5 | 1,396 | 1,520 | 1,593 | 1,770 |
| 8 | 129.8 | 51.1 | 28.3 | 62.3 | 1,470 | 1,614 | 1,690 | 1,896 |
| 9 | 136.5 | 53.7 | 33.4 | 73.5 | 1,606 | 1,767 | 1,855 | 2,083 |
| 10 | 142.3 | 56.0 | 39.5 | 86.9 | 1,737 | 1,909 | 2,013 | 2,253 |
| 11 | 150.8 | 59.4 | 43.6 | 95.9 | 1,856 | 2,056 | 2,166 | 2,445 |
| 12 | 154.3 | 60.7 | 52.1 | 114.6 | 2,009 | 2,203 | 2,340 | 2,607 |
| 13 | 157.7 | 62.1 | 52.2 | 114.8 | 2,017 | 2,226 | 2,360 | 2,648 |
| 14 | 161.2 | 63.5 | 59.5 | 130.9 | 2,139 | 2,346 | 2,503 | 2,784 |
| 15 | 160.0 | 63.0 | 58.1 | 127.8 | 2,082 | 2,288 | 2,441 | 2,720 |
| 16 | 161.7 | 63.7 | 61.8 | 136.0 | 2,138 | 2,342 | 2,506 | 2,781 |
| 17 | 162.4 | 63.9 | 65.1 | 143.2 | 2,178 | 2,377 | 2,553 | 2,819 |
| 18 | 162.3 | 63.9 | 62.7 | 137.9 | 2,114 | 2,318 | 2,485 | 2,760 |
NOTE: cm = centimeter; d = day; in = inch; lb = pound; kcal = kilocalorie; kg = kilogram; y = year.
a For U.S. population, based on NHANES 2015–2018, estimated for each age by year.
b Uses EER equations for girls, 3–18 years.
c For ages 3–8 years: Inactive: 1.0 ≤ PAL < 1.31; low active: 1.31 ≤ PAL < 1.44; active: 1.44 ≤ PAL < 1.59; very active: 1.59 ≤ PAL < 2.5. For ages 9–13 years: inactive: 1.0 ≤ PAL < 1.44; low active: 1.44 ≤ PAL < 1.60; active: 1.60 ≤ PAL < 1.77; very active: 1.77 ≤ PAL < 2.5. For ages 14–18 years: inactive: 1.0 ≤ PAL < 1.57; low active: 1.57 ≤ PAL < 1.74; active: 1.74 ≤ PAL < 1.94; very active: 1.94 ≤ PAL < 2.5.
TABLE 7-9 Estimated Energy Requirements (EER) for Overall Population, Adult U.S. Men, Based on Median Height and Weight for Age Group
| Age Groupc (y) | Median Height and Weighta | EER (kcal/d)b | ||||||
|---|---|---|---|---|---|---|---|---|
| Height (cm) | Height (in) | Weight (kg) | Weight (lb) | Inactive PALd | Low active PAL | Active PAL | Very active PAL | |
| Overall | ||||||||
| 19–30 | 176.1 | 69.3 | 81.4 | 179.1 | 2,775 | 2,988 | 3,177 | 3,516 |
| 31–50 | 176.3 | 69.4 | 89.9 | 197.8 | 2,733 | 2,955 | 3,151 | 3,519 |
| 51–70 | 174.9 | 68.9 | 88.7 | 195.1 | 2,491 | 2,709 | 2,907 | 3,258 |
| > 70 | 172.2 | 67.8 | 83.3 | 183.3 | 2,181 | 2,389 | 2,586 | 2,896 |
| 19+ | 175.4 | 69.1 | 87.2 | 191.8 | 2,581 | 2,799 | 2,994 | 3,345 |
NOTE: cm = centimeter; d = day; in = inch; lb = pound; kcal = kilocalorie; kg = kilogram; PAL = physical activity level; y = year.
a For U.S. population, based on NHANES 2015–2018, estimated for age group.
b Uses EER equations for adult men.
c Age used to predict EER is based on specific age: 19–30 y: 25 y; 31–50 y: 40 y; 51–70 y: 60 y; > 70 y: 80 y; 19 y or older: 50 y.
d Inactive: 1.0 ≤ PAL < 1.53; low active: 1.53 ≤ PAL < 1.69; active: 1.69 ≤ PAL < 1.85; very active: 1.85 ≤ PAL < 2.5.
TABLE 7-10 Estimated Energy Requirements (EER) for Overall Population, Adult U.S. Women, Based on Median Height and Weight for Age Group
| Age Groupc (y) | Median Height and Weighta | EER (kcal/d)b | ||||||
|---|---|---|---|---|---|---|---|---|
| Height (cm) | Height (in) | Weight (kg) | Weight (lb) | Inactive PALd | Low active PAL | Active PAL | Very active PAL | |
| Overall | ||||||||
| 19–30 | 162.7 | 64.1 | 69.3 | 152.5 | 2,152 | 2,316 | 2,454 | 2,683 |
| 31–50 | 162.5 | 64.0 | 75.0 | 165.0 | 2,112 | 2,278 | 2,418 | 2,647 |
| 51–70 | 160.8 | 63.3 | 74.8 | 164.6 | 1,960 | 2,125 | 2,264 | 2,489 |
| > 70 | 156.8 | 61.7 | 69.7 | 153.3 | 1,737 | 1,896 | 2,035 | 2,249 |
| 19+ | 161.2 | 63.5 | 73.2 | 161.0 | 2,014 | 2,178 | 2,317 | 2,543 |
NOTE: cm = centimeter; d = day; in = inch; lb = pound; kcal = kilocalorie; kg = kilogram; PAL = physical activity level; y = year.
a For U.S. population, based on NHANES 2015–-2018, estimated for age group.
b Uses EER equations for adult women.
c Age used to predict EER is based on specific age: 19–30 y: 25 y; 31–50 y: 40 y; 51–70 y: 60 y; > 70 y: 80 y; 19 y or older: 50 y.
d Inactive: 1.0 ≤ PAL < 1.53; low active: 1.53 ≤ PAL < 1.69; active: 1.69 ≤ PAL < 1.85; very active: 1.85 ≤ PAL < 2.5.
TABLE 7-11 Estimated Energy Requirements (EER), Canadian Boys Aged 3–18, Based on Median Height and Weight for Age Group and Physical Activity Level (PAL) Category
| Age (y)c | Median Height and Weighta | EER (kcal/d)b | ||||||
|---|---|---|---|---|---|---|---|---|
| Height (cm) | Height (in) | Weight (kg) | Weight (lb) | Inactive PALc | Low active PAL | Active PAL | Very active PAL | |
| 3 | 100.1 | 39.4 | 16.0 | 35.2 | 1,096 | 1,238 | 1,237 | 1,271 |
| 4 | 106.6 | 42.0 | 17.7 | 38.9 | 1,202 | 1,327 | 1,353 | 1,409 |
| 5 | 112.9 | 44.4 | 19.9 | 43.8 | 1,316 | 1,429 | 1,482 | 1,561 |
| 6 | 120.4 | 47.4 | 22.2 | 48.8 | 1,448 | 1,544 | 1,627 | 1,733 |
| 7 | 126.7 | 49.9 | 24.9 | 54.8 | 1,569 | 1,657 | 1,766 | 1,897 |
| 8 | 132.1 | 52.0 | 28.4 | 62.5 | 1,689 | 1,778 | 1,910 | 2,065 |
| 9 | 138.9 | 54.7 | 32.5 | 71.5 | 1,845 | 1,934 | 2,093 | 2,278 |
| 10 | 142.8 | 56.2 | 35.8 | 78.8 | 1,943 | 2,038 | 2,214 | 2,419 |
| 11 | 147.3 | 58.0 | 39.4 | 86.7 | 2,052 | 2,153 | 2,348 | 2,575 |
| 12 | 159.4 | 62.8 | 48.4 | 106.5 | 2,332 | 2,444 | 2,689 | 2,974 |
| 13 | 164.7 | 64.8 | 55.0 | 121.0 | 2,491 | 2,627 | 2,895 | 3,213 |
| 14 | 168.7 | 66.4 | 63.6 | 139.9 | 2,655 | 2,835 | 3,120 | 3,473 |
| 15 | 173.0 | 68.1 | 68.3 | 150.3 | 2,777 | 2,971 | 3,275 | 3,652 |
| 16 | 175.6 | 69.1 | 69.7 | 153.3 | 2,832 | 3,025 | 3,340 | 3,728 |
| 17 | 178.3 | 70.2 | 71.0 | 156.2 | 2,888 | 3,079 | 3,404 | 3,804 |
| 18 | 175.8 | 69.2 | 72.0 | 158.4 | 2,873 | 3,081 | 3,397 | 3,792 |
NOTE: cm = centimeter; d = day; in = inch; lb = pound; kcal = kilocalorie; kg = kilogram; y = year.
a For Canadian population, based on CHMS 2012–2019, estimated for each age (y).
b Uses EER equations for boys, 3–18 years.
c For ages 3–8 y: inactive: 1.0 ≤ PAL < 1.31; low active: 1.31 ≤ PAL < 1.44; active: 1.44 ≤ PAL < 1.59; very active: 1.59 ≤ PAL < 2.5. For ages 9–13 y: inactive: 1.0 ≤ PAL < 1.44; low active: 1.44 ≤ PAL < 1.60; active: 1.60 ≤ PAL < 1.77; very active: 1.77 ≤ PAL < 2.5. For ages 14–18 y: inactive: 1.0 ≤ PAL < 1.57; low active: 1.57 ≤ PAL < 1.74; active: 1.74 ≤ PAL < 1.94; very active: 1.94 ≤ PAL < 2.5.
TABLE 7-12 Estimated Energy Requirements (EER), Canadian Girls Aged 3–18, Based on Median Height and Weight for Age Group and Physical Activity Level (PAL) Category
| Age (y)c | Median Height and Weighta | EER (kcal/d)b | ||||||
|---|---|---|---|---|---|---|---|---|
| Height (cm) | Height (in) | Weight (kg) | Weight (lb) | Inactive PALc | Low active PAL | Active PAL | Very active PAL | |
| 3 | 99.5 | 39.2 | 15.6 | 34.3 | 1,109 | 1,151 | 1,213 | 1,274 |
| 4 | 105.6 | 41.6 | 17.6 | 38.7 | 1,172 | 1,236 | 1,299 | 1,391 |
| 5 | 112.3 | 44.2 | 19.8 | 43.6 | 1,244 | 1,332 | 1,396 | 1,522 |
| 6 | 121.1 | 47.7 | 22.9 | 50.4 | 1,349 | 1,468 | 1,534 | 1,705 |
| 7 | 124.4 | 49.0 | 24.2 | 53.2 | 1,377 | 1,507 | 1,574 | 1,761 |
| 8 | 132.1 | 52.0 | 27.9 | 61.4 | 1,482 | 1,637 | 1,710 | 1,932 |
| 9 | 136.0 | 53.5 | 29.5 | 64.9 | 1,535 | 1,703 | 1,778 | 2,018 |
| 10 | 145.2 | 57.2 | 37.6 | 82.7 | 1,729 | 1,918 | 2,012 | 2,279 |
| 11 | 149.5 | 58.9 | 40.1 | 88.2 | 1,786 | 1,987 | 2,086 | 2,371 |
| 12 | 157.8 | 62.1 | 49.4 | 108.7 | 1,992 | 2,208 | 2,332 | 2,632 |
| 13 | 161.0 | 63.4 | 52.6 | 115.7 | 2,051 | 2,274 | 2,406 | 2,714 |
| 14 | 162.2 | 63.9 | 53.3 | 117.3 | 2,041 | 2,267 | 2,401 | 2,714 |
| 15 | 163.5 | 64.4 | 56.5 | 124.3 | 2,085 | 2,309 | 2,452 | 2,761 |
| 16 | 164.8 | 64.9 | 58.7 | 129.1 | 2,111 | 2,336 | 2,486 | 2,794 |
| 17 | 163.4 | 64.3 | 61.6 | 135.5 | 2,126 | 2,338 | 2,500 | 2,787 |
| 18 | 165.1 | 65.0 | 59.9 | 131.8 | 2,089 | 2,313 | 2,467 | 2,772 |
NOTE: cm = centimeter; d = day; in = inch; lb = pound; kcal = kilocalorie; kg = kilogram; y = year.
a For Canadian population, based on CHMS 2012–2019, estimated for each age (y).
b Uses EER equations for girls, 3–18 years.
c For ages 3–8 y: inactive: 1.0 ≤ PAL < 1.31; low active: 1.31 ≤ PAL < 1.44; active: 1.44 ≤ PAL < 1.59; very active: 1.59 ≤ PAL < 2.5. For ages 9–13 y: inactive: 1.0 ≤ PAL < 1.44; low active: 1.44 ≤ PAL < 1.60; active: 1.60 ≤ PAL < 1.77; very active: 1.77 ≤ PAL < 2.5. For ages 14–18 y: inactive: 1.0 ≤ PAL < 1.57; low active: 1.57 ≤ PAL < 1.74; active: 1.74 ≤ PAL < 1.94; very active: 1.94 ≤ PAL < 2.5.
TABLE 7-13 Estimated Energy Requirements (EER) for Overall Population, Adult Canadian Men, Based on Median Height and Weight for Age Group
| Age groupc (y) | Median Height and Weighta | EER (kcal/d)b | ||||||
|---|---|---|---|---|---|---|---|---|
| Height (cm) | Height (in) | Weight (kg) | Weight (lb) | Inactive PALd | Low active PAL | Active PAL | Very active PAL | |
| Overall | ||||||||
| 19–30 | 178.4 | 70.2 | 79.7 | 175.3 | 2,766 | 2,982 | 3,165 | 3,519 |
| 31–50 | 176.4 | 69.4 | 84.0 | 184.8 | 2,651 | 2,867 | 3,058 | 3,408 |
| 51–70 | 174.5 | 68.7 | 84.8 | 186.6 | 2,433 | 2,647 | 2,842 | 3,177 |
| > 70 | 171.5 | 67.5 | 81.9 | 180.2 | 2,156 | 2,362 | 2,560 | 2,858 |
| 19+ | 175.9 | 69.3 | 83.2 | 183.0 | 2,528 | 2,743 | 2,934 | 3,276 |
NOTE: cm = centimeter; d = day; in = inch; lb = pound; kcal = kilocalorie; kg = kilogram; PAL = physical activity level; y = year.
a For Canadian population, based on CHMS 2012–2019, estimated for age group.
b Uses EER equations for adult men.
c Age used to predict EER is based on specific age: 19–30 y: 25 y; 31–50 y: 40 y; 51–70 y: 60 y; > 70 y: 80 y; 19 y or older: 50 y.
d Inactive: 1.0 ≤ PAL < 1.53; low active: 1.53 ≤ PAL < 1.69; active: 1.69 ≤ PAL < 1.85; very active: 1.85 ≤ PAL < 2.5.
TABLE 7-14 Estimated Energy Requirements (EER) for Overall Population, Adult Canadian Women, Based on Median Height and Weight for Age Group
| Age Groupc (y) | Median Height and Weighta | EER (kcal/d)b | ||||||
|---|---|---|---|---|---|---|---|---|
| Height (cm) | Height (in) | Weight (kg) | Weight (lb) | Inactive PALd | Low active PAL | Active PAL | Very active PAL | |
| Overall | ||||||||
| 19–30 | 163.4 | 64.3 | 65.0 | 143.0 | 2,105 | 2,268 | 2,406 | 2,635 |
| 31–50 | 163.2 | 64.3 | 68.2 | 150.0 | 2,037 | 2,200 | 2,339 | 2,568 |
| 51–70 | 160.4 | 63.1 | 69.0 | 151.8 | 1,890 | 2,051 | 2,190 | 2,413 |
| > 70 | 157.8 | 62.1 | 68.3 | 150.3 | 1,727 | 1,886 | 2,024 | 2,240 |
| 19+ | 162.1 | 63.8 | 68.1 | 149.8 | 1,959 | 2,122 | 2,260 | 2,487 |
NOTE: cm = centimeter; d = day; in = inch; lb = pound; kcal = kilocalorie; kg = kilogram; PAL = physical activity level; y = year
a For Canadian population, based on CHMS 2012–2019, estimated for age group.
b Uses EER equations for adult women.
c Age used to predict EER is based on specific age: 19–30 y: 25 y; 31–50 y: 40 y; 51–70 y: 60 y; > 70 y: 80 y; 19 y or older: 50 y.
d Inactive: 1.0 ≤ PAL < 1.53; low active: 1.53 ≤ PAL < 1.69; active: 1.69 ≤ PAL < 1.85; very active: 1.85 ≤ PAL < 2.5.
of food. They will also vary depending on whether the planner provides all meals and snacks throughout the day, or just a single meal.
If meals are provided in a setting in which individuals can choose the amounts they receive, it is possible that providing a total amount of food energy equal to the mean or median EER multiplied by the number of group members could meet the requirements of almost all members of the group. This is possible because freely selected energy intakes are highly correlated with energy requirements. Those with above-average requirements generally select larger portions to meet their higher energy needs, while those with below-average requirements generally select smaller portions. Thus, in this “free choice” setting, most group members could meet their energy requirements if the average amount of food provided equaled the EER calculated for the group (with appropriate allowances for food wastage). In contrast, if everyone in the group receives an identical amount of food energy and does not have the opportunity to augment it, those with above-average energy requirements will not meet their energy needs.
The consequences of the nature of food delivery (i.e., the opportunity for variable or additional portions versus the provision of identical amounts to all group members) are considerably greater when the planner is providing all meals and snacks consumed throughout the day, such as could occur in a prison setting or a residential care facility. Those with above-average energy needs who do not meet their energy requirements will inevitably lose weight. Those with below-average energy needs, however, will not necessarily gain weight, as they have the option of not consuming all the food provided to them. In contrast, if the planner is providing only a single meal and group members have free access to food at other times during the day, those whose energy needs are not met during the single meal may be able to compensate by consuming more at other times during the day.
Step 2. Monitor body weight over time, and adjust intake as required. As discussed previously, monitoring body weight over time is particularly critical in group feeding situations in which all individuals in the group are provided identical portions in their meals and snacks, and in which all daily meals and snacks are provided with little or no opportunity to obtain food from other sources. This could apply in settings such as prisons and some residential care facilities. If the food provided contains an amount of energy based on the EER calculated for the group, some individuals in the group will not meet their energy needs and will lose weight. Thus, monitoring body weight and establishing mechanisms to provide additional food to those whose energy needs are not being met are essential.
ASSESSING ADEQUACY OF ENERGY INTAKES
The overall purpose of assessing dietary intakes is to determine whether intake is adequate (meets or exceeds the requirement for the specific biological indicator of adequacy used to determine the requirement for a given nutrient) but not excessive (falls below the intake level at which potential risk of adverse effects of excessive nutrient intake begins to increase). For energy, the biological indicator of adequacy used to define the requirement is maintenance of current body weight/composition (or appropriate rates of growth in growing individuals) and current level of physical activity. It is recognized that in some cases, modification of body weight/composition may be appropriate (e.g., weight loss in an individual with obesity and type 2 diabetes), but the EER equations were not developed with the objective of leading to weight gain (or loss) in nongrowing individuals or groups.
Procedures for the assessment of dietary intakes of individuals and groups are detailed elsewhere (IOM, 2000b). Briefly, for individuals, one can determine the degree of confidence that the individual’s intake of a nutrient meets his or her requirement for the indicator of adequacy and is not excessive, whereas for groups one can determine the proportion of the group with usual intakes below their requirement for the indicator of adequacy, as well as the proportion with usual intakes associated with potential risk of excess.
These methods for assessing dietary nutrient intakes and determining the likelihood or prevalence of inadequacy or excess cannot be used for energy. Their use is based on a number of assumptions (IOM, 2000b), including that nutrient intakes and requirements are not highly correlated. This is thought to be true for almost all other nutrients. For example, an individual with an above-average requirement for vitamin C does not intuitively consume larger amounts of vitamin C. However, it is not true for energy, as energy intakes and requirements are highly correlated. Furthermore, as described in Chapter 6, misreporting of energy intakes is pervasive in national surveys of dietary intakes and is not random. Underreporting occurs in most age/sex groups, and its extent appears to vary by factors such as age, sex, and body weight status (see Chapter 6). Accordingly, assessing the adequacy of energy intake based on self-reported dietary intake data is not valid.
However, unlike the case for many other food components, the biological indicator of adequacy for energy (body weight maintenance) is easily measured, without the need for laboratory assessments. By definition, nongrowing individuals maintaining a stable weight are meeting their energy requirements, while those currently gaining or losing weight are exceeding or falling below their requirements, respectively. For growing children and pregnant women, meeting the energy requirement is
reflected by gaining the expected amount of weight over time. Inadequate or excessive intakes in these groups are reflected by failure to gain the expected amount of weight (or, in some cases, by weight loss) or gaining excessive amounts of weight, respectively.
At the population level, insights about the overall adequacy of energy intake are provided by assessing the proportions of the population classified in various body weight categories (i.e., underweight, normal weight, overweight, and obesity) using BMI in adults or BMI Z-scores/percentiles in children. Although individuals within each category may be currently meeting, exceeding, or falling below their requirement to maintain their current weight (e.g., some underweight individuals may be maintaining their weight while others may be gaining or losing weight), the prevalence of underweight, normal weight, and overweight/obesity in a population provide useful information about the overall long-term level of energy adequacy in that population and its subgroups.
The examples below illustrate why it is not appropriate to assess adequacy of energy intake by comparing self-reported dietary intakes obtained from either individuals or groups and why assessment of body weight stability and relative body weight status provides information that has greater validity and utility.
Assessing Energy Intakes of Individuals
Short-term changes in body weight can be interpreted as reflecting energy intakes that are inadequate (if weight is being lost) or excessive (if weight if being gained) to maintain the individual’s usual weight. In some cases, this may be desirable (e.g., a reasonable rate of weight loss in an individual with obesity), while in others it may be a reason for concern (e.g., weight loss in an underweight individual). It must also be recognized that, particularly when working with individuals, there are limitations to the use of BMI to determine whether an individual has a normal body weight and composition.
To illustrate, in the example of a 22-year-old, low active woman, her EER is calculated as 2,275 kcal/d based on a height of 165 cm and a weight of 63 kg. She indicates that her weight has been stable for the past 2 years. She kept a 3-day food record, and it revealed that her energy intake averaged 1,820 kcal/d. The difference between her EER and her reported intake is 455 kcal/d (2,275 kcal–1,820 kcal). A discrepancy of that magnitude would lead to an expectation that her energy intake would be inadequate to meet her requirement and that she would be losing weight. However, her weight is stable. In this situation, a large number of factors could have contributed to the discrepancy. These include:
- It is possible that she reported her intake accurately in the 3-day food record, but her intake during those 3 days may have differed from her usual intake. Based on a yearlong study of 29 individuals, estimating the average energy intake of an individual within 10 percent of their true mean value required an average of 31 days of intake records (Basiotis et al., 1987). Clearly, this is not realistic in almost all situations.
- She may have underreported her intake in the 3-day record (perhaps because of difficulty in estimating portion sizes or forgetting to record some food items).
- Although her reported intake is considerably lower than the EER, it is at least theoretically possible that she may have reported her intake accurately and that it reflected her usual intake. In this case, she could be an individual whose requirement is at the lower end of the range for which the EER is the average. For adult women, the range encompasses the EER plus or minus two times the SEPV of 241 kcal, or in this case 1,793–2,757 kcal/d. Her reported intake of 1,820 kcal is 455 kcal below the EER, and is thus at the bottom of the range, but is still within expected normal variability.
- It is possible that the low active PAL category may have been inappropriate. For example, her activity level may be more accurately classified as being in the inactive range, and thus her EER was overestimated by using the EER equation for low active women.
- Any combination of the above factors may have contributed to her reported intake being considerably below the EER, despite her stable weight.
Thus, based on the observation that her current weight is stable, one can conclude that her usual energy intake is meeting her requirement. In addition, her current height and weight translate to a BMI of 23.1, which is within the normal weight range. In conclusion, neither weight loss nor weight gain would be indicated from an overall health perspective.
Assessing Energy Intakes of Groups
As was true for individuals, it is not appropriate to use reported energy intake to determine the prevalence of energy inadequacy or excess in a group. For many nutrients, prevalence of inadequacy in a group is estimated by determining the proportion of the group’s usual nutrient
intake distribution that falls below the EAR (IOM, 2000b), but this cannot be done for energy because intakes are highly correlated with requirements and underreporting is prevalent.
If energy intakes of all members of a group met their individual energy requirements for weight maintenance, one would expect the mean or median energy intake of the group to closely approximate the mean or median EER for the group. Half the group (those with lower-than-average requirements) would have intakes below the EER and the other half (with higher-than-average requirements) would have intakes above it. Thus, in this “ideal situation” the prevalence of intakes below the EER would be 50 percent but the prevalence of inadequacy (and of excess) would be zero. This is in significant contrast to what is observed with other nutrients, for which intakes are not highly correlated with requirements. For example, if 50 percent of a population group had vitamin C intakes below the EAR for vitamin C, one would expect that a similar proportion would not meet the requirement for the biological indicator of adequacy used to establish the EAR (which was near saturation of neutrophils with vitamin C without excessive urinary excretion) (IOM, 2000a).
Reported energy intakes from national surveys indicate that intakes are generally well below the EER calculated for the group for adults. Figure 7-1 shows the median EERs calculated for U.S. and Canadian women aged 19 years or older with normal weight, overweight, and obesity. For each BMI category, EERs were determined for inactive, low active, active, and very active women at median height and weight for that BMI category and at age 50 (an approximate median age for women aged 19 years or older). In Figure 7-1, the lowest value is the EER for the inactive group and the highest value shown is the EER for the very active group. The figure also shows the median energy intakes for women who have normal weight, overweight, and obesity as reported by NHANES (for U.S. women) or the CCHS (for Canadian women).
Reported intakes are not subdivided by PAL category, as the surveys do not collect data that would permit PAL category to be determined. Nevertheless, in all cases the reported median energy intakes were well below the EER, even for inactive women. Furthermore, the gap between reported intakes and the EER increased across BMI categories. Based on the data shown in Figure 7-1, one would expect that the majority of adult women would be losing weight, as reported median intakes were lower than the EER for the least active women. Systematic underreporting of energy intakes underlies the differences between reported intakes of groups and the EER for the group.
Instead of assessing the adequacy of the energy intake of groups from their reported intakes, data on the body weight status of the group should be used to draw conclusions about the long-term adequacy of
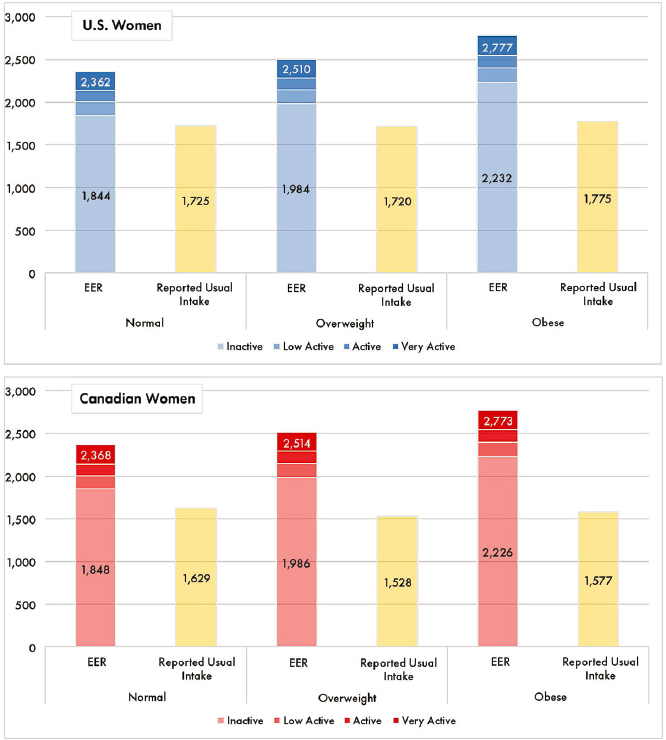
NOTE: EERs were calculated for inactive, low active, active, and very active U.S. and Canadian women at age 50 and of median height and weight within each BMI category (normal weight, overweight, obesity).
SOURCE: Median usual energy intakes for women with normal weight, overweight, obesity were determined from NHANES (U.S. women) and the CCHS 2015 Nutrition (Canadian women).
group or population energy intakes. Figure 7-2 shows the distribution of body weight status categories for adult women in the United States and Canada. Low proportions of women have a BMI classified as underweight (which would suggest relative energy inadequacy over the long term),
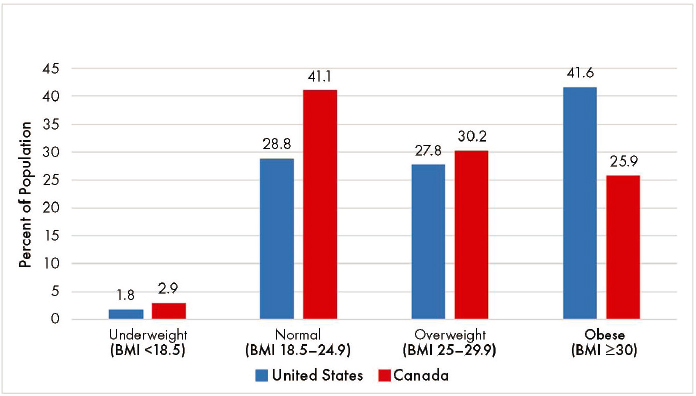
SOURCE: NHANES and CHMS.
and the majority of women have a BMI reflecting either overweight or obesity, reflecting excessive energy intake over a period of time. As discussed previously, it is possible that individuals within each body weight category could be weight stable, gaining weight, or losing weight, but the point prevalence provides useful information on overall energy adequacy for the group or population.
COMPARISON TO 2005 DRIS
To compare the EERs developed in this report to those established in the IOM report on macronutrients and energy (2002/2005), the committee made comparisons for reference U.S. male and female infants, children, and adults of median height and weight (as assessed in NHANES 2015–2018) using the 2023 and the 2005 EER equations. As shown in Figure 7-3, EERs for children under the age of 3 years were very similar. In older children (Figure 7-4) and adults (Figure 7-5), the most obvious difference appears to be the narrowing of the differences in energy requirements across PAL categories. In general, EERs of those in the least active PAL category are higher in 2023 than in 2005, while EERs of those in the highest PAL category are lower in 2023 than in 2005, and the increase from low active to active or active to very active tends to be smaller than in the previous EERs.
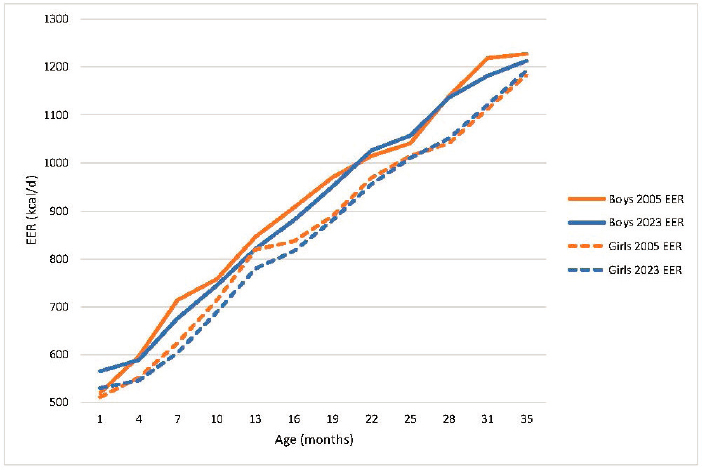
SOURCE: NHANES, 2015–2018.
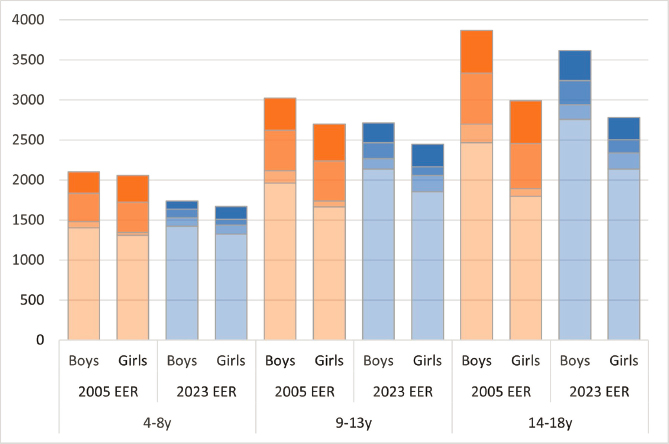
NOTE: Within each stacked bar, the bottom division (lightest shading) portrays the EER for inactive individuals, followed by EERs for low active, active, and very active individuals (at the top of the stacked bar and with the darkest shading).
SOURCE: NHANES, 2015–2018.

NOTE: Within each stacked bar, the bottom division (lightest shading) portrays the EER for inactive individuals, followed by EERs for low active, active, and very active individuals (at the top of the stacked bar and with the darkest shading).
SOURCE: NHANES, 2015–2018.
FINDINGS AND CONCLUSIONS
Findings
The committee finds that accurate determination of PAL category for individuals was extremely challenging, as the associations between PAL assessed by DLW and by readily accessible measures such as “steps” or physical activity questionnaires were generally weak. The new EERs developed for this report were very similar to the IOM (2002/2005) EERs for children under the age of 3 years. For older children and adults, the difference in the construction of PAL categories for the current EERs resulted in narrower difference across PAL categories, and a more consistent difference in energy requirements as the PAL categories increased, particularly for children.
Conclusions
The committee concludes that additional research to develop and validate measures to classify children and adults into PAL categories would improve
the application of the EER equations in practice. Use of the new EER equations is expected to lead to somewhat higher values for inactive individuals and lower values for very active individuals compared to the previous EER equations, but correct classification of individuals into PAL categories remains an important step of estimating energy requirements.
REFERENCES
Basiotis, P. P., S. O. Welsh, F. J. Cronin, J. L. Kelsay, and W. Mertz. 1987. Number of days of food intake records required to estimate individual and group nutrient intakes with defined confidence. Journal of Nutrition 117(9):1638-1641.
Black, A. E., W. A. Coward, T. J. Cole, and A. M. Prentice. 1996. Human energy expenditure in affluent societies: An analysis of 574 doubly-labelled water measurements. European Journal of Clinical Nutrition 50(2):72-92.
Canadian Society for Exercise Physiology. 2021. Canadian 24-hour movement guidelines: An integration of physical activity, sedentary behaviour, and sleep. https://csepguidelines.ca/ (accessed November 25, 2022).
Craig, C. L., C. Cameron, J. M. Griffiths, and C. Tudor-Locke. 2010. Descriptive epidemiology of youth pedometer-determined physical activity: CANPLAY. Medicine and Science in Sports and Exercise 42(9):1639-1643.
DHHS (U.S. Department of Health and Human Services). 2018. Physical activity guidelines for Americans, 2nd ed. Washington, DC: U.S. Department of Health and Human Services.
Goldstein, R. F., S. K. Abell, S. Ranasinha, M. Misso, J. A. Boyle, M. H. Black, N. Li, G. Hu, F. Corrado, L. Rode, Y. J. Kim, M. Haugen, W. O. Song, M. H. Kim, A. Bogaerts, R. Devlieger, J. H. Chung, and H. J. Teede. 2017. Association of gestational weight gain with maternal and infant outcomes: A systematic review and meta-analysis. JAMA 317(21):2207-2225.
IOM (Institute of Medicine). 2000a. Dietary Reference Intakes for vitamin C, vitamin E, selenium, and carotenoids. Washington, DC: National Academy Press.
IOM. 2000b. Dietary Reference Intakes: Applications in dietary assessment. Washington, DC: National Academy Press.
IOM. 2002/2005. Dietary Reference Intakes for energy, carbohydrate, fiber, fat, fatty acids, cholesterol, protein, and amino acids. Washington, DC: The National Academies Press.
IOM. 2003. Dietary Reference Intakes: Applications in dietary planning. Washington, DC: The National Academies Press.
IOM and NRC (National Research Council). 2009. Weight gain during pregnancy: Reexamining the guidelines. Washington, DC: The National Academies Press.
Lovelady, C. 2011. Balancing exercise and food intake with lactation to promote post-partum weight loss. Proceedings of the Nutrition Society 70(2):181-184.
Park, J. H., K. Ishikawa-Takata, S. J. Lee, E. K. Kim, K. W. Lim, H. R. Kim, I. S. Lee, and S. Tanaka. 2016. Association between daily step counts and physical activity level among Korean elementary schoolchildren. Journal of Exercise Nutrition and Biochemistry 20(3):51-55.
Puyau, M. R., A. L. Adolph, F. A. Vohra, and N. F. Butte. 2002. Validation and calibration of physical activity monitors in children. Obesity Research 10(3):150-157.
Treuth, M. S., A. L. Adolph, and N. F. Butte. 1998. Energy expenditure in children predicted from heart rate and activity calibrated against respiration calorimetry. American Journal of Physiology 275(1):E12-E18.
Treuth, M. S., N. F. Butte, M. Puyau, and A. Adolph. 2000. Relations of parental obesity status to physical activity and fitness of prepubertal girls. Pediatrics 106(4):E49.
Treuth, M. S., A. L. Sunehag, L. M. Trautwein, D. M. Bier, M. W. Haymond, and N. F. Butte. 2003. Metabolic adaptation to high-fat and high-carbohydrate diets in children and adolescents. American Journal of Clinical Nutrition 77(2):479-489.
Tudor-Locke, C., J. J. McClain, T. L. Hart, S. B. Sisson, and T. L. Washington. 2009. Expected values for pedometer-determined physical activity in youth. Research Quarterly for Exercise and Sport 80(2):164-174.
Westerterp, K. R. 2018. Exercise, energy expenditure and energy balance, as measured with doubly labelled water. Proceedings of the Nutrition Society 77(1):4-10.
Wharton, S., D. C. W. Lau, M. Vallis, A. M. Sharma, L. Biertho, D. Campbell-Scherer, K. Adamo, A. Alberga, R. Bell, N. Boule, E. Boyling, J. Brown, B. Calam, C. Clarke, L. Crowshoe, D. Divalentino, M. Forhan, Y. Freedhoff, M. Gagner, S. Glazer, C. Grand, M. Green, M. Hahn, R. Hawa, R. Henderson, D. Hong, P. Hung, I. Janssen, K. Jacklin, C. Johnson-Stoklossa, A. Kemp, S. Kirk, J. Kuk, M. F. Langlois, S. Lear, A. McInnes, D. Macklin, L. Naji, P. Manjoo, M. P. Morin, K. Nerenberg, I. Patton, S. Pedersen, L. Pereira, H. Piccinini-Vallis, M. Poddar, P. Poirier, D. Prud’homme, X. R. Salas, C. Rueda-Clausen, S. Russell-Mayhew, J. Shiau, D. Sherifali, J. Sievenpiper, S. Sockalingam, V. Taylor, E. Toth, L. Twells, R. Tytus, S. Walji, L. Walker, and S. Wicklum. 2020. Obesity in adults: A clinical practice guideline. CMAJ: Canadian Medical Association Journal 192(31):E875-E891.


