
4
The Current State of Global Health Care Quality1
To improve the quality of health care globally, it is imperative first to be able to characterize and quantify the burden of low-quality care. To gain a comprehensive understanding of this burden in low-resource settings,
___________________
1 Details on the methods used to derive the information presented in this chapter are given in Appendix D.
the committee commissioned a team of analysts at the Harvard Initiative on Global Health Quality to analyze available data on the quality of care across low- and middle-income countries (LMICs), with emphasis on the six dimensions of quality care introduced in Chapter 1: safety, effectiveness, person-centeredness, timeliness, efficiency, and equity. While the results of this review reveal that the quality of care globally is poor, what is also clear is the paucity of data on quality for many places. Proper metrics for tracking quality—not just inputs, but also processes and outcomes—are necessary to assure and improve levels of quality. Several global efforts are under way to develop such metrics, but their effectiveness will depend on partnering with LMICs to adapt them to various settings.
This chapter focuses on estimating the burden of low-quality care among those who have been able to access the health care system. We quantify the burden of low-quality care as an estimate of the deaths and disability resulting from unsafe and ineffective care for the proportion of the population that has attained actual coverage. In addition, we demonstrate the variability of person-centeredness across countries by documenting variations in patients’ assessment of their health care interactions. We discuss waiting times for treatment separately to demonstrate the variability in timeliness of care. Next, the chapter provides more detail on equity, or the variability in the burden of poor-quality care, particularly by geographic location. Since access to care is critically important in its own right, separate estimates are presented of the deaths and disability resulting from failure to obtain care among a subset of conditions. The total burden of low-quality care in terms of death and disability as measured across domains and conditions is also presented, along with some measures of efficiency. (Detailed methods relating to each domain are outlined in Appendix D.) Finally, this chapter reviews data availability and limitations, as well as potential reasons for variability. It closes with a call to action for countries to commit to developing National Quality Policy Strategies, and to provide the leadership and environmental conditions needed for this to become a reality.
Mansah’s Story: The Consequences of Poor Quality
Mansah was a brilliant young woman. She was vivacious, fun-loving, and intelligent. She met her husband Kwame during her studies at the university in Ghana, and happily discovered she was pregnant a few months after their wedding. Kwame, an only child himself, was looking forward to starting a family. The two went to a nearby hospital, a large facility with 350+ beds offering specialist services. The obstetric unit had a maternity unit, several rooms for delivery, and two obstetric theaters. The maternity unit was run by four specialist teams (Teams A–D), each comprising a consultant (the leader), two or three specialists, and four house officers. Mansah visited the antenatal clinic (ANC) for a 6-week appointment and
was assigned to Team B, led by a consultant. She was given a maternal health record book with her expected date of delivery and was told when to return for her next visit. She continued with her ANC visits regularly and continued to be healthy with no known medical conditions.
At each ANC visit with Team B, Mansah was attended to by the same resident doctor, who always declared her healthy and well, to her husband’s great relief. She was apprehensive about having a vaginal delivery and expressed this to the resident doctor, who assured her that she would be fine as all her tests and scans had come in normal. But on her last visit (4 days before her expected date of delivery), her blood pressure (BP) was high (170/110). She was asked to go home and rest and return the next day for a recheck. Mansah complied, and upon returning the next morning had multiple BP measurements of 170/110. The resident doctor informed her and her husband that as her BP was still high, the plan was to control the BP and later induce labor. She was admitted to the maternity unit, and Kwame was given a prescription to fill for her for an antihypertensive and a prostaglandin to induce labor. He filled the prescription at the hospital pharmacy, and treatment was started immediately. Upon reviewing the case later that evening, the resident doctor stated that the priority was to control Mansah’s BP while she awaited Team B’s clinical rounds the next morning for a final decision. Initially her BP dropped from 170/110 to 160/110 and to 140/95, but it began to rise again to 150/110 and eventually, by 6:30 a.m. the next day, it had risen to 170/100.
After considering their options, Kwame and Mansah decided a caesarean section (CS) was the best way to deliver the baby. Kwame relayed this request to the resident doctor, who agreed to perform the CS at 2:00 p.m. that afternoon. Shortly thereafter, the consultant leader of Team B was briefed on Mansah’s condition, and she also informed him of their choice of CS rather than vaginal delivery. The consultant, however, stated that labor should be induced, and he explained the risks associated with a delivery by CS, especially as it was her first delivery. In his opinion, her condition did not necessitate a delivery by CS. His plan was to proceed with the induction of labor, assuming that her BP would settle with the antihypertensives she was taking. He instructed that she receive the medicine to induce labor every 4 hours for up to three doses, after which if labor had not begun, he would proceed to deliver the baby by CS. The first dose of Cytotec was administered at about 10:00 a.m. and the second dose at about 3:00 p.m., but after both doses, no cervical dilation or contractions were recorded by the attending staff—a midwife and a house officer. Concerned, Kwame tried to reach the resident doctor, but with no success until about 7:30 p.m. Frustrated, he again requested CS for the delivery as the induction did not appear to be working. He was informed by the resident doctor that the consultant leader of Team B had called off the CS completely. At about 8:00 p.m., the third dose of Cytotec was administered, and about an hour and
a half later there were still no contractions or cervical dilatation, and Mansah’s BP was still high (160/110). Kwame called the consultant, requesting yet again that the team proceed with the delivery by CS. The consultant insisted that Mansah would be fine and would continue to be monitored by the team, with the resident doctor updating him on Mansah’s progress.
Eventually, at about 10:45 p.m., Mansah begun to experience painful contractions, and her BP was still 160/100. Kwame informed the midwives, who examined her and confirmed that her cervix was just 2 cm dilated, and she would thus need more time to progress fully into labor. At about 3:00 a.m. the next day, Mansah’s water broke, and at 4:30 a.m. she was taken to the stage 1 labor room with her BP at 170/107 and her cervix 5 cm dilated. At 7:45 a.m., she was reexamined by the midwives, who found that her cervix was 9 cm dilated, but the baby’s head was still very high. Concerned about this and the fact that there was no doctor nearby, Kwame relayed this information to the resident doctor by phone. The night shift was coming to an end, and patients were being introduced and transitioned to the morning shift staff. One of them examined Mansah and confirmed that her cervix was 9 cm dilated, but added that part of the cervix was still tight and too firm. One of the midwives then suggested that Mansah be moved to the second-stage labor room and be forced to push. Coaxed by the midwives, Mansah began to bear down, and after about 30 minutes gave a very hard push to deliver her baby at 9:00 a.m. The baby, however, did not cry at birth, and the midwives started immediate resuscitation on the baby, later joined by the resident doctor, who had been informed of the situation by Kwame. After about 30 minutes, the resident doctor and one of the midwives rushed the baby to the neonatal intensive care unit (NICU), with Kwame following. He called the consultant at about 9:45 a.m. to inform him of the situation. The consultant had just arrived at the hospital and proceeded to the NICU to observe the baby’s progress.
After about an hour of waiting and assurances that the baby was responding to treatment, Kwame returned to the labor ward to find Mansah in a wheelchair looking very pale and weak. She could not speak, and when he inquired of the consultant what the problem was, the consultant indicated that he suspected she had a severe tear, and he was going to repair it in theater. The midwife explained to Kwame that Mansah had not stopped bleeding since delivery. Shortly thereafter, the consultant emerged from the theater and reassured the family that he had fixed the bleeding, and Mansah was in the recovery room, after which he left the ward. Almost immediately, Kwame was asked to find a house officer to accompany him to the blood bank for four units of cross-matched blood, which they obtained after about 20 minutes and sent to the theater. He was told Mansah was well and in the recovery ward, but in less than 10 minutes, Kwame’s and Mansah’s family members were called into the corridor of the theater and informed that Mansah had died. Kwame was devastated.
Mansah lay on a stretcher in the corridor. None of the staff were familiar to Kwame, and there was no one of whom to ask questions. Kwame requested an immediate postmortem, which he said indicated that Mansah had died from primary postpartum hemorrhage secondary to a third-degree vaginal tear. (An endorsed report was sent to him later with the cause of death stated as hypovolaemic shock, primary postpartum hemorrhage, and hypertensive heart disease.) Shocked, Kwame and the family went to the NICU to inquire about the condition of the baby, where they were met by more heartache. The baby was convulsing and had to be admitted. Though in intense grief, Kwame had to visit his son twice per day while making arrangements for Mansah’s funeral. The baby was finally discharged after 3 weeks with a diagnosis of severe asphyxia and right Erbs palsy, typically caused by excessive pulling or stretching of an infant’s head and shoulders during birth.
THE STATE OF QUALITY ACROSS DOMAINS
For each domain of quality outlined in Chapter 1, the team of commissioned analysts defined a set of indicators corresponding to poor-quality care (detailed methods relating to each indicator are outlined in Appendix D). Two main sources of data were used to estimate the burden of poor quality for each domain: where available, data were obtained from national or international databases, including but not limited to the Global Burden of Disease (GBD), the Demographic and Health Surveys (DHS), and the World Health Organization (WHO) STEPwise approach to surveillance (STEPS) data. Where no data were available for indicators of interest, the team obtained estimates by carrying out systematic reviews of the peer-reviewed published English-language literature over the past decade. Details on the data sources used for all variables are outlined in Appendix D, which also includes details on the literature review results and methods. Across the estimates discussed in this section, issues that might impact the relationship among care delivery, receipt of intended services, and ultimately health outcomes are addressed.
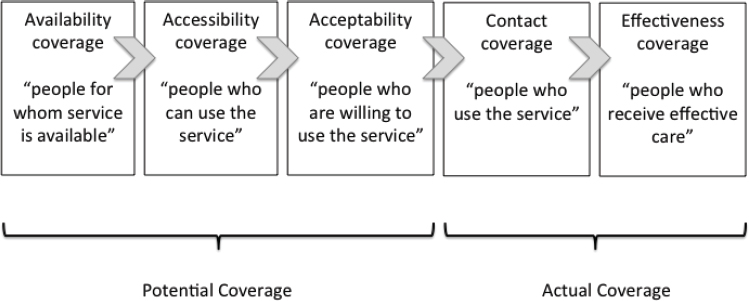
The focus of this analysis is on estimating the burden of low-quality care among members of the population who have successfully interacted with the health care system. Coverage normally refers to the proportion of the population that can receive or has received a health care service. The Tanahashi (1978) framework (see Figure 4-1) expresses coverage in terms of potential coverage (the proportion of the population for whom service is available) and actual coverage (the proportion of the population who actually receives the service). This dyad can be further broken down into five important stages that lead successively from potential to actual coverage. The focus here is on estimating the burden of low-quality care among the
SOURCE: Tanahashi, 1978.
portion of population that has interacted successfully with the health care system, using the Tanahashi stages of health care service coverage.
Potential coverage is reflected in the first three stages shown in Figure 4-1. First is availability coverage, or the availability of the resources necessary to ensure that the service can be provided. Next, the service must be within the reach of its target population, as reflected in accessibility coverage. Once available, the service should be acceptable to people in terms of cost, respect for religion/norms, and quality, among other things, as reflected in acceptability coverage. For actual coverage to be attained, people must come into contact with service providers through contact coverage. However, contact does not guarantee that they will receive a satisfactory level of service. The receipt of high-quality, effective service occurs in the final stage, effectiveness coverage. It is crucial to recognize that the gap between contact coverage and effectiveness coverage is not just an academic concept, but impacts the lives and livelihoods of people around the world, as demonstrated in the narrative at the beginning of this chapter.
Safety
To measure the global burden of unsafe care, an existing list of indicators commissioned by the World Alliance for Patient Safety in 2007 was used. This review, which was conducted with the input of the WHO Committee on Research for Patient Safety, identified 23 topics pertaining to patient safety, including adverse events. From those 23 topics, six indicators composed of types of adverse events and hospital-acquired conditions were selected for measurement, in line with a previous review on the global burden of patient safety and taking into account the availability of data (Jha et al., 2013). Data were obtained from a systematic review of these indicators
in LMICs to produce estimates on the incidence of unsafe care; the number of such events; and, where possible, deaths arising directly from unsafe care (see Appendix D). Where data were not available through the review, estimates were taken from an existing study (see Appendix D).
Table 4-1 presents the incidence rates, number of events, and number of deaths for the six selected indicators. Nine percent of hospitalized patients experienced a decubitus ulcer, 7.4 percent of patients on a ventilator in the intensive care unit (ICU) acquired ventilator-associated pneumonia, and more than 5 percent of hospitalized patients experienced an in-hospital fall. Based on these estimates, nearly 134 million adverse events and 2,620,412 deaths are estimated to occur annually as a result of unsafe medical care in LMICs.
These estimates of incidence, number of events, and deaths related to the selected indicators are likely an underestimate of the true burden of unsafe care in LMICs. The numbers presented reflect estimates obtained from the literature for the six selected safety indicators, representing a subset of all adverse events. This subset excludes other important adverse events such as injuries due to medical devices, unsafe injections, and surgical errors. In addition, the lack of availability of high-quality data in these settings may result in an undercount of adverse events, limit the ability to estimate mortality rates directly associated with unsafe care, and contribute to uncertainty in the number of hospitalizations in LMICs. Another relevant consideration when examining patient safety is rates of counterfeit and substandard medicines. Box 4-1 highlights a case study in this area with a
TABLE 4-1 Safety Events Occurring in Low- and Middle-Income Countries (LMICs)
| Indicator | Incidence Rates (% of those hospitalized) | No. of Events | No. of Deaths |
|---|---|---|---|
| Adverse drug events | 3.2 | 17,152,226 | 222,979 |
| Falls | 5.1 | 27,198,059 | 40,797 |
| Ventilator-associated pneumonia | 7.4 | 316,279 | 63,256 |
| Decubitus ulcers | 9.0 | 47,931,418 | 239,657 |
| Catheter-associated urinary tract infections | 0.9 | 27,187,770 | 1,631,266 |
| Venous thromboembolisms | 2.6 | 14,081,893 | 422,457 |
| Overall | 133,867,645 | 2,620,412 |
NOTES: Ventilator-associated pneumonia is applied to the intensive care unit (ICU) population on ventilators only; the rates for all other measures are applied to an estimate of total global hospitalizations, including ICUs (studies that are limited to the ICU population are excluded). The estimated total number of hospitalizations for LMICs is 531 million. Incidence rates are not additive because of the difference in denominators among indicators.
specific focus on quality of tuberculosis (TB) and human immunodeficiency virus (HIV) medications.
Effectiveness
The burden of ineffective care was estimated for a range of conditions that represent leading causes of mortality and morbidity in LMICs (see Table 4-2). To quantify the mortality and morbidity burden of these conditions, outcome indicators (see Table 4-3) were restricted to populations with actual coverage (as defined above), where actual coverage served as a proxy for diagnosis and care-seeking behavior. For some conditions, the receipt of effective care prevents mortality, and thus any death associated with these indicators (for example, death from untreated diarrheal diseases under age 5 among those who accessed care) was measured as a quality-related death. Other deaths (for example, deaths from acute myocardial infarction) are not entirely preventable by but amenable to effective care, such that the number of deaths and the incidence of disability can be reduced. For these conditions, quality-related deaths were defined as deaths above what is seen in high-income settings for the same conditions.
It is important to note that while these estimates include conditions that represent leading causes of mortality and morbidity, the lack of data availability prevented a more exhaustive estimate for all conditions for which poor-quality care can result in a high burden of death and disability. In addition, this estimate does not always consider instances in which condi-
TABLE 4-2 Conditions Represented in the Effectiveness Domain
| Communicable diseases |
|
| Noncommunicable diseases |
|
| Maternal and child health |
|
TABLE 4-3 Definition of Ineffectiveness Indicators
| Indicator | Definition |
|---|---|
| Communicable Diseases | |
| HIV/AIDS | Untreated HIV/AIDS among diagnosed and nonadherent patients |
| Tuberculosis | TB patients lost to follow-up among diagnosed patients |
| Pneumonia | Untreated pneumonia among those seeking care, with symptoms, under age 5 |
| Diarrheal diseases | Untreated diarrhea among those seeking care under age 5 |
| Noncommunicable Diseases | |
| Lung cancer mortality | Excess lung cancer mortality |
| Acute myocardial infarction (AMI) mortality | Excess inpatient AMI mortality |
| Heart failure mortality | Excess inpatient heart failure mortality |
| Ischemic stroke | Excess inpatient ischemic stroke mortality |
| Hemorrhagic stroke | Excess inpatient hemorrhagic stroke mortality |
| Chronic obstructive pulmonary disease (COPD) mortality | Excess inpatient COPD mortality |
| Diabetes | Untreated diabetes among diagnosed patients |
| Injury and trauma | Excess mortality from trauma and injury |
| Depression | Untreated depression among those seeking care |
| Anxiety | Untreated anxiety among those seeking care |
| Bipolar disorder | Untreated bipolar disorder among those seeking care |
| Schizophrenia | Untreated schizophrenia among those seeking care |
| Substance abuse | Untreated substance abuse among those seeking care |
| Maternal Mortality and Child Health | |
| Maternal mortality | Mortality among women during birth who had a skilled birth attendant at delivery |
| Neonatal mortality | Mortality among neonates in the first month of life who had a skilled birth attendant at delivery |
tions were not appropriately diagnosed; accounting for misdiagnosis would increase the estimate of the burden. In certain cases, however, such as for pneumonia and diarrheal disease, the data represent care-seeking behavior among people with symptoms and were not limited to cases in which a diagnosis had already been made. Therefore, diagnosis as an element of ineffective care would be captured, to an extent, in these estimates.
Communicable Diseases
To estimate the burden of ineffective care, it was first necessary to quantify the rates of ineffective treatment. Table 4-4 presents estimates of ineffective treatment for communicable diseases measured as the percentage of the population diagnosed and not treated, by condition, while Table 4-5 presents the estimated annual deaths and disability resulting from ineffective care.
Across the communicable conditions studied, each year approximately 8.4 million people had a diagnosis yet were not being treated. People with HIV had the highest proportion of ineffective treatment (66 percent), representing people with known HIV status that were not on antiretrovirals or were nonadherent. This ineffective treatment is estimated to result in
| Condition | No. Diagnosed | No. Untreated (% untreated among diagnosed) |
|---|---|---|
| HIV/AIDS | 19.5 | 3.8 (66) |
| Diarrheal disease (under 5 years) | 11.2 | 3.9 (35.3) |
| Tuberculosis* | 5.7 | 0.27 (4.7) |
| Total | 36.4 | 7.97 (21.9) |
*High estimate from two different data sources.
| Treatment Indicator | Quality-Related Deaths | Years of Life Lived with Disability |
|---|---|---|
| HIV/AIDS | 0.46 | 2.5 |
| Diarrheal disease (under 5 years) | 0.14 | — |
| Tuberculosis* | 0.13 | 0.09 |
| Pneumonia (under 5 years) | 0.07 | — |
| Total | 0.8 | 2.59 |
*High estimate from two different data sources.
460,000 quality-related deaths and 2.5 million years of life lived with disability (YLD) in LMICs annually. In addition, 35 percent of children under 5 years taken to a medical facility for the treatment of diarrhea were not prescribed oral rehydration therapy, resulting in 140,000 quality-related deaths each year. Finally, 4.7 percent of TB patients were diagnosed but lost to follow-up, resulting in 130,000 quality-related deaths and 90,000 YLD annually. Overall, ineffective treatment for communicable diseases leads to 800,000 deaths and 2.6 million YLD annually.
Noncommunicable Diseases
Estimates of ineffective treatment for noncommunicable diseases (NCDs), measured as the percentage of the population diagnosed and not treated annually, are presented in Table 4-6. Estimated annual deaths and disability resulting from ineffective care for NCDs are presented in Table 4-7.
Overall, 831 million people had a diagnosis and were not receiving treatment for NCDs annually. Mental health conditions, both common (depression and anxiety) and serious (bipolar disorder and anxiety), represent a leading cause of human suffering. For depression, anxiety, and alcohol use disorder, we focus on moderate and severe disease states because of variations in the recommended standard of care for cases that are diagnosed as
| Condition | No. of Diagnoses | No. Untreated (% untreated among diagnosed)a |
|---|---|---|
| Hypertensionb | 471.7 | 326.2 (49.7) |
| Diabetes mellitus | 164.1 | 55.3 (33.7) |
| Depression | 234.9 | 90.9 (38.7) |
| Anxiety | 163.9 | 58.2 (35.5) |
| Bipolar disorder | 19.9 | 8.1 (40.7) |
| Schizophrenia | 13.2 | 7.6 (57.9) |
| Alcohol use disorder | 45.2 | 8.1 (18.0) |
aFor mental health conditions, this figure is among those aged 15 and up, diagnosed, and seeking care. Depression, anxiety, and alcohol use disorder are limited to moderate or severe cases; mild cases are excluded because of variations in the standard of care. We are not able to account for comorbidity of mental health conditions and therefore present number of diagnoses as opposed to number of people diagnosed.
bPopulation over age 15.
| Treatment Indicator | Quality-Related Deaths | Years of Life Lived with Disability |
|---|---|---|
| Lung cancer | 0.13 | — |
| Acute myocardial infarction (AMI) | 0.10 | — |
| Heart failure | 0.62 | — |
| Ischemic stroke | 0.18 | — |
| Hemorrhagic stroke | 0.02 | — |
| Chronic obstructive pulmonary disease (COPD) | 1.0 | — |
| Injury and trauma | 2.1 | — |
| Diabetes mellitus | — | 13.1 |
| Depression | — | 44.6 |
| Anxiety | — | 17.9 |
| Bipolar disorder | — | 3.3 |
| Schizophrenia | — | 5.0 |
| Alcohol use disorder | — | 4.2 |
| Total | 4.15 | 88.1 |
NOTE: See Table 4-6.
mild. Across the mental health conditions examined, there were a projected 477 million diagnoses among adults, 206 million of whom sought care, and 173 million of whom were not retained in treatment. Nearly 150 million people with a diagnosis of depression or anxiety were untreated, resulting annually in 44.6 million YLD and 17.9 million YLD, respectively. Ineffective treatment for bipolar disorder and schizophrenia resulted in 3.3 and 5.0 million YLD, respectively. In addition, 8.1 million people who sought care for moderate or severe alcohol use disorder were not retained in treatment, leading to 4.2 million YLD annually.
Annually, of the 164.1 million people diagnosed with diabetes in LMICs, 33.7 percent were not being treated with insulin or oral medication, and 50 percent of people with a diagnosis of hypertension were not on any medication. Injury and trauma contributed the greatest number of quality-related deaths, at 2.1 million annually, followed by chronic obstructive pulmonary disease (COPD) (1 million), heart failure (620,000), ischemic stroke (180,000), lung cancer (130,000), and hemorrhagic stroke (20,000). In total, 831 million people were untreated for diagnosed conditions, resulting in 111.2 million YLD annually. More than 4 million quality-related deaths from NCDs were attributable to ineffective care each year.
Maternal and Child Health
In LMICs, 71 percent of births are attended, compared with 99.4 percent of births in high-income countries. Estimated annual maternal and neonatal deaths among women with a birth attended by a skilled health professional are presented in Table 4-8. There are an estimated 462,131 quality-related neonatal deaths and 43,602 quality-related maternal deaths in LMICs annually.
NCDs That Are Also Risk Factors for Other NCDs
While the conditions discussed above are representative of the leading causes of human suffering, one area that is more challenging to quantify with this methodology is the burden of disease for NCDs that are disease states themselves but also risk factors for other NCDs. Such NCDs are often chronic and may serve as an effect modifier for other conditions. One example is hypertension (see Box 4-2).
Person-Centeredness
Delivering person-centered care requires “providing care that is respectful of and responsive to individual patient preferences, needs, and values and ensuring that [these] values guide all clinical decisions” (IOM, 2001, p. 6). Aside from being a cross-cutting component of quality in its own right, person-centeredness also impacts other aspects of quality. For example, poor experience with the health system is believed to have a significant impact on patients’ care-seeking behavior, loss to follow-up, and unnecessary spread of disease. To address person-centeredness, this section examines both how it is currently measured and what the state of person-centered care across health systems is. However, while there is growing consensus globally that person (or patient)-centeredness should be measured and improved, there is much less clarity on what this actually means or how best to measure it, let alone achieve it. However, many international partners, including the Organisation for Economic
| Indicator | Quality-Related Deaths |
|---|---|
| Neonatal mortality (attended) | 462,131 |
| Maternal mortality (attended) | 43,602 |
Co-operation and Development (OECD), are working to advance and standardize these types of measures (Berwick et al., 2017). This lack of clarity on measures is reflected in the variability of strategies used to collect data on person-centeredness.
To measure the state of person-centered care, we reviewed existing national and international databases that include data on people’s experience with the health system, measured over the past decade (such as the DHS Service Provision Assessment). This review was supplemented by a systematic review of the published literature to identify any publications on additional survey tools or data sources (often with smaller sample sizes, limited to one geographic area, etc.). This review included instruments recording experience as reported by the general population, system experts, providers, and patients (detailed methods are outlined in Appendix D). While the reviews were focused on people who have interacted with the health system, content collected through survey tools and other data collection strategies spans topics relevant to the whole person, the person’s family, and aspects of person-centered care beyond the clinical interaction.
The published literature includes research across 30 LMICs over the past decade. Of these studies, 11.3 percent assess person-centeredness in private
facilities, 45.1 percent in inpatient or hospital-based settings, 12.7 percent in rural facilities, and 14.1 percent for HIV services specifically. Primary clinical areas of focus include TB, cancer care, gynecology, emergency care, and diabetes. Only one study (in Pakistan) looks at person-centeredness in mental health care, as assessed by patients themselves. For these studies, a range of tools were used, 24 percent of which had previously been validated and more than 75 percent of which were newly developed, or had components that were newly developed, for the context in which they were employed. There were 12 countries for which no database data were available but that were represented in the literature.
Included studies look at “overall experience,” a global rating of patients’ (or in cases of pediatric care, caregivers’) assessment of their care. With regard to actual ratings of care, there was significant variation across countries (see Figure 4-2). Levels of dissatisfaction ranged from 2.2 percent (United Kingdom) to 54.3 percent (Vietnam). Additional questions, such as assessment of disrespect, abuse, communication, engagement in decision making, and other aspects of person-centeredness, are represented throughout the published literature and often analyzed through factor analysis to assess the extent to which each question related to patients’ overall rating of their care experience. However, the variability across countries should be interpreted with caution, as questions and sampling of respondents differ across tools.
The databases and included studies encompass many aspects of person-centeredness in addition to overall ratings. For example, similar to surveys in high-income countries, 23.9 percent of studies included in this review look at issues of communication, and 25 percent analyze respect or disrespect. Other items include privacy, perceived engagement of providers, and abuse, among others.
Timeliness
Lack of timely care can negatively affect patients emotionally and physically, in addition to increasing treatment costs. Timely care refers to care that is provided promptly, and minimizes waiting times and potentially harmful delays for both patients and providers (IOM, 2001). In this report, timeliness is considered in terms of the prevalence of patients reporting a lack of timely, prompt care in terms of either
- excessive waiting times; or
- lack of receipt of processes of timely care, which is associated with improved outcomes (see Box 4-3).
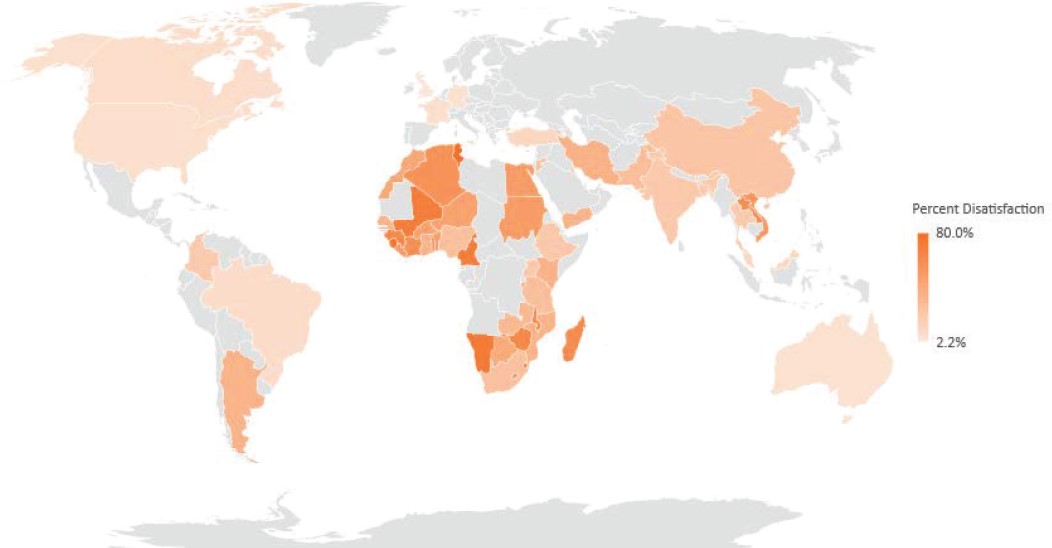
NOTE: Grey color in the map indicates regions where data were not available for analysis.
SOURCES: Systematic review of the literature in low- and middle-income countries, Service Provision Assessment & Commonwealth Fund International Health Policy Survey (see the discussion of methodology in Appendix D).
There are existing efforts to collect comparable data on patient perceptions of timeliness. Examples include the International Development Bank’s (IDB’s) Public Opinion Health Policy Survey; the OECD Health Care Quality Indicator Project; and the Service Provision Assessment component of the DHS, which collects data on problems with health facility wait time for 10 countries, with an average satisfaction rate of 67 percent.
To augment this work, and assess whether and how timeliness is being captured in the literature, the same methods were applied as for patient-centeredness (see Appendix D). Table 4-9 presents selected information on satisfaction with wait times presented in the academic literature over the past decades. Again, comparability is limited across countries, since questions are posed differently based on the tool used and since the definitions of waiting time or satisfaction vary.
The burden of preventable death as measured for a selection of vaccine-preventable conditions is presented in Table 4-10. These deaths are accrued among people who receive poor-quality care because they are not able to
TABLE 4-9 Patient-Reported Data on Satisfaction with Wait Time by Country, Published Literature
| Country | Framing Within Survey Tool | % of Patients |
|---|---|---|
| Trinidad and Tobago |
|
58 |
| Ethiopia |
|
26 |
|
43 | |
| Kenya |
|
40 |
| South Africa |
|
38 |
| Tanzania |
|
54 |
| Uganda |
|
63 |
|
72 | |
| Iran |
|
26 |
|
24 | |
|
19 |
| Vaccine-Preventable Condition | Quality-Related Deaths* |
|---|---|
| Hepatitis B | 427,026a |
| Whooping cough | 80,449 |
| Haemophilus influenzae | 29,948 |
| Rotavirus (under 5 years) | 212,836 |
| Tetanus | 42,168 |
| Measles | 87,133 |
| Human papillomavirus (HPV) (cervical cancer) | 57,362 |
| Total | 936,922a |
*Difference between deaths in LMICs and high-income countries.
a This number was revised after the prepublication release.
realize actual coverage in a timely manner that would minimize the risk of dying. Deaths from hepatitis B accounted for the greatest burden of life lost to these conditions (427,0262 deaths annually), followed by rotavirus (212,8362) and measles (87,1332). Hepatitis B, rotavirus, and measles accounted for the most years of life lost (46.8 million), as they affect primarily young children. Vaccine-preventable conditions accounted for 936,9222 deaths annually in total.
Efficiency
Undertreatment may result in greater costs to health systems and individuals down the line if they develop complications that are costly to treat, while overuse, representing the delivery of a service that was unnecessary, will always result in greater cost. Box 4-4 presents a case study focused on one area of overuse that has been documented in the LMIC setting: inappropriate antibiotic prescribing.
Equity
Equity is a cross-cutting concern. Ideally, quality of care should vary little among subgroups according to race, ethnicity, wealth, religion, and so forth. Therefore, variation among subgroups can be used to characterize the extent to which quality care is equitably distributed. In particular, the dimension of equity captures the extent to which patients’ sociodemographic characteristics (such as gender, ethnicity, geographic location, and socioeconomic status) influence the quality of care they receive. In this report, the main variations of interest are those in the burden of poor-quality care borne by populations living in LMICs compared with those in high-income countries. (Chapter 5 includes a breakdown of differences in the burden of ineffective care and patient experience for a subset of fragile states.)
Figure 4-3 illustrates the differences in mortality rates between low- and middle-income and high-income settings for a subset of the effectiveness conditions discussed previously. Across all conditions, the mortality rate attributable to ineffective care in high-income countries is lower than that in LMICs. The greatest difference in mortality rates across the two groups of countries is for heart failure, for which inpatient mortality differs by 9 percentage points. Inpatient mortality for COPD follows closely, with a difference of almost 7 percentage points.
Large differences in mortality for conditions affecting the under 5 years population also are seen. Mortality rates differ by 5.8 percentage points, for example, for diagnosed pneumonia in children under 5 years that remain untreated, with the rate in high-income countries being almost zero (0.2 percent). This differential is followed closely by neonatal mortality among
___________________
2 This number was revised after the prepublication release.
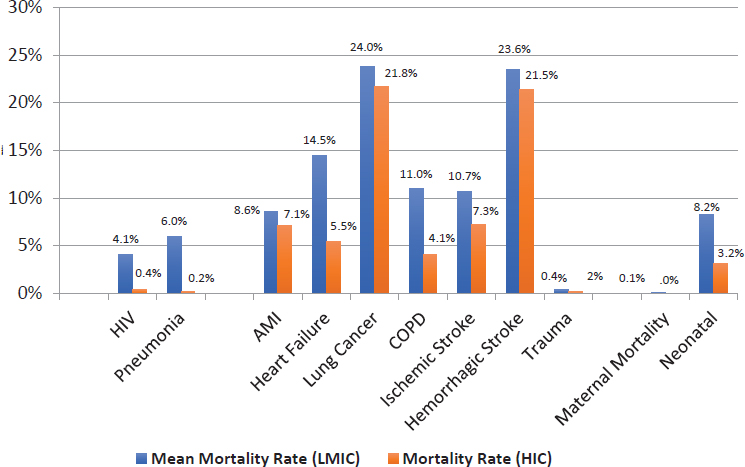
NOTE: AMI = acute myocardial infarction; COPD = chronic obstructive pulmonary disease; HIC = high-income country; HIV = human immunodeficiency virus; LMIC = low- and middle-income country.
children born in the presence of a skilled birth attendant, for which the difference between LMICs and high-income countries is 5.1 percentage points.
The difference in mortality rates among untreated, adherent HIV patients in LMICs and high-income countries is almost 4 percentage points, while the difference in mortality rates for inpatient ischemic stroke and hemorrhagic stroke is about 3.5 and 2.2 percentage points, respectively. The smallest differences are found for lung cancer (2.1 percentage points), acute myocardial infarction (AMI) (1.5 percentage points), trauma (0.2 percentage points), and maternal mortality (0.05 percentage points).
In addition to the gaps in mortality rates across conditions due to poor-quality care, LMICs and high-income countries have very different rates of diagnosis and treatment. Boxes 4-5 and 4-6 illustrate this point by highlighting differences in cervical and breast cancer screening rates across the two groups of countries.
THE BURDEN OF LOW-QUALITY CARE
The focus of this chapter has been on quantifying the burden of poor-quality care for that portion of the LMIC population that has actual cover-
age. In total, the committee estimates that poor-quality care accounts for between 5.74 and 8.47 million deaths per annum and 106,928,005 YLD, or up to 15 percent of the 56.4 million annual deaths in LMICs reported by WHO in 2015 (WHO, 2015b). The bulk of these quality-related deaths are due to ineffective medical care (5.4 million). Unsafe care accounts for 2.6 million deaths, driven mainly by catheter-associated urinary tract infections, which are responsible for 1.6 million of those deaths. The burden of ineffective care is concentrated primarily in NCDs (4.11 million deaths) and trauma (2.1 million deaths), whereas ineffective care for communicable diseases included in this study accounts for 0.8 million deaths.
The majority of YLD due to poor-quality care were incurred by the population living with mental illnesses (79.1 million years), followed by untreated diabetes (13.1 million years), untreated HIV/AIDS (2.5 million years), and untreated TB (0.09 million years). These numbers are likely the lower bounds of the true burden of poor-quality care, as the underlying
data used to construct these estimates are missing for many conditions and the estimates presented here are based on particular conditions and often restricted to a subset of countries.
Figure 4-4 illustrates the burden of ineffective care relative to total deaths for a subset of conditions. Ineffective care is responsible for a burden of death similar to that due to other factors, accounting for an average of approximately 25 percent of deaths caused by each condition overall. However, the proportion varies by individual condition, as does its relation to the overall prevalence of the condition. Whereas poor-quality care accounts for the majority of deaths from COPD (62 percent) and trauma (58 percent), the proportion is smaller for other conditions, such as diarrheal disease (17 percent), maternal mortality (16 percent), lung cancer (14 percent), and hemorrhagic stroke (1 percent), demonstrating how important access to care can be for these conditions.
Based on the variables presented throughout this chapter, the committee estimates the total economic burden of poor-quality care, measured as the cost of lost productivity to society, to be $1.4 to $1.6 trillion annually
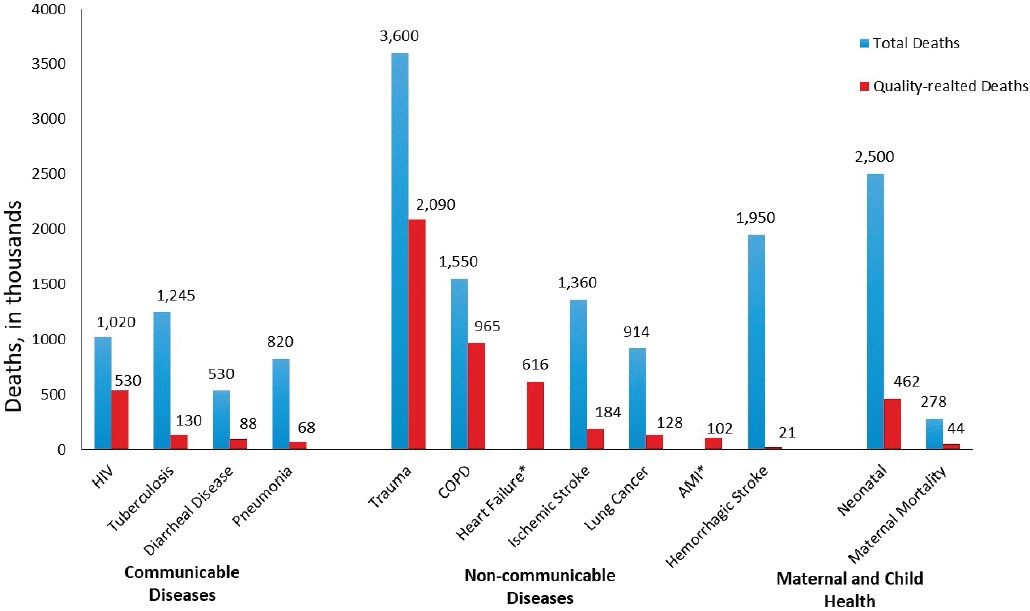
* Total deaths unavailable. NOTE: AMI = acute myocardial infarction; COPD = chronic obstructive pulmonary disorder; HIV = human immunodeficiency virus. SOURCE: Institute for Health Metrics and Evaluation, Appendix D.
(see Annex Tables 4-1 to 4-3 at the end of this chapter). This estimate is conservative, valuing the contribution of a life at 1 times gross national income (GNI) per capita in LMICs and includes years lost to both death (years of life lost, or YLL) and disability (YLD). The lower-cost estimate reflects the low estimates for each underlying variable throughout the chapter (variation in YLL and YLDs for each variable is informed by different estimates of incidence, mortality, and age, among other factors), whereas the high-cost estimate is in turn informed by the high estimates of the underlying variables. The high and low YLL and YLD estimates for each indicator are multiplied by one times GNI per capita to produce the calculated range of $1.4 to $1.6 trillion lost annually as a result of poor-quality care.
Note that this crude estimate of total cost is likely to be limited in many ways. As this range focuses only on the conditions identified above, it will underestimate the cost of poor-quality care more broadly. While these conditions represent the greatest mortality and morbidity burden in LMICs, they do not represent all of the conditions for which high-quality care can save lives or improve the quality of life. In addition, these estimates are based on the assumption that each life year saved would cost society one times GNI per capita. However, this will not be the case for all life years saved—there will be variations across the population.
Also note that this estimate reflects only the costs to countries in terms of the life years lost due to poor-quality care. However, poor-quality care will have other, more direct costs to countries and their health care systems. As noted earlier, for example, an adverse event (in most cases) and overuse (in all cases) will result in additional direct treatment costs to health systems and individuals.
Recently it was estimated that deaths from conditions amenable to high-quality care globally cost LMICs $6 trillion in 2015 (Alkire et al., 2018). This number includes deaths resulting from both poor quality and lack of access to health services for all amenable conditions. Our number builds on this work by examining a more specific component: the cost of poor-quality care, once people have access, for a subset of conditions. According to our estimates, poor quality accounts for approximately 23 to 27 percent of the total value of lost output estimated by Alkire and colleagues (2018).
DATA SOURCES AND LIMITATIONS
For this study, two main data sources were used to estimate the burden of poor-quality health care as defined by the variables outlined above. Where available, data were obtained from national or international databases. Where there was no available database for indicators of interest, estimates were obtained by carrying out systematic reviews of the peer-reviewed published literature over the past decade.
A total of 126 studies were used across the six safety indicators listed earlier in Table 4-1. Of these, 69 included incidence rates of ventilator-associated pneumonia; 14 decubitus ulcers; 23 venous thromboembolisms; 8 adverse drug events; 8 catheter-associated urinary tract infections; and 4 falls. Figure 4-5 illustrates the geographic representation of the published literature from which safety estimates for five of the six indicators (excluding catheter-associated urinary tract infections) were obtained, while Table 4-11 details this distribution by condition for selected countries.
Both Figure 4-5 and Table 4-11 illustrate the lack of available data on quality of care for the vast majority of LMICs, and entire geographical regions, in the peer-reviewed published literature. In some cases, however, such as adverse events and inpatient mortality, the literature was the only source of readily accessible data. Table 4-12 shows data sources for which quality indicators were available to inform the estimates in this chapter. For certain conditions, these databases represent a rich source of information on quality. However, these sources are few. Overall, there is a pressing need for the collection of data on quality of care globally.
VARIABILITY IN QUALITY: WHERE ARE THE GAPS?
Although the lack of quality data for many settings points to the need for more research, the data that are available reveal many variations in the quality of care. One theory advanced to explain this variation, at least in part, is the “know-do” gap introduced in Chapter 2, or the gap between the knowledge providers may have and their ability to apply that knowledge in practice. Evidence-based clinical guidelines provide standards for the provision of health care and are often known by and readily available to clinicians. However, the availability of these guidelines does not guarantee clinicians’ adherence to them, and numerous disparities have been found in their application, leading to patients receiving care that is not evidence-based (Zhao et al., 2017). An observational study in rural India, for example, used vignettes and standardized patients, that is, “trained actors,” to measure the performance of health care practitioners, finding stark differences in the treatments provided. For diarrhea, treatment with oral rehydration salts (ORSs) is commonly available. However, while 72.4 percent of practitioners reported that they would prescribe ORS in a vignette, only 17.4 percent actually offered the treatment to standardized patients presenting with symptoms of diarrhea (Mohanan et al., 2015). In many cases, moreover, whether ORS was being used correctly to actually have an effect on quality was unclear. In another study, measuring the use of clinical audits to monitor quality of care and management of cardiovascular disease (CVD), the authors found a lack of rigorous clinical trials measuring clinical outcomes for CVD, making it difficult to determine the true impact of

NOTES: See Appendix D for methods. Grey color in the map indicates regions where data were not available for analysis.
TABLE 4-11 Number of Studies by Country for Selected Safety Indicators
| Country | Ventilator-Associated Pneumonia | Decubitus Ulcers | Adverse Drug Events | Falls | Venus Thromboembolism |
|---|---|---|---|---|---|
| China | 9 | 2 | 1 | 1 | 15 |
| India | 17 | 0 | 4 | 0 | 0 |
| Brazil | 10 | 4 | 1 | 1 | 1 |
| Nigeria | 0 | 2 | 0 | 0 | 1 |
| Ethiopia | 0 | 0 | 1 | 0 | 0 |
| Thailand | 2 | 0 | 0 | 0 | 0 |
| Other | 31 | 6 | 1 | 3 | 6 |
| Total | 69 | 14 | 8 | 5 | 23 |
| Condition | No. of Low- and Middle-Income Countries (LMICs) Included | Primary Data Source |
|---|---|---|
| HIV | 114 | Joint United Nations (UN) Programme on HIV/AIDS (UNAIDS) AIDSInfo, Institute for Health Metrics and Evaluation (IHME) |
| Tuberculosis (TB) | 138 | World Health Organization (WHO) Global Tuberculosis Report Database, IHME |
| Diarrheal disease | 103 | United Nations Children’s Fund (UNICEF), U.S. Department of Homeland Security (DHS) |
| Diabetes | 55 | International Diabetes Federation, WHO STEPwise approach to surveillance (STEPS) |
| Neonatal mortality | 134 | World Bank DataBank, WHO Global Health Observatory (GHO) |
| Maternal mortality | 134 | UN World Population Prospects (WPP), WHO GHO, WHO BioMedical Admissions Test (BMAT) Model |
| Lung cancer mortality | 139 | World Bank DataBank, WHO GHO, IHME |
care on quality. For LMIC settings, the authors could find no data on clinical audits for evaluation of CVD management (Zhao et al., 2017). Better understanding this know-do gap—especially for such high-burden diseases as diarrhea and CVD—is critical for improving quality. More studies are needed to ascertain which types of interventions are most successful in reducing this gap to increase the availability of high-quality care.
TRACKING PROGRESS IN QUALITY: WHERE ARE THE METRICS?
Health care quality is multifaceted and difficult to measure, but its measurement is essential nonetheless. Structural indicators, such as the numbers of clinics, providers, supplies, and equipment available, are helpful to know but are not true reflections of the quality of care. As health ministers said at a recent meeting, “We need to invest in measures that will help us assess whether our health systems deliver what matters most to people” (OECD, 2017b). Metrics used to measure quality as part of universal health care efforts, especially in LMICs, are stronger if they assess processes, and even better if they measure outcomes. Without good indicators and metrics with which to measure their baseline and progress, health systems will find it extremely difficult to know what is working in what context and where benchmarks should be set. Additionally, embracing the committee’s recommended set of design principles (see Chapter 2) will require metrics that can track rates of improvement over time and progress toward achieving continual quality improvement instead of documenting scores at a point in time. Some successes can be highlighted, and lessons learned from high-income countries with strong quality improvement efforts can inform lower-resource settings so they can more quickly establish the measures needed and their feedback loops.
Patient-Reported Measures
With a growing shift toward increased patient-centeredness in health care and technology advances that make multiple data streams easier to integrate, measures of quality and satisfaction based on patient reports have become more common in health care. Patient-reported outcome measures (PROMs) are tools such as standardized, validated questionnaires used during the perioperative period to measure the efficacy of a clinical intervention from the perspective of the patient, rather than that of the provider (Kingsley and Patel, 2017). Various types of PROMs exist. Generic tools, for example, can measure a broad range of medical conditions to provide a holistic picture of quality of life and the cost-effectiveness of interventions. Disease-specific PROMs, on the other hand, examine individual aspects of a
condition and their impact on a health outcome (Kingsley and Patel, 2017). Sometimes, combinations of patient-reported experience measures (PREMs) and PROMs can be helpful. For many large health systems in high-income countries, PROMs are being lauded as critical assets in real-time clinical care and as essential to measuring and improving the overall care system. Similarly, PREMs collect information on patients’ views on their care experience, illuminating the quality of the dimensions of patient-centeredness and timeliness, as well as social support.
PROMs and PREMs will not be easy to implement globally, either within or across countries. They will require mechanisms for electronic surveys and ways to make the data actionable in real time, even when the workforce is facing increased productivity demands (Wagle, 2017). While PREMs can be useful, a recent systematic review calls for further validation work, especially for their use in emergency departments (Male et al., 2017). Other challenges entail reaching agreement on which indicators to measure (and which methods to use), determining how to ask the right questions, controlling the quality of data collection, avoiding response bias, and reducing survey fatigue (Coulter, 2017).
In an effort to better understand patient experiences globally, OECD commissioned a review of the use of national and international surveys. Based on this and other information-gathering efforts, the OECD Health Care Quality Indicator (HCQI) project developed a population-based survey to identify and share methods for measuring and reporting patient experiences (including PROMs) to improve the quality of indicators (OECD, 2018). The most recent Health at a Glance report, for 2017, includes the following indicators for quality and outcomes of care (for OECD countries) (OECD, 2017a):
- patient experiences with ambulatory care,
- prescribing in primary care,
- avoidable hospital admissions,
- diabetes care,
- mortality following ischemic stroke,
- mortality following acute myocardial infarction,
- hospital mortality rates,
- waiting times for hip fracture surgery,
- surgical complications,
- obstetric trauma,
- care for people with mental health disorders,
- screening, survival, and mortality for breast cancer,
- survival and mortality for colorectal cancer,
- survival and mortality for leukemia in children, and
- vaccinations.
While these indicators would not all be directly applicable to LMIC settings, the committee believes they can help LMICs better understand the varying levels of quality. Identifying the priority indicators for LMICs related to preventive, primary, chronic, and acute care and allowing countries with similar resources or infrastructures to learn from one another would be a valuable step forward.
International Consortium for Health Outcomes Measurement
The International Consortium for Health Outcomes Measurement (ICHOM) was founded in 2012 to address the challenges of variability in measurement and definitions of what matters most to patients across different countries. Global comparisons and learning are difficult without a common language and understanding of measurement. And while process and structure are important components of the Donabedian equation (see Chapter 2), outcomes are the ultimate measure of success in health care. Going beyond purely clinical outcomes in the quest for patient-centered care to understand what life will be like after treatment, surgery, or an illness will be important decision-making information for patients. As of 2018, ICHOM has published standardized metrics and risk-adjusted variables for 23 major conditions covering 50 percent of the global disease burden in developed countries. These metrics are being adopted by more than 650 hospitals and provider organizations around the world (WEF, 2018).
Taking the vision a step further, in 2017 ICHOM began a collaboration with OECD to make patient-centered care the “new normal” in health care systems (ICHOM, 2017). It will begin working toward globally standardized PROMs collected in key disease areas, which can then be aggregated and analyzed to support all levels of health system decision making, increase learning, and move toward value-based care. This large amount of data can allow for a massive increase in the exchange and accessibility of information for learning among countries.
These examples and the number of facilities and organizations already using the standardized measures are evidence that health care leaders are increasingly attempting to tackle the transformation of health care in a systematic way. Thus far, however, these efforts have been limited to OECD countries, and a gap remains in appropriate standards and measures that would apply to LMIC settings. As mentioned previously, leadership will be paramount for filling this gap, not only at the health system level but also at the regional and national levels (WEF, 2018). Such collective action will be necessary to realize the benefits that new care models can deliver.
Testing Indicators in Low-Resource Settings
In his remarks to the committee, Mondher Letaief of WHO’s Eastern Mediterranean Regional Office advocated for the development of appropriate tools for a more comprehensive review of quality at the primary care level, and noted that these tools should be meaningful and foster continuity of care. To advance the development of a tool for assessment of quality, he presented the findings of desk and literature reviews resulting in a multistep validation and expert meeting to pilot a core list of 34 primary care indicators in five countries in the Eastern Mediterranean. The pilots and subsequent consultation revealed great variation in performance among the five countries, demonstrating the need for tailoring of interventions based on the country’s context, a call echoed throughout this report for adapting to local context and culture. During the expert meeting, participants highlighted the importance of communicating the value of these types of indicators to those working on the front lines (EMRO, 2015). Buy-in from health services leadership can help establish a broader quality management strategy and support wider deployment of the indicators and quality assessment tools.
SUMMARY AND RECOMMENDATION
Health care today in all settings and all nations suffers from high levels of poor quality in many dimensions. This global quality chasm prevents patients and communities from reaping the potential benefits of effective care. The current forms, habits, and models of care are incapable of bridging this chasm. Many metrics for measuring quality already exist. These metrics are established, for example, in OECD countries, and are ready and fit for use to support learning and improvement in health care systems in all settings. Although process measurements are valuable, patient and population outcome metrics are much more important. Choosing existing indicators from publicly available resources rather than investing heavily in developing new, local ones can allow health systems in low-resource settings to match or surpass high-resource settings in transparency and knowledge of performance. Excessive measurement, where metrics are chosen because of their ease of calculation as opposed to their utility for assuring and improving quality of care, can be harmful, as demonstrated in many high-income countries. LMICs need not repeat these mistakes. Metrics used for exhortation or reprisal are counterproductive and usually lead to gaming and other behaviors that worsen the quality of care.
Conclusion: While defining and achieving minimum standards, or “quality assurance,” is often appropriate, it is rarely sufficient. Instead,
efforts aimed at improving care over time are more valuable. Proper quality measurement can help assure both a basic standard of care and improvement in that care over time. Maximally useful measurement, whether by health care leaders and policy makers or providers, is intentional, selective, and parsimonious; aligned with core quality improvement goals; and implemented with respect for the implications for culture and effectiveness at the front lines of care.
Recommendation 4-1: Embed and Refine Quality Measurement in Health Care
Nations, regions, and health care organizations should routinely and transparently measure and report on domains of quality, especially their relevant outcomes, to support learning, as well as foster accountability and trust in the health care system.
- Ministries of health and multilateral organizations should maintain ongoing, collective efforts to identify and implement a core set of quality metrics for lower-resource settings (such as those developed by OECD, as well as standards and outcome metrics from the International Consortium for Health Outcomes Measurement) to allow for benchmarking and learning.
- Health care leaders should prioritize patient-reported outcome measures and patient-reported experience measures as well as health outcome metrics for assessing quality whenever possible.
- Governments and organizations should track metrics frequently to assess performance and improvement over time. They should make performance transparent to all parties through such mechanisms as public reporting, and use metrics and co-design with three goals in mind: accountability to patients, building trust in the system, and learning.
REFERENCES
Alkema, L., D. Chou, D. Hogan, S. Zhang, A. B. Moller, A. Gemmill, D. M. Fat, T. Boerma, M. Temmerman, C. Mathers, and L. Say. 2016. Global, regional, and national levels and trends in maternal mortality between 1990 and 2015, with scenario-based projections to 2030: A systematic analysis by the UN maternal mortality estimation inter-agency group. The Lancet 387(10017):462–474.
Alkire, B. C., A. W. Peters, M. G. Shrime, and J. G. Meara. 2018. The economic consequences of mortality amenable to high-quality health care in low- and middle-income countries. Health Affairs 37(6):988–996.
Berwick, D., N. Black, D. Cullen, J. Deerberg-Wittram, L. Degos, B. Diverty, A. Epstein, M.-P. Kieny, B.-I. Larsen, E. Schneider, et al. 2017. Recommendations to OECD ministers of health from the high level reflection group on the future of health statistics: Strengthening the international comparison of health system performance through patient-reported indicators. Paris, France: OECD.
Catarino, R., P. Petignat, G. Dongui, and P. Vassilakos. 2015. Cervical cancer screening in developing countries at a crossroad: Emerging technologies and policy choices. World Journal of Clinical Oncology 6(6):281–290.
CCA (Cervical Cancer Action). 2015. Progress in cervical cancer prevention: The CCA report card 2015. http://www.cervicalcanceraction.org/pubs/CCA_reportcard_low-res_2015.pdf (accessed June 2, 2018).
Coleman, M. P., M. Quaresma, F. Berrino, J. M. Lutz, R. De Angelis, R. Capocaccia, P. Baili, B. Rachet, G. Gatta, T. Hakulinen, et al. 2008. Cancer survival in five continents: A worldwide population-based study (CONCORD). The Lancet. Oncology 9(8):730–756.
Coulter, A. 2017. Measuring what matters to patients. British Medical Journal 356:j816. doi:10.1136/bmj.j816.
da Costa Vieira, R. A., G. Biller, G. Uemura, C. A. Ruiz, and M. P. Curado. 2017. Breast cancer screening in developing countries. Clinics 72(4):244–253.
Daniels, B., A. Dolinger, G. Bedoya, K. Rogo, A. Goicoechea, J. Coarasa, F. Wafula, N. Mwaura, R. Kimeu, and J. Das. 2017. Use of standardised patients to assess quality of healthcare in Nairobi, Kenya: A pilot, cross-sectional study with international comparisons. BMJ Global Health 2(2):e000333. https://gh.bmj.com/content/2/2/e000333 (accessed August 11, 2018).
Das, J., A. Holla, V. Das, M. Mohanan, D. Tabak, and B. Chan. 2012. In urban and rural India, a standardized patient study showed low levels of provider training and huge quality gaps. Health Affairs (Millwood) 31(12):2774–2784.
Das, J., A. Kwan, B. Daniels, S. Satyanarayana, R. Subbaraman, S. Bergkvist, R. K. Das, V. Das, and M. Pai. 2015. Use of standardised patients to assess quality of tuberculosis care: A pilot, cross-sectional study. The Lancet Infectious Diseases 15(11):1305–1313.
Duerden, M., and R. Payne. 2014. Polypharmacy—what is it and how common is it? Prescriber 25(21):44–47.
EMRO (Eastern Mediterranean Regional Office). 2015. Expert consultation on improving the quality of care at primary health care level through the implementation of quality indicators and standards. Cario, Egypt: EMRO, WHO.
Ginsburg, O., F. Bray, M. P. Coleman, V. Vanderpuye, A. Eniu, S. R. Kotha, M. Sarker, T. T. Huong, C. Allemani, A. Dvaladze, et al. 2017. The global burden of women’s cancers: A grand challenge in global health. The Lancet 389(10071):847–860.
ICHOM (International Consortium for Health Outcomes Measurement). 2017. ICHOM and OECD sign letter of intent to collaborate. http://www.ichom.org/news/ichom-and-oecd-sign-letter-of-intent-to-collaborate-on-the-collection-analysis-and-publishing-of-patient-reported-outcomes (accessed April 10, 2018).
IOM (Institute of Medicine). 2001. Crossing the quality chasm: A new health system for the 21st century. Washington, DC: National Academy Press.
Jha, A. K., I. Larizgoitia, C. Audera-Lopez, N. Prasopa-Plaizier, H. Waters, and D. W. Bates. 2013. The global burden of unsafe medical care: Analytic modelling of observational studies. BMJ Quality & Safety 22(10):809–815.
Kearney, P. M., M. Whelton, K. Reynolds, P. Muntner, P. K. Whelton, and J. He. 2005. Global burden of hypertension: Analysis of worldwide data. The Lancet 365(9455):217–223.
Kingsley, C., and S. Patel. 2017. Patient-reported outcome measures and patient-reported experience measures. BJA Education 17(4):137–144.
Male, L., A. Noble, J. Atkinson, and T. Marson. 2017. Measuring patient experience: A systematic review to evaluate psychometric properties of patient reported experience measures (PREMs) for emergency care service provision. International Journal for Quality in Health Care 29(3):314–326.
Mohanan, M., M. Vera-Hernandez, V. Das, S. Giardili, J. D. Goldhaber-Fiebert, T. L. Rabin, S. S. Raj, J. I. Schwartz, and A. Seth. 2015. The know-do gap in quality of health care for childhood diarrhea and pneumonia in rural India. JAMA Pediatrics 169(4):349–357.
OECD (Organisation of Economic Co-operation and Development). 2017a. Health at a glance 2017: OECD indicators. Paris, France: OECD.
OECD. 2017b. Ministerial statement—The next generation of health reforms: OECD health ministerial meeting. http://www.oecd.org/health/ministerial/ministerial-statement-2017. pdf (accessed June 2, 2018).
OECD. 2018. Health care quality indicators—responsiveness and patient experiences. http://www.oecd.org/els/health-systems/hcqi-responsiveness-and-patient-experiences.htm (accessed April 20, 2018).
Sylvia, S., Y. Shi, H. Xue, X. Tian, H. Wang, Q. Liu, A. Medina, and S. Rozelle. 2015. Survey using incognito standardized patients shows poor quality care in China’s rural clinics. Health Policy Plan 30(3):322–333.
Tanahashi, T. 1978. Reprinted from Bulletin of the World Health Organization, 56(2), Tanahashi T., Health Service Coverage and its Evaluation, p. 297.
UN (United Nations). 2017. Sustainable Development Goal 3. https://sustainabledevelopment.un.org/sdg3 (accessed April 15, 2018).
Wagle, N. W. 2017. Implementing patient-reported outcome measures. https://catalyst.nejm.org/implementing-proms-patient-reported-outcome-measures (accessed April 15, 2018).
WEF (World Economic Forum). 2018. Value in healthcare: Mobilizing cooperation for health system transformation. http://www3.weforum.org/docs/WEF_Value_Healthcare_report_2018.pdf (accessed June 2, 2018).
WHO (World Health Organization). 2013a. A global brief on hypertension: Silent killer, global public health crisis. Geneva, Switzerland: WHO.
WHO. 2013b. WHO recommendations on postnatal care of the mother and newborn. Geneva, Switzerland: WHO.
WHO. 2015a. Assessing national capacity for the prevention and control of noncommunicable diseases: Global survey. Geneva, Switzerland: WHO.
WHO. 2015b. NCD mortality and morbidity. http://www.who.int/gho/ncd/mortality_morbidity/en (accessed August 11, 2018).
WHO. 2016. Pregnant women must be able to access the right care at the right time, says WHO. http://www.who.int/news-room/detail/07-11-2016-pregnant-women-must-be-able-to-access-the-right-care-at-the-right-time-says-who (accessed April 15, 2018).
WHO. 2017a. Cardiovascular diseases (CVDs). http://www.who.int/en/news-room/fact-sheets/detail/cardiovascular-diseases-(cvds) (accessed May 20, 2018).
WHO. 2017b. Global surveillance and monitoring system for substandard and falsified medical products. Geneva, Switzerland: WHO.
WHO. 2018a. Breast cancer. http://www.who.int/cancer/prevention/diagnosis-screening/breast-cancer/en (accessed May 20, 2018).
WHO. 2018b. Cervical cancer. http://www.who.int/cancer/prevention/diagnosis-screening/cervical-cancer/en (accessed May 20, 2018).
WHO. 2018c. STEPS country reports. http://www.who.int/ncds/surveillance/steps/reports/en (accessed April 15, 2018).
WHO. 2018d. The top 10 causes of death. http://www.who.int/mediacentre/factsheets/fs310/en/index1.html (accessed May 20, 2018).
Willoughby, B. J., K. Faulkner, E. C. Stamp, and C. J. Whitaker. 2006. A descriptive study of the decline in cervical screening coverage rates in the north east and Yorkshire and the Humber regions of the UK from 1995 to 2005. Journal of Public Health 28(4):355–360.
Zhao, M., I. Vaartjes, K. Klipstein-Grobusch, K. Kotseva, C. Jennings, D. E. Grobbee, and I. Graham. 2017. Quality assurance and the need to evaluate interventions and audit programme outcomes. European Journal of Preventive Cardiology 24(3 Suppl.):123–128.
| Safety Event | Deaths (low and high range estimates) | Years of Life Lost (YLL) (low and high range estimates) | Years of Life Lived with Disability (YLD) (low and high range estimates) |
|---|---|---|---|
| Adverse drug events | $1,041 (828–1,241) |
$33,580 (30,879–45,719) |
$800 (637–955) |
| Falls | $190 (183–199) |
$5,844 (5,549–6,117) |
$1,304 (1,253–1,362) |
| Catheter-associated urinary tract infection | $7,613 (7,268–7,955) |
$140,843 (134,452–147,164) |
$634 (606–663) |
| Ventilator-associated pneumonia | $295 (259–338) |
$13,103 (11,463–15,286) |
$79 (70–91) |
| Ulcers | $1,118 (1,028–1,211) |
$28,651 (26,255–31,541) |
$8,032 (7,381–8,693) |
| Venous thromboembolisms | $1,972 (1,775–2,188) |
$60,618 (54,025–67,529) |
$5,258 (4,733–14,003) |
| Total | $12,229 (11,341–13,132) |
$282,639 (262,623–313,356) |
$16,107 (14,680–25,767) |
NOTE: Variance, or high and low estimates, is informed by variation in estimated incidence, mortality, and age for the underlying indicators (which are presented throughout this chapter).
| Communicable Disease | Deaths (low and high range estimates) | Years of Life Lost (YLL) (low and high range estimates) | Years of Life Lived with Disability (YLD) |
|---|---|---|---|
| HIV | $2,474 | $122,539 | $1,881 |
| Diarrheal disease (under 5 years) | $413 | $33,490 | — |
| Tuberculosis (TB)* | $526 (463–588) |
$38,328 (33,784–42,871) |
$1,002 |
| Pneumonia (under 5 years) | $315 (306–324) |
$25,526 (24,828–26,306) |
— |
| Total | $3,728 (3,656–3,799) |
$219,883 (214,641–225,206) |
$2,883 |
NOTES: In addition to sources of variation described above, for certain indicators (such as TB), variation is informed by estimates from different sources of mortality (e.g., range of estimates in how comorbidity with HIV might impact TB survival).
*TB is an estimate of absolute cost as opposed to excess cost (compared with high-income countries) because of the low prevalence of TB in high-income contexts; all costs can be roughly assumed to be “excess” for LMICs.
| Noncommunicable Disease | Deaths (low and high range estimates) | Years of Life Lost (YLL) (low and high range estimates) | Years of Life Lived with Disability (YLD) |
|---|---|---|---|
| Lung cancer | $607 | — | — |
| Acute myocardial infarction | $474 (66–593) |
$10,443 (1,462–13,061) |
— |
| Heart failure | $2,875 (565–3,084) |
$63,280 (12,446–67,888) |
— |
| Ischemic stroke | $856 (208–1,193) |
$12,487 (3,045–17,402) |
— |
| Hemorrhagic stroke | $96 (23–134) |
$1,850 (451–2,578) |
— |
| Chronic obstructive pulmonary disease | $4,503 (572–7,212) |
$37,440 (4,758–59,956) |
— |
| Injury and trauma | $9,776 | $451,145 | — |
| Diabetes mellitus | — | — | $120,394 |
| Depression | — | — | $208,918 |
| Anxiety | — | — | $83,504 |
| Bipolar disorder | — | — | $15,602 |
| Schizophrenia | — | — | $23,359 |
| Substance abuse | — | — | $19,502 |
| Total | $19,187 (11,817–22,480) |
$576,645 (473,307–612,030) |
$470,383 |
NOTE: As in Annex Tables 4-1 and 4-2, variance, or high and low estimates, is informed by variation in the underlying indicators presented throughout this chapter.


