
10
Energy and Emissions Impacts of Non-Petroleum Fuels in Light-Duty Vehicle Propulsion
Automakers are planning for a passenger vehicle fleet that will be predominantly powered with non-petroleum fuels, including electricity, hydrogen, and low-carbon synthetic fuels. This chapter describes the potential for non-petroleum fuels to provide larger amounts of energy for light-duty vehicle propulsion and the resulting impacts of using such fuels. Specifically, the chapter addresses the opportunities and challenges of using these fuels to provide power for light-duty transportation needs, the possible developments for these fuels in 2025–2035, and the impacts of the fuels on energy use and emissions. The chapter includes findings and recommendations about the use of alternative fuels in 2025–2035, as well as a discussion of their treatment in energy efficiency regulations.
10.1 INTRODUCTION
The source of energy to power light-duty vehicles has been predominantly petroleum fuel since the first long-distance internal combustion engine (ICE) vehicles were produced in the late 19th century. In the most recent 2019 data, approximately 90% of the energy to power light-duty transportation is in the form of gasoline or diesel, with the remainder being primarily ethanol and other biofuels blended with petroleum fuels (Davis and Boundy, 2020). Petroleum is an easily transported, easily transferred liquid with high energy density, providing some of the most efficient energy per volume and energy per mass of any energy carrier. Historically, gasoline and diesel have been inexpensive and readily available, making them ideal for energy consumption onboard a vehicle. Despite these advantages, petroleum fuels continue to have disadvantages in combustion-related greenhouse gas (GHG) and criteria emissions and also have limits to efficiency given their onboard combustion in engines. Light-duty vehicles contribute about 16% of U.S. GHG emissions (EPA, 2020a), nearly all from fuel combustion on board the vehicle.
Although petroleum fuels have dominated vehicle propulsion, additional fuel options have provided varying shares of energy capacity for on-road passenger transportation over time. Ethanol (notably at 10%, 15%, and 85% blends), biodiesel, propane, and natural gas have all been used in ICEs. Current research efforts are developing low-carbon synthetic “drop-in” fuels that would have the same or improved combustion properties as gasoline or diesel fuel but lower life cycle GHG emissions. Electricity and hydrogen are also increasingly being used to propel vehicles using motors, batteries, power electronics, and in the case of hydrogen, fuel cells. Some vehicles have been designed to use only one type of fuel, such as dedicated natural gas or electric fuel, and some have
been designed for a fuel mix, such as E85, mixed gasoline and ethanol, or for fuel switching, such as plug-in hybrid electric vehicles (PHEVs). Today, biofuels represent the most significant alternative fuels used in light-duty vehicles, with approximately 10% of the energy used by vehicles being ethanol blended into gasoline. Natural gas and electricity for vehicle propulsion each represent less than 1% of the energy used by the U.S. light-duty fleet (Davis and Boundy, 2020; DOE-EIA, 2020).
The motivations for using alternative fuels have varied with fuel and technology capability, the price of fuel, as well as incentives for reduced petroleum use, improved energy efficiency, reduced emissions, and greater use of domestically produced fuel. For example, with developments like longer-range battery electric vehicles (BEVs) and technologies that enable biofuel use, alternative fuels are better able to meet light-duty transportation needs. The development of low-carbon synthetic fuels, although primarily aimed at decarbonizing hard-to-electrify transport such as aviation and long-haul freight, could also benefit light-duty vehicles by decarbonizing vehicle use, especially for the legacy combustion fleet. However, widespread penetration of alternative fuels will depend highly on their cost in comparison to that of petroleum. Continued research and development (R&D) on enabling technologies and/or economic incentives for low-carbon processes could allow alternative fuels to become cost-competitive with gasoline and diesel (Davis et al., 2018; De Luna et al., 2019).
The motivation for fueling vehicles with energy stores other than petroleum can be attributed in part to their potential to increase the vehicle’s energy efficiency, dramatically reduce transportation criteria and GHG emissions to the atmosphere, and decrease total system energy use. These reductions in GHG emissions arise from reducing the combustion of fossil carbon, both off and on board the vehicle. Onboard, fuel-based GHG emissions are primarily from combustion of carbon-based fuels in engines. Offboard, fuel-based GHG emissions are called upstream emissions, and include the GHG emissions associated with all of the processes to make, transport, and store the fuel before it is used on board the vehicle. Biofuels and low-carbon synthetic fuels contribute to the goal of reducing total fuel-based GHG emissions to varying degrees, depending on their upstream emissions, which include emissions from feedstock recovery, fuel production, and the transportation, storage, and distribution of both feedstock and fuel. Switching away from onboard combustion entirely, for instance by using battery electric power to drive motors or hydrogen to power fuel cells, not only reduces onboard emissions (often effectively to zero) but generally also reduces net emissions on a well-to-wheels basis, given that electric propulsion also provides efficiency gains that reduce overall transportation energy consumption, and the electric grid is often cleaner than onboard combustion. Nonetheless, these advantages for electric propulsion in higher energy efficiency and decreased emissions are often accompanied by challenges of lower energy density and a nascent fueling infrastructure, as discussed further below and in Chapters 5 and 6.
This chapter focuses on emerging alternative fuels, specifically electricity,1 hydrogen, and low-carbon synthetic fuels, rather than more widely implemented alternative fuels like ethanol. All of these fuels have the potential for reduced GHG emissions relative to gasoline and diesel, and alternative-fuel vehicles can have decreased energy use compared to conventional vehicles. However, the relationships between these metrics of energy efficiency, GHG emissions, and petroleum consumption are complex, vary by fuel and powertrain, and require life cycle analyses of the fuel-vehicle system, as detailed in Section 10.3. In evaluating the current and future incorporation of these fuels in the light-duty fleet, this chapter considers both technology developments and regulatory issues. Findings and recommendations about the use of these emerging alternative fuels in 2025–2035 are provided.
10.2 ELECTRICITY, HYDROGEN, AND LOW-CARBON SYNTHETIC FUELS
The sections below describe the current technology for generating and using electricity, hydrogen, and low-carbon synthetic fuels, as well as the implications of their use onboard vehicles for fuel consumption, energy consumption, GHG emissions, fueling cost, vehicle cost, fuel infrastructure, and fuel production. Table 10.1 summarizes some key metrics for each alternative fuel in comparison to conventional gasoline and diesel fuels. Note that some upstream fuel production processes emissions are reduced using carbon capture and storage (CCS).
___________________
1 While electricity is, strictly speaking, an energy carrier and not a fuel, it is considered as an alternative fuel throughout this report, in line with the definition of alternative fuels provided in the Energy Policy Act of 1992 (see Section 10.3.1).
TABLE 10.1 Comparison of Vehicle Energy Sources, Including Gasoline, Electricity, Hydrogen, and Low-Carbon Liquid Fuels
| Fuel | Gasoline with 10% Ethanol | Conventional Diesel | Electricity | Hydrogen | Low-Carbon Liquid Fuels | ||
|---|---|---|---|---|---|---|---|
| Example vehicle | 2019 Toyota Camry | 2019 Chevrolet Cruze | 2019 Chevrolet Bolt | 2020 Hyundai Nexo | 2020 Hyundai Nexo | 2019 Chevrolet Cruze Diesel | 2019 Toyota Camry |
| Example fuel | U.S. average gasoline | U.S. average diesel | U.S. average grid | Fossil-fuel derived H2a | Low-carbon H2b | Synthetic low-carbon Fischer-Tropsch dieselc | Co-Optima isobutanol (20% blend in gasoline) |
| On-board fuel consumption (unit relevant to fuel type) | 0.029 gal/mid | 0.027 gal/mid | n/a | 0.018 kg/mid | 0.018 kg/mid | 0.027 gal/mid | 0.028 gal/mie |
| Well-to-wheels energy use (kWh/mi)f | 1.23 | 1.22 | 0.55 | 0.91 | “blue” H2: 0.94 “green” H2: 0.96 | GTL w/CCS: 1.74 “e-fuel”: 3.65 | 1.22g |
| Vehicle operation energy use (kWh/mi)h | 0.97 | 1.03 | 0.28 | 0.58 | 0.58 | 1.03 | 0.94g |
| Well-to-wheels GHG emissions (g/mi)i | 315 | 338 | 124j | 197 | “blue” H2: 57 “green” H2: 36 | GTL w/CCS: 323 “e-fuel”: 4 | 272g |
| Tailpipe GHG emissions (g/mi)k | 256 | 281 | 0 | 0 | 0 | GTL w/CCS: 271 “e-fuel”: 263 | 247g |
| Feedstock GHG emissions (g/mi)l | 5 | 28 | 12 | 13 | “blue” H2: 13 “green” H2: 0 | GTL w/CCS: 27 “e-fuel”: −260 | −18 |
| Fuel GHG emissions (g/mi)m | 54 | 29 | 112 | 184 | “blue” H2: 44 “green” H2: 36 | GTL w/CCS: 24 “e-fuel”: 1 | 43 |
| Fueling cost per 12,000 miles | $901n | $988o | $437p | $3,538q | >$3,538q | GTL w/CCS: $1470r “e-fuel”: >$1470r | $2,024s |
| Vehicle component costs in 2025–2035 relative to ICE vehicle | Same as ICE | Same as diesel | $6,116t | $8,581u | $8,581u | Same as diesel | Same as ICE |
| Fuel production infrastructure | Existing international petroleum drilling, refining transportation infrastructures | Existing international petroleum drilling, refining transportation infrastructures | Existing electrical generation, transmission, and distribution facilities with possible capacity expansion | Existing facilities for steam methane reforming; new hydrogen transportation infrastructures | Expansion of electrolysis and/or CCS capabilities; new hydrogen transportation infrastructures | New synthetic fuel inputs, fuel synthesis facilities, and transportation infrastructures | New biological inputs, fuel synthesis facilities, and transportation infrastructures |
| Fuel | Gasoline with 10% Ethanol | Conventional Diesel | Electricity | Hydrogen | Low-Carbon Liquid Fuels | ||
|---|---|---|---|---|---|---|---|
| Fuel use and distribution infrastructure | Existing gas station model | Existing gas station model | New fueling infrastructure for private and public fueling | New fueling infrastructure | New fueling infrastructure | Existing gas station model | Existing gas station model with possible updates based on fuel properties |
a Defined as gaseous hydrogen produced in central plants by steam reforming of natural gas.
b Example fuels are “blue” and “green” hydrogen. “Blue” hydrogen defined as gaseous hydrogen produced in central plants by steam reforming of natural gas with carbon capture and storage (90% CCS rate). “Green” hydrogen defined as gaseous hydrogen produced in central plants by electrolysis with electricity from solar photovoltaics.
c Example fuels are gas-to-liquid Fischer-Tropsch diesel with carbon capture and storage (GTL w/CCS) and “e-fuel,” produced using H2 from solar electrolysis and corn ethanol by-product CO2. GTL w/CCS uses energy input from U.S. average grid electricity, and “e-fuel” uses energy input from renewable electricity.
d Value from www.fueleconomy.gov (DOE/EPA, n.d.), includes assumptions from Alternative Fuels Data Center.
e Estimated as 3.3% more efficient than engine with conventional gasoline, per default parameters in GREET1_2020rev1 for a Co-Optima vehicle with 20% isobutanol blend in gasoline (ANL, 2021).
f Total energy use from GREET1_2020rev1 Model (ANL, 2021) converted from Btu/mile to kWh/mile, unless otherwise noted. These values include energy use for feedstock recovery, transportation, and storage; fuel production, transportation, storage, and distribution; and vehicle operation. Fuel economy inputs are the combined adjusted fuel economy values for the relevant example vehicle (2019 Toyota Camry, 2019 Chevrolet Cruze, 2020 Hyundai Nexo) from the EPA/DOE Fuel Economy Guide dataset, unless otherwise noted.
g Per default parameters in the GREET1_2020rev1 Model (ANL, 2021) for a Co-Optima vehicle, the fuel economy input is 103.3% of the baseline gasoline vehicle value (in this case, the combined adjusted fuel economy value for the 2019 Toyota Camry from the EPA/DOE Fuel Economy Guide dataset).
h Vehicle operation energy use values from GREET1_2020rev1 Model (ANL, 2021) converted from Btu/mile to kWh/mile, unless otherwise noted. Fuel economy inputs are the combined adjusted fuel economy values for the relevant example vehicle (2019 Toyota Camry, 2019 Chevrolet Cruze, 2020 Hyundai Nexo) from the EPA/DOE Fuel Economy Guide dataset, unless otherwise noted.
i Includes tailpipe emissions and emissions from feedstock (recovery, transportation, and storage) and fuel (production, transportation, storage, and distribution); from GREET1_2020rev1 Model (ANL, 2021) using combined adjusted fuel economy values for example vehicles (2019 Toyota Camry, 2019 Chevrolet Cruze, 2020 Hyundai Nexo) from the EPA/DOE Fuel Economy Guide dataset as input, unless otherwise noted.
j If input is 100% renewable electricity rather than U.S. average grid electricity, well-to-wheels emissions are approximately 0 g/mi.
k Emissions from fuel combustion onboard the vehicle calculated with GREET1_2020rev1 Model (ANL, 2021) using combined adjusted fuel economy values for example vehicles (2019 Toyota Camry, 2019 Chevrolet Cruze, 2020 Hyundai Nexo) from EPA/DOE Fuel Economy Guide dataset as input, unless otherwise noted.
l Emissions associated with feedstock recovery, storage, and transportation; from GREET1_2020rev1 Model (ANL, 2021), with default inputs for each example fuel type unless otherwise noted (see footnotes a–c).
m Emissions associated with fuel production, storage, transportation, and distribution; from GREET1_2020rev1 Model (ANL, 2021), with default inputs for each example fuel type unless otherwise noted (see footnotes a–c).
n Calculated using U.S. national average gasoline price in January 2020 of $2.59/gallon (DOE, 2020a).
o Calculated using U.S. national average diesel price in January 2020 of $3.05/gallon (DOE, 2020a).
p Calculated using U.S. national average price of electricity from (AFDC, 2020).
q Calculated using average retail price of hydrogen from Q4 2018 – Q3 2019, reported by the California Energy Commission (CEC/CARB, 2019). Price likely higher for “green” or “blue” hydrogen given their higher production costs.
r Projected dispensed cost of gas-to-liquid Fischer-Tropsch diesel with CCS in 2025 reported in Elgowainy et al. (2016), converted from 2013$ to 2019$. Cost for “e-fuel” likely higher given the higher production costs of renewable H2 and corn ethanol by-product CO2.
s State-of-technology minimum fuel selling price from Cai et al. (2018), updated from 2014$ to 2019$.
t Estimated combined cost of battery, motor, and inverter for 200-mile BEV in small car class in 2025; see Chapter 5.
u Estimated combined cost of fuel cell system, battery, motor, and H2 storage tank for fuel cell vehicles in the small SUV class in 2025; see Chapter 6.
10.2.1 Electricity
Electrical energy can be very efficiently transformed into vehicle movement using motors, with approximately 60%–73% of the electrical energy stored on board a vehicle transferred to the wheels (DOE, 2020b). In comparison, about 12%–30% of gasoline’s energy is provided to the wheels in ICE vehicles, and 21%–40% of gasoline’s energy is provided to the wheels in hybridized powertrains (DOE, 2020b). (On a well-to-wheels basis, electric vehicles [EVs] show less efficiency benefit, with an energy conversion efficiency of approximately 30%–36%, compared to 9%–24% for ICE vehicles and 16%–31% for hybrid vehicles.2) Some vehicles use electricity exclusively (BEVs), and some vehicles can switch between using electricity and petroleum fuels (PHEVs). The necessary technologies for using electricity on board vehicles, including electric motors, batteries, and power electronics, and the infrastructure requirements for EV deployment, are discussed in Chapter 5. This chapter focuses on the production and use of low-carbon electricity to power light-duty vehicles.
10.2.1.1 Electricity Production
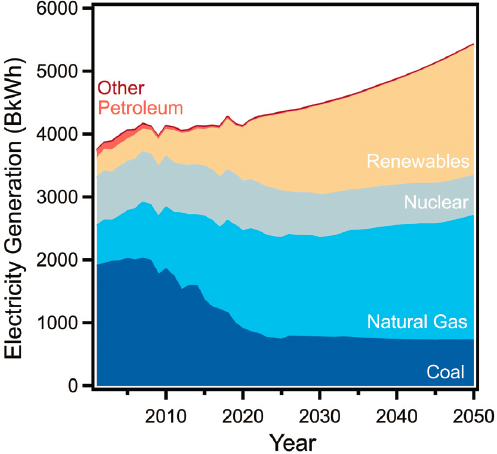
Electric propulsion systems use less energy than combustion engine powertrains and produce zero emissions onboard the vehicle. When considering overall energy use of the transportation system, the energy and emissions used in generating grid electricity must be taken into account, especially if EVs become a significant share of the fleet, since that would lead to substantial increases in electricity use in transportation. Emissions from the U.S. grid have been decreasing in recent years, and the most current data available indicate a nationwide average of 433 grams of carbon dioxide equivalent per kilowatt-hour (gCO2e/kWh) in 2018, down from 517 gCO2e/kWh in 2012, or an average decline of 12 gCO2e/kWh per year (EPA, 2020b). This decrease can be largely attributed to a shift from coal to natural gas fueled generation and an increasing share of renewable electricity generation. In 2019, the majority of U.S. electricity generation came from fossil fuels, 23% from coal and 38% from natural gas. Nuclear power accounted for 20% of electricity generation, renewables contributed 17%, and other sources produced the remaining 1% (EIA, 2020c). At the current average emissions rate, EV propulsion typically emits less than a conventional ICE vehicle on a well-to-wheels basis (see Table 10.1). A future U.S. grid in 2025–2035 is likely to be lower emitting than the 2019 grid, primarily owing to projected reductions in electricity generation from coal and increases in electricity generation from wind and solar (see Section 10.2.1.3).
10.2.1.2 Electricity Enabling Technology and Commercialization Needs
Increased deployment of EVs will be enabled primarily by advancements in battery technologies, improvements in charging infrastructure, changes to consumer behavior, and new policies and regulations, as discussed in Chapters 5, 11, and 12. Unlike other alternative fuel options, electricity can already be produced on a commercial scale; however, further efforts are required to decrease grid emissions and make electricity a truly low-carbon fuel option on a well-to-wheels basis in all regions of the United States. Technologies that enable low-carbon electricity generation are, for the most part, already mature and include wind turbines, solar PV, hydroelectric power plants, and nuclear power plants. Decarbonizing electricity generation will rely on increasing the capacity of those technologies. Additionally, owing to the intermittency of renewable energy sources like wind and solar, continued investment in research, development, and deployment for energy storage could help to improve the reliability and economics of a low-carbon grid. Current and emerging energy storage technologies include pumped hydro, compressed air, lithium-ion batteries, flow batteries, solid-state batteries, thermal storage, chemical storage (e.g., hydrogen), and flywheels (Zablocki, 2019). Fuel synthesis powered by renewable electricity, as described in later sections of this chapter, could also act as a sort of storage for intermittent renewable electricity if the fuel production methods do not require constant operation and if the capital costs for intermittently used equipment remain economic.
___________________
2 Calculated using well-to-pump efficiency values for E10 gasoline (78.8%) and U.S. average electricity mix (49.9%) from Argonne National Laboratory’s GREET1_2020rev1 Model.
SOURCE: Committee generated using data from EIA (2020a).
10.2.1.3 Electricity Potential in Medium to Long Term
The U.S. Energy Information Administration estimates that the grid in 2025 and 2035 will produce approximately 77% and 74%, respectively, of the GHG emissions per kWh as the 2019 grid (EIA, 2020a) (Figure 10.1). Incorporating policies aimed at achieving net-zero carbon emissions by mid-century would result in further reductions in average U.S. grid emissions during 2025–2035, since these scenarios often prioritize decarbonization of the electric grid in the near-term (DOE, 2017; Lawson, 2018; Mahajan, 2019; Larson et al., 2020; NASEM, 2021). Such reductions in grid emissions would further incentivize the use of electricity as a vehicle fuel by decreasing the well-to-wheels emissions of EVs, which already benefit from higher drivetrain efficiency and lower tailpipe emissions relative to petroleum-fueled vehicles. Ultimately, electrification of the light-duty fleet, and hence electricity use in transportation, will depend on many factors, including build-out of the charging infrastructure, changes to consumer behavior around vehicle fueling, and adoption of policies to incentivize the manufacturing and purchase of EVs. However, given the considerable efforts to increase efficiency and reduce well-to-wheel GHG emissions, the use of electricity as a vehicle fuel is expected to significantly increase in 2025–2035.
FINDING 10.1: Technologies for the generation of low-carbon electricity are already mature. They are increasingly becoming cost-effective and more widely deployed, which will help to decarbonize the electric grid and reduce well-to-wheel greenhouse gas emissions from electric vehicles. Large-scale storage of renewable electricity remains a challenge.
10.2.2 Hydrogen
Total global demand for hydrogen (H2) is around 115 million metric tons per year. Around 70 million metric tons of pure hydrogen are used per year in oil refining and ammonia production for fertilizers, and another 45 million metric tons per year are used in industrial processes that do not require hydrogen to be separated from other gases (IEA, 2019). The United States alone produces around 10 million tons of hydrogen per year (Connelly et al., 2019). Governments and industries worldwide project that demand for hydrogen will grow substantially in the coming years owing to its potential to decarbonize the transportation and industrial sectors (Hydrogen Council, 2017). Chapter 6 provides more detail about the technologies for the use of hydrogen in transportation.
10.2.2.1 Hydrogen Production
Worldwide, hydrogen generation comes almost entirely from fossil fuel sources (roughly 75% from natural gas and 23% from coal), with the remaining 2% from water electrolysis (IEA, 2019). The least expensive way to produce hydrogen today is through steam methane reforming (SMR), which accounts for nearly all of the commercially produced hydrogen in the United States (Connelly et al., 2019). Platts Analytics estimates the cost of hydrogen production from SMR in the United States at under $1 per kilogram (kg) without carbon capture and at $1.40 per kg with carbon capture, using a natural gas price of $3.50 per million British thermal unit (MMBtu) (Robinson, 2020). The actual production costs may be lower, as natural gas prices in the United States ranged from $2.22 to $3.11 per MMBtu in 2019 (EIA, 2020b). Renewable sources of hydrogen today include reformation of biomethane produced through anaerobic digestion, thermochemical conversion of biomass through processes such as gasification, and water electrolysis using electricity generated from renewable energy (Reed et al., 2020). Recent analyses have suggested that the extraction of naturally occurring hydrogen from geologic formations could also be a viable source of zero-carbon, low-cost hydrogen (Zgonnik, 2020; NH2E, 2019). Globally, the cost of hydrogen production from renewable electrolysis ranges from $2.50 to $6.00 per kg H2 (in 2018$) and depends largely on the price of electricity (IEA, 2019). Current costs of hydrogen production in the United States are summarized in Table 10.2.
TABLE 10.2 Current Costs of Hydrogen Production in the United States, Excluding Delivery, Reported in 2018$
| Source | Hydrogen Production Methodsa | ||
|---|---|---|---|
| Capacity (kg H2/day) | Capital Cost ($/kg H2) | Hydrogen Cost ($/kg H2) | |
| Steam Methane Reformingb | |||
| Central production | 380,000 | $0.16 | $1.21 |
| Central production w/CCS | 380,000 | $0.43 | $1.64 |
| Distributed production | 1,500 | $0.38 | $1.58 |
| Coal Gasificationc | |||
| Central production | 620,000 | $0.67 | $1.83 |
| Central production w/CCS | 620,000 | $0.90 | $2.21 |
| Biomass Gasificationd | 155,000 | $0.33 | $2.53 |
| Bio-Derived Liquid (e.g., ethanol) Reforminge | 1,500 | $0.56 | $7.09 |
| Biomass Fermentationf | 50,000 | $44.00 | $82.61 |
| Water Electrolysis | |||
| Proton Exchange Membrane | |||
| Central productiong | 56,000 | $0.42 | $5.07 |
| Distributed productionh | 1,695 | $0.58 | $5.23 |
| Alkalinei | 52,300 | $0.73 | $5.00 |
| Solid Oxidej | 50,000 | $1.22 | $4.89 |
a From Hydrogen Analysis Production Case Studies (NREL, n.d.), unless otherwise noted. All costs updated to 2018$.
b Assumes $3.92/mmBtu natural gas, $0.073/kWh electricity (central), $0.113/kWh (distributed), 90% CCS efficiency.
c Assumes $0.049/kg coal, $0.073/kWh electricity, 87% CCS efficiency.
d Assumes $0.105/kg woody biomass feedstock, $8.56/mmBtu natural gas, $0.113/kWh electricity.
e Assumes $2.27/gal ethanol and $0.113/kWh electricity.
f Baseline 2015 status from Randolph and Studer (2017), assuming no by-product credit, fermentation broth concentration of 12.8 g/L, and feedstock (corn stover) cost of $0.096/kg; all costs updated to 2018$.
g Assumes $0.073/kWh electricity.
h Assumes $0.077/kWh electricity.
i Assumes $0.070/kWh electricity.
j Assumes $0.073/kWh electricity.
10.2.2.2 Hydrogen Enabling Technology and Commercialization Needs
For fuel cell electric vehicles (FCEVs) to be competitive with gasoline vehicles on a cost-per-mile basis in the light-duty vehicle market, the retail price of hydrogen, which incorporates costs of production, delivery, and taxes, must decrease from its current value. In 2018–2019, the California Energy Commission and California Air Resources Board reported the average retail price of hydrogen as $16.51 per kg H2 (CEC/CARB, 2019). U.S. DRIVE has set an ultimate target of <$4 per kg H2,3 untaxed and dispensed at the pump, and a target of $7 per kg for 2025 (targets expressed in 2016$) (Ramsden and Joseck, 2018). For R&D planning purposes, apportioned cost targets are <$2.00 per kg H2 for producing hydrogen and <$2.00 per kg H2 for delivering hydrogen, including the costs of compression, storage, and dispensing. At the target cost for H2 production and delivery ($4.36 per kg H2 in 2020$) and using the fuel consumption value of the 2020 Hyundai Nexo (see Table 10.1), the fueling cost is $0.078 per mile. In comparison, fueling the 2019 Toyota Camry with conventional gasoline at the U.S. average price in January 2020 costs $0.075 per mile.
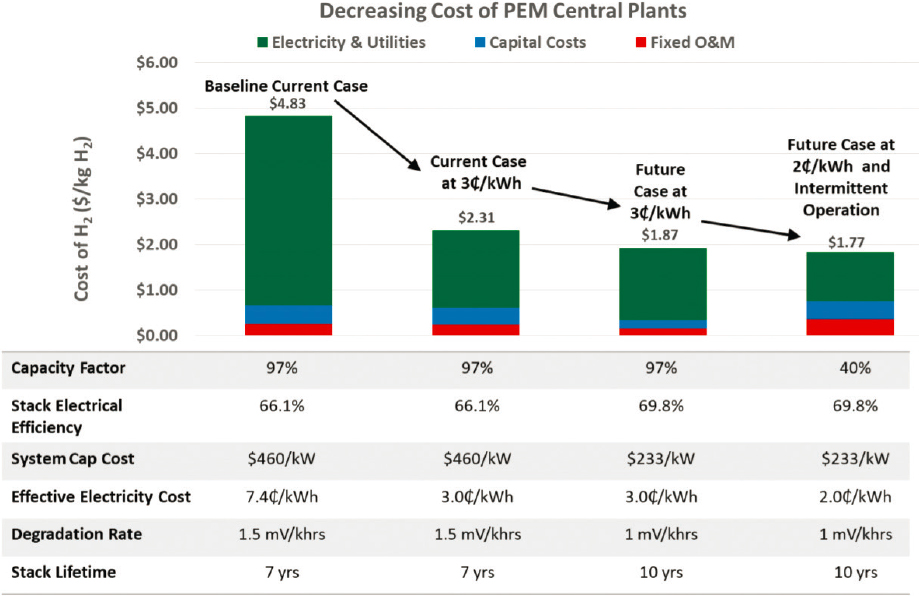
The growing focus on carbon-free energy strategies has increased interest in and development of technologies that produce hydrogen from renewable energy sources, particularly water electrolysis using low-temperature polymer electrolyte membrane (PEM) electrolyzer systems. As mentioned above, hydrogen generation from renewable electricity is currently up to 6 times more expensive than hydrogen production by SMR. At the current low demand for hydrogen in transportation, distributed hydrogen production is likely the most viable and economic approach for this application (DOE-EERE, n.d.). The most recent analysis from the U.S. Department of Energy’s (DOE’s) Hydrogen and Fuel Cells Program estimates the cost for distributed production of hydrogen from PEM electrolysis at $4–$6 per kg (2016$, with an electrolyzer capital cost of $1,000 per kW and renewable electricity costs of $0.03–$0.04 per kWh) (Vickers et al., 2020). Increases in hydrogen demand across transportation and other energy sectors could make centralized production the more economically favorable option, although this will require higher upfront capital costs and significant build-out of a hydrogen infrastructure (DOE-EERE, n.d.). For centralized hydrogen production, DOE’s Hydrogen Production Analysis tool4 recently estimated a baseline cost of $4.83 per kg using data provided by several manufacturers and projecting to centralized hydrogen production at 50,000 kg per day, an electrolyzer manufacturing volume of 700 megawatts per year (about 7× the current production capacity), and an electricity cost of $0.074 per kWh (Peterson et al., 2020). The same analysis sought possible pathways for meeting the target production cost of $2.00 per kg H2, examining the projected impacts of reduced electricity price, reduced electrolyzer capital cost, improved performance, and enhanced durability. The results, shown in Figure 10.2, project a hydrogen cost of $1.87 per kg at $0.03 per kWh and $1.77 per kg at $0.02 per kWh using curtailed renewable electricity. Both of these future cases also require increases in stack efficiency, decreases in capital cost and degradation rate, and increases in stack lifetime relative to the current baseline scenario. Other studies project significantly higher renewable hydrogen costs—for example, a median price of $5.92 per kg for H2 from curtailed electricity in 2050 (Christensen, 2020)—which reflects the variability in assumptions and data inputs used in such analyses.
The high capital costs of PEM electrolyzers largely result from their use of noble metal catalysts: platinum-based catalysts for the cathode and iridium-based catalysts for the anode. However, these electrolyzers are expected to benefit significantly from materials and manufacturing R&D aimed at improving the durability and reducing the cost of automotive PEM fuel cells. Other electrolyzers under development use alkaline or solid oxide electrolytes (DOE, 2019a; Schalenbach et al., 2018). Alkaline electrolyzers can use lower cost nickel- and cobalt-based catalysts and have similar performance to PEM electrolyzers. High-temperature electrolyzers, such as solid oxide, operate at higher efficiency than PEM or alkaline systems and therefore use less electricity, but are less durable (Reisert et al., 2018). Additional R&D efforts by DOE’s HydroGEN program focus on advanced water splitting technologies, including materials for photoelectrochemical, solar thermochemical, and low- and high-temperature electrolysis. Nonetheless, even with significant reduction in electrolyzer capital costs, the
___________________
3 1 kg H2, on a lower heating value basis, is approximately equal to 1 gallon of gasoline equivalent.
4 Hydrogen Production Analysis is a discounted cash-flow model providing transparent reporting of process design assumptions and a consistent cost analysis methodology for H2 production at central and distributed facilities. Hydrogen Production Analysis utilizes data from the Energy Information Administration Annual Energy Outlook 2017 Report, where 2016$ is the standard cost basis. See http://www.hydrogen.energy.gov/h2a_prod_studies.html.
SOURCE: Peterson et al. (2020).
primary factors dictating the cost-effectiveness of H2 production from electrolysis will be electrical efficiency and electricity cost (James et al., 2019).
10.2.2.3 Hydrogen Potential in Medium to Long Term
SMR with carbon capture, utilization, and storage (CCUS) and water electrolysis are currently the primary routes for producing low-carbon hydrogen, and their production volume has remained fairly constant at around 0.36 megatonnes per year (Mt/yr) since 2015 (IEA, 2020a). New projects for both technologies are reported to begin operation in the 2020s and would increase global low-carbon hydrogen production to 1.45 Mt/yr by 2023 (IEA, 2020a). Through its H2@Scale initiative, DOE recently announced funding for three multimillion-dollar R&D projects on electrolyzer manufacturing (DOE-EERE, 2020). However, the decrease in global hydrogen demand as a result of the COVID-19 pandemic may delay some of the progress in low-carbon hydrogen production (IEA, 2020b).
Other processes and technologies to generate hydrogen without carbon emissions have the potential to become more widespread in the coming decades. For example, in some advanced nuclear reactor designs, the process heat could be used to produce H2 via steam electrolysis or thermochemical water splitting (IAEA, 2013). These Generation IV reactors are largely still in the development phase but could see initial deployment in the 2030s. Methods to convert biomass to hydrogen—anaerobic digestion, fermentation, and thermochemical gasification—are currently more expensive and less technologically mature than other low-carbon options but have the potential to be negative-emitting processes if combined with CCUS (IEA, 2019). Another proposed route to low-carbon H2 is methane splitting, in which methane is converted to H2 and elemental carbon under anaerobic conditions and high temperatures. Two commercial plants for methane splitting exist in the United States, and the technology may gain more traction if the market for solid carbon materials increases as expected (IEA, 2019).
The current low production volumes and high cost of low-carbon hydrogen are not the only factors limiting the use of H2 as a low-carbon fuel for light-duty vehicles, however. Substantial penetration of FCEVs in the light-duty fleet will require significant build-out of the hydrogen fueling infrastructure and reductions in fuel cell and storage tank costs, as discussed in Chapter 6. The expansion of a hydrogen infrastructure for heavy-duty vehicles and long-distance transportation—which are difficult to decarbonize via electrification alone—could prompt further deployment of light-duty FCEVs (MIT Energy Initiative, 2019). However, such developments are unlikely to occur in 2025–2035 without government incentives or subsidies (MIT Energy Initiative, 2019; IEA, 2019).
FINDING 10.2: The primary methods for generating low-carbon hydrogen are water electrolysis and steam methane reforming with carbon capture, utilization, and storage; however, both currently suffer from high costs and low production volumes. Federal research programs and industry efforts, including the U.S. Department of Energy’s H2@Scale initiative, fund research and development to decrease the cost of low-carbon hydrogen generation.
10.2.3 Low-Carbon Synthetic Fuels
Historically, synthetic fuels are energy carriers, typically liquid, manufactured from a source such as coal or natural gas, and used as a substitute for conventional petroleum fuels. Synthetic fuels are chemically similar to gasoline and diesel fuels but are produced from carbon sources other than petroleum. The chemical properties and high energy density of such fuels make them similar enough to existing petroleum fuels that they can “drop-in” to existing and future ICE engines designed for petroleum. Synthetic fuels have been manufactured for many decades through gas-to-liquid (GTL) processes like the Fisher-Tropsch synthesis, methanol synthesis, and methanol-to-gasoline (MTG) process. In established implementations, these processes convert fossil sources of carbon, such as coal, oil, and natural gas, into a mixture of carbon monoxide (CO) and H2 called synthesis gas (syngas). In the presence of metal catalysts under high temperatures, syngas can then be converted into hydrocarbon chains (Fischer-Tropsch process) or methanol (methanol synthesis). Methanol can further be dehydrated to dimethylether and then converted into gasoline over a zeolite catalyst. GTL processes are widely used to produce synthetic liquid fuels at commercial scale. However, the resulting fuels are not low-carbon and in fact have higher well-to-wheels emissions than petroleum fuels owing to the emissions generated in their production.
In order to produce low-carbon synthetic fuels, the feedstocks in the Fischer-Tropsch reaction, methanol synthesis, or MTG process must be replaced with non-fossil sources of carbon, such as biomass or captured atmospheric carbon, and low-carbon hydrogen. This use of “de-fossilized” carbon fuels results in a closed carbon cycle, where combustion of the fuel leads to low or zero increases in the concentration of CO2 in the atmosphere; therefore, low-carbon synthetic fuels could help to decarbonize the transportation sector. For the fuel to be net-zero carbon, all aspects of the feedstock recovery and fuel production processes, including their transportation, storage, and distribution, must be decarbonized, an effort that spans a variety of energy sectors.
Unlike some other low-carbon fuels like electricity or hydrogen, use of synthetic fuels often does not have a vehicle energy efficiency or fuel economy benefit. If the synthetic fuels are chemically identical to gasoline and used in an ICE, they offer no inherent fuel economy improvement relative to petroleum-derived gasoline used in the same engine. Synthetic fuels, however, can be designed with advantageous properties that do allow for improved fuel economy or reduced criteria emissions. Sometimes realizing improved fuel economy or reduced criteria emissions benefits from specially designed synthetic fuels requires engine modifications. Despite a lack of efficiency benefit, low-carbon synthetic fuels provide an opportunity to decarbonize legacy fleet vehicles and may be particularly relevant in light-duty vehicle applications ill-suited to electrification, such as long-distance and constant-operation road transport.
10.2.3.1 Low-Carbon Synthetic Fuels Production
Today, no large-scale, low-carbon synthetic fuels are available for light-duty vehicle transportation. To produce a low-carbon synthetic fuel, fundamental aspects of GTL processes must be modified to utilize non-fossil carbon
SOURCE: Committee generated, adapted from Royal Society (2019).
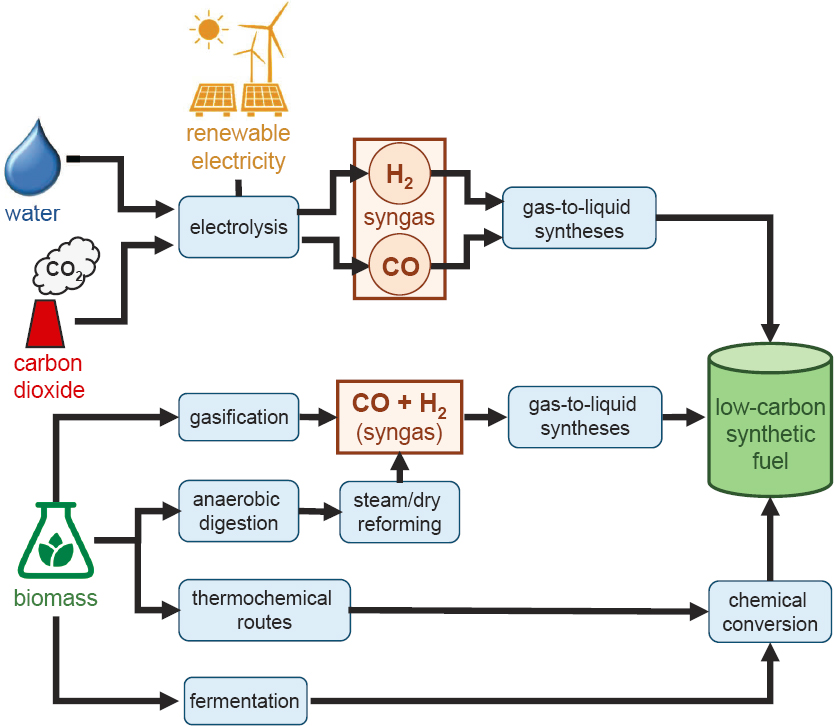
and low-carbon hydrogen, or new processes must be developed and commercialized at large scale. Figure 10.3 depicts potential pathways to the production of low-carbon synthetic fuels using various feedstocks and (electro) chemical processes.
Low-Carbon Fischer-Tropsch Fuel Synthesis Pathways
Two primary approaches have been developed to produce low-carbon fuels via Fischer-Tropsch pathways. One approach involves initial electrochemical reduction of captured CO2 to CO and then, in a second thermal step, reaction of the generated CO with “blue” or “green” hydrogen5 via conventional Fischer-Tropsch methods to produce hydrocarbon fuels. Alternatively, current research aims to develop systems that can perform Fischer-Tropsch chemistry starting from CO2 in a single reactor using a single catalyst. One of the challenges associated with this pathway is the low steady-state concentration of CO present during the reaction, which limits chain growth and yields a product distribution rich in light hydrocarbons that are not suitable as liquid fuels. Therefore, further research into catalysts that give improved product distributions is necessary (NASEM, 2019; Royal Society, 2019).
___________________
5 “Blue” hydrogen refers to hydrogen production in which the resultant carbon emissions are captured and stored or reused. “Green” hydrogen refers to hydrogen produced from renewable energy sources, with no corresponding carbon emissions.
Other Chemical Catalytic, Electrocatalytic, and Biological Fuel Synthesis Pathways
In addition to Fischer-Tropsch synthesis pathways, other thermochemical, electrochemical, and biological pathways are being pursued to produce hydrocarbon fuels or precursors to chemical fuels, such as CO, H2, and oxygenated hydrocarbons (Zeman and Keith, 2008; NETL, 2011; NASEM, 2019; Royal Society, 2019). For any chemical or biological pathway to lead to a commercial low-carbon synthetic fuel, the hydrocarbon target must be synthesized from CO2 or a CO2-derived product such as biological molecule, with low or zero upstream emissions in its synthesis, using low-carbon energy sources, and with all additional inputs similarly low-carbon. One primary example is DOE’s Co-Optima program (see below), which evaluates biomass-derived feedstocks for incorporation into vehicle fuels, particularly for high-octane-optimized engines. Other examples include biomass-to-gasoline processes, involving the gasification of biomass and subsequent chemical conversion to fuel, and thermochemical conversion of biomass via pyrolysis or hydrothermal liquefaction followed by chemical refining steps (Phillips et al., 2011; Royal Society, 2019). Modifying the commercial methanol synthesis and MTG processes to use low-carbon feedstocks and renewable electricity would also be a path to low-carbon synthetic fuel production. As of 2019, fuel production via direct chemical conversion of CO2 was considered at a fundamental research or benchtop-proof-of-concept stage, with barriers to fuels production including low selectivity and lack of understanding of carbon-carbon bond formation steps (NASEM, 2019; Basic Energy Sciences Roundtable, 2019).
Co-Optima Program
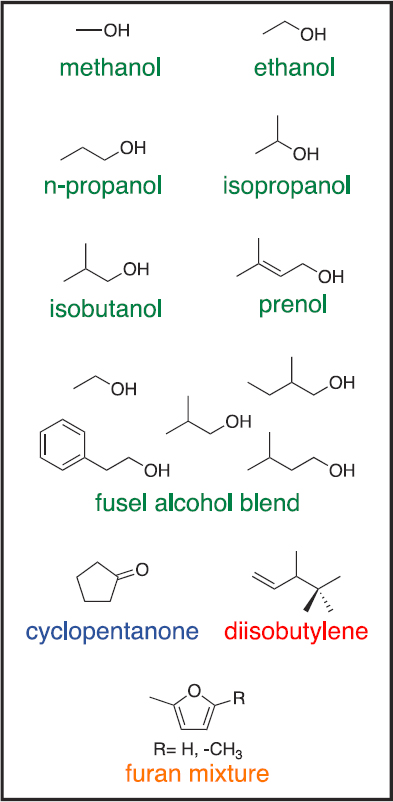
In 2016, DOE initiated a collaborative effort toward the “Co-Optimization of Fuels and Engines,” or the Co-Optima program (DOE, n.d.). Research in the program focuses on simultaneously optimizing fuels and engine technologies in order to increase engine efficiency, reduce GHG and criteria emissions, and decrease spending on fuel. The Co-Optima targets in the light-duty sector are a 35% increase in fuel economy by 2025 relative to a 2015 baseline and $20–$30 billion savings on fuel expense per year (DOE, n.d.). To meet its goal of reducing GHG emissions, the Co-Optima initiative focuses on identifying blendstocks that can be derived from biomass rather than from fossil sources. Blendstocks that meet health and fuel-quality standards are further evaluated using a “merit function” developed by Co-Optima researchers, which quantifies the efficiency of the blendstock relative to conventional fuel based on its octane number, sensitivity, heat of vaporization, flame speed, particulate matter index, and catalyst light-off temperature (Farrell et al., 2018). This evaluation has so far identified 10 promising blendstocks (Figure 10.4) that have higher merit function values than E10 premium gasoline, meet fuel-quality requirements, and could be commercially available by 2025–2030. However, 4 of these blendstocks—methanol, prenol, the furan mixture, and cyclopentanone—have higher barriers to commercialization owing to issues with chemical stability and compatibility, volatility, and/or toxicity (Gaspar et al., 2019). More detailed analyses of the blendstocks are ongoing and include investigating the relationship between molecular composition and fuel properties; evaluating blendstock performance in different engine combustion modes; and performing technoeconomic, life cycle, and refinery integration analyses of the blendstocks and engine technologies (Farrell et al., 2018; DOE, 2019b).
10.2.3.2 Low-Carbon Synthetic Fuels Enabling Technology and Commercialization Needs
Several developments will be required for wide-scale commercialization of low-carbon synthetic fuels. These may include improved technology for low-carbon hydrogen generation, CCS, and electrochemical conversion of CO2.
Hydrogen Generation
Hydrogen is a fundamental input in many potential low-carbon synthetic fuels pathways. As described in Section 10.2.2, at present, hydrogen is primarily generated from natural gas through SMR and coal gasification, resulting in significant carbon emissions. To produce low-carbon synthetic fuels, the hydrogen source must be
SOURCE: Committee generated, adapted from Gaspar et al. (2019).
carbon-free or low-carbon. Section 10.2.3.2 above describes several methods for generating low-carbon hydrogen, including SMR with CCUS, water electrolysis (low- and high-temperature pathways), biomass conversion, and methane splitting.
Carbon Capture
Captured carbon necessary for the production of low-carbon synthetic fuels can come from many sources, including industrial waste streams, combustion in power generation, and ambient air. The concentration and pressure of the gas stream, as well as its onsite availability or transport requirements, govern the choice of removal technology and the resulting cost. High concentration CO2 sources such as those from industrial processes or power generation provide a cheaper source of carbon. Carbon obtained through direct air capture is more dilute and therefore more difficult to separate and requires 2–4 times more energy than more concentrated mixtures like flue gases. Direct air capture approaches are technologically feasible, but because of additional separation processes, they will be more expensive than capture from fossil fuel power plants or other concentrated sources. While several
companies are currently working to commercialize direct air capture, the capital costs of these facilities are highly uncertain, as only small-scale units have been built so far (Carbon Engineering, n.d.; Climeworks, n.d.; Soletair Power, 2020). More research and pilot plants are needed to optimize the technology.
CO2 Electrolyzers
CO2 electrolyzers could provide an abundant source of non-fossil CO as an input to Fischer-Tropsch pathways for the production of low-carbon fuels. Few CO2 electrolyzer technologies have been commercialized to-date, although several companies have reported plans for scale-up (NASEM, 2019; Sanchez et al., 2019). Multiple technologies and cell designs have been proposed, including low-temperature PEM electrolysis and high-temperature molten carbonate or solid oxide electrolysis (NASEM, 2019; Sanchez et al., 2019; Küngas, 2020). In laboratory-scale demonstrations, solid-oxide electrolyzers have shown the best overall performance in terms of efficiency, durability, and selectivity for CO (Küngas, 2020). However, the ability of PEM electrolyzers to operate at ambient temperatures and pressures is attractive for many industrial applications, and these electrolyzers have been the subject of most technoeconomic analyses on CO2 electroreduction (Sanchez et al., 2019). For example, De Luna et al. (2019) determined that electrochemically generated CO would be cost-competitive with fossil-derived CO in a PEM electrolyzer with 90% product selectivity and 70% energetic efficiency at an electricity cost of $0.04 per kWh. Achieving this goal will require simultaneous optimization of catalyst and cell design to improve rates and selectivities and to minimize challenges associated with product separation, low CO2 solubility, mass transport, and system durability (Weekes et al., 2018; NASEM, 2019; De Luna et al., 2019; Sanchez et al., 2019). In the long term, engineering principles developed for commercial water electrolysis systems could be adapted to facilitate the industrial deployment of CO2 electrolyzers.
10.2.3.3 Low-Carbon Synthetic Fuels Potential in Medium to Long Term
Production of low-carbon synthetic fuels is currently limited by high costs and inefficiencies owing to energy losses from the many processes involved in manufacturing (Li et al., 2016; Cai et al., 2018; Royal Society, 2019). High costs and low efficiencies may be acceptable for low volume, high value commodities, but they are untenable for very high volume, low margin products like fuels, especially in comparison to inexpensive and readily available gasoline, diesel, and electricity. Heavier, diesel-like fuels used in compression ignition engines have more near-term options for commercial drop-in fuels, as compared to lighter, gasoline-like spark-ignition engine fuels (AFDC, n.d.). In the medium term, low-carbon synthetic fuels will likely be first introduced as blends with existing fossil fuels (Farrell et al., 2018). Examples of this are already available for diesel blends (Neste, 2016; Renewable Energy Group, 2020), and recent studies indicate high potential benefits of incorporating low-carbon synthetic fuels into conventional gasoline. For instance, Dunn et al. (2020) determined that using a biomass-derived isopropanol blendstock (31% by volume in conventional gasoline) could lead, on a life cycle basis, to 4%–7% reduction in GHG emissions, 3%–4% reduction in water consumption, and 3% reduction in particulate emissions from 2025 to 2050 compared to a business as usual case. The Co-Optima program targets the 2025–2030 time frame for commercialization of a bio-blendstock fuel (Farrell et al., 2018), but significant barriers still exist to the widespread adoption of these fuels, such as increasing feedstock supply and constructing new biorefineries (Dunn et al., 2020). Longer-term cost reductions and improvements to process efficiencies will improve cost competitiveness for all low-carbon synthetic fuels; however, this is unlikely to be sufficient without policy or regulatory interventions to give value to low-carbon fuels.
FINDING 10.3: Other than biomass-derived ethanol, there are currently no large-scale commercial low-carbon synthetic fuels available in the light-duty vehicle sector. The U.S. Department of Energy’s Co-Optima program aims to develop low-carbon fuels comprised of biomass-derived blendstocks mixed with conventional gasoline for commercialization by 2025–2030. Another promising route to low-carbon liquid fuels is Fischer-Tropsch synthesis from non-fossil CO2 and renewable H2; however, the technologies underlying this pathway still require development and scale-up.
FINDING 10.4: Low-carbon liquid fuels, which can serve as drop-ins for conventional gasoline and diesel, present an opportunity to decarbonize both the existing and future light-duty vehicle fleets. Producing a net-zero carbon liquid fuel will require all aspects of feedstock recovery and fuel production to be decarbonized. Incentivizing the production and use of low- and net-zero carbon liquid fuels may require changes to the current regulations for vehicle and fuel systems, since these synthetic fuels have no advantage over gasoline when considering only tailpipe greenhouse gas emissions.
10.3 LOW-CARBON FUELS IN THE 2025–2035 FLEET
Petroleum fuels dominate passenger vehicle propulsion because they are inexpensive, easily distributed, and have high energy density. Improvements in engines, powertrain technologies, and other vehicle technologies may not be able to achieve sufficient improvements in energy efficiency, reductions in petroleum use, and reductions in emissions to meet fuel economy and GHG emissions standards. Therefore, automakers are increasingly developing technologies to use non-petroleum fuels. This section discusses the potential role of low-carbon fuels in the future fleet, considering regulatory issues, metrics for energy efficiency and emissions, and techno-economic and market factors.
10.3.1 Regulatory Issues
The corporate average fuel economy (CAFE) standards as originally envisioned sought reduction in petroleum fuel use. Concern about the growing reliance on petroleum, especially imported petroleum fuel, for transportation energy led to the first energy efficiency regulations on passenger vehicles, enacted in the Energy Policy and Conservation Act of 1975. U.S. legislators identified fuel economy, in miles per gallon of fuel, as the appropriate energy efficiency metric, where fuel was defined as gasoline and diesel oil. The legislation also gave the Secretary of Transportation the flexibility to include by rule any other liquid or gaseous fuel “if he determines that such inclusion is consistent with the need of the Nation to conserve energy” (EPCA, 1975). The Energy Policy Act of 1992 defined alternative fuels as “pure methanol, ethanol, and other alcohols; blends of 85% or more of alcohol with gasoline; natural gas and liquid fuels domestically produced from natural gas; propane; coal-derived liquid fuels; hydrogen; electricity; pure biodiesel (B100); fuels, other than alcohol, derived from biological materials; and P-Series fuels” (Energy Policy Act, 1992). The same act authorized DOE to “designate other fuels as alternative fuels, provided that the fuel is substantially non-petroleum, yields substantial energy security benefits, and offers substantial environmental benefits” (Energy Policy Act, 1992). These expanding definitions of alternative fuels, coupled with the projected increase of alternative-fuel vehicles in the light-duty fleet, highlight a need to reevaluate the methods by which such fuels are regulated.
As introduced in Chapter 2 and further discussed in Chapter 12, the current CAFE and GHG standards have credits and incentives for alternative-fueled vehicles. Per a provision in Public Law 103-272, the National Highway Traffic Safety Administration (NHTSA) cannot estimate the use or availability of such vehicles in evaluating and setting the stringency of fuel economy standards (103rd Congress, 1994). In recognition of their value in displacing petroleum, NHTSA instead incentivizes deployment of technologies that use alternative fuels by artificially enhancing their fuel economy, considering one gallon equivalent of the alternative fuel to equal 0.15 gallons of gasoline. For dual-fueled vehicles, the percent operation on gasoline versus alternative fuel will be estimated using the Society for Automotive Engineers’ utility factors beginning in model year (MY) 2020. In regulating GHG emissions, as a temporary measure, the U.S. Environmental Protection Agency (EPA) does not consider upstream emissions from the electric grid, and thus BEVs (and the electric operating portions of PHEV use) are assigned emissions of 0 g/mile. As further incentive, the GHG standards use multipliers for BEVs, FCEVs, and PHEVs that count them as more than one vehicle, thereby helping manufacturers meet their fleet-wide emissions targets. However, these multipliers will phase out after MY 2021. Neither the CAFE nor GHG emissions standards include provisions for low-carbon synthetic fuels, as they are still emerging technologies. As mandated in the Energy Independence and Security Act, the U.S. Department of Transportation must reassign fuel economy standards at least every 5 years (EISA, 2007). NHTSA further interprets the statute to suggest that standards cannot be set for more than 5 years in the future. Thus, reevaluation and possibly changes to the incentives and crediting schemes for alternative fuels are likely to occur during this study’s time period of 2025–2035.
If low-carbon synthetic liquid fuels become a significant part of the light-duty vehicle and fuels system, the CAFE and GHG regulations will need to account for their use when considering vehicle efficiency and emissions standards. Such fuels have tailpipe emissions and onboard energy and fuel use similar to those of conventionally fueled vehicles. However, by definition low-carbon synthetic fuels have lower full-fuel-cycle emissions than conventional gasoline or diesel. Depending on the production method, their full-fuel-cycle energy use can be higher or lower than that of conventional fuels, as described in Section 10.3.2 below. Capturing the emissions benefits of low-carbon synthetic fuels within the CAFE and GHG standards would require a vehicle-fuel system approach, including a full-fuel-cycle assessment. Such an approach would need to be applied to all vehicle-fuel systems for equivalent comparison across the fleet.
One example of a policy that regulates and incentivizes low-carbon fuel production is California’s Low Carbon Fuel Standard (LCFS). The California state legislature mandated a 20% reduction of carbon intensity, measured in grams of CO2 equivalent per megajoule (gCO2e/MJ), in the light-duty vehicle fuels sold in the state over 15 years (2015–2030). A life cycle approach is used to evaluate fuel pathways, and a credit generating and trading scheme allows industry-wide compliance with the yearly decreasing standard (CARB, 2020b). The LCFS is a low-carbon fuel standard, not a zero-carbon fuel standard, and it includes drop-in liquid fuels as well as fuel blends and alternative powertrain fuels like hydrogen and electricity. Ethanol, renewable diesel, and biodiesel alone or in fuel blends are the highest volume contributors to the standard implementation (CARB, 2020a). Inspired by California’s LCFS, similar programs are in use or under development in Oregon, Washington, Canada, and Brazil (CARB, 2020b).
10.3.2 Energy Efficiency and Emissions Metrics
Inherently tied to the regulatory issues discussed above is the choice of metrics used to evaluate the energy efficiency and emissions of vehicle fuels. The current regulatory standards consider petroleum fuel consumption and tailpipe GHG emissions, both on a per-vehicle mile basis. In a future fleet with significant penetration of alternative-fuel vehicles, standards based on fuel consumption in gallons of liquid fuel per mile may become less relevant. The use of only tailpipe rather than full-fuel-cycle GHG emissions incentivizes the deployment of zero-emission vehicles, but it misrepresents the actual carbon emissions associated with energy use in a light-duty fleet with high penetration of zero-emission vehicles and/or low-carbon liquid fuels. In such a fleet, a more complete picture of a vehicle’s carbon footprint would be captured in its well-to-wheels GHG emissions, which consider the entire life cycle of the fuel, including both production and use onboard the vehicle. Further discussion of vehicle life cycle emissions can be found in Chapter 12.
In the long term, NHTSA and EPA might reconsider the appropriate metrics for setting regulatory standards to align with the goals of energy efficiency, energy security, cost savings, and emissions reductions, or any other goals that may arise in 2025–2035. For example, the relationship between energy use and GHG emissions could become more complex in a future fleet with high prevalence of low-carbon alternative fuels. With most of the proposed low-carbon fueling options, such as electricity and hydrogen, vehicles achieve both reduced GHG emissions and decreased energy use relative to conventional gasoline vehicles on a well-to-wheels basis (Gao, 2011; Ramachandran and Stimming, 2015; CaFCP, 2016; Liu et al., 2020). However, in some cases, the use of a low-carbon synthetic fuel can reduce GHG emissions with no benefit to overall energy use, for instance, if the fuel is synthesized from CO originally derived from captured CO2 and transformed into liquid fuel via traditional Fischer-Tropsch methods. In the near term, some high-energy options might be more cost effective than developing and deploying lower energy technologies for the production of low-carbon feedstocks. Given consumer preference for least-cost pathways, regulatory standards for low-carbon synthetic fuels should consider accounting for these potential trade-offs between GHG emissions and total system energy use.
10.3.3 Techno-Economic and Market Factors
As of 2020, there are ever-growing options for plug-in EVs available to consumers, and infrastructure for charging at home, and in some locations at businesses and public chargers. FCEVs are available, although only in very limited markets where refilling options exist. Currently, net-zero carbon synthetic drop-in fuels are not available for customers, but low-carbon blended fuels are available in certain markets. The deployment of vehicles (plug-in EVs
and FCEVs) and of fuels (low-carbon drop-in liquid fuels) will determine the impact of these non-petroleum options on vehicle energy use, petroleum fuel use, and GHG emissions. For electric fuels to have a greater impact on reducing energy consumption and GHG emissions, improvements are required in the energy density and cost of the vehicle battery, the capability of the charging infrastructure to meet consumers’ needs and comfort level, and the well-to-wheels emissions of the vehicle-fuel system (achieved by decarbonizing electricity generation). An increase in hydrogen fuel use could occur with reduced costs of FCEVs, build-out of the hydrogen fueling infrastructure to meet consumers’ needs, and decreased emissions for hydrogen generation. Low-carbon synthetic fuels can be incorporated into the existing fueling infrastructure and reduce GHG emissions from the current fleet as well as future vehicles; however, their implementation will depend on improving capabilities and scaling up fuel synthesis, decreasing well-to-wheels emissions, and reducing vehicle and fuel costs relative to other low-carbon options.
10.3.4 Outlook for Non-Petroleum Fuels
The various regulatory, techno-economic, and market factors described above will dictate the extent of non-petroleum fuel availability in the light-duty vehicle fleet during 2025–2035. The use of such fuels, and the amount of resulting reductions in GHG emissions in the light-duty sector, will depend on those factors as well as the vehicle technologies deployed. The current regulatory standards incentivize the deployment of zero-emission vehicles by artificially enhancing their fuel economy value and considering only tailpipe GHG emissions. Additional regulations such as a nationwide LCFS or other decarbonization policies could further increase the development and use of low-carbon fuels. In the long term, it will be important to consider how to incorporate low-carbon fuels into the existing CAFE program, particularly with regard to metrics for fuel consumption, GHG emissions, and energy use, as well as their incorporation into the stringency of the standards. Non-petroleum fuels present opportunities to decrease GHG emissions, both on- and offboard the vehicle, but in some cases result in increased energy use depending on the choice of low-carbon pathway.
FINDING 10.5: Greenhouse gas (GHG) emissions are a relevant metric for all light-duty vehicle fuels, including diesel, gasoline, biofuels, low-carbon synthetic fuels, electricity, and hydrogen. Considering the full-fuel-cycle emissions of such fuels will become increasingly important in understanding a vehicle’s impact on GHG emissions given the expected growth in non-petroleum fuel use in the light-duty fleet during 2025–2035.
10.4 RECOMMENDATIONS FOR NON-PETROLEUM FUELS
RECOMMENDATION 10.1: The U.S. Department of Energy, in partnership with the U.S. Department of Defense and the private sector, should facilitate the deployment and commercialization of low-carbon fuels by increasing the capacity of renewable electricity generation and providing more research and development funding for technologies that enable low-carbon hydrogen generation and low-carbon synthetic fuel production.
RECOMMENDATION 10.2: As low-carbon fuels become more prevalent in the light-duty fleet, the National Highway Traffic Safety Administration and U.S. Environmental Protection Agency should consider a full-fuel-cycle approach to setting regulatory standards, which would take into account both upstream and onboard energy use and emissions. One approach to incorporating fuels into a regulatory regime might be to explore a nationwide low-carbon fuel standard, such as those currently used in California and Oregon.
10.5 REFERENCES
103rd Congress. 1994. To revise, codify, and enact without substantive change certain general and permanent laws, related to transportation, as subtitles II, III, and V-X of title 49, United States Code, “Transportation,” and to make other technical improvements in the Code, Pub. L. No. 103–272, H.R. 1758 (1994). https://www.congress.gov/103/statute/STATUTE-108/STATUTE-108-Pg745.pdf.
AFDC (Alternative Fuels Data Center). n.d. “Renewable Hydrocarbon Biofuels.” https://afdc.energy.gov/fuels/emerging_hydrocarbon.html.
AFDC. 2020. Alternative Fuel Price Report. April. https://afdc.energy.gov/fuels/prices.html.
ANL (Argonne National Laboratory). 2021. The Greenhouse Gases, Regulated Emissions, and Energy Use in Technologies (GREET) Model (version 2020 rev1). GREET1 Model. Lemont, Illinois, 2021. https://greet.es.anl.gov/greet.models.
Basic Energy Sciences Roundtable. 2019. “Report of the Basic Energy Sciences Roundtable on Liquid Solar Fuels.” 1615599. https://doi.org/10.2172/1615599.
CaFCP (California Fuel Cell Partnership). 2016. “Air, Climate, Energy, Water Security: A Guide to Understanding the Well-to Wheels Impact of Fuel Cell Electric Vehicles.” https://cafcp.org/sites/default/files/W2W-2016.pdf.
Cai, H., J. Markham, S. Jones, P.T. Benavides, J.B. Dunn, M. Biddy, and L. Tao. 2018. Techno-economic analysis and life-cycle analysis of two light-duty bioblendstocks: Isobutanol and aromatic-rich hydrocarbons. ACS Sustainable Chemistry and Engineering 6(7):8790–8800. https://doi.org/10.1021/acssuschemeng.8b01152.
CARB (California Air Resources Board). 2020a. “Data Dashboard.” Last updated May 29, 2020. https://ww3.arb.ca.gov/fuels/lcfs/dashboard/dashboard.htm.
CARB. 2020b. “Low Carbon Fuels Standard.” Last updated June 24, 2020. https://ww2.arb.ca.gov/sites/default/files/2020-03/basics-notes.pdf.
Carbon Engineering. n.d. “Our Story.” https://carbonengineering.com/our-story/.
CEC/CARB (California Energy Commission and California Air Resources Board). 2019. Joint Agency Staff Report on Assembly Bill 8: 2019 Annual Assessment of Time and Cost Needed to Attain 100 Hydrogen Refueling Stations in California. December. CEC-600-2019-039. https://ww2.energy.ca.gov/2019publications/CEC-600-2019-039/CEC-600-2019-039.pdf.
Christensen, A. 2020. “Assessment of Hydrogen Production Costs from Electrolysis: United States and Europe.” International Council on Clean Transportation. June 18. https://theicct.org/publications/assessment-hydrogen-production-costs-electrolysis-united-states-and-europe.
Climeworks. n.d. “The Climeworks Story: From Lab Scale to Climate Relevant.” https://www.climeworks.com/page/story-to-reverse-climate-change.
Connelly, E., A. Elgowainy, and M. Ruth. 2019. “Current Hydrogen Market Size: Domestic and Global.” DOE Hydrogen and Fuel Cells Program Record, October 1. https://www.hydrogen.energy.gov/pdfs/19002-hydrogen-market-domestic-global.pdf.
Davis, S.C., and R.G. Boundy. 2020. Transportation Energy Data Book: Edition 39. Oak Ridge, TN: Oak Ridge National Laboratory. https://doi.org/10.2172/1767864.
Davis, S.J., N.S. Lewis, M. Shaner, S. Aggarwal, D. Arent, I.L. Azevedo, S.M. Benson, et al. 2018. Net-zero emissions energy systems. Science 360(6396):eaas9793. https://doi.org/10.1126/science.aas9793.
De Luna, P., C. Hahn, D. Higgins, S.A. Jaffer, T.F. Jaramillo, and E.H. Sargent. 2019. What would it take for renewably powered electrosynthesis to displace petrochemical processes? Science 364(6438):eaav3506. https://doi.org/10.1126/science.aav3506.
DOE (U.S. Department of Energy). n.d. “Co-Optima Research.” Energy.Gov. https://www.energy.gov/eere/bioenergy/co-optima-research.
DOE. 2017. “Chapter 3: Building a Clean Electricity Future.” In Transforming the Nation’s Electricity System: The Second Installment of the QER, 100. Washington, DC. https://www.energy.gov/sites/prod/files/2017/01/f34/Chapter%203%20Building%20a%20Clean%20Electricity%20Future_0.pdf.
DOE. 2019a. Hydrogen and Fuel Cells Program, 2019 Annual Progress Report. https://www.hydrogen.energy.gov/annual_progress19_h2fuel.html.
DOE. 2019b. “Co-Optimization of Fuels and Engines: FY19 Year in Review.” Washington, DC: U.S. Department of Energy. https://www.energy.gov/sites/prod/files/2020/06/f75/beto-co-optima-fy19-yir-report-june-2020.pdf.
DOE. 2020a. “Clean Cities Alternative Fuel Price Report, January 2020.” January. U.S. Department of Energy.
DOE. 2020b. “Where the Energy Goes.” https://www.fueleconomy.gov/feg/atv.shtml.
DOE-EERE. (U.S. Department of Energy Office of Energy Efficiency and Renewable Energy) n.d. “Central Versus Distributed Hydrogen Production.” Hydrogen and Fuel Cell Technologies Office. https://www.energy.gov/eere/fuelcells/central-versus-distributed-hydrogen-production.
DOE-EERE. 2020. “H2@Scale New Markets Funding Opportunity Announcement (FOA).” Funding Opportunity Announcement DE-FOA-0002229. Washington, DC: Department of Energy.
DOE-EIA (U.S. Department of Energy and Energy Information Administration). 2020. Monthly Energy Review, March 2020.
DOE/EPA (U.S. Department of Energy, U.S. Environmental Protection Agency). n.d. “Find and Compare Cars.” www.fueleconomy.gov. https://www.fueleconomy.gov/feg/findacar.shtml.
Dunn, J.B., E. Newes, H. Cai, Y. Zhang, A. Brooker, L. Ou, N. Mundt, et al. 2020. Energy, economic, and environmental benefits assessment of co-optimized engines and bio-blendstocks. Energy and Environmental Science 13(8):2262–2274. https://doi.org/10.1039/D0EE00716A.
EIA (Energy Information Administration). 2020a. “Annual Energy Outlook 2020.” Annual Energy Outlook. Washington, DC: U.S. Energy Information Administration. https://www.eia.gov/outlooks/aeo/.
EIA. 2020b. “Henry Hub Natural Gas Spot Price.” https://www.eia.gov/dnav/ng/hist/rngwhhdM.htm.
EIA. 2020c. “Electric Power Monthly—Table 1.1. Net Generation by Energy Source: Total (All Sectors), 2010–June 2020.” U.S. Energy Information Administration. https://www.eia.gov/electricity/monthly/epm_table_grapher.php.
EISA (Energy Independence and Security Act). 2007. Pub. L. 110-140, 121 Stat. 1492, enacted December 19, 2007.
Elgowainy, A., J. Han, J. Ward, F. Joseck, D. Gohlke, A. Lindauer, T. Ramsden, et al. 2016. “Cradle-to-Grave Lifecycle Analysis of U.S. Light Duty Vehicle-Fuel Pathways: A Greenhouse Gas Emissions and Economic Assessment of Current (2015) and Future (2025–2030) Technologies.” https://doi.org/10.2172/1254857.
Energy Policy Act. 1992. Pub. L. 102-486, 106 Stat. 2776, enacted October 24, 1992.
EPA (U.S. Environmental Protection Agency). 2020a. “Fast Facts: U.S. Transportation Sector Greenhouse Gas Emissions 1990–2018.” Washington, DC. June 2020. https://nepis.epa.gov/Exe/ZyPDF.cgi?Dockey=P100ZK4P.pdf.
EPA. 2020b. “Emissions and Generation Resource Integrated Database (EGRID).” Collections and Lists. US EPA. July 27. https://www.epa.gov/egrid.
EPCA (Energy Policy and Conservation Act). 1975. Pub.L. 94-163, 89 Stat. 871, enacted December 22, 1975.
Farrell, J.T., J. Holladay, and R. Wagner. 2018. “Co-Optimization of Fuels and Engines: Fuel Blendstocks with the Potential to Optimize Future Gasoline Engine Performance; Identification of Five Chemical Families for Detailed Evaluation.” NREL/TP—5400-69009, DOE/GO—102018-4970, 1434413. https://doi.org/10.2172/1434413.
Gao, L. 2011. Well-to-wheels analysis of energy use and greenhouse gas emissions for alternative fuels. International Journal of Applied Science and Technology 1(6):1–8. http://www.ijastnet.com/journals/Vol_1_No_6_November_2011/1.pdf.
Gaspar, D.J., B.H. West, D. Ruddy, T.J. Wilke, E. Polikarpov, T.L. Alleman, A. George, et al. 2019. “Top Ten Blendstocks Derived from Biomass for Turbocharged Spark Ignition Engines: Bio-Blendstocks with Potential for Highest Engine Efficiency.” https://doi.org/10.2172/1567705.
Hydrogen Council. 2017. “Hydrogen Scaling Up.” November 13. https://hydrogencouncil.com/wp-content/uploads/2017/11/Hydrogen-Scaling-up_Hydrogen-Council_2017.compressed.pdf.
IAEA (International Atomic Energy Agency). 2013. “Hydrogen Production Using Nuclear Energy.” Technical Report NP-T-4.2. Nuclear Energy. Vienna: International Atomic Energy Agency (IAEA). http://www-pub.iaea.org/MTCD/Publications/PDF/Pub1577_web.pdf.
IEA (International Energy Agency). 2019. The Future of Hydrogen, 37. June. https://webstore.iea.org/the-future-of-hydrogen.IEA. 2020a. Hydrogen. IEA, Paris. https://www.iea.org/reports/hydrogen.
IEA. 2020b. The Covid-19 Crisis and Clean Energy Progress. IEA, Paris. https://www.iea.org/reports/the-covid-19-crisis-and-clean-energy-progress.
James, B.D., D. DeSantis, and G. Saur. 2019. “2019 Analysis of Advanced Hydrogen Production Pathways.” DOE Hydrogen and Fuel Cells Program, 2019 Annual Progress Report. https://www.hydrogen.energy.gov/pdfs/progress19/h2f_p102_james_2019.pdf.
Küngas, R. 2020. Review—electrochemical CO2 reduction for CO production: Comparison of low- and high-temperature electrolysis technologies. Journal of the Electrochemical Society 167(4):044508. https://doi.org/10.1149/1945-7111/ab7099.
Larson, E., C. Greig, J. Jenkins, E. Mayfield, A. Pascale, C. Zhang, J. Drossman, et al. 2020. “Net-Zero America: Potential Pathways, Infrastructure, and Impacts.” Princeton, NJ: Princeton University. December 15. https://environmenthalfcentury.princeton.edu/sites/g/files/toruqf331/files/2020-12/Princeton_NZA_Interim_Report_15_Dec_2020_FINAL.pdf.
Lawson, A. 2018. “Decarbonizing U.S. Power.” C2ES.
Li, X., P. Anderson, H.M. Jhong, M. Paster, J.F. Stubbins, and P.J.A. Kenis. 2016. Greenhouse gas emissions, energy efficiency, and cost of synthetic fuel production using electrochemical CO2 conversion and the Fischer–Tropsch process. Energy and Fuels 30(7):5980–5989. https://doi.org/10.1021/acs.energyfuels.6b00665.
Liu, X., K. Reddi, A. Elgowainy, H. Lohse-Busch, M. Wang, and N. Rustagi. 2020. Comparison of well-to-wheels energy use and emissions of a hydrogen fuel cell electric vehicle relative to a conventional gasoline-powered internal combustion engine vehicle. International Journal of Hydrogen Energy 45(1):972–983. https://doi.org/10.1016/j.ijhydene.2019.10.192.
Mahajan, M. 2019. “How to Reach U.S. Net Zero Emissions by 2050: Decarbonizing Electricity.” https://www.forbes.com/sites/energyinnovation/2019/11/12/how-to-reach-us-net-zero-emissions-by-2050-decarbonizing-electricity/#445d68ac49e7.
MIT Energy Initiative. 2019. Insights into Future Mobility. Cambridge, MA: MIT Energy Initiative. http://energy.mit.edu/insightsintofuturemobility.
NASEM (National Academies of Sciences, Engineering, and Medicine). 2019. Gaseous Carbon Waste Streams Utilization: Status and Research Needs. Washington, DC: The National Academies Press. https://doi.org/10.17226/25232.
NASEM. 2021. Accelerating Decarbonization of the U.S. Energy System. Washington, DC: The National Academies Press. https://doi.org/10.17226/25932.
Neste. 2016. “Renewable Diesel Handbook.” Neste. https://www.neste.com/sites/default/files/attachments/neste_renewable_diesel_handbook.pdf.
NETL (National Energy Technology Laboratory). 2011. “Affordable, Low-Carbon Diesel Fuel from Domestic Coal and Biomass.”
NH2E (Natural Hydrogen Energy LLC). 2019. “Energy of Natural Hydrogen.” http://nh2e.com/.
NREL (National Renewable Energy Laboratory). n.d. “H2A: Hydrogen Analysis Production Case Studies.” Hydrogen and Fuel Cells. https://www.nrel.gov/hydrogen/h2a-production-case-studies.html.
Peterson, D., J. Vickers, and D. DeSantis. 2020. “Hydrogen Production Cost from PEM Electrolysis-2019.” DOE Hydrogen and Fuel Cells Program Record, February 3. https://www.hydrogen.energy.gov/pdfs/19009_h2_production_cost_pem_electrolysis_2019.pdf.
Phillips, S.D., J.K. Tarud, M.J. Biddy, and A. Dutta. 2011. “Gasoline from Wood via Integrated Gasification, Synthesis, and Methanol-to-Gasoline Technologies.” January 1. https://doi.org/10.2172/1004790.
Ramachandran, S., and U. Stimming. 2015. Well to wheel analysis of low carbon alternatives for road traffic. Energy and Environmental Science 8(11):3313–3324. https://doi.org/10.1039/C5EE01512J.
Ramsden, T., and F. Joseck. 2018. “Hydrogen R&D Cost Target Calculation—2018 Update.” DOE Program Record (Fuel Cell Technologies Office). September. https://www.hydrogen.energy.gov/pdfs/18004_h2_cost_target_calculation_2018.pdf.
Randolph, K., and S. Studer. 2017. “Hydrogen Production Cost from Fermentation.” DOE Hydrogen and Fuel Cells Program Record. U.S. Department of Energy. February 27. https://www.hydrogen.energy.gov/pdfs/16016_h2_production_cost_fermentation.pdf.
Reed, J., E. Dailey, B. Shaffer, B. Lane, R. Flores, A. Fong, and G.S. Samuelsen. 2020. Roadmap for the Deployment and Buildout of Renewable Hydrogen Production Plants in California. CEC. Publication Number: CEC-600-2020-002.
Reisert, M., A. Aphale, and P. Singh. 2018. Solid oxide electrochemical systems: Material degradation processes and novel mitigation approaches. Materials 11(11):2169.
Renewable Energy Group. 2020. “REG Ultra Clean.” https://www.regi.com/products/transportation-fuels/reg-ultra-clean-diesel. Robinson, J. 2020. “Cost, Logistics Offer ‘Blue Hydrogen’ Market Advantages over ‘Green’ Alternative.” https://www.spglobal.com/platts/en/market-insights/latest-news/electric-power/031920-cost-logistics-offer-blue-hydrogen-market-advantages-over-green-alternative.
Royal Society. 2019. Sustainable Synthetic Carbon Based Fuels for Transport: Policy Briefing. September. https://royalsociety.org/-/media/policy/projects/synthetic-fuels/synthetic-fuels-briefing.pdf.
Sánchez, O.G., Y.Y. Birdja, M. Bulut, J. Vaes, T. Breugelmans, and D. Pant. 2019. Recent advances in industrial CO2 electroreduction. Current Opinion in Green and Sustainable Chemistry 16:47–56. April. https://doi.org/10.1016/j.cogsc.2019.01.005.
Schalenbach, M., A.R. Zeradjanin, O. Kasian, S. Cherevko, and K.J.J. Mayrhofer. 2018. A perspective on low-temperature water electrolysis—challenges in alkaline and acidic technology. International Journal of Electrochemical Science. 13:1173–1226. doi: 10.20964/2018.02.26.
Soletair Power. 2020. “Sales of First Commercial Power-to-X Unit.” Soletair Power (blog). June 1. https://www.soletairpower.fi/2020/06/sales-of-first-commercial-power-to-x-unit/.
Vickers, J., D. Peterson, and K. Randolph. 2020. “Cost of Electrolytic Hydrogen Production with Existing Technology.” DOE Hydrogen and Fuel Cells Program Record. U.S. Department of Energy, September 22. https://www.hydrogen.energy.gov/pdfs/20004-cost-electrolytic-hydrogen-production.pdf.
Weekes, D.M., D.A. Salvatore, A. Reyes, A. Huang, and C.P. Berlinguette. 2018. Electrolytic CO2 reduction in a flow cell. Accounts of Chemical Research 51(4):910–918. https://doi.org/10.1021/acs.accounts.8b00010.
Zablocki, A. 2019. “Fact Sheet: Energy Storage (2019).” Environmental and Energy Study Institute (EESI). https://www.eesi.org/papers/view/energy-storage-2019.
Zeman, F.S., and D.W. Keith. 2008. Carbon neutral hydrocarbons. Philosophical Transactions of the Royal Society A: Mathematical, Physical and Engineering Sciences 366(1882):3901–3918. https://doi.org/10.1098/rsta.2008.0143.
Zgonnik, V. 2020. The occurrence and geoscience of natural hydrogen: A comprehensive review. Earth-Science Reviews 203(April 1):103140.


