
7
Non-Powertrain Technologies
Non-powertrain technologies, such as improved vehicle design, material substitution, and tire technologies, can reduce fuel consumption and greenhouse gas (GHG) emissions and improve energy efficiency through reduction in road loads of aerodynamic drag, vehicle mass, and tire rolling resistance. Such loads can represent 12%–19% of the vehicle energy consumption for a conventional vehicle, 16%–26% of total vehicle energy consumption for hybrid vehicles, and 64% for battery electric vehicles (BEVs) (see Figures 7.19–7.21 in Section 7.3.2, below). Additionally, more efficient accessories can reduce loads for climate control, power steering, and other power requirements. Accessory loads (not including air conditioning [A/C]) can represent up to 2% of total electricity loads for conventional vehicles, 3% for hybrids, and 4% for BEVs. A/C can represent up to 30 gallons/year with average vehicle use, about 5% of consumption (Kreutzer et al., 2017). Non-powertrain technologies that may be a part of the U.S. light-duty fleet in 2025–2035 are described below, and their costs and effectiveness estimated. Manufacturing issues and safety aspects of the technologies are also discussed.
7.1 AERO
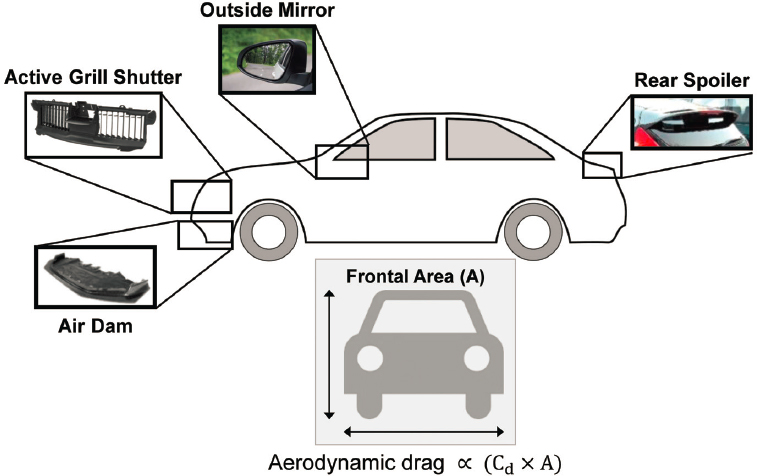
The aerodynamic drag of a vehicle is most relevant for the portion of driving at high speed. Aerodynamic drag can be evaluated by multiplying vehicle frontal area (A) by a scaling factor, the drag coefficient (Cd). Table 7.1 reports the values for frontal area and Cd used in the Argonne National Laboratory Autonomie modeling for the 2020 Safer Affordable Fuel Efficient (SAFE) Vehicles Rule. Aerodynamic drag is primarily lowered by changes in vehicle body design but also through the addition of vehicle devices. In the 2020 SAFE Rule, aerodynamic drag reductions were separated into four categories for 5%, 10%, 15%, and 20% improvements (AERO5, AERO10, AERO15, and AERO20, respectively) with respect to a baseline, AERO0 (NHTSA/EPA, 2020). AERO levels were assigned to model year (MY) 2017 vehicles based on their percent reduction in Cd from the average value of the relevant body style in MY 2015 (Table 7.2). Aerodynamic improvements are typically achieved via incorporation of both passive and active aerodynamic technologies, examples of which are discussed further below.
A 2013 National Research Council committee estimated that under average driving conditions, a 10% reduction in drag resistance would reduce fuel consumption by about 2%. In that study’s scenarios, reduction in new-vehicle-fleet aerodynamic drag resistance for the midrange case is estimated to average about 21% (4% reduction in fuel consumption) in 2030 and 35% (7% reduction in fuel consumption) in 2050. For the optimistic case, the aerodynamic drag reductions are estimated to average about 28% in 2030 and 41% in 2050 (NRC, 2013). The SAFE
TABLE 7.1 Values for Cd and Frontal Area Used in Autonomie Modeling
| Vehicle Class | Drag Coefficient (Cd) | Frontal Area (A, m2) | Cd × A |
|---|---|---|---|
| Compact car | 0.31 | 2.30 | 0.713 |
| Midsize car | 0.30 | 2.35 | 0.705 |
| Small SUV | 0.36 | 2.65 | 0.954 |
| Midsize SUV | 0.38 | 2.85 | 1.083 |
| Pickup truck | 0.42 | 3.25 | 1.365 |
NOTE: SUV = sport utility vehicle.
SOURCE: Islam et al. (2020).
Rule estimated that fleet-wide aerodynamic drag reductions of 10% to 20% could reduce fuel consumption by approximately 2% to 4% compared to the baseline fleet (NHTSA/EPA, 2020). Opportunities for aerodynamic drag reduction are shown in Figure 7.1.
There are two categories of aerodynamic drag reduction technologies, passive and active. Features that reduce aerodynamic drag via fixed changes to a vehicle’s shape and size are termed passive aerodynamic technologies. Such features are implemented primarily during major model redesign cycles and include changing the frontal area or shape and lowering the vehicle height. However, the effects of these alterations on other vehicle attributes, such as utility, interior space, and engine cooling, must also be considered. Additional passive aerodynamic technologies can be employed during the midcycle refresh process. Vehicle components that can be added or modified to decrease aerodynamic drag include the exterior mirrors, underbody panels, front air dams, front and rear fascia, rear deck lips, and rear valances. Active aerodynamic technologies monitor the driving situation and deploy accordingly. Examples of active technologies include active grill shutters (AGS) and active ride height, which have sensors that cause the air dams or suspension systems to move in order to reduce aerodynamic drag.
7.1.1 Outside Mirrors (Replaced with Cameras)
Exterior side mirrors contribute to aerodynamic drag, thereby increasing vehicle fuel consumption. Replacing mirrors with cameras can reduce drag by an average of 2% to 7%, which results in a 0.3% to 1% improvement in fuel consumption (Yang, 2018). Additionally, the use of cameras removes the requirement to mount external mirrors and therefore decreases manufacturing complexity. Such cameras cost around $500, and mirror replacement can yield cost savings of $200–$400 depending on the complexity of the system. The wiring costs for cameras and external mirrors are approximately equal.
Substituting cameras for mirrors would require a change in vehicle safety regulation, as the National Highway Traffic Safety Administration (NHTSA) currently requires passenger vehicles to be equipped with at least two mirrors. In October 2019, NHTSA released a notice seeking public and industry input to inform a possible proposal to alter mirror requirements and allow camera monitoring systems to replace rear- and side-view mirrors. At the time of writing of this report, the proposed rule remains open for public comment.
TABLE 7.2 Percent of MY 2017 Fleet in Each AERO Level
| AERO Level | % of MY 2017 Fleet |
|---|---|
| AERO0 | 41 |
| AERO5 | 40 |
| AERO10 | 13 |
| AERO15 | 5 |
| AERO20 | 1 |
SOURCE: Table VI-162 of NHTSA/EPA (2020).
SOURCE: Committee generated using images from the public domain; Roechling Automotive (2020); and APR Performance.
7.1.2 Passive and Active Air Dams
At high speeds, the flow of air across a vehicle’s underbody contributes to increased aerodynamic drag. Devices such as air dams, air scoops, and undercovers can be added onto the vehicle to control airflow around the underbody. At present, underbody panels are widely implemented with approximately 65% of 2015 vehicles equipped with this technology. Air dams, located beneath the front bumper, are used to redirect airflow to the sides of the vehicle, reducing turbulence underneath and thus reducing drag approximately 2% (NHTSA/EPA, 2020). In 2015, approximately one-quarter of new vehicles were equipped with front bumper air dams. Active air dams have even greater potential for reducing drag at high speeds (4–9%) and are ready for implementation but are not yet widely offered by manufacturers. Active air dams cost $30–$50, and passive air dams are less expensive, around $15–$25.
7.1.3 Active Grill Shutters
When a vehicle is in motion, air is drawn into a vehicle’s engine through the grill located at the front of the vehicle. The majority of that air passes through the radiator located directly behind the grill, helping to keep the engine cool. However, there is often more air entering the engine bay than is needed to keep the engine cool. The unnecessary air entering the engine bay can add significant aerodynamic drag to the car. AGS selectively restrict airflow to the engine with an automatic opening and closing of shutters based on real-time needs. This reduces aerodynamic drag, thereby leading to improved fuel economy. AGS offers significant weight reduction up to 20%, owing to lower weight materials, and improvement in aerodynamic performance up to 3.0% compared to a non-AGS vehicle. Major automakers have been incorporating AGS into a wide variety of vehicle models. On average, AGS costs $300, with some variation owing to size and complexity.
7.1.4 Active Ride Height
Active ride height controls allow a vehicle to raise or lower its suspension depending on speed and road conditions, typically using hydraulic systems or air pressure pumps. Such controls are mainly used on premium
vehicles to improve handling performance, maintaining comfort and stability in bumpy road conditions or off-road driving. Active ride height can also benefit fuel economy. The most aerodynamic drag reduction is achieved when a vehicle is lower to the ground; thus, active ride height systems automatically decrease vehicle height during smooth driving conditions (e.g., highway) to achieve the highest possible fuel efficiency (YourMechanic, 2015). These systems cost about $150 per vehicle.
7.1.5 Impact from Vehicle Electrification
Vehicles with electrified powertrains, especially those without an internal combustion engine (ICE), exhibit different aerodynamic behavior than vehicles with a combustion engine, owing to their thermal requirements, and prevalent vehicle designs based on different space constraints and opportunities. Vehicles with ICEs and fuel cell electric vehicles (FCEVs) require oxygen flow for combustion or hydrogen oxidation, which introduces intake and exhaust requirements and associated aerodynamic constraints. ICEs also produce a great deal of thermal waste energy that must be cooled, in part by exposing the powertrain components to ambient air under the vehicle. FCEVs produce heat at lower temperatures than ICE vehicles and therefore require larger radiators to reject that heat, which generally increases aerodynamic drag. BEVs produce much less heat from the propulsion system and require less cooling. BEVs therefore can have a smoother exterior and a flat underbody, which improves their aerodynamics. A challenge for aerodynamics of electric vehicles (EVs) is higher ride height caused by placement of their large battery packs at the base of the vehicle. For strong hybrids and BEVs, placing batteries at the base of the vehicle improves vehicle handling, with the heavy battery components lowering the vehicle center of gravity, and simplifies vehicle design, including for variable battery capacity. It also restores vehicle passenger and cargo room that would otherwise be taken up by battery packs. This, however, often leads to vehicle designs with increased frontal area, higher ride height, larger diameter wheels, and reduced essential overhang to accommodate passengers in the cabin. Tesla EVs are an exception to the higher ride height and show that EV designs do not necessarily have poor aerodynamics. As more BEV models are introduced in performance vehicles and the BEV skateboard concept becomes prevalent, the higher ride height issue will be negated.
7.1.6 Impact from CAVs
The potential impact of connected and automated vehicles (CAVs) on aerodynamic performance depends largely on the penetration and usage patterns of CAV technology, which are influenced by a variety of factors, as discussed in Chapters 8 and 9. CAVs implement sensors that may protrude from the vehicle, such as cameras and lidar. (See Chapters 8 and 9 for more detail about these technologies.) Early test implementations of lidar in particular have involved protruding sensors, but in commercial implementations, styling and aerodynamic design should limit the profile of sensors, although some aerodynamic effects may remain. Also, if fully automated vehicles are implemented, then vehicle shape options increase, as no driver needs to be facing forward and looking out a windshield. Changes to vehicle shape could influence the vehicle’s frontal area and drag coefficient (Cd) as well as the design of the A, B, C, and D pillars. The usage pattern of CAVs will determine the impact of these changes on aerodynamic drag. Platooning is not expected to provide fuel savings for light-duty CAVs, in contrast to heavy-duty vehicles such as freight tractor-trailers. Additional discussion of the aerodynamics of CAVs can be found in Chapter 8.
7.1.7 Cost of Aerodynamic Technologies
The 2020 SAFE Rule provides direct manufacturing costs (DMC) for achieving aerodynamic improvements at each level, separated into categories for (1) passenger cars and sport utility vehicles (SUVs) and (2) pickup trucks (NHTSA/EPA, 2020). While the costs of specific technologies are not provided, sample lists of technologies to achieve each AERO level are reported, again separated by vehicle class. The rule attributes the higher costs for AERO15 and AERO20 to the required implementation of active as well as passive aerodynamic technologies. These sample technology lists and DMC are reported in Tables 7.3 and 7.4, respectively. Table 7.5 summarizes cost and effectiveness values for the specific aerodynamic technologies described in Sections 7.1.1–7.1.4.
TABLE 7.3 Example Technology Combinations to Achieve Each AERO Level
| AERO Level | Improvements for Passenger Cars and SUVs | Improvements for Pickup Trucks |
|---|---|---|
| AERO5 | Front styling, Roof line raised at forward of B pillar, Faster A pillar rake angle, Shorter C pillar, Low-drag wheels |
Whole body styling (shape optimization), Faster A pillar rake angle, Rear spoiler, Wheel deflector/air outlet inside wheel housing, Bumper lip |
| AERO10 | AERO5 Technologies + Rear spoiler, Wheel deflector/air outlet inside wheel housing, Bumper lip, Rear diffuser |
AERO5 Technologies + Rear diffuser, Underbody cover (including rear axle cladding) |
| AERO15 | AERO10 Technologies + Underbody cover (including rear axle cladding), Lowering ride height by 10 mm |
AERO10 Technologies + Active grill shutters, Extended air dam |
| AERO20 | AERO15 Technologies + Active grill shutters, Extended air dam |
N/A |
SOURCE: Adapted from Tables VI-160 and VI-161 of NHTSA/EPA (2020).
TABLE 7.4 DMC for Aerodynamic Drag Reductions
| AERO Level | Passenger Cars and SUVs DMC (2018$, MY 2017) | Pickup Trucks DMC (2018$, MY 2017) |
|---|---|---|
| AERO0 | $0.00 | $0.00 |
| AERO5 | $39.38 | $39.38 |
| AERO10 | $80.51 | $80.51 |
| AERO15 | $113.76 | $201.27 |
| AERO20 | $201.27 | $525.06 |
SOURCE: Adapted from Tables VI-165 and VI-166 of NHTSA/EPA (2020).
TABLE 7.5 Cost and Effectiveness of Aerodynamic Technologies
| Technology | Technology Cost | Reduction in Aerodynamic Drag | Reduction in Fuel Consumption |
|---|---|---|---|
| Camera (to replace outside mirrors) | $500a | 2%–7% | 0.3%–1% |
| Passive air dam | $15–$25 | 2% | 0.4% |
| Active air dam | $30–$50 | 4%–9% | 0.8%–1.8% |
| Active grill shutter | $300 | 3% | 0.6% |
| Active ride height | $150 | 3% | 0.6% |
a Cost per camera; note that replacing mirrors can also yield $200–$400 in cost savings.
7.1.8 Future of Aerodynamic Technologies
Manufacturers have widely deployed both active and passive aerodynamic drag reduction technologies. As of 2015, the most widely implemented aerodynamic drag reduction technologies were wheel dams, underbody panels, front bumper air dams, and AGS (NHTSA/EPA, 2020). The 2020 SAFE Rule notes that the prevalence of AGS, which can yield up to 3% aerodynamic improvement, has since increased further. Nonetheless, 80% of the MY 2017 fleet achieved less than 10% improvement in aerodynamic drag reduction relative to the baseline value (NHTSA/EPA, 2020). Some active aerodynamic drag reduction technologies, such as active ride height and active air dams, are available for implementation but have not been widely offered by manufacturers. However, the market for technologies is predicted to grow significantly in the next 5 to 10 years.
Even as technologies for aerodynamic drag reduction continue to be deployed, reduction in actual aerodynamic drag achieved in the fleet may not occur given the shift in consumer preference to crossover utility vehicles (CUVs) and SUVs over sedans. As noted above, aerodynamic drag is proportional to the product of frontal area and Cd, and pickup trucks, SUVs, and CUVs have a larger frontal area than sedans. For example, using the values in Table 7.1, even a 20% reduction in the drag coefficient of a small SUV, with no change to frontal area, would still give a larger (Cd × A) than that of a midsize car with no aerodynamic drag reduction from the baseline. The general consumer shift to vehicles with larger frontal area, such as CUVs, SUVs, and pickup trucks, will dull the impact of reductions in Cd. Similar trends might be observed as frontal area increases with EV penetration and as electrification becomes more common on larger unibody vehicles and trucks, as described in Section 7.1.5 above. Ultimately, aerodynamic technologies will not be the only, or even perhaps the major, factor influencing the average aerodynamic drag properties of the light-duty fleet.
7.1.9 Findings and Recommendation for Aerodynamic Technologies
FINDING 7.1: Manufacturers have widely deployed both active and passive aerodynamic drag reduction technologies, including designing for low Cd and implementing grill and air dam shutters and low-drag underbodies. Further improvements in fuel economy from aerodynamic reductions through passive and active technologies will be somewhat limited, as the next options are relatively expensive.
FINDING 7.2: Aerodynamic drag is higher in sport utility vehicles (SUVs) and crossover utility vehicles (CUVs) than in sedans. Consumer preference for SUVs and CUVs will therefore limit the potential overall reduction of aerodynamic drag in the light-duty fleet. Electrification was initially incorporated on small vehicles but now is moving to CUVs and light-duty trucks. The EV emphasis on performance may profoundly shift the market (i.e., no grills and lower center of gravity).
FINDING 7.3: Regulation permitting, the elimination of outside mirrors has the potential for meaningful reductions in aerodynamic drag.
RECOMMENDATION 7.1: Pending the results of a full safety review, the National Highway Traffic Safety Administration should alter mirror requirements to allow camera monitoring systems to replace rear- and side-view mirrors.
7.2 MASS REDUCTION
From 2025–2035, mass reduction will be implemented in the context of increasingly electrified powertrains; developments in alternative manufacturing technologies and processes; varying raw material availability and cost; and company goals for technology leadership, meeting customer needs, corporate sustainability, and regulatory compliance. Lightweighting is one of the significant levers that can be utilized to increase fuel economy and is also used to improve aspects of performance like acceleration time and handling. It is most effective when holistically incorporated into the vehicle design through design optimization. Assuming no mass add-back, a 10% mass reduction generally produces an increase in fuel economy of 6%–7% for passenger cars and 4%–5% for light trucks (NRC, 2015).
Automakers take a holistic approach when determining the best methods to achieve fuel economy targets for a particular vehicle, meaning that all opportunities are considered and then valued in terms of overall effectiveness. Lightweighting is evaluated similarly, and there are key elements to be considered: (1) primary mass reduction (actual component lightweighting); (2) secondary mass reduction (owing to the lighter vehicle load, downsizing the powertrain or suspension components to deliver carryover performance); (3) mass add-back (to meet market requirements); and (4) market shifts in vehicle type and class, which greatly impact the corporate average fuel economy (CAFE).1 (See Chapter 11 for further discussion of consumer choice.) The committee considers primary and secondary mass reductions in estimating the cost and fuel economy effectiveness of material substitution and design optimization for manufacturers’ compliance options. Mass add-back and shifts in vehicle type and class impact the total effectiveness of the standards in meeting the goals of fuel consumption and GHG reduction. However, these effects are under the management of test weight class and overall CAFE by each manufacturer, as they involve an understanding of the model’s baseline assumptions and its footprint-based standard.
In recent years, lightweighting via materials substitution has occurred primarily in a shift away from mild steel and toward medium- and high-strength steel and aluminum. Trends in material use in the North American light-duty vehicle fleet from 2008 to 2018 are shown in Table 7.6, both as average pounds per vehicle and as percentage of total vehicle weight.
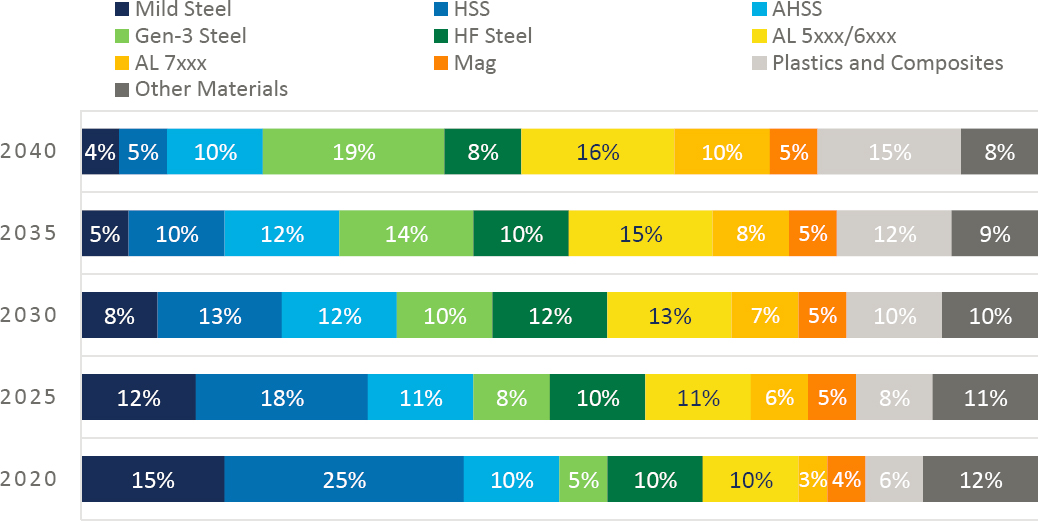
Advances in materials, design, and manufacturing will continue to lead to new options for lighter materials in light-duty vehicles. Table 7.7 reports material use by vehicle component for a MY 2020 baseline fleet, which was determined by analyzing the 33 highest-selling vehicles in the 2019 U.S. fleet (Bailo et al., 2020). The material penetration in this MY 2020 fleet is consistent with a 5% mass reduction from the MY 2016 baseline, for primary mass reduction alone and not including mass add-back for customer comfort, safety features, and so on. The MY 2020 fleet includes a mix of mild and high-strength steel, aluminum, magnesium, and composites. Structural components such as frames tend toward steel, while closures are more likely to be aluminum. Figure 7.2 shows an example of projected material progression in the U.S. light-duty fleet from 2020 to 2040, in which material composition of the body-in-white and closures shifts from steel to lighter weight materials including generation-3 steel, aluminum, magnesium, and polymeric materials.
In addition to materials substitution, automakers will use design optimization to reduce mass in vehicles. About 40% of the vehicles included in the MY 2020 baseline fleet described above are expected to be redesigned before MY 2025. In 2025–2035, vehicle design for lightweighting will occur in the context of increased mass that comes with electric powertrains and comfort and safety features associated with driver assist and CAVs. Mass increase owing to electrification is expected to be much larger than that for CAV technologies. Figure 7.3 shows an estimate of mass added for advanced driver assistance system (ADAS) and autonomous driving features, which amounts to 22 kg (50 lb). In contrast, in comparing EVs to ICEs today, the mass added for the battery in the Chevy Bolt amounts to 436 kg, leading to a Bolt that is about 300 kg (660 lb) or 22% heavier than a VW Golf (UBS, 2017).
In 2025–2035, the mass increase relative to conventional ICE vehicles is expected to be approximately 300 kg (660 lb) for EV propulsion and 22.4 kg (50 lb) for driver assist and connected automated vehicle technology in a small or medium-size car (UBS, 2017; Figure 7.3; Gawron et al., 2018). Larger vehicles, or those with longer ranges, will have even greater increases owing to the battery. Because the majority of the energy of a BEV’s propulsion system goes to moving the vehicle, a reduction in vehicle weight, including reducing the weight/energy of the battery, is key to increasing the range of the vehicle, rather than improvements in the efficiency of the electric drive system.
___________________
1 Consider a base vehicle that an automaker wants to optimize for mass reduction during a redesign. Primary mass reduction is the mass reduction taken first, through design optimization and materials substitution, primarily of the body and closures. Secondary mass reduction is taken in the powertrain, suspension, and other vehicle components, made possible by the primary mass reduction. In practice, both primary and secondary mass reduction are considered, and ideally optimized, together. Mass add-back is mass that is added to the lightweighted vehicle, which would have also been added to the base, unlightweighted vehicle. For example, this includes the mass of technologies that the automaker must or wants to add during the redesign for competitiveness. These include mandatory items related to regulatory changes as well as improved features related to human-machine interface, climate control features, and so on. Market shifts address the impact of consumer and automaker choices on the mix of heavy and light vehicles in the market. Market shifts consider the shift in sales between models, as well as between vehicle classes.
TABLE 7.6 Average Material Use in the North American Light-Duty Fleet 2008–2018, Reported in Pounds per Vehicle and as Percent of Total Vehicle Weight
| 2008 | 2009 | 2010 | 2011 | 2012 | 2013 | 2014 | 2015 | 2016 | 2017 | 2018 | |
|---|---|---|---|---|---|---|---|---|---|---|---|
| Average weight (pounds/vehicle) | 3965 | 3860 | 3865 | 3914 | 3806 | 3812 | 3834 | 3889 | 3929 | 3960 | 3979 |
| Regular steel | 1596 | 1462 | 1422 | 1405 | 1335 | 1322 | 1308 | 1293 | 1295 | 1222 | 1215 |
| High- and medium-strength steel | 513 | 510 | 541 | 594 | 604 | 612 | 632 | 681 | 720 | 765 | 772 |
| Stainless steel | 74 | 67 | 70 | 71 | 66 | 72 | 71 | 73 | 72 | 72 | 71 |
| Other steels | 32 | 30 | 31 | 31 | 29 | 31 | 31 | 31 | 31 | 31 | 30 |
| Iron castings | 248 | 201 | 236 | 255 | 263 | 264 | 271 | 260 | 242 | 244 | 249 |
| Aluminum | 310 | 319 | 332 | 337 | 342 | 348 | 361 | 387 | 404 | 415 | 427 |
| Magnesium | 11 | 11 | 11 | 11 | 10 | 10 | 9 | 9 | 9 | 10 | 10 |
| Copper and brass | 69 | 70 | 72 | 71 | 70 | 69 | 67 | 65 | 67 | 69 | 69 |
| Lead | 43 | 41 | 40 | 38 | 35 | 34 | 35 | 35 | 35 | 37 | 34 |
| Zinc castings | 9 | 9 | 9 | 9 | 8 | 8 | 8 | 8 | 8 | 9 | 9 |
| Powder metal | 42 | 40 | 40 | 41 | 43 | 44 | 45 | 44 | 43 | 44 | 44 |
| Other metals | 5 | 5 | 5 | 5 | 5 | 5 | 4 | 5 | 5 | 5 | 5 |
| Plastics/polymer composites | 334 | 368 | 343 | 336 | 319 | 317 | 317 | 324 | 325 | 348 | 351 |
| Rubber | 202 | 246 | 228 | 223 | 205 | 197 | 194 | 196 | 196 | 204 | 205 |
| Coatings | 31 | 35 | 35 | 32 | 27 | 27 | 28 | 28 | 28 | 30 | 28 |
| Textiles | 47 | 57 | 54 | 49 | 48 | 49 | 48 | 44 | 44 | 46 | 46 |
| Fluids and lubricants | 211 | 214 | 215 | 217 | 215 | 218 | 220 | 221 | 222 | 222 | 223 |
| Glass | 97 | 87 | 90 | 96 | 93 | 94 | 94 | 93 | 92 | 95 | 97 |
| Other | 89 | 88 | 90 | 91 | 89 | 90 | 91 | 93 | 91 | 92 | 95 |
| 2008 | 2009 | 2010 | 2011 | 2012 | 2013 | 2014 | 2015 | 2016 | 2017 | 2018 | |
| As a percent of total weight | 100.0 | 100.0 | 100.0 | 100.0 | 100.0 | 100.0 | 100.0 | 100.0 | 100.0 | 100.0 | 100.0 |
| Regular steel | 40.2 | 37.9 | 36.8 | 35.9 | 35.1 | 34.7 | 34.1 | 33.2 | 33.0 | 30.9 | 30.5 |
| High- and medium-strength steel | 12.9 | 13.2 | 14.0 | 15.2 | 15.9 | 16.1 | 16.5 | 17.5 | 18.3 | 19.3 | 19.4 |
| Stainless steel | 1.9 | 1.7 | 1.8 | 1.8 | 1.7 | 1.9 | 1.9 | 1.9 | 1.8 | 1.8 | 1.8 |
| Other steels | 0.8 | 0.8 | 0.8 | 0.8 | 0.8 | 0.8 | 0.8 | 0.8 | 0.8 | 0.8 | 0.8 |
| Iron castings | 6.3 | 5.2 | 6.1 | 6.5 | 6.9 | 6.9 | 7.1 | 6.7 | 6.1 | 6.2 | 6.2 |
| Aluminum | 7.8 | 8.3 | 8.6 | 8.6 | 9.0 | 9.1 | 9.4 | 10.0 | 10.3 | 10.5 | 10.7 |
| Magnesium | 0.3 | 0.3 | 0.3 | 0.3 | 0.3 | 0.3 | 0.2 | 0.2 | 0.2 | 0.2 | 0.3 |
| Copper and brass | 1.8 | 1.8 | 1.9 | 1.8 | 1.8 | 1.8 | 1.7 | 1.7 | 1.7 | 1.7 | 1.7 |
| Lead | 1.1 | 1.1 | 1.0 | 1.0 | 0.9 | 0.9 | 0.9 | 0.9 | 0.9 | 0.9 | 0.9 |
| Zinc castings | 0.2 | 0.2 | 0.2 | 0.2 | 0.2 | 0.2 | 0.2 | 0.2 | 0.2 | 0.2 | 0.2 |
| Powder metal | 1.1 | 1.0 | 1.0 | 1.0 | 1.1 | 1.2 | 1.2 | 1.1 | 1.1 | 1.1 | 1.1 |
| Other metals | 0.1 | 0.1 | 0.1 | 0.1 | 0.1 | 0.1 | 0.1 | 0.1 | 0.1 | 0.1 | 0.1 |
| Plastics/polymer composites | 8.4 | 9.5 | 8.9 | 8.6 | 8.4 | 8.3 | 8.3 | 8.3 | 8.3 | 8.8 | 8.8 |
NOTE: Polypropylene is also used in the thermoplastics polyolefin elastomers (TPO) as well and its use in that area is reported separately under rubber. Average TPO use is nearly 35 pounds per vehicle.
SOURCE: ACC (2019).
TABLE 7.7 Materials Use by Vehicle Component for MY 2016 and MY 2020 Baseline
| Component | MY 2016 Baseline | MY 2020 Baseline |
|---|---|---|
| Fender | Mild/BH steel | BH steel and aluminum (50:50) |
| A-pillar | AHSS | UHSS 1500 hot formed |
| Floor | Mild steel | HSS 440–590 with UHSS reinforce |
| Front bumper structure | AHSS | Mostly aluminum with some steel |
| Roof panel | Mild steel | Mild/BH steel |
| Door outer | Mild/BH steel | LSS and aluminum |
| Hood | Aluminum | 95% aluminum |
| Decklid | Mild steel | LSS, Al, Mg, composite |
| Engine cradle/front frame | HSLA | HSS 400–600 |
| Steering knuckle | Iron and aluminum | HSS 400–500 and aluminum |
| IP beam | Mild steel/HSLA | HSS and two magnesium |
NOTE: AHSS = advanced high-strength steels; BH = bake hardenable; HSLA = high-strength low alloy; HSS = high-strength steels; LSS = low strength steel; UHSS = ultra-high-strength steels.
SOURCE: Bailo et al. (2020).
SOURCE: Modi and Vadhavkar (2019).
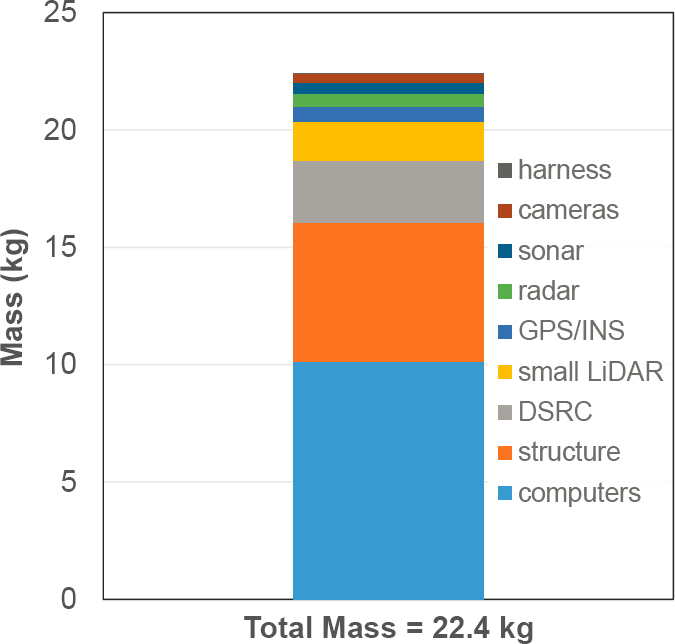
NOTE: DSRC = dedicated short-range communication; INS = inertial.
SOURCE: Committee generated based on data for a medium CAV subsystem from Gawron et al. (2018).
Reducing the weight of an EV by 20% will increase the range by up to 14% (Bull, 2011). Reductions in the weight and other road loads have a synergistic effect, decreasing the amount of battery required to provide the same range, which further reduces the weight of the vehicle. The importance of range, and the synergy between vehicle weight reduction and battery reduction, indicates that BEVs may implement mass reduction technologies earlier than ICEs.
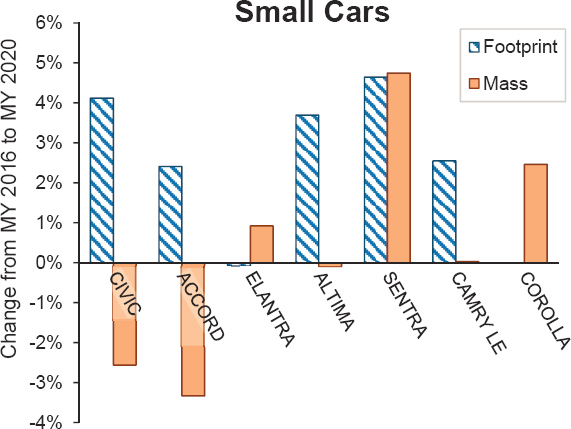
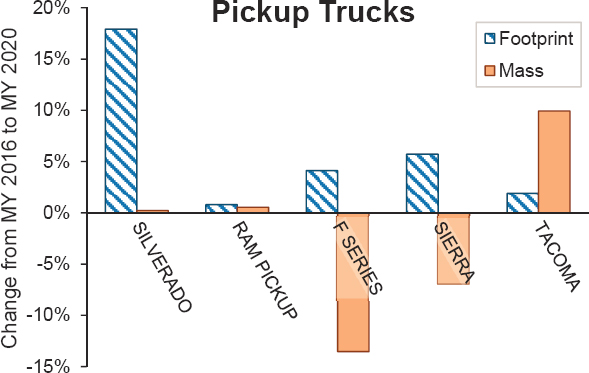
Mass reduction implemented through design and materials substitution may not lead to significant (if any) reduction in mass of vehicles on the road on a per-class or per-model basis, owing to the mass-increasing pressures that are occurring in parallel. For instance, vehicle masses of the largest selling models of small cars and pickup trucks decreased 0% and 4%, respectively, on a sales-weighted average basis between 2016 and 2020, while their footprints increased by a sales weighted average of 2% and 6%, respectively (Figures 7.4 and 7.5). During vehicle redesign for both cars and light trucks, mass add-back owing to the addition of safety and performance technologies is expected to be nearly 5% of the curb weight on average (Bailo et al., 2020).
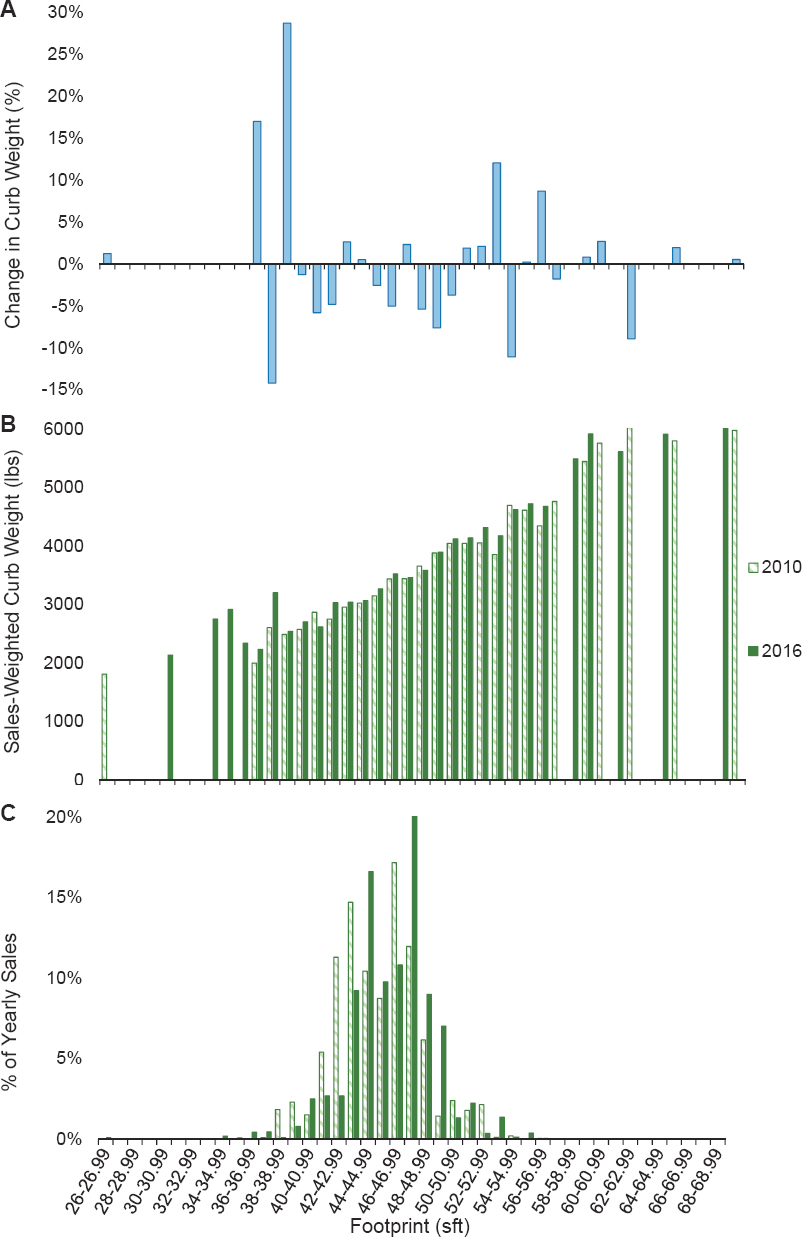
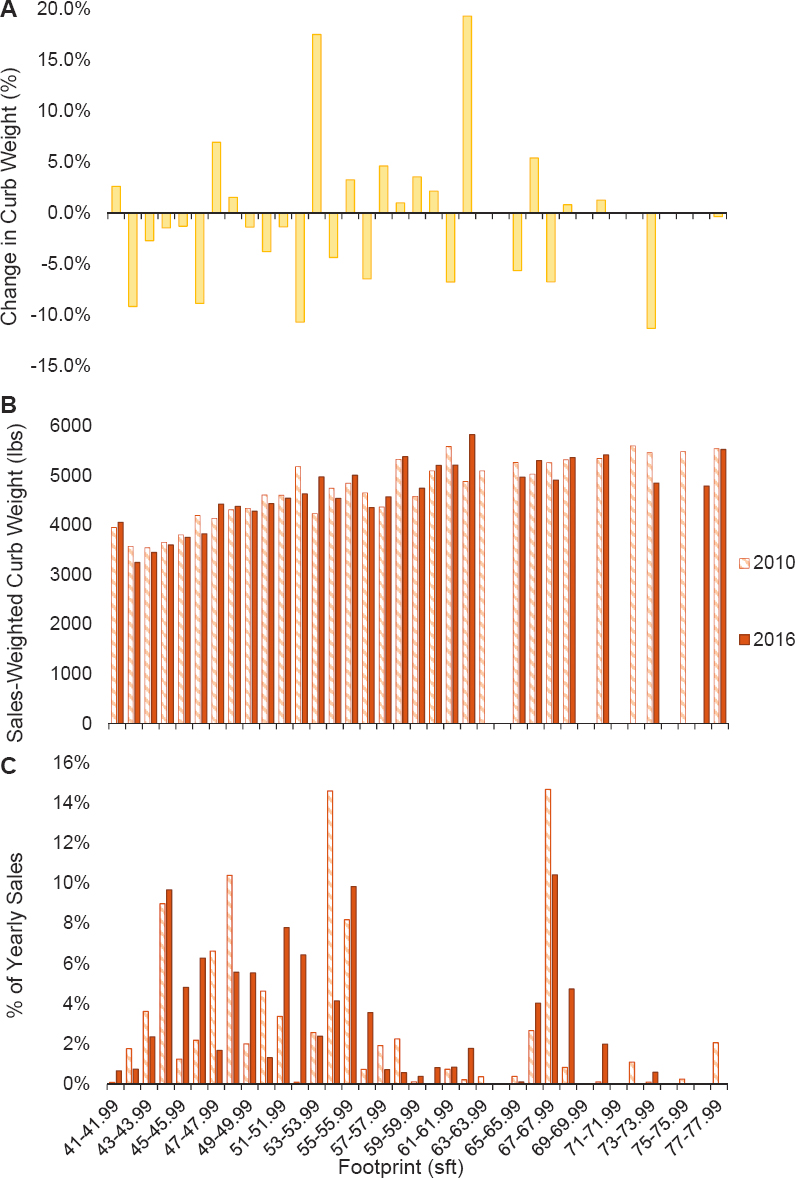
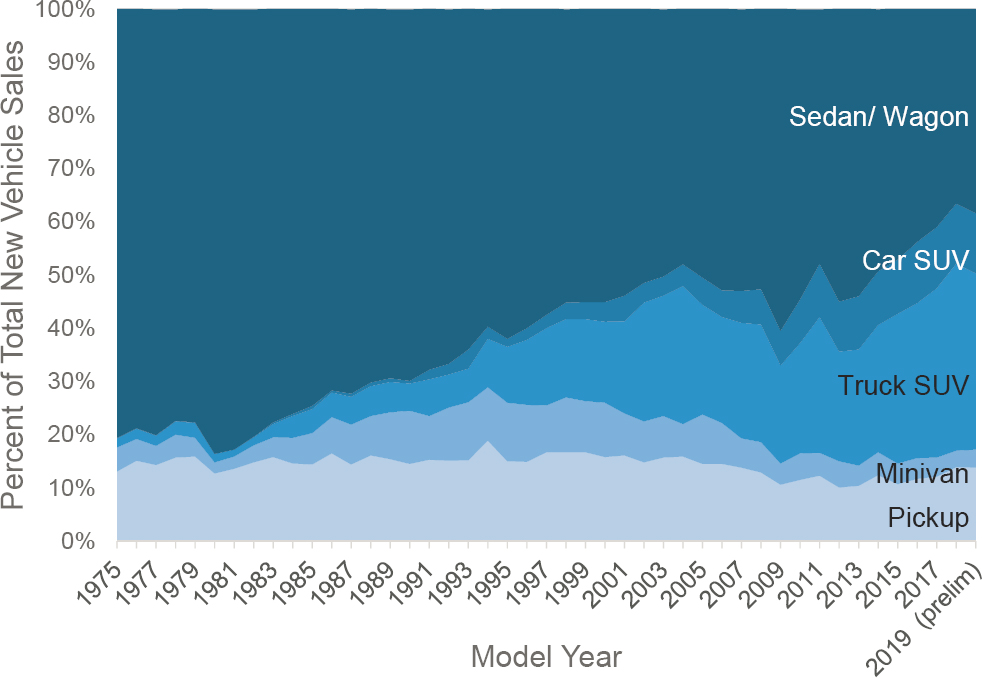
While individual models have become somewhat lighter, the mass of the new vehicle fleet has overall become heavier, as the market has shifted away from sedans to crossovers, SUVs, and trucks. Figure 7.6 shows that between the years of 2010 and 2016, the mass increase for cars has occurred owing to an increase in vehicle footprint, rather than an increase in weight within a given footprint. Figure 7.7 shows a similar pattern for trucks of low footprint (which are often crossovers built on car platforms); however, any pattern of changes in footprint and weight is harder to discern in the larger footprints of the truck fleet, where more diverse vehicle types are present. The time period 2010–2016 also saw a trend to more purchases of CUVs and SUVs (Figure 7.8), which tend to have less aerodynamic shapes and more mass for the same footprint.
The lack of absolute mass reduction translates to a lack of mass-related absolute fuel economy improvement. There would still be mass and fuel economy improvement from implementation of mass reduction technologies
SOURCE: Committee generated using data from Bailo et al. (2020).
and optimization, relative to a counterfactual where those technologies were not used, and the mass increases for ADAS and other advanced technologies were still occurring. The following sections will describe the current technology development status and expected future breakthroughs for materials and design processes in 2025–2035.
7.2.1 Material Opportunities for Mass Reduction
7.2.1.1 Steel
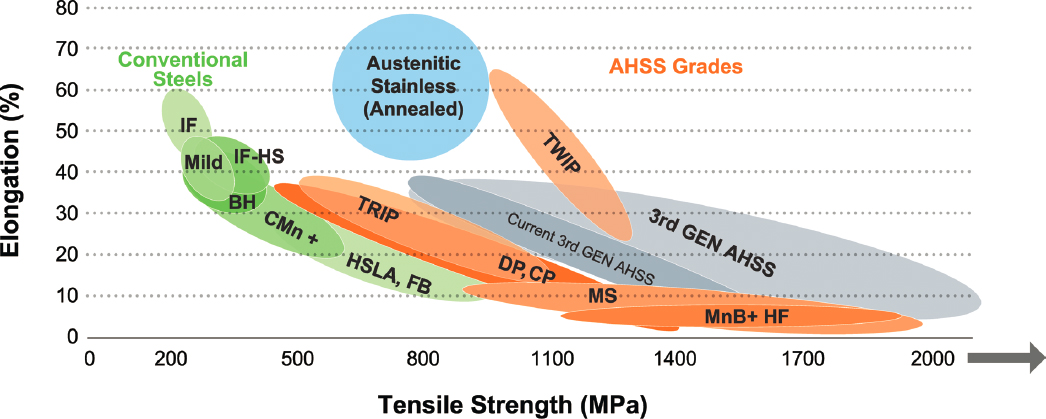
Steel is used in the automotive body and for a variety of vehicle components, typically structural elements, reinforcements, and high-formability parts. Different grades of steel span a wide range of ultimate tensile strengths,
SOURCE: Committee generated using data from Bailo et al. (2020).
SOURCE: Committee generated using model-by-model 2010 and 2016 MY data released as part of NHTSA and U.S. Environmental Protection Agency (EPA) rulemakings.
SOURCE: Committee generated using model-by-model 2010 and 2016 MY data released as part of NHTSA and EPA rulemakings.
SOURCE: Committee generated using data from EPA (2020).
from ∼200 to 2000 Mpa (Figure 7.9), and all grades have lower manufacturing costs than other advanced materials (Bailo et al., 2020). Use of advanced high-strength steel (AHSS) and ultra-high-strength steel (UHSS) provide 10% and 25% weight savings, respectively, compared to mild steel (Bailo et al., 2020). The auto industry’s history and familiarity with steel manufacturing is another incentive for continued widespread use of the material.
Looking ahead, the steel industry aims to improve both technologies and sustainability in their manufacturing processes. In particular, the industry will focus on improving material formability simultaneously with increased material strength. Most steelmakers are also working to decrease carbon emissions through infrastructure updates such as incorporation of electric arc furnaces. Considering the planned implementation of more UHSS and improved forming technologies, incorporation of 50%–55% of steel in vehicles can be expected in 2025–2035.
However, the penetration of steel in the future fleet will also depend heavily on the status of advancements in other materials and technologies. For example, significant decreases in the cost of aluminum and composite polymers may entice automakers to prioritize those materials, because they can provide 30%–60% more mass reduction than steel. Mass add-back from advanced technologies could also force automakers to move away from steel for lightweighting purposes (Bailo et al., 2020).
7.2.1.2 Aluminum and Aluminum Alloys
Aluminum (Al) provides 35%–40% reduction in mass compared to mild steel (Bailo et al., 2020), and aluminum technology is likely to support 1.5–2.0 miles per gallon fuel savings (Summe, 2019). Aluminum’s high
SOURCE: WorldAutoSteel (n.d.).
recyclability also makes it attractive to manufacturers, who are increasingly committed to meeting sustainability targets. There has been a 63% increase in aluminum use in vehicles from 2012 to 2020 (Ducker Worldwide and Aluminum Association, 2017), and this amount is expected to double by 2040 (Modi and Vadhavkar, 2019). The main opportunities for increased Al use are in doors and other bolt-on components, and Al is projected to comprise 20%–25% of body-in-white and closures by 2035 (Bailo et al., 2020). The Ford F-150 is the best example of the role Al can support in the lightweighting, incorporating 90% Al or Al alloys in an aluminum-intensive body with a combined steel/Al frame and corresponding weight reductions in the engine (often by enabling a smaller engine displacement) and chassis. These modifications result in a 700 lb curb weight reduction, which improves fuel economy by 19%. As depicted in Figure 7.3 above, EVs will require similar amounts of lightweighting to compensate for their increased propulsion system weight. Al is being implemented in those cases—for instance, in EV battery boxes and vehicle bodies.
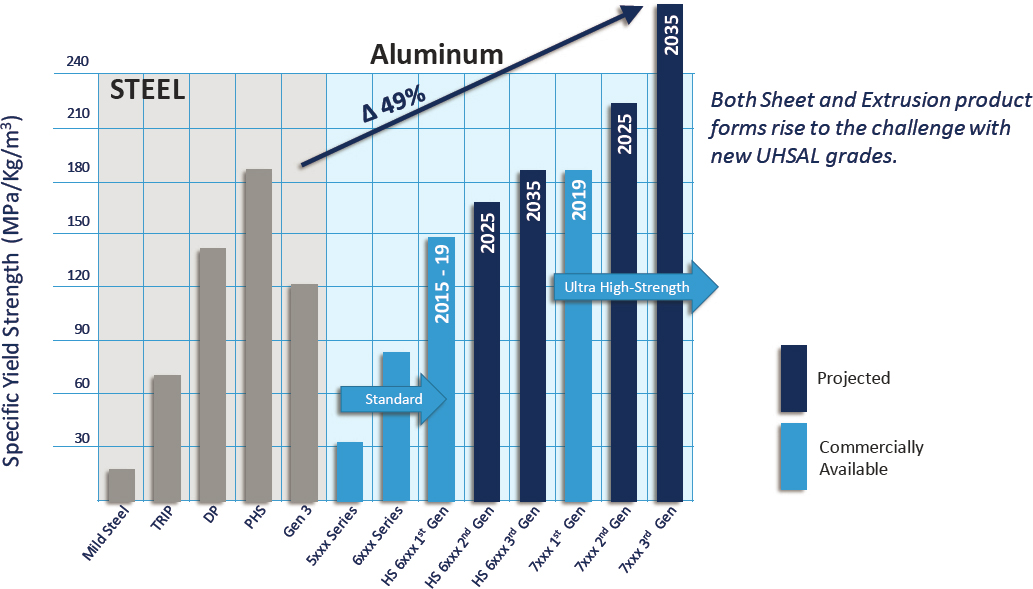
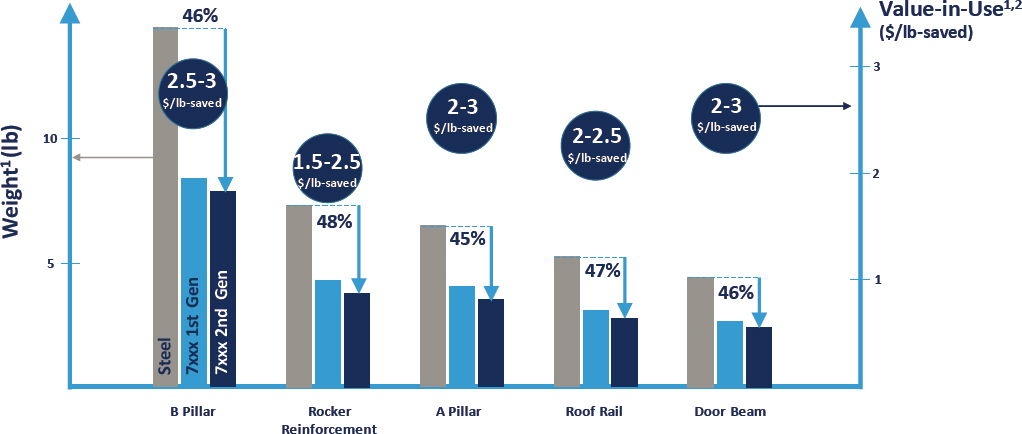
Advances in manufacturing during 2020–2035 could impact the likelihood of using Al for lightweighting. For instance, ongoing efforts in industry are developing 6xxx and 7xxx grades of aluminum (Bailo et al., 2020). By 2035, ultra-high-strength aluminum is projected to be commercially available (Figure 7.10), which will increase the applicability of Al throughout the vehicle and potentially produce about 45% weight reduction in certain components (Figure 7.11). Improvements to continuous casting processes could reduce the manufacturing costs of Al sheets, providing further incentive to incorporate Al materials. However, significant technological advances and investments in other areas, such as batteries and ADAS systems, could make automakers less willing to pay for lightweighting with aluminum (Bailo et al., 2020).
7.2.1.3 Polymer Composites and Carbon Fiber
Polymer composites and carbon fiber provide significant mass reduction opportunities, weighing about 50% less than steel and 30% less than aluminum. Composites are corrosion-free and can be designed to be long-lasting, and have no fatigue, high stiffness, high tensile strength, excellent thermal properties, and low thermal expansion. Furthermore, the use of polymer composites and carbon fiber allows for part consolidation and decreases tooling costs (Bailo et al., 2020).
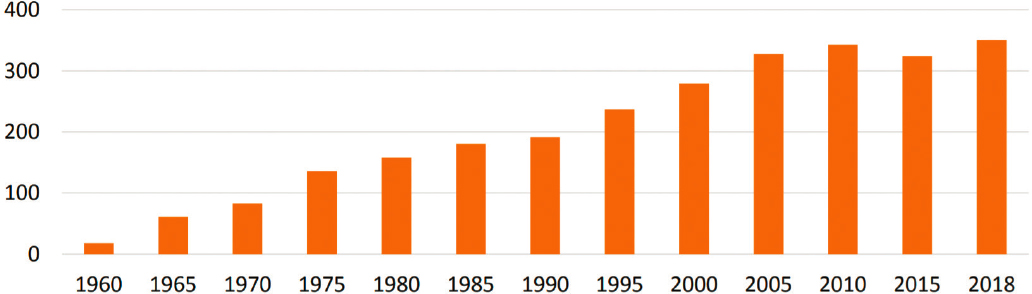
Polymer composites have been used in light-duty vehicles since the 1960s (Figure 7.12; ACC, 2019), and carbon fiber saw initial implementation in the 1990s. In the North American light-duty fleet, usage of polymer
SOURCE: Summe (2019).
SOURCE: Summe (2019).
SOURCE: ACC (2019).
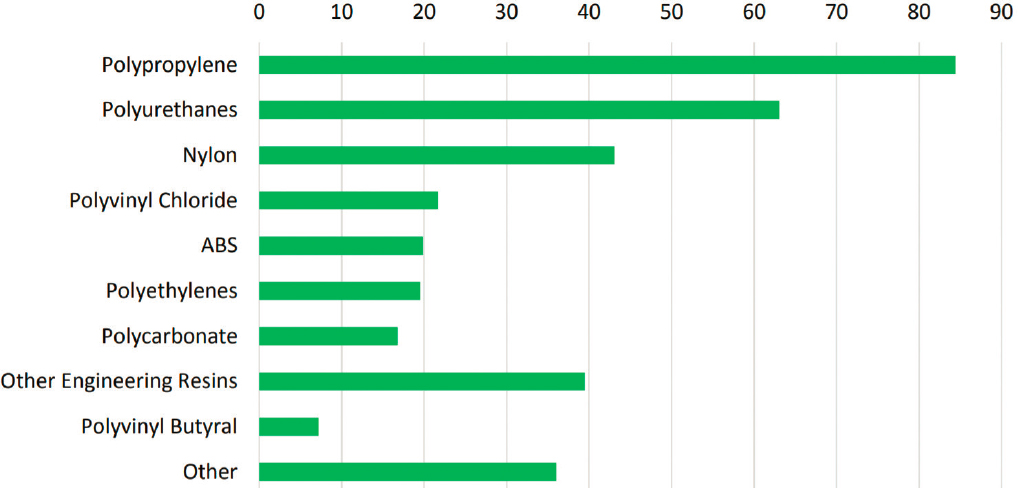
composites and plastics has remained fairly constant at 300–350 lb/vehicle, or 8%–10% of total vehicle weight, since 2008 (Table 7.6, above). Figure 7.13 depicts the variety of polymer and plastic materials used in vehicles in 2018 and their average usage by weight (ACC, 2019). Carbon fiber was first used primarily in sports cars and at low production volume; however, the introduction of BMW’s i3 in 2013 moved these composite materials into mass production, and opportunities for carbon fiber and other polymer composites continue to grow. Composite materials have the potential to be incorporated into many vehicle components, including liftgate, door inner, fender, roof panel, front bulkhead, floor reinforcement, A/B pillar reinforcement, truck bed, and seats, and could account for 8%–12% of vehicle composition in 2025–2035 (Bailo et al., 2020).
The production processes for polymer and carbon fiber composites have improved over the past 30 years. The first processes were batch with “Autoclave” production process at low volume with high cost. Resin transfer molding is used today for mass production, but it comes with a large amount of unused waste material. Further recyclability and reuse will be vital to the growth in incorporation of polymer materials in automotive applications.
SOURCE: ACC (2019).
TABLE 7.8 Material Cost of Automotive Grade Carbon Fiber
| Year | $/lb |
|---|---|
| 2005 | 18 |
| 2015 | 11 |
| 2030 | 5.5 |
Future production processes include “pultrusion” and “tape laying.” These methods combine high volume and no waste of material, which will reduce the component cost and allow the auto industry to introduce more lightweight material in the future.
Nonetheless, there remain several major barriers to incorporating polymer composite and carbon fiber materials. Although the material cost of automotive grade carbon fiber has decreased significantly in recent years (Table 7.8), both the raw material and manufacturing costs of composites, in $/lb of material, are expected to be significantly higher than those for metals in 2025–2035. The current precursor material to carbon fiber, polyacrylonitrile (PAN), is hydrocarbon-based, so the cost of carbon fiber materials depends largely on oil and gas prices. The price of oil is expected to stay in the $30 per barrel of oil range through 2030 (PrimeXBT, 2020). In the coming decade, PAN could be replaced step-by-step with an alternative material like lignin, a naturally occurring compound found in trees. This replacement should result in lower material costs, because lignin is a by-product of the papermaking process and therefore more widely available and less expensive than PAN. In addition to overcoming cost barriers, implementation of carbon fiber and polymer composites will require advancements in tooling, joining, and design (Bailo et al., 2020).
7.2.1.4 Magnesium
Magnesium is typically a die-cast part with relatively good strength and ductility and offers 60%–70% mass reduction compared to mild steel (Bailo et al., 2020). Magnesium is also plentiful and fully recyclable, which is attractive in terms of sustainability. However, current usage is low, at around 1% of the vehicle’s total material. To date, magnesium has primarily been utilized on higher end products, and components include engine parts, steering components, instrument panel, and seats. Future opportunities for magnesium include incorporation into vehicle front-end components and powertrain castings, but magnesium is not expected to exceed 4%–6% of the body-in-white and closures. This lack of opportunity relates in part to concerns about corrosion resistance, which limits its application to internal components with no exposure to weather elements. Other barriers are low formability, high cost, limited supply chain, and challenges with joining.
7.2.2 Manufacturing Issues and Opportunities Related to Mass Reduction
Manufacturers consider many factors in their decisions about materials for lightweighting. The choice of material depends not only on that material’s physical properties but also on its sustainability and availability, particularly given the increasing globalization of the automaker industry. For each material, manufacturers must develop new design models, forming and joining technologies, and tooling processes. These technologies and processes then need to be scaled up to achieve high production volumes. Current and projected manufacturing costs per lb mass reduction are reported in Table 7.9 for steel, aluminum, magnesium, and polymer composites. Incorporating new materials also requires increased capital expenditure and additional safety considerations to minimize the risk of part failure. The lightweighted cars must continue to meet consumer demand for performance and noise, vibration, and harshness. In addition to material considerations, a manufacturer’s willingness to invest in mass reduction depends on regulatory issues and technological developments in other areas. Interviews with a variety of automakers identified the primary drivers for lightweighting decisions as CAFE/GHG regulations, the amount of electrification in the fleet, battery cost and density, and mass add-back from advanced technologies (Bailo et al., 2020).
TABLE 7.9 Manufacturing Costs for Different Materials, 2020–2035
| Material | Manufacturing Cost ($/lb) | |||
|---|---|---|---|---|
| 2020 | 2025 | 2030 | 2035 | |
| Mild steel | 0.34 | 0.34 | 0.34 | 0.34 |
| HSS | 0.30 | 0.30 | 0.30 | 0.30 |
| AHSS | 0.39 | 0.37 | 0.36 | 0.35 |
| UHSS (HF) | 0.40 | 0.39 | 0.38 | 0.37 |
| Aluminum | 0.73 | 0.68 | 0.64 | 0.60 |
| Magnesium | 0.65 | 0.62 | 0.60 | 0.57 |
| Composites/carbon fiber | 14.76 | 13.10 | 11.63 | 10.32 |
SOURCE: Bailo et al. (2020), costs adjusted from 2019$ to 2018$ and from $/kg to $/lb (1 kg = 2.2 lb).
7.2.3 Overview of Materials for Mass Reduction
The projected changes in implementation of materials across all U.S. light-duty vehicles in 2020–2040 are shown in Figure 7.2 above. The costs per lb of mass reduction for unibody cars/SUVs and pickup trucks with various possible material substitution types are depicted in Figures 7.14 and 7.15, respectively.2 These plots of cost per percent mass reduction consider lightweighting from materials substitution only, not from modification or removal of vehicle components as would be done in a full design optimization. The effectiveness of material substitution depends on the deployment of different materials and the resulting mass reduction (taking into account secondary mass reduction opportunities).
Mapped onto Figures 7.15 and 7.16, and summarized in Table 7.10, are estimates for material penetration (and the corresponding mass reduction and cost) based on scenarios3 that describe potential future fleets. The future fleets differ in electrification volume, battery pack cost, and battery energy cell density, three variables identified by automakers as key driving factors in their willingness to pay for lightweighting (Bailo et al., 2020). Definitions of the variables and scenarios are given in Table 7.11. For both vehicle classes, scenario one is predicted to represent the mass market in 2025–2030, and scenario three is predicted to represent the mass market in 2030–2035. However, it should be noted that the scenarios do not report on what automakers could do to achieve the most lightweighting but rather what they might do in the context of other available technology options and regulatory standards.
7.2.4 Design Optimization
The automotive industry has emphasized that design optimization is key to selecting the “right” material for the “right” application. The following elements must be considered: (1) fuel economy importance in the vehicle class, (2) price sensitivity for vehicle class, (3) volume and profit margin of the vehicle class, (4) safety and regulatory considerations, (5) customer expectation, (6) manufacturing methodology and cost, and (7) sustainability cost (scrap/recycle/reuse). All of these factors are taken into consideration when designing the initial vehicle. Weight reduction after initial design is very difficult, given the need to meet other durability and safety requirements, and is not usually a cost improvement.
___________________
2 The data for these plots of cost per percent of mass reduction were provided by interviews with automakers and independent organizations such as the American Iron and Steel Institute and the American Composites Corporation, and the numbers were validated with other documents. Both these data and engineering judgment by the Center for Automotive Research were used in developing the figures. The plots are meant to provide guidelines, not guarantees or standards. Several factors could influence prices and allow different materials to be utilized.
3 These scenarios provide estimates for when certain material trends might be observed in the fleet, either in premium or mass-market vehicles; however, the mass reduction levels and corresponding costs are not limited to the year(s) indicated by the scenarios.
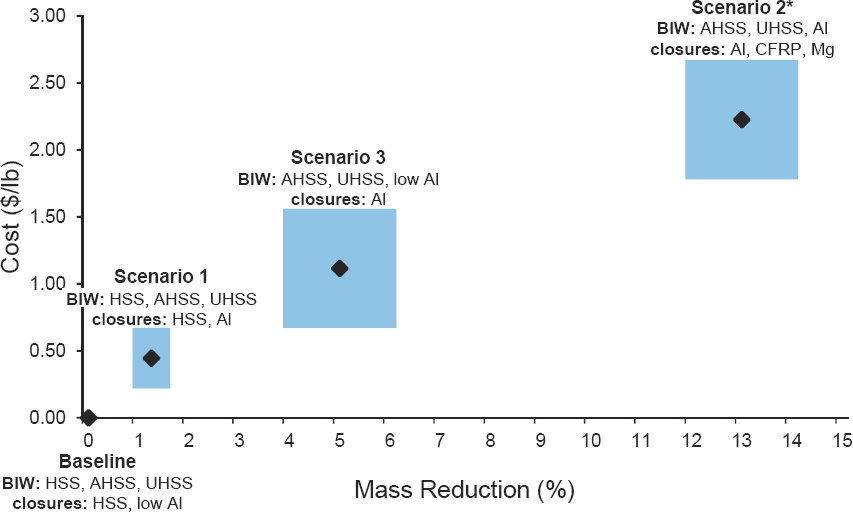
NOTE: Black diamonds indicate a representative vehicle in each scenario, and blue boxes denote uncertainty in percent mass reduction and cost within that scenario. * indicates inclusion of secondary mass reduction, calculated as described in NRC (2015).
SOURCE: Committee generated, adapted from Bailo et al. (2020).
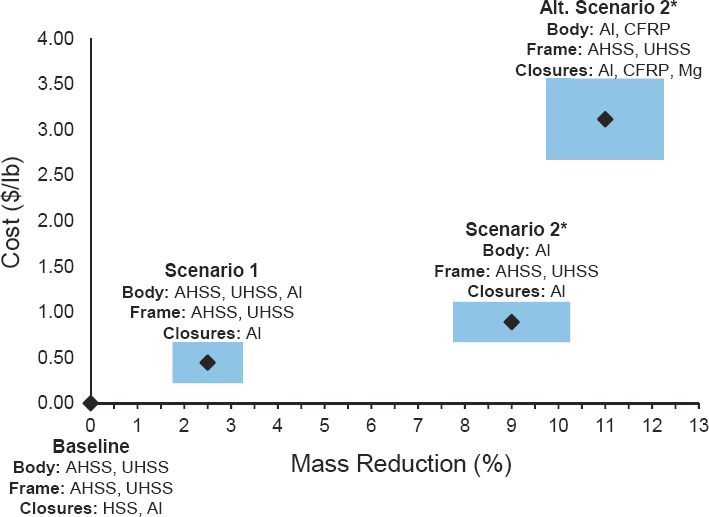
SOURCE: Yen (2020).
TABLE 7.10 Projected Costs, Mass Reduction, and Material Trends for Potential Scenarios in 2025–2035
| Vehicle Class | Scenario | Costa | Mass Reductionb | Expected Material Trend |
|---|---|---|---|---|
| Cars and Unibody SUVs | Baseline | N/A | N/A | Body: HSS, AHSS, UHSS |
| Closures: HSS, low Al | ||||
| One | $0.22–$0.67 | 1.0%–1.5% | Body: HSS, AHSS, UHSS | |
| Closures: HSS, Al | ||||
| Two | $1.78–$2.67 | 12%–14%c | Body: Al, AHSS, UHSS | |
| Closures: Al, comp, Mg | ||||
| Three | $0.67–$1.56 | 4%–6% | Body: AHSS, UHSS, low Al | |
| Closures: Al | ||||
| Pickup Trucks | Baseline | N/A | N/A | Body: AHSS, UHSS |
| Frame: AHSS, UHSS | ||||
| Closures: HSS, Al | ||||
| One | $0.22–$0.67 | 2%–3% | Body: AHSS, UHSS, Al | |
| Frame: AHSS, UHSS | ||||
| Closures: Al | ||||
| Two | $0.6 –$1.11 | 8%–10%c | Body: Al | |
| Frame: AHSS, UHSS | ||||
| Closures: Al | ||||
| Two (alternative) | $2.67–$3.56 | 10%–12%c | Body: Al, comp | |
| Frame: AHSS, UHSS | ||||
| Closures: Al, comp, Mg | ||||
| Three | $0.05–$0.45 | 2%–3% | Body: AHSS, UHSS, Al | |
| Frame: AHSS, UHSS | ||||
| Closures: Al |
a Costs reported per lb mass reduction, converted from reported per kg values (1 kg = 2.2 lb) and from 2019$ to 2018$.
b Mass reduction reported as percent reduction in curb weight from MY 2020 baseline.
c Includes secondary mass reduction, calculated as described in NRC (2015).
SOURCE: Bailo et al. (2020).
TABLE 7.11 Definitions of Variables and Scenarios Used to Estimate Material Penetration
| Variable | High | Low | ||
|---|---|---|---|---|
| Electrification volume (CAFE/GHG proxy) | >25% BEV, 30%–50% hybrids | <15% BEV, 20%–25% hybrids | ||
| Battery pack cost | $145–$170/kWh | <$100/kWh | ||
| Battery cell energy density | 900 Wh/liter | 700 Wh/liter | ||
| Scenario | Electrification Volume | Battery Pack Cost | Battery Density | |
| Baseline | Low | High | Low | |
| One | Low | High | Low | |
| Two | High | High | Low | |
| Three | High | Low | Low | |
SOURCE: Bailo et al. (2020).
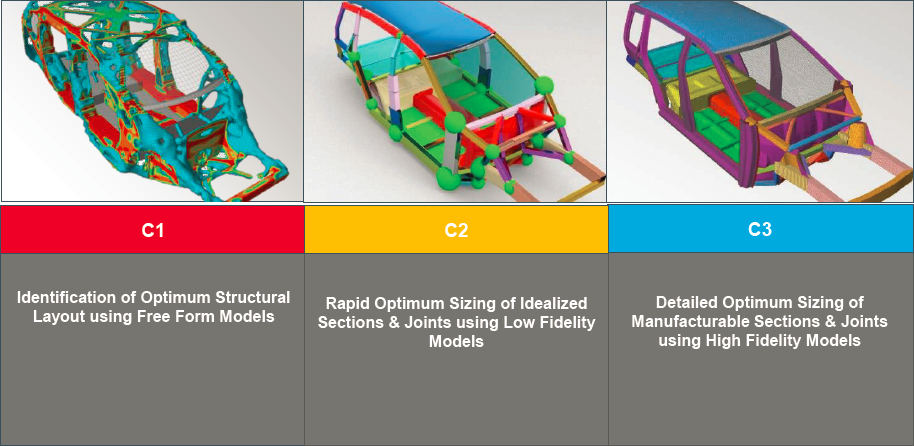
Vehicle design has become more sophisticated, with computer modeling and simulation being used throughout the design process and with both design and validation moving to virtual vehicles. Use of modeling and simulation in vehicle design allows performance targets to be met for the whole vehicle design while optimizing cost and weight reductions. Figure 7.16 shows the design of vehicle components based on a structural layout identified using modeling. Figure 7.17 shows details of the process for vehicle and component designs that meet specifications while minimizing cost, weight, or other parameters.
The automotive industry must continue to improve fuel economy and/or EV range for a customer who expects these improvements but is unwilling to pay for them. To address this challenge, automakers will look for weight reduction materials/methods with a corresponding cost reduction or at least level cost. For example, using carbon fiber in lieu of metals may reduce both weight and cost owing to its ability to greatly reduce the complexity of the component, and hence the assembly costs.
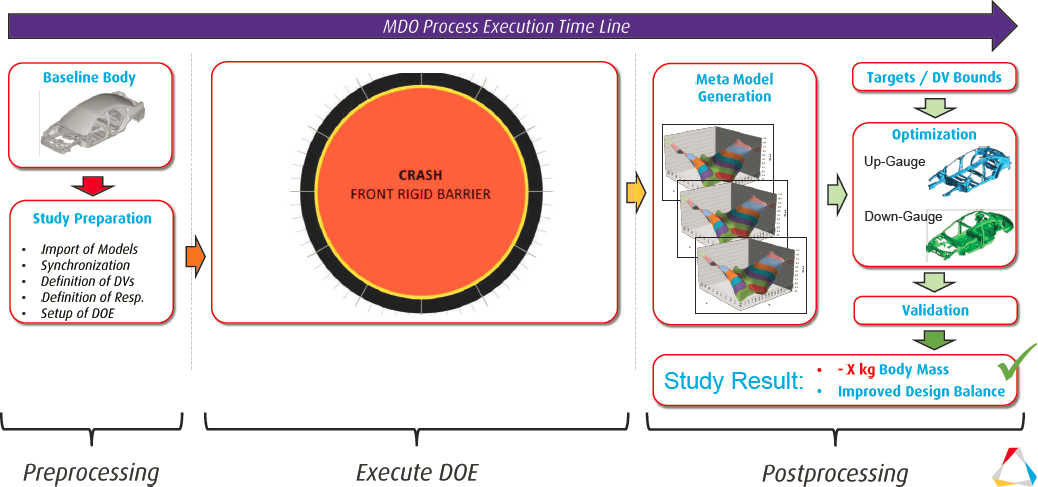
NOTE: DOE = design of experiment; DV = design variable; MDO = multi-disciplinary optimization.
SOURCE: Yen (2020).
7.2.5 Summary of Mass Reduction Opportunities in 2025–2035
In 2025–2035, as the fleet trends toward greater electrification and a higher penetration of advanced technologies, mass reduction through lightweighting and design optimization will be critical for meeting fuel economy and performance targets. Material use is expected to shift away from mild and high-strength steel and toward primarily advanced and UHSS and aluminum. Magnesium, polymer composites, and carbon fiber are projected to contribute 12%–18% of vehicle weight. An automaker’s material choice and willingness to pay for lightweighting depend on a variety of factors, including material availability, manufacturing cost, technological developments in other areas, and regulatory requirements. Design optimization, particularly in the initial vehicle design, is also critical for maximizing the benefits of using advanced materials for mass reduction. These potential changes in mass from electrification, ADAS, and advanced materials are further discussed in the context of vehicle safety in Section 7.5.
7.2.6 Findings and Recommendation for Mass Reduction
FINDING 7.4: Lightweighting represents the greatest opportunity for fuel economy improvement in road load and accessory reduction. There have been many breakthroughs in high-strength steel, aluminum alloys, and composites, as well as manufacturing methodologies, to allow further implementation.
FINDING 7.5: Conventional internal combustion engine and hybrid models gain the most improvement from primary and secondary mass reduction. BEV platforms, also known as skateboards, have the opportunity to be utilized across many body styles that can communize lightweighting strategies and optimize aerodynamic parameters.
FINDING 7.6: The key to achieving the benefits of substitution with lighter weight materials is early consideration in the design process, relevant for high-strength steel, aluminum, magnesium, and composites. Design optimization in the planning stage of a new model far outweighs subsequent model year opportunities, because changes post-design finalization are often costly and not nearly as substantial.
FINDING 7.7: Lightweighting can offset increased mass resulting from the addition of electrification and advanced driving technologies (mass increase for battery electric vehicles can be approximately 500 lb). Electric vehicles are incentivized to reduce mass because doing so also improves their range, a key parameter for consumers. In order to offset increased mass, electrified, high profit/volume vehicle models will likely integrate alternative materials first. After technology improvement allows the cost to be reduced, the new materials will be installed on lower volume/profit models. To date, it has proven difficult to fully offset the weight of the battery, but implementation on higher performance, higher-margin products will allow for more discretionary budget allocated for lightweighting. Furthermore, significant research efforts are ongoing to reduce the mass of the battery pack itself. (See Chapter 5.)
RECOMMENDATION 7.2: The U.S. Department of Energy should support the development of alternative materials and manufacturing methodologies to allow mass reduction in electrified and safety system applications.
7.3 TIRES
Rolling resistance accounts for 4%–7% of the energy use of a typical gasoline ICE vehicle and greater shares for hybrids and BEVs (DOE/EPA, 2019b, c, d). Rolling resistance in automotive tires is primarily caused by the energy dissipated when tires are deformed by contact with the road. The force, F, required to overcome rolling resistance is equal to the downward force perpendicular to the road surface owing to the weight of the vehicle, N, multiplied by the coefficient of rolling resistance, Crr (NRC, 2015):
F = CrrN
For a given Crr, rolling resistance is a function of vehicle weight and changes little with vehicle speed (EPA/DOT/CARB, 2016). A tire’s Crr is determined by the materials of which it is made, as well as its structural design, aspect ratio, tread pattern, and depth (NRC, 2015).
7.3.1 Trade-Offs
When designing tires, manufacturers must consider many factors beyond rolling resistance that are important to safe handling and braking or to consumer satisfaction. In addition to braking and traction on wet and dry pavement, tires affect steering and must stand up to potholes and other deviations from ideal road conditions. In addition to safety, consumer concerns include durability, handling, ride comfort, noise, and cost (EPA/DOT/CARB, 2016). Although there can be trade-offs among these attributes, tire manufacturers point out that trade-offs can be overcome at a cost either in terms of higher prices for new tires or reduced durability, requiring more frequent replacement (NRC, 2015). The SAFE Rule for 2021–2026 asserts that there are currently no data connecting low rolling resistance tires to accident or fatality rates and that tire makers are able to balance stopping distance and rolling resistance (NHTSA/EPA, 2020).
7.3.2 Impact on Fuel Economy
A widely used rule of thumb is that a 10% reduction in rolling resistance (Crr) can improve the fuel economy of an ICE vehicle by 1%–2% (TRB, 2006; EPA/DOT/CARB, 2016), and if the powertrain can be downsized to maintain equal performance, the benefit could be as large as 3% (NRC, 2015). The fuel economy benefit of reducing rolling resistance depends to a great extent on the fraction of energy input to the vehicle that is used to provide power to its wheels to overcome inertia, aerodynamic drag, and rolling resistance. The energy requirements and losses vary with vehicle class, as illustrated in Figures 7.18–7.20 for conventional gasoline, hybrid, and electric-only vehicles, respectively. For a typical gasoline vehicle, only 16%–25% of the energy in gasoline goes to powering the wheels, with approximately 25% of that energy (or 4%–7% of the total energy input) going to overcoming rolling resistance (DOE/EPA, 2019b; Pannone, 2015). The energy losses of a hybrid vehicle are smaller: 24%–38% of the energy in gasoline powers the wheels and so a larger fraction, 6%–11%, of the total energy input goes to overcoming rolling resistance (DOE/EPA, 2019c). Electric-only vehicle powertrains are much more efficient. Because some of the energy losses can be recovered by regenerative breaking, 77%–82% of the energy to the vehicle ends up powering the wheels.4 As a result, a much higher fraction, 22%–23%, of the energy input into an EV is used to overcome rolling resistance (DOE/EPA, 2019d), making the energy efficiency of EVs 3 to 5 times more sensitive to the Crr of their tires. Therefore, the importance of reducing rolling resistance in hybrid vehicles is about 50% greater than for an ICE vehicle, and the importance in BEVs is about 3 to 4 times as great.
7.3.3 Coefficients of Rolling Resistance
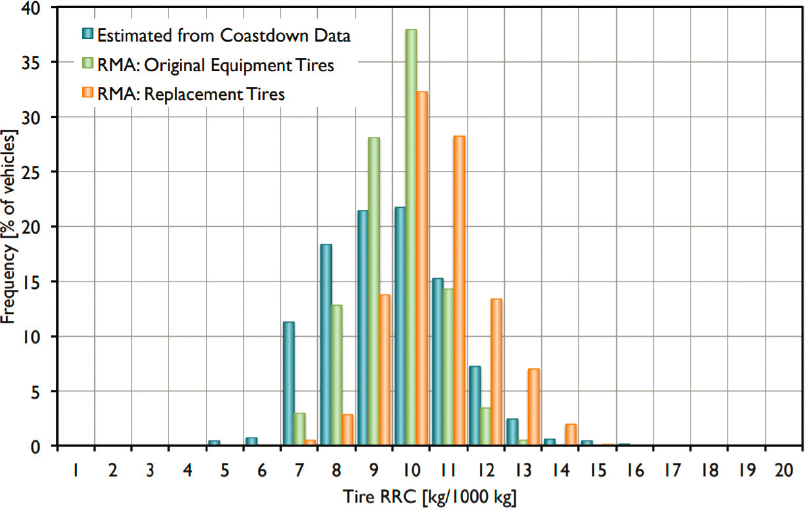
The SAFE Rule (NHTSA/EPA, 2020) used 0.009 as the baseline value for average rolling resistance5 but assigned individual rolling resistance coefficients to specific vehicles based on confidential business information provided by manufacturers. With this baseline Crr value, a 10% reduction (ROLL10) corresponds to a Crr of 0.0081, and a 20% reduction (ROLL20) corresponds to a Crr of 0.0072. The choice of 0.009 was based on information from several sources, including the Rubber Manufacturers Association and Pannone (2015) (Figure 7.21). The Crr estimates developed by Pannone reflect MY 2014 vehicles. As shown in Table 7.12, the Crr values vary by the design intent of vehicles but also show wide variability across makes and models within a design category.
___________________
4 The estimated electricity losses during charging assume a 40% state of charge, 42A EV service equipment, breakers and transformer and 50A AC current (Apostolaki-Iosifidou et al., 2017, Tables 2–4).
5 Rolling resistance can be expressed by the rolling resistance coefficient (RRC or Crr), which is the value of the rolling resistance force divided by the wheel load.
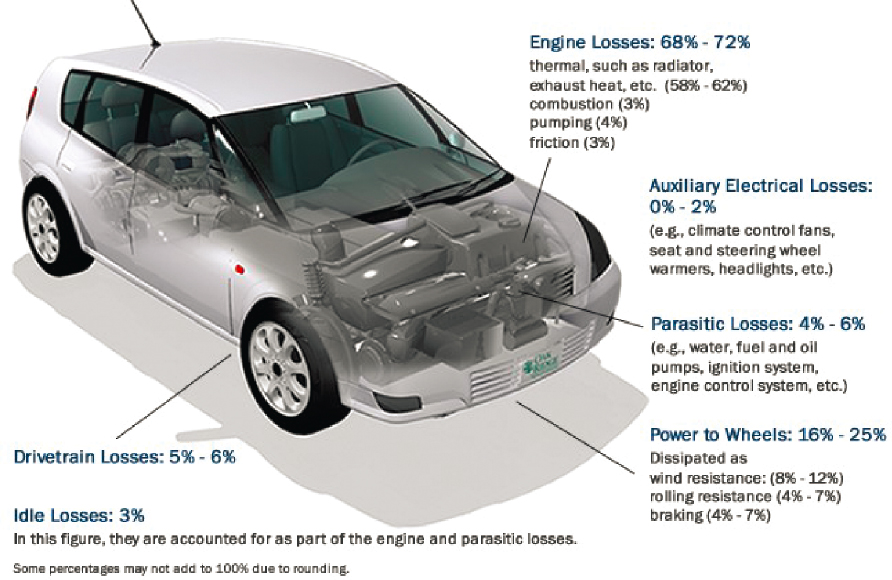
SOURCE: DOE/EPA (2019b).
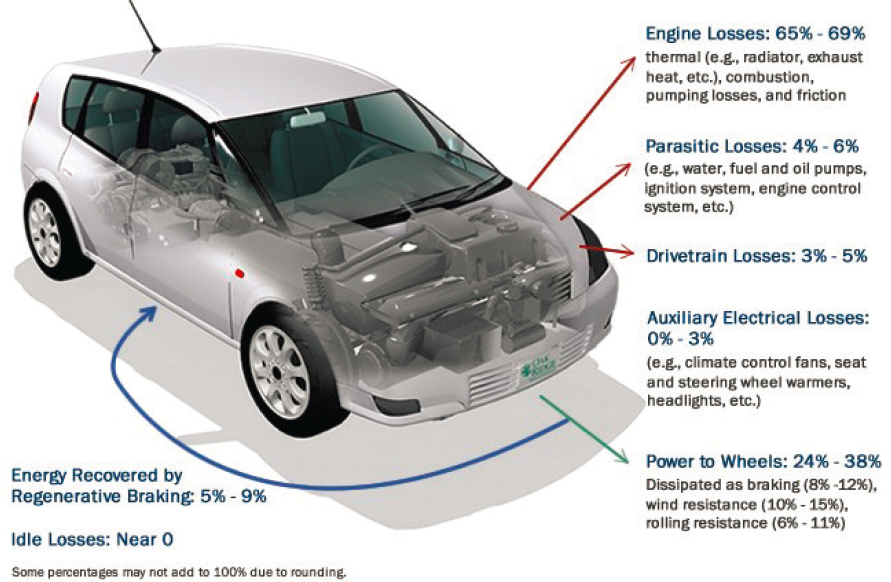
SOURCE: DOE/EPA (2019c).
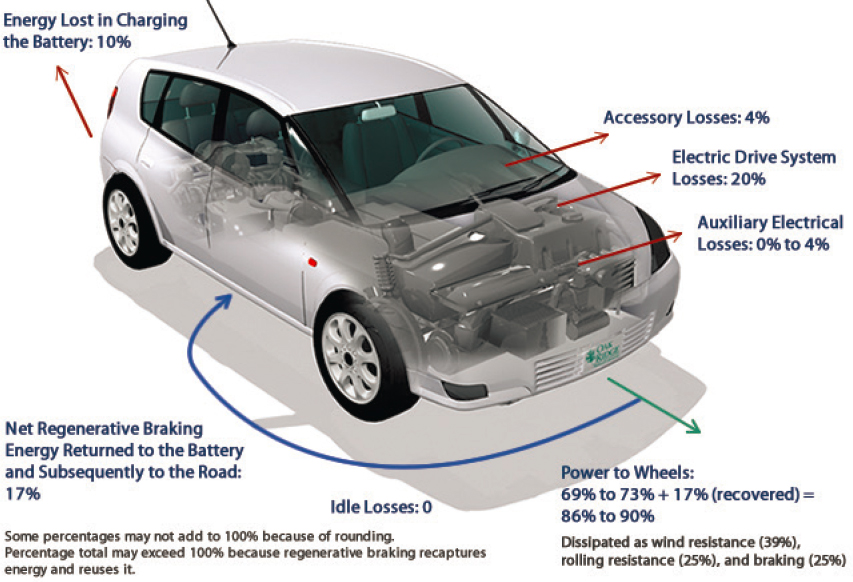
SOURCE: DOE/EPA (2019d).
SOURCE: Pannone (2015).
TABLE 7.12 Estimated Distributions of Tire Rolling Resistance Coefficients (in kg/1,000 kg) by Design Category
| Vehicle/Tire Category | Sample Size | Average RRC | Minimum RRC | 90th Percentile RRC | 75th Percentile RRC | Maximum RRC |
|---|---|---|---|---|---|---|
| All vehicles | 1,358 | 9.0 | 4.4 | 6.9 | 7.8 | 15.1 |
| Fuel economy oriented | 74 | 8.1 | 4.4 | 6.2 | 7.4 | 10.8 |
| Balanced | 1,083 | 8.9 | 4.8 | 6.9 | 7.7 | 15.1 |
| Off-road oriented | 17 | 9.4 | 7.1 | 7.7 | 8.3 | 12.0 |
| Performance oriented | 184 | 10.1 | 6.1 | 7.8 | 8.9 | 14.5 |
SOURCE: Pannone (2015).
The base year Crr value chosen by the agencies (0.009) corresponds exactly to the average for all vehicles in Table 7.12. Pannone (2015) suggests that the most extreme values in Table 7.12 likely reflect estimation errors rather than actually achieved Crr values.
Although low rolling resistance tires are installed on new vehicles by automakers, the choice of replacement tires is at the discretion of the vehicle owner. According to Pannone (2015) and information provided by the Rubber Manufacturers Association, replacement tires have higher levels of rolling resistance than original equipment tires (see Figure 7.21, above). To encourage vehicle owners to choose low rolling resistance tires, the Tire Efficiency, Safety, and Registration Act of 2015 required the U.S. Department of Transportation to develop minimum fuel-efficiency standards for tires and to create a consumer information program for tire fuel efficiency, traction, and durability (PL 114-94, Part III, 2015). However, current tire labeling by the U.S. government does not yet include information on rolling resistance.
7.3.4 Near-Term Technologies
The rolling resistance of automobile tires can be improved in a variety of ways, including increasing the inflation pressure, changing materials, optimizing tire construction for low hysteresis, changing tire geometry (e.g., lower aspect ratio), and reducing sidewall and tread deformation. NRC (2015) reported that some tire manufacturers had lowered their tires’ Crr by 2% per year for at least 30 years, which would make the Crr of 2015 tires about 45% lower than that of tires available in 1985. The 2015 NRC report also reported that Crr values measured in 2005 ranged from 0.00615 to 0.01328 with a mean of 0.0102 (NRC, 2015). Research supporting the rulemaking for MYs 2017–2025 considered two levels of reductions in rolling resistance, assuming a combination of design and material changes: (1) a 10% reduction in Crr (ROLL10), giving a 1.9% reduction in fuel consumption over the base 2017 tire; and (2) a 20% Crr reduction (ROLL20), giving a 3.9% reduction in fuel consumption over the base tire (EPA, 2016). The 10% reduction was considered achievable through a combination of increased tire diameter and sidewall stiffness and reduced aspect ratio (also reducing rotational inertia). ROLL20 was assumed to require more advanced materials and complete tire redesign. Silica tread technology in combination with a new silica, polymer, and coupling agent were considered key technologies for ROLL20.
According to EPA/NHTSA (2012), ROLL10 first entered the market in 1993 and had achieved a degree of widespread adoption by 2008. At the time that the 2017–2025 rule was finalized (EPA/NHTSA, 2012), ROLL20 tires were not available in the marketplace. ROLL20 was assumed to be available in MY 2017 and to begin replacing ROLL10 afterward. ROLL20 tires were assumed to become widely available in the marketplace in 2022–2023 and to penetrate the new vehicle market quickly, reaching a share of 73% by 2021 and 97% by 2025. The DMC of ROLL10 tires was estimated to be $6 per vehicle ($1.20 per tire for five tires). ROLL20 was estimated to add $66 per vehicle, assuming that only four tires would be provided by automakers per vehicle (both estimates are 2013$) (NHTSA/EPA/CARB, 2016). In the SAFE Rule (NHTSA/EPA, 2020), the agencies redefined the base year tire (ROLL0) and changed the base year market penetrations of ROLL10 and ROLL20
TABLE 7.13 Estimated Market Penetrations of ROLL10 and ROLL20 Tire Rolling Resistance Technologies
| ROLL | Draft TAR (MY 2015 Baseline) | NPRM (MY 2016 Baseline) | Final SAFE Rule (MY 2017 Baseline) |
|---|---|---|---|
| ROLL0 | 99.80% | 64% | 59% |
| ROLL10 | 0.1% | 10% | 21% |
| ROLL20 | 0.1% | 26% | 20% |
NOTE: NPRM = Notice of Proposed Rulemaking; SAFE = Safer Affordable Fuel-Efficient [Vehicles]; TAR = Technical Assessment Report.
SOURCE: Table VI-167 of NHTSA/EPA (2020).
tires, substantially increasing the MY 2016 and MY 2017 year estimates versus the previous MY 2015 estimates (Table 7.13).
The SAFE Rule (NHTSA/EPA, 2020) adopted the DMC estimates shown in Table 7.14. Both ROLL10 and ROLL20 tires were assumed to require replacement after 40,000 miles.
7.3.5 Advanced Tire Technologies
The 2012 rule (EPA/NHTSA, 2012) also considered the possibility of a 30% reduction in rolling resistance by 2025. Although it reports that tire suppliers believed that there were innovations that could enable such a reduction, the rule concluded that there was “little evidence supporting improvements beyond LRRT2 by 2025.”6 The U.S. Department of Energy has sponsored tire research with the objective of improving vehicle fuel economy by 3% and reducing tire weight by 20% through a combination of six technological advances (Donley, 2014):
- Partial replacement of carbon black and silica with nano-fiber materials;
- Ultra-lightweight tire bead bundle;
- Ultra-lightweight tire belt package;
- Ultra-lightweight inner liner (barrier film liner);
- Formulation options for ultra-long-wearing and low-hysteresis tread compound; and
- New design of low-hysteresis, energy-efficient tire profile.
The research project concluded that combinations of these technologies had the potential to reduce rolling resistance by 27% to 31% with relatively low commercial and performance risk (Donley, 2014). NHTSA/EPA (2020) judged that a 30% reduction in rolling resistance would require changes to tire profiles, strengthening of tire walls, changes in tread design, integration of tire designs with active chassis control, and development of new materials to replace silica. Active chassis control systems are required to offset the slippage and handling concerns that result from the lower tractive forces of ROLL30. According to NHTSA, no ROLL30 tires are currently commercially available, nor are they expected to become available by 2025 (NHTSA/EPA, 2020). On the other hand, HD Systems asserted that ROLL30 tires could be available by 2025 (NHTSA/EPA, 2020).
Tires with two or more separate air chambers inflated to different pressures have the potential to reduce material hysteresis damping, which accounts for 80%–95% of a tire’s rolling resistance during steady-state driving on a level road (Aldhufairi and Olatunbosun, 2017). The effects of alternative multichamber designs were investigated by Aldhufairi et al. (2019) by means of finite element analysis. The most fuel efficient multichamber design reduced rolling resistance by 40% in the simulations with minor trade-offs in grip and ride comfort. Although multichamber designs appear to be able to substantially reduce tire rolling resistance, they are in an experimental stage of development and face challenges with respect to manufacturability, cost, and maintenance.
___________________
6 The 2012 rule referred to a 20% reduction relative to the base year tire as LRRT2.
TABLE 7.14 Estimated Costs (2018$) of Near-Term Tire Technologies in the SAFE Rule
| Technology | DMC | Total Cost (includes Retail Price Equivalent Correction and Learning) |
|---|---|---|
| ROLL0 | $0.00 | $0.00 |
| ROLL10 | $5.186 | $7.78 |
| ROLL20 | $40.54 | $60.81 |
NOTE: Costs for each technology are incremental to a baseline vehicle (Base V). Costs for MY 2017, incremental to Base V.
SOURCE: Table VI-168 of NHTSA/EPA (2020).
Tire manufacturers have introduced several advanced tire concepts, ranging from “airless” non-pneumatic tires to magnetically levitated, connected, intelligent tires. While these concepts offer potential improvements such as no blow-outs or flats, greater recyclability, improved handling, and even the ability to be regenerated via 3D printing, they do not claim reduced rolling resistance versus advanced pneumatic tires.
7.3.6 Findings for Tires
FINDING 7.8: Low rolling resistance tires with 0.009 coefficient of rolling resistance (ROLL0) have been implemented to the fullest possible extent in MY 2017. Reductions of a further 10% and 20% are also partially implemented, although potential remains for ROLL10, ROLL20, and even ROLL30 implementation in 2025–2035.
FINDING 7.9: Noninflatable tires are being developed, specifically for urban, shared vehicles, but the impact to fuel economy is not likely to improve upon adoption of pneumatic tires.
7.4 ACCESSORIES AND OTHER OFF-CYCLE TECHNOLOGIES
Additional improvements to accessories and related technologies are off-cycle technologies, meaning that their fuel economy benefits are not captured on the Federal Test Procedure (FTP) or that they impact emissions of non-carbon dioxide (CO2) GHGs. These technologies mainly reduce the accessory load on the engine or affect the thermal management of the cabin, and they can earn credits that are applied to fuel economy or GHG compliance. Such crediting schemes are primarily discussed in Chapter 12.
7.4.1 Accessories Electrification
Electrifying accessories such as motors and fans improves fuel consumption primarily by reducing the mechanical load on the engine. The most advantageous opportunities for converting from mechanical to electrical devices are with devices that operate only intermittently, such as power steering and the A/C compressor (NRC, 2015). Similar opportunities exist in other areas—for instance, by improving alternators, converting hydraulic water pumps to electricity, and improving the efficiencies of electric cooling fans. While these technologies may not be reflected in the FTP, some benefits from accessory electrification are reflected in the tests used to develop fuel economy labels.
Electric power steering (EPS) provides reductions in fuel consumption by eliminating the need for belt-driven power steering pumps that draw load from the engine even when the wheels are not being turned. EPS is also needed for hybrid and plug-in electric vehicles. The current penetration is around 80% (NHTSA/EPA, 2020; Els, 2017), and EPS will likely be implemented in most of the fleet before the years that are the focus of this study.
The most recent National Research Council fuel economy technology report (NRC, 2015) and recent regulatory documents (NHTSA/EPA, 2020) have lumped several other accessories together, including improved alternators, electrified hydraulic water pumps, and improved electric cooling fans. These documents report two different levels
of efficiencies for these accessories. Level one (IACC1) includes a high-efficiency alternator, an electric water pump, and electric cooling fans, whereas level two (IACC2) includes a higher efficiency alternator and improved cooling fans (NRC, 2015). Cost and effectiveness estimates have not changed since the earlier documents. The penetrations of these technologies and their contribution to meeting current fuel economy regulations is being debated in the context of the current fuel economy regulatory activities (NHTSA/EPA, 2018; ICCT, 2018). However, the consensus is that most of these accessory improvements will be implemented in the majority of the fleet before 2025. In fact, the baseline fleet of the 2020 SAFE Rule assumes full incorporation of IACC1 technologies; thus, the reported cost and effectiveness values for IACC in the SAFE Rule are equivalent to IACC2 in previous rules, which represents “high-level” improvements to electric water pumps and alternators (NHTSA/EPA, 2020).
7.4.2 Air Conditioning
Outside of mass reductions, improvements in A/C provide the next largest source of non-powertrain improvements in fuel economy efficiency and GHG emissions. Energy impacts of A/C technologies are particularly important given the high (>95%) penetration of A/C systems in U.S. cars and light trucks (NHTSA/EPA, 2020). A/C improvements stem from reducing engine loads, which improves fuel efficiency, and reducing leakage of coolants and using coolants with lower global warming potentials (GWPs), which reduces non-CO2 GHG impacts. As noted in the previous National Research Council report, A/C contributes significantly to the on-road efficiency gap between CAFE certification values and real-world fuel consumption because the air conditioner is turned off during the FTP but used by drivers during vehicle operations (NRC, 2015). The technologies used to reduce A/C engine loads focus on the compressor, which circulates the refrigerant within the system; electric motor controls; and system controls. Although reductions in A/C leakage and alternative low-GWP refrigerants do not affect fuel economy, reducing coolant leaks through improved hoses, connectors, and seals and replacing current coolants with lower GWP refrigerants do reduce overall GHG impacts from light-duty vehicle operations.
7.4.3 Tire Off-Cycle Technologies
Tire rolling resistance is sensitive to inflation pressure. A rule of thumb is that each 1 psi reduction in inflation pressure of all tires reduces fuel economy by 0.2% (DOE/EPA, 2019a). According to NHTSA, only 19% of motorists correctly inflate their tires (NHTSA, 2019). A greater concern with underinflated tires, however, is the impact on vehicle safety of loss of handling and traction. NHTSA reports that underinflated tires and other tire maintenance issues contributed to 738 tire-related fatalities in 2017 (NHTSA, 2019). Since 2008, all new passenger cars and light trucks have come equipped with tire pressure monitoring systems that warn motorists when tires are dangerously underinflated (NHTSA, 2019). Self-inflating tire systems have been developed to keep tires inflated to the proper pressure automatically. Such systems are used in some heavy-duty vehicles but are not yet optional or standard equipment for light-duty vehicles (NASEM, 2019).
7.4.4 Other Off-Cycle Technologies
A host of other off-cycle technologies are discussed in prior National Academies and regulatory reports. These include low-drag-resistant brakes, which reduce friction of brake pads on rotors when brakes are not engaged, and secondary axle disconnect, which disconnects an axle from all-wheel drive vehicles in some driving conditions when the torque of a second axle is not needed. Both technologies provide about 1% reduction in fuel consumption at less than about $100. Additional off-cycle technologies, including high-efficiency exterior lighting, solar roof panels, passive and active cabin ventilation, and solar reflective paint, can further influence the thermal control of the cabin or have other potential off-cycle impacts on fuel economy. A more extensive list of these technologies can be found in Tables VI-173 and VI-174 of NHTSA/EPA (2020), and their definitions are provided in 40 CFR 86.1869-12(b)(4). The associated credits will be discussed in Chapter 12.
7.4.5 Issues for Off-Cycle Technologies
As discussed further in Chapter 12, the objective for developing and crediting potential reduction for technologies that do not provide fuel efficiency benefits on the FTP is to recognize that there may be cost-effective approaches to reducing the fuel consumption and GHG impacts of vehicles that are not represented on the FTP. However, Lutsey and Isenstadt (2018) point out that a high off-cycle credit use scenario, where credits are provided at levels over and above the ones on the predetermined list and there is no 10 g/mi limit, off-cycle technologies could provide a significant fraction of compliance with the current standards. This situation could be problematic owing to the high uncertainty in the extent of actual emissions reductions from off-cycle technologies and the potential use of off-cycle technologies in place of the cost-effective technologies assumed in setting the standards. Consequently, the Lutsey and Isenstadt analysis questions how the off-cycle technologies program might be constructed in the future. There will most likely still be additional technologies that provide additional fuel economy and GHG benefits outside the FTP. However, the testing to ensure that such technologies deliver the anticipated benefits in the real world is needed, both for the current setting and undoubtedly in the future.
7.4.6 Findings and Recommendation for Accessories and Off-Cycle Technologies
FINDING 7.10: Heating and cooling efficiencies are an area of active research and hold the greatest promise in the electrification of vehicles, where the power draw for heating and cooling is a motivation to improve these efficiencies for consumer acceptance.
FINDING 7.11: Several automakers are using cooling systems that incorporate the powertrain, battery, and cabin heating and cooling to optimize use of and exhaust of heat from all components. The recovery and conversion of thermal energy from batteries and exhaust into electric energy to charge the battery is an area of active research and development.
FINDING 7.12: While significant thermal loss remains in ICE propulsion systems, recovering this energy and converting it into electrical energy is not a cost-effective focus for automakers.
RECOMMENDATION 7.3: The U.S. Department of Energy should provide research funding for the assessment of thermal improvements in electrified systems.
7.5 CONSIDERATIONS FOR MASS AND SAFETY IN LIGHT OF INCREASED PENETRATION OF ADAS AND ELECTRIFICATION
Motor vehicle safety is important. Preliminary estimates indicate that more than 36,000 people died in motor vehicle crashes in 2019, and every year vehicle crashes lead to millions of significant injuries and billions of dollars in medical care and lost wages (NHTSA, 2020; CDC, 2020). Many factors affect motor vehicle safety, including those associated with the driver—unsafe driving behaviors and driver error—as well as system-wide deficiencies in road design, traffic environment, and vehicle maintenance. Other factors include vehicle crashworthiness and vehicle-to-vehicle mass disparity and structural and geometric compatibility. While any implications of fuel economy regulations for vehicle safety have been small compared to the primary determinants of vehicle safety, understanding and addressing the potential unintended consequences is important. This section describes some factors related to both fuel economy and safety that NHTSA should pay particular attention to in 2025–2035.
This report considers the technologies that can be implemented in 2025–2035 to improve fuel economy. From this evaluation, the committee has identified two key areas for NHTSA to consider in order to better understand the relationship between vehicle safety and fuel economy technologies: changes in crash prevalence owing to ADAS and changes in mass disparity that could occur in that time period. ADAS implementation and
mass disparity may or may not change in response to fuel economy standards themselves. Regardless of the driving force for ADAS implementation and mass disparity, however, NHTSA should examine their impact on the broader relationship between fuel economy technologies and safety.
To improve fuel economy, automakers are expected to redesign about 40% of vehicles in the MY 2020 baseline fleet by MY 2025 using both design optimization and materials substitution to reduce vehicle mass, as noted earlier in this chapter. During 2025–2035, these lightweighting efforts will likely occur concurrently with increased adoption of electric powertrains and comfort and safety features associated with driver assist and CAVs, both of which increase vehicle mass. This will result in new vehicle designs in 2025–2035 that will differ from current vehicles in the fleet. Based on electrification volume, battery pack cost, and battery energy cell density as variables, several potential lightweighting scenarios using advanced materials (high-strength steel, aluminum, and magnesium) in the future fleets were shown Table 7.10. In the scenarios considered, all vehicle classes can achieve curb weight reductions, although the reductions have a wide range, 1%–14% for cars and unibody SUVs and 2%–10% for pickup trucks.
In light of the significant number of crashes and potential for injury or death, the federal government, consumers, and automakers all recognize the importance of vehicle crashworthiness. All new vehicles must meet the relevant Federal Motor Vehicle Safety Standards (FMVSS) for crashworthiness, regardless of what technologies they implement (e.g., powertrain or lightweighting). Consumers expect automakers to continue delivering safer vehicles. In response, automakers attempt to go above and beyond the required FMVSS and also make improvements for individual models year by year. Solutions to improve crashworthiness include better design and better materials, which are implemented to increase safety regardless of lightweighting or powertrain technology. Current crashworthiness standard tests, however, do not consider crash compatibility between vehicles of different sizes and weights. Because the tests require a vehicle to protect itself, large vehicles are more protected in crashes with smaller vehicles, exacerbating the potential problems with mass disparity in the fleet.
NHTSA should study the relationship between lightweighting and safety in the case of reduced or changed accident type as a result of ADAS or, similarly, in the case of different levels of mass disparity in the fleet. The increasing implementation of ADAS systems is intended to reduce crashes and intends to reduce injuries, property damage, and deaths from those crashes. ADAS implementation will not eliminate all crashes, however, including for vehicles not implementing ADAS, and will also change the prevalence of some crash types. A study that examined the effects of transportation trends, safety initiatives, and new technology on crashes in 2020–2030 forecasted significant decreases in injured occupants from road departures and control loss crashes, mainly owing to the penetration of electronic stability control into the fleet, but smaller decreases in injured occupants in lane change, opposite direction, and other crashes mitigated by a lesser penetration and effectiveness of ADAS systems in these crash scenarios (Mallory et al., 2019). This study accounted for numerous trends including population growth by age group; proportion of occupants in future crashes by vehicle class; seatbelt use; and penetration of ADAS systems such as automatic braking with forward crash warning and crash imminent braking, blind spot detection, lane and road departure warning, lane-keeping support, and Level 3–5 automated driving systems. NHTSA should continue to study how crashes change in an ADAS-enabled fleet, and if changes in crash propensity or severity affect the total societal safety risk when more vehicles also incorporate improved fuel economy technologies, such as new materials or advanced powertrains.
Mass disparity exists in the current light-duty fleet owing to the wide range of vehicle sizes as well as the different technologies implemented in vehicles. There is even greater disparity when pedestrian, bicycle, motorcycle, and medium- and heavy-duty vehicles and modes are considered. There will continue to be mass and size disparity in the fleet in 2025–2035, but it is not clear if the disparity will increase or decrease relative to that in the current fleet. Furthermore, it is not clear how much of the changes in mass disparity will be a direct result of the fuel economy standards rather than occurring independently.
Statistical analyses of historical crash data have been performed to understand the relationship between average mass across the fleet, mass disparity, and traffic fatalities. There is a consensus that increasing the mass disparity of the fleet increases societal fatality risks (Farmer, 2019; Wenzel, 2019). However, the specific relationships identified in previous studies may not be relevant for understanding the future fleet because of new
vehicle designs and the change to footprint-based standards. Potential changes in mass disparity in 2025–2035 should be studied, particularly those that may arise from a shift from sedans to CUV/SUV/pickup trucks; mass increases in one vehicle class but not another; lightweighting to improve fuel efficiency and performance; and increases in mass from electrified powertrains, ADAS, and other safety and comfort features. Particular attention should be paid to how these changes in fleet mass would affect societal safety risk. Examples of current efforts toward this goal include NHTSA’s computer-aided engineering modeling simulations, which compute societal occupant injury risk in the vehicle fleet from crashes with lightweight vehicle concept designs (NHTSA, 2011; Samaha et al., 2014; Radwan, 2015), and Transport Canada’s recent crash test series, which compares occupant protection in EVs to the protection offered by equivalent ICE vehicle models (Tylko et al., 2019).
Last, the committee recommends that FMVSS improve testing protocols for crash compatibility, as better crash compatibility will reduce the adverse effect of mass disparity on crash safety for passengers of all vehicles. The committee also recommends that NHTSA develop standard naming and test protocols for safety and fuel economy benefits from ADAS. Furthermore, education of consumers on the benefits of ADAS would likely increase consumer acceptance and adoption of systems that will increase safety, and potentially reduce fuel consumption, through reduced crashes, reduced congestion, and improved vehicle operation.
7.5.1 Findings and Recommendations for Mass and Safety
FINDING 7.13: There exists mass disparity in the current fleet, and that mass disparity may increase or decrease in the future, depending on changes in vehicle technologies and other attributes implemented for fuel economy.
FINDING 7.14: Current crashworthiness standard tests do not consider crash compatibility between vehicles of different sizes and weights, leading to heavier weight vehicles being more protected in crashes with lighter weight vehicles.
RECOMMENDATION 7.4: The National Highway Traffic Safety Administration should continue to study how crashes change in an advanced driver assist systems-enabled fleet, and if changes in crash propensity or severity affect the total societal safety risk when more vehicles also incorporate improved fuel economy technologies, such as new materials or advanced powertrains.
RECOMMENDATION 7.5: The National Highway Traffic Safety Administration should study potential changes in mass disparity in 2025–2035, particularly disparities that may arise from a shift from sedans to crossover vehicle/sport utility vehicle/pickup trucks, mass increases in one vehicle class but not another, lightweighting to improve fuel efficiency and performance, and increases in mass from electrified powertrains and other safety and comfort features. Particular attention should be paid to how these changes in fleet mass would affect societal safety risk. This could be achieved by conducting relevant crash tests and/or further development of computer-aided engineering fleet modeling to simulate real-world crash interactions of new vehicle designs and vulnerable users at different impact speeds and impact configurations.
RECOMMENDATION 7.6: The National Highway Traffic Safety Administration should develop testing protocols and corresponding Federal Motor Vehicle Safety Standards with frontal crash compatibility requirements to address disparities in mass, stiffness, and geometries in vehicles designs.
7.6 TOTAL OPPORTUNITIES FOR ROAD LOAD AND ACCESSORY POWER DRAW REDUCTION
Road load reduction improves the efficiency of a vehicle by reducing the energy required to move the vehicle. Accessory loads are similar, although their reduction improves the efficiency of providing the accessories, such as
climate control, headlights, and infotainment systems. Reducing both road and accessory loads not only directly reduces vehicle energy use but also allows other aspects of the vehicle propulsion system to be resized. For example, less required energy means the engine or battery and motor can be reduced in size, which then allows further reduction in mass (Lovins, 2020). Table 7.15 gives the committee’s estimates for costs and effectiveness of implementing various road load reduction technologies in 2025–2035.
In 2025–2035, automakers will pursue road load reduction strategies to meet customer expectations and fuel economy and emissions standards. Automakers will continue to develop and incorporate new technologies and designs to reduce road load on individual vehicle models, at the very least to offset mass add-back from electrification and safety and performance technologies. At the same time, however, certain trends in the automotive market may reduce the impact of road load reduction technologies on total fuel consumption and GHG emissions reductions. For instance, as discussed in Section 7.2 above, both the mass and footprint of vehicles are generally increasing. The path and degree to which automakers choose to implement these technologies will be informed by their overall brand portfolio strategy and larger technology and market trends, such as the extent and cost of fleet electrification.
7.6.1 Summary Cost and Effectiveness Table
TABLE 7.15 Cost and Effectiveness of New Technologies for Mass Reduction, Aerodynamic Drag Reduction, and Tire Rolling Resistance Reduction
| Technology | Technology Cost (2018$) | Technology Effectiveness (% Fuel Consumption Reduction)a | ||
|---|---|---|---|---|
| 2025 | 2030 | 2035 | ||
| Mass reduction—unibodyb | ||||
| 1%–1.5% | 0.45–0.67 | 0.22–0.67 | 0.05–0.22 | 0.6–1.05 |
| 4%–6% | 0.67–1.78 | 0.67–1.56 | 0.58–0.89 | 2.4–4.2 |
| 12%– 14%c | 1.78–2.67 | 1.78–2.67 | 1.34–1.78 | 7.2–9.8 |
| Mass reduction—truckb | ||||
| 2%–3% | 0.45–0.67 | 0.22–0.67 | 0.05–0.45 | 0.8–1.5 |
| 8%–10%c | 0.67–1.27 | 0.89–1.34 | 0.45–0.89 | 3.2–5.0 |
| 10%–12%c | 4.01–4.90 | 3.34–4.45 | 2.67–3.56 | 4.0–6.0 |
| Aerodynamic drag reductiond | ||||
| 5% | 35.50 | 30.28 | 27.37 | 1.3 |
| 10% | 68.49 | 61.91 | 55.97 | 2.3 |
| 15% | 96.78 | 87.48 | 79.08 | 3.5 |
| 20% | 171.23 | 154.78 | 139.91 | 4.8 |
| Tire rolling resistance reductione | ||||
| 10% | 4.24 | 4.00 | 3.89 | 2 |
| 20% | 27.19 | 24.80 | 24.32 | 4 |
a Fuel consumption reduction is relative to a baseline vehicle, and not incremental to previous technology.
b MR percent is curb weight reduction from a MY 2020 baseline; costs ($/lb) for materials substitution only, as reported in Bailo et al. (2020), converted from 2019$ to 2018$ and from $/kg to $/lb (1 kg = 2.2 lb).
c Includes secondary mass reduction, calculated as described in NRC (2015).
d Cost values are 2% per year reductions from MY 2017 values reported in NHTSA/EPA, 2020. Effectiveness values are committee estimates based on NRC (2015) and NHTSA/EPA (2020).
e Percent reduction from baseline Crr of 0.009; cost and effectiveness values are committee estimates based on NHTSA/EPA (2020).
7.7 REFERENCES
Aldhufairi, H.S., K. Essa, and O. Olatunbosun. 2019. Multi-chamber tire concept for low rolling resistance. SAE International Journal: Passenger Cars—Mechanical Systems 12(2):111–126. Article ID: 06-12-02-0009.
Aldhufairi, H.S., and O.A. Olatunbosun. 2017. Developments in tire design for lower rolling resistance: A state of the art review. Proceedings of the Institution of Mechanical Engineers, Part D: Journal of Automobile Engineering 232(14): 1865–1882.
American Chemistry Council. 2019. “Plastics and Polymer Composites in Light Vehicles.” August. https://www.automotiveplastics.com/wp-content/uploads/Plastics-and-Polymer-Composites-in-Light-Vehicles-2019-REV-Sm.pdf.
Apostolaki-Iosifidou, E., P. Codani, and W. Kempton. 2017. Measurement of power loss during electric vehicle charging and discharging. Energy 127:730–742.
Bailo, C., S. Modi, M. Schultz, T. Fiorelli, B. Smith, and N. Snell. 2020. “Vehicle Mass Reduction Roadmap Study 2025–2035.” Ann Arbor, MI: Center for Automotive Research.
Billur, E., and T. Altan. 2013. Three generations of advanced high-strength steels for automotive applications. Part I, Stamping Journal: 16–17.
Bull, M. 2011. “Mass Reduction Performance of PEV and PHEV Vehicles.” In 22nd International Technical Conference on the Enhanced Safety of Vehicles (ESV), 8.
CDC (Centers for Disease Control and Prevention, National Center for Injury Prevention and Control). 2020. “Cost Data and Prevention Policies | Motor Vehicle Safety.” Centers for Disease Control and Prevention. November 6. https://www.cdc.gov/transportationsafety/costs/index.html.
DOE/EPA (U.S. Department of Energy and U.S. Environmental Protection Agency). 2019a. “Keeping Your Vehicle in Shape.” https://www.fueleconomy.gov/feg/maintain.jsp.
DOE/EPA. 2019b. “Where the Energy Goes: Gasoline Vehicles.” https://www.fueleconomy.gov/feg/atv.shtml.
DOE/EPA. 2019c. “Where the Energy Goes: Hybrids.” https://www.fueleconomy.gov/feg/atv-hev.shtml.
DOE/EPA. 2019d. “Where the Energy Goes: Electric Cars.” https://www.fueleconomy.gov/feg/atv-ev.shtml.
Donley, T. 2014. “Improving Vehicle Fuel Efficiency Through Tire Design, Materials, and Reduced Weight.” Department of Energy Annual Merit Review 2014, Vehicle Technologies, Project ID: VSS083. June.
Ducker Worldwide and Aluminum Association. 2017. “Unprecedented Growth Expected for Automotive Aluminum as MultiMaterial Vehicles Ascend, New Survey of Automakers Says.” Ducker Worldwide. August 1. https://www.ducker.com/news-insights/unprecedented-growth-expected-automotive-aluminum-multi-material-vehicles-ascend-new.
Els, P. 2017. “Electric Power Steering Systems (EPS) Have Never Been Safer.” Automotive IQ. March 14. https://www.automotive-iq.com/chassis-systems/articles/electric-power-steering-systems-eps-have-never-been-safer.
EPA (U.S. Environmental Protection Agency). 2020. The 2019 EPA Automotive Trends Report: Greenhouse Gas Emissions, Fuel Economy, and Technology since 1975. Washington, DC: U.S. Environmental Protection Agency. March. https://nepis.epa.gov/Exe/ZyPDF.cgi?Dockey=P100YVFS.pdf.
EPA/NHTSA (U.S. Environmental Protection Agency and National Highway Traffic Safety Administration). 2012. Joint Technical Support Document: Final Rulemaking for the 2017–2025 Light-Duty Vehicle Greenhouse Gas Emission Standards and Corporate Average Fuel Economy Standards. EPA-420-R-12-901. http://www.epa.gov/otaq/climate/documents/420r12901.pdf.
EPA/NHTSA/CARB (U.S. Environmental Protection Agency, National Highway Traffic Safety Administration, and California Air Resources Board). 2016. “Draft Technical Assessment Report: Midterm Evaluation of Light-Duty Vehicle Greenhouse Gas Emission Standards and Corporate Average Fuel Economy Standards for Model Years 2022–2025.” EPA-420-D-16-901. https://www.nhtsa.gov/staticfiles/rulemaking/pdf/cafe/Draft-TAR-Final-Executive-Summary.pdf.
Farmer, C.M. 2019. “Fuel Economy and Highway Safety.” Presentation to the Committee on Assessment of Technologies for Improving Fuel Economy of Light-Duty Vehicles—Phase 3.” Insurance Institute for Highway Safety. September 19. https://www.nationalacademies.org/event/09-19-2019/safety-webinar.
Gawron, J., G.A. Keoleian, R.D. De Kleine, T.J. Wallington, and H.C. Kim. 2018. Life cycle assessment of connected and automated vehicles: Sensing and computing subsystem and vehicle level effects. Environmental Science and Technology 52(5):3249–3256.
ICCT (International Council on Clean Transportation). 2018. International Council on Clean Transportation Comments on the Safer Affordable Fuel-Efficient (SAFE) Vehicles Rule for Model Years 2021–2026 Passenger Cars and Light Trucks.
Islam, E.S., A. Moawad, N. Kim, and A. Rousseau. 2020. A Detailed Vehicle Simulation Process to Support CAFE and CO2Standards for the MY 2021–2026 Final Rule Analysis. ANL/ESD-19/9. March 31. https://doi.org/10.2172/1608044.
Kreutzer, C., B. Kekelia, J.P. Rugh, and G. Titov. 2017. “U.S. Light-Duty Vehicle Air Conditioning Fuel Use and the Impact of Four Solar/Thermal Control Technologies.” Presented at the SAE 2017 Thermal Management Systems Symposium, Plymouth, MI. October. https://www.nrel.gov/docs/fy18osti/69047.pdf.
Lovins, A.B. 2020. “Integrative Design of Automobiles.” Presented at the Design Optimization and Lightweighting Webinar to Committee on Assessment of Technologies for Improving Fuel Economy of Light-Duty Vehicles—Phase 3. January 6. https://www.nationalacademies.org/event/01-06-2020/design-optimization-webinar.
Lutsey, N., and A. Isenstadt. 2018. How will off-cycle credits impact U.S. 2025 efficiency standards? ICCT White Paper. https://theicct.org/sites/default/files/publications/Off-Cycle-Credits_ICCT-White-Paper_vF_20180327.pdf
Mallory, A., A. Kender, E. Hutter, and K. Moorhouse. 2019. “Crashes and Injuries in 2020–2030: Development of a Crash Data Projection Model,” Injury Biomechanics Research, Proceedings of the Forty-Seventh International Workshop, sponsored by NHTSA, November 2019, San Antonio, Texas.
Modi, S., and A. Vadhavkar. 2019. “Technology Roadmap: Materials and Manufacturing.” Ann Arbor, MI: Center for Automotive Research. https://www.cargroup.org/wp-content/uploads/2019/10/Technology-Roadmap_Materials-and-Manufacturing.pdf.
NASEM (National Academies of Sciences, Engineering, and Medicine). 2019. Reducing the Fuel Consumption and Greenhouse Gas Emissions of Medium- and Heavy-Duty Vehicles, Phase Two: Final Report. Washington, DC: The National Academies Press. https://doi.org/10.17226/25542.
NHTSA (National Highway Traffic Safety Administration). 2011. “Finite Element Modeling in Fleet Safety Studies,” presentation to the NHTSA Mass-Size-Safety Symposium, February 25. Washington, DC. https://one.nhtsa.gov/Laws-&-Regulations/CAFE-–-Fuel-Economy/NHTSA-Workshop-on-Vehicle-Mass–Size–Safety.
NHTSA. 2019. “Tires.” https://www.nhtsa.gov/equipment/tires.
NHTSA. 2020. “Early Estimates of 2019 Motor Vehicle Traffic Data Show Reduced Fatalities for Third Consecutive Year.” May 5. https://www.nhtsa.gov/press-releases/early-estimates-traffic-fatalities-2019.
NHTSA/EPA (National Highway Traffic Safety Administration and U.S. Environmental Protection Agency). 2018. The Safer and Affordable Fuel-Efficient (SAFE) Vehicles Rule for Model Year 2021–2026 Passenger Cars and Light Trucks: Preliminary Regulatory Impact Analysis. October 16. https://www.nhtsa.gov/sites/nhtsa.dot.gov/files/documents/ld_cafe_co2_nhtsa_2127-al76_epa_pria_181016.pdf.
NHTSA/EPA. 2020. Final Regulatory Impact Analysis: The Safer Affordable Fuel-Efficient (SAFE) Vehicles Rule for 2021–2026 Passenger Cars and Light Trucks. March. https://www.nhtsa.gov/sites/nhtsa.dot.gov/files/documents/final_safe_fria_web_version_200330.pdf.
NRC (National Research Council). 2013. Transitions to Alternative Vehicles and Fuels. Washington, DC: The National Academies Press
NRC. 2015. Cost, Effectiveness, and Deployment of Fuel Economy Technologies for Light-Duty Vehicles. Washington, DC: The National Academies Press.
Pannone, G. 2015. Technical Analysis of Vehicle Load Reduction Potential for Advanced Clean Cars. Report by CONTROLTECH, LLC., for the California Air Resources Board. https://ww2.arb.ca.gov/sites/default/files/classic//research/apr/past/13-313.pdf.
PrimeXBT. 2020. “Crude Oil Prices Forecast and Predictions for 2020, 2025, and 2030.” Price Prediction. October 21. https://primexbt.com/blog/oil-price-prediction-forecast/.
Radwan, R., 2015. “Real World Derived Simulation Methodology for the Evaluation of Fleet Crash Protection of New Vehicle Designs.” George Washington University, ProQuest Dissertations Publishing, Pub. No. 3686081.
Röchling. n.d. “Active Grille Shutter.” Röchling. https://www.roechling.com/automotive/products-solutions-1/aerodynamics/active-grille-shutter.
Samaha, R., R. Radwan, P. Prasad, D. Marzougui, C. Dui, K. Digges, S. Summers, L. Zhao, and A. Farsan-Anelli, 2014. “Methodology for Evaluating Fleet Protection of New Vehicle Designs: Application to Lightweight Vehicle Designs.” DOT HS 812 051A. National Highway Traffic Safety Administration. https://www.nhtsa.gov/crashworthiness/vehicleaggressivity-and-fleet-compatibility-research.
Summe, T. 2019. “Fuel Economy with Aluminum.” Presented at Materials Webinar to Committee on Assessment of Technologies for Improving Fuel Economy of Light-Duty Vehicles—Phase 3. May 17. https://www.nationalacademies.org/event/05-17-2019/materials-webinar.
TRB (Transportation Research Board). 2006. Tires and Passenger Vehicle Fuel Economy. TRB Special Report 286. Washington, DC: Transportation Research Board.
Tylko, S.J., K. Tang, and A. Bussières. 2019. Comparison of Occupant Protection in Electric vs. Internal Combustion Vehicles. IRC-19-10. IRCOBI Conference 2019.
UBS. 2017. “UBS Evidence Lab Electric Car Teardown—Distruption Ahead?” Q-Series. May 18. https://neo.ubs.com/shared/d1wkuDlEbYPjF/.
Wenzel, T. 2019. “Relationships Between Mass, Footprint, and Societal Fatality Risk in Recent Light-Duty Vehicles.” Presentation to the National Academies Committee on Assessment of Technologies for Improving Fuel Economy of Light-Duty Vehicles—Phase 3. September 19. https://www.nationalacademies.org/event/09-19-2019/safety-webinar.
WorldAutoSteel. n.d. “Advanced High-Strength Steel (AHSS) Definitions.” World Steel Association. https://www.worldautosteel.org/steel-basics/automotive-advanced-high-strength-steel-ahss-definitions/.
Yang, Z. 2018. Fuel-efficiency technology trend assessment for LDVs in China: Vehicle technology. San Francisco, CA: The International Council for Clean Transportation. September 17. https://theicct.org/sites/default/files/publications/PV_Tech_Trend_Vehicle_20180917.pdf.
Yen, R. 2020. “Simulation-Driven Lightweight Design for Automotive Structures.” Presented at the Design Optimization and Lightweighting Webinar to the Committee on Assessment of Technologies for Improving Fuel Economy of Light-Duty Vehicles—Phase 3. January 6. https://www.nationalacademies.org/event/01-06-2020/design-optimization-webinar.
YourMechanic. 2015. “How Does Adjustable Suspension Work?” Autoblog. https://www.autoblog.com/2015/11/17/howdoes-adjustable-suspension-work/.


