
3
2025 Baseline of Vehicles
3.1 COMPARATIVE BENCHMARKS FOR 2016–2026 VEHICLES
This chapter summarizes applicable developments related to the evolution of vehicle efficiency and carbon dioxide (CO2)-reduction technology in the near-term time frame and examines the current fleet and makes estimates of technology penetration in 2020–2025 using the most recent and comprehensive baseline databases for 2016–2018 new vehicles and regulatory analyses through 2026. There are several applicable regulation levels and multiple technology pathways that are relevant to the amount and types of vehicle technologies that will be deployed to increase efficiency through 2025 and 2026. This chapter describes the committee’s assumptions for its evaluation of benchmark technologies, efficiency, and CO2 emission levels by vehicle class and therefore helps create a link between 2018–2020 regulatory developments and the committee’s chapters on 2025–2035 technologies. In addition, the chapter provides related global regulatory context for continued automotive industry investments in vehicle efficiency and electric vehicles.
3.2 BASELINE VEHICLE CLASSES
The latest complete detailed data set, for which all the critical vehicle attributes (e.g., make, model, engine, transmission, emissions, fuel economy, size, mass, vehicle class, sales, application of efficiency technology) are included, is the model year (MY) 2017 data set used in the March 2020 regulatory analysis (NHTSA/EPA, 2020). The vehicle emission levels, efficiency, technologies applied, vehicle classes, and other characteristics from this 2017 data set are analyzed and applied in this analysis.
Throughout this report, two types of vehicle breakdowns, regulatory and vehicle classes, are used, as shown in Table 3.1. For regulatory purposes, the light-duty vehicle (LDV) fleet is fundamentally split into passenger cars and light trucks, each of which gets its own set of regulatory targets for each MY. For the committee’s discussion of the relative efficiency, emission levels, and technologies throughout the report, representative vehicle classes are established. The analysis applies five major vehicle classes as also shown in Table 3.1, based on the vehicle body types used by the regulatory agencies in their analyses. The classes broadly cover the market and distinguish how different efficiency technologies may be applied in each class and have different cost and effectiveness values.
TABLE 3.1 Vehicle Classes and Sales-Weighted Attributes for MY 2017
| Class | Sales | Percent of Total Sales | Percent Light Trucks | Test Fuel Economy (MPG) | Test CO2 Emissions (g/mi) | Label Fuel Economy (MPG) | |
|---|---|---|---|---|---|---|---|
| Regulatory category | Passenger car | 8,955,057 | 53% | 0% | 37.6 | 237 | 28.9 |
| Light trucks | 8,054,950 | 47% | 100% | 26.9 | 330 | 20.7 | |
| Vehicle class | Small car | 4,393,901 | 26% | 0% | 42.2 | 211 | 32.5 |
| Medium car | 2,102,788 | 12% | 0% | 33.4 | 266 | 25.7 | |
| Crossover | 4,565,184 | 27% | 50% | 33.3 | 267 | 25.6 | |
| Sport utility vehicle | 3,889,793 | 23% | 95% | 26.6 | 334 | 20.5 | |
| Pickup | 2,058,341 | 12% | 100% | 23.6 | 376 | 18.2 | |
| Total | 17,010,007 | 100% | 47% | 31.6 | 281 | 24.4 |
NOTE: CO2 = carbon dioxide; MPG = miles per gallon.
SOURCE: NHTSA/EPA (2020).
The small car class includes subcompact and compact vehicles, and the medium car class includes midsize and large cars. The crossover class includes small car platform-based sport utility vehicles (SUVs) and hatchbacks; the SUV class includes the larger SUVs and minivans; and the pickup class covers those pickups that fall within the LDV classification. The smaller classes tend to be lighter and deliver higher fuel economy in miles per gallon (MPG). These classes are used in the sections below to assess trends going forward for technology adoption for 2025 and beyond vehicles. The test cycle efficiency in MPG is shown, along with the corresponding grams of CO2 per mile (g CO2/mi), based on the assumption of 8,887 grams of CO2 per gallon of gasoline. A simple estimate of consumer label fuel economy is shown, based on a simple 23% reduction from the test-cycle CO2 level. As indicated in the most recent trends reports (EPA, 2020), the general trend is toward a higher share of LDVs in the crossover class.
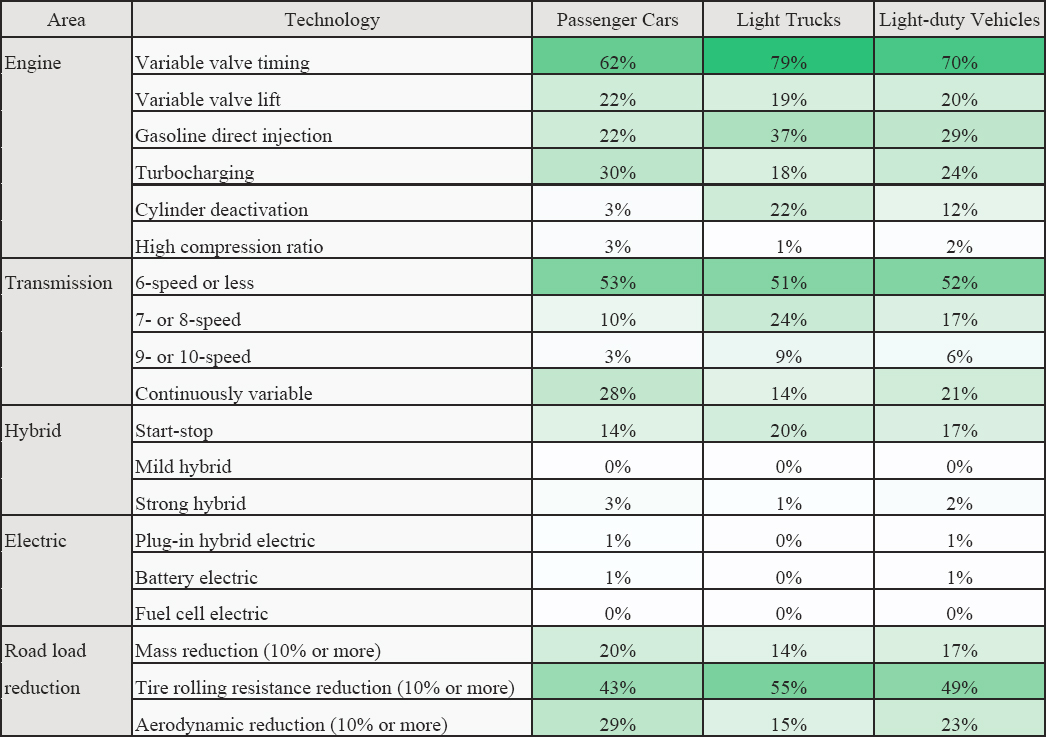
Figure 3.1 summarizes the relative uptake of efficiency technologies in MY 2017 vehicles, as represented in the National Highway Traffic Safety Administration (NHTSA) 2017 reference fleet. As shown, technologies that can improve efficiency and performance in the engine, transmission, hybrid, electric, and road load areas have seen penetration across the five classes. Many of these technologies had much lower shares in MY 2008 vehicles, the baseline from which the 2012–2016 CO2 and corporate average fuel economy (CAFE) regulations were developed. For example, of all MY 2008 vehicles sold, 2% had gasoline direct injection, 3% had turbocharging, 10% had 7-or-greater transmission gears, and 0% had non-hybrid stop-start. Since the 2016 database of MY 2017 vehicles used in Figure 3.1 was developed, several technologies have seen further increases, for example, to 31% turbocharging and 28% stop-start in MY 2018 (EPA, 2019).
3.3 FUTURE YEAR CO2 REDUCTION AND INCREASED EFFICIENCY TO 2025
To understand the likely efficiency technology packages of vehicles in the new vehicle fleet around 2025, the committee reviewed the required stringency and projected least-cost paths to reach the original 2021–2025 5% and newly revised 2021–2026 1.5% yearly increases in fuel economy, as assessed by the U.S. Environmental Protection Agency (EPA) and NHTSA in their regulatory documents. The committee considers these to represent a reasonable approximation of possible futures for the auto industry to globally deploy technologies. Another benchmark is the 3.7% annual reduction in CO2 emissions agreed to by the California Air Resources Board and several automakers (CARB, 2019).
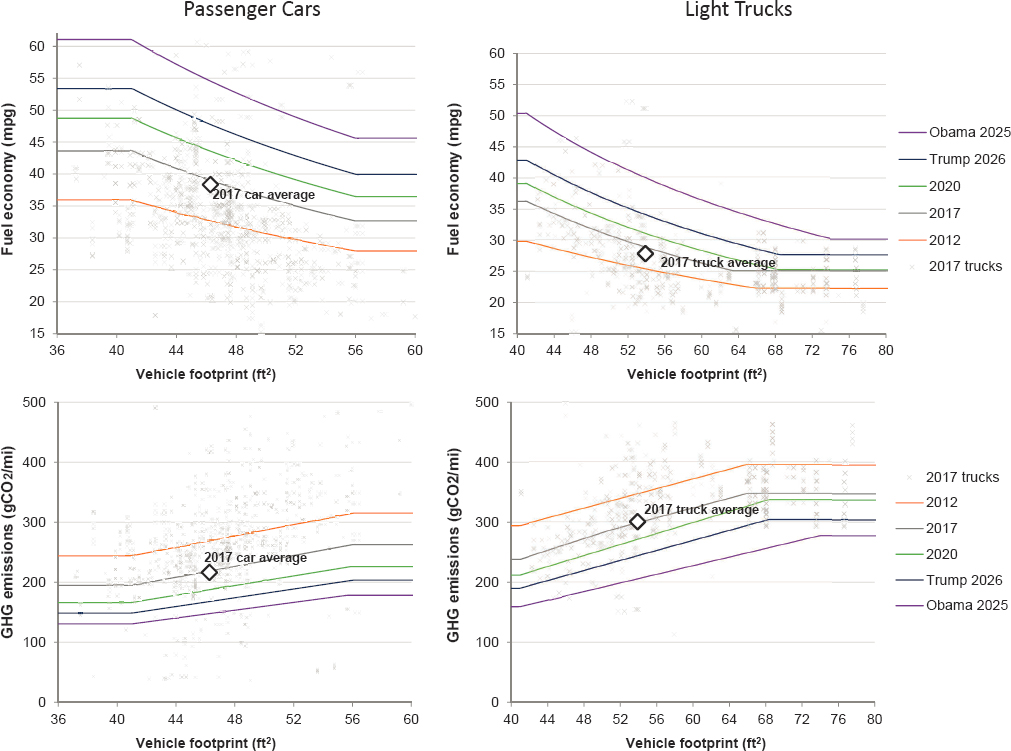
MY 2017 vehicle models are shown in comparison to vehicle footprint-indexed target lines of the regulatory standards for 2012, 2017, and 2020 fuel economy (top panels) and CO2 emission (bottom panels) in Figure 3.2. The figure displays regulatory target lines for the original Obama administration 2025 standards and newly adopted
SOURCE: NHTSA/EPA (2020).
2026 standards. The figure includes passenger car standards and MY 2017 vehicles on the left and light truck standards and models on the right. The sales-weighted average for 2017 vehicles is also shown. As indicated the individual vehicle models are scattered across a wide range of vehicle footprints, fuel economy, and CO2 emissions. The footprint-indexed target lines are designed to ensure that vehicles across different sizes see efficiency improvements from additional technology, rather than to promote the shift toward smaller vehicles, to comply with the standards.
3.4 MY 2020 VEHICLES WITH LOWEST CO2 EMISSIONS
To help assess the deployment of automotive technologies, this section analyzes the top-performing low-CO2-emission models, excluding hybrids, as compared to newly adopted Trump administration 1.5% and original Obama administration 5% per year improvements through 2026. Although there are several dozen hybrid models that compare even more favorably than the conventional non-hybrid models illustrated below, this section’s analysis focuses on determining the lowest-CO2 vehicles using conventional engine and transmission technologies, as these show the more dominant, mainstream, and low-cost technologies.
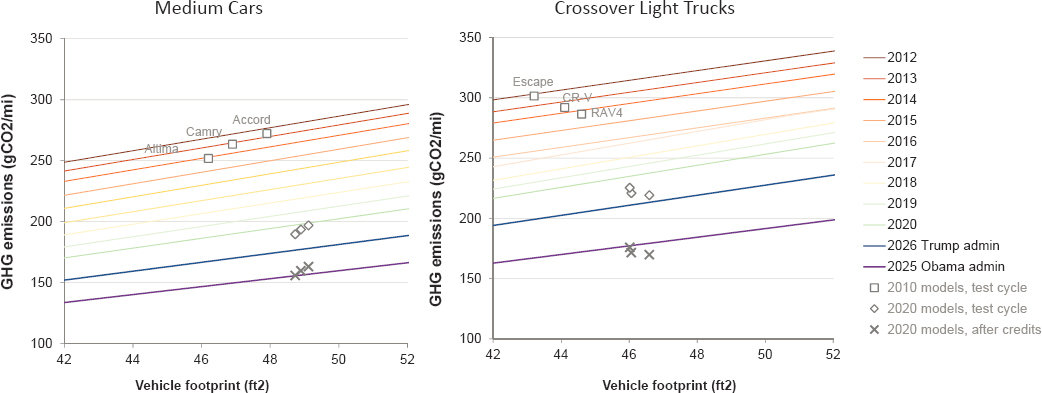
As a first step, the lowest-CO2 MY 2020 vehicles in two major vehicle classes, midsize cars and crossover light trucks, were identified as compared to the footprint-indexed CO2 standards. Figure 3.3 shows the MY 2012–2021
SOURCE: Committee generated based on NHTSA/EPA (2020) and EPA (2021).
footprint indexed standards and future 1.5% (Trump administration) and 5% (Obama administration) improvements per year from 2021 on, and the lowest-CO2 non-hybrid medium car and crossover light truck models from MY 2020. The car models are the Honda Accord, Nissan Altima, and Toyota Camry. Note that the California-automaker 3.7% per year CO2 reduction benchmark would be approximately equivalent to the 2025 Obama administration line, but for 1 year later (i.e., 2026). The crossover models are all-wheel-drive versions of the Ford Escape, Honda CR-V, and Toyota RAV4. Further details on the vehicle specifications are summarized below. Also shown in Figure 3.3 are the CO2 emission levels for the comparable 2010 versions of the models to show how the models’ test cycle CO2 emissions have declined. As shown, the MY 2010 models’ test cycle CO2 emissions typically matched the 2012–2014 footprint-indexed greenhouse gas (GHG) targets. The 2020 models’ test cycle CO2 emissions approximately match the 2020 footprint-indexed GHG targets, before credits outside the test cycle are factored into their CO2 levels.
Figure 3.3 also shows the 2020 models, including the assumed use of applicable technology credits that can be expected to be widely deployed in the 2025 time frame. The available technology credits include air conditioning credits and off-cycle credits. For historical context, when averaged over all MY 2016 vehicles, passenger cars had 9 grams per mile (g/mi) air conditioning and 2 g/mi off-cycle credits; light trucks had 11 g/mi for air conditioning and 4 g/mi off-cycle credits. To provide an applicable comparison for how the MY 2020 vehicle compares
SOURCE: Committee generated based on NHTSA/EPA (2020) and EPA (2021).
against the MY 2025 standards, more complete usage of the technology credits is assumed in the figure for air conditioning (18.8 g/mi for cars, 24.4 for light trucks) and off-cycle credits (17 g/mi for cars, 24 for light trucks). Off-cycle credits from a predefined technology menu are limited to an average of 15 g/mi (CARB, 2019), and cars typically get lower, and light trucks higher, credit values (EPA, 2020). Additional off-cycle technologies outside the menu, and therefore without such menu restrictions, are increasingly being granted credits (EPA, 2020; Lutsey and Isenstadt, 2018). The effect of these two types of credits is that the lowest-CO2 2020 medium cars and crossovers approximately match the original 5% per year 2024–2025 footprint-indexed CO2 target curves.
To further understand the technology trends involved with the Figure 3.3 analysis, Table 3.2 shows the detailed vehicle specifications for the low-CO2 car and crossover models depicted. From 2010 to 2020, the six different models each saw CO2 emissions reduce by 22% to 29%, while also getting larger by 2% to 7%, while also increasing power by 1% to 13%. These trends are also being seen in the wider fleet over this time period. The vehicle models each had efficiency technologies added in the vehicle redesign and refresh cycles that occurred at different points within the 2010–2020 time period. As shown in MY 2020, several leading low-CO2 models have variable valve timing and/or lift, turbocharging, direct injection, and advanced transmissions (8-speed or continuously variable). Technologies like cylinder deactivation and stop-start are also deployed on some models. The overall fleet trends for the most recent complete fleet-wide database on adoption of these technologies is shown above in Figure 3.1, which similarly shows that many efficiency technologies have only been deployed in a small percentage of new models.
This analysis illustrates a few key aspects of the functioning of the 2012–2025 CO2 standards. As shown in Table 3.2, different technology pathways are being deployed on different vehicle models by different companies. For example, some of the lowest CO2 models in 2020 (as compared to their CO2 standard lines) have turbocharging, stop-start, cylinder deactivation—while others do not. Considering the leading models of Table 3.2 and the fleet-wide trends of Figure 3.1 together, it appears likely that the various efficiency technologies could see much greater deployment by 2025 if the incrementally more stringent 2021–2025 CO2 standards had remained in place. Another key finding is that companies are deploying technologies that enable the fleet to meet the increasingly stringent standards while simultaneously delivering increased acceleration performance and increased size for passenger and cargo capacity. Although this analysis is based on selected
TABLE 3.2 Vehicle Model Attributes for Selected 2010 and 2020 Vehicle Models
| Vehicle Class | Year | Model | Vehicle Attributes | Power (hp) | Change from MY 2010 to 2020 | Efficiency Technologies | |||
|---|---|---|---|---|---|---|---|---|---|
| Footprint (ft2) | Test Cycle CO2 (g/mi) | Footprint (ft2) | Test Cycle CO2 (g/mi) | Power (hp) | |||||
| Car | 2010 | Camry (2.5 L) | 46.9 | 263.6 | 179 | — | — | — | 6-speed transmission |
| Accord (2.4 L) | 47.9 | 272.3 | 190 | — | — | — | Variable valve timing/lift, 5-speed | ||
| Altima (2.5 L) | 46.1 | 251.9 | 175 | — | — | — | Variable valve timing, continuously variable transmission | ||
| 2020 | Camry (2.5 L) | 48.7 | 189.7 | 203 | 4% | –28% | 13% | Variable valve timing, direct injection, high compression ratio, cooled exhaust gas recirculation, 8-speed, road load reduction | |
| Accord (1.5 L) | 48.9 | 193.6 | 192 | 2% | –29% | 1% | Variable valve timing/lift, turbocharging, direct injection, continuously variable transmission | ||
| Altima (2.5 L) | 49.1 | 197.0 | 188 | 7% | –22% | 7% | Variable valve timing, direct injection, continuously variable transmission | ||
| Crossover light truck | 2010 | CR-V (2.4 L) | 44.1 | 292.0 | 180 | — | — | — | Variable valve timing/lift, 5-speed |
| Escape (2.5 L) | 43.2 | 301.5 | 175 | — | — | — | Variable valve timing, 6-speed | ||
| RAV4 (2.5 L) | 44.7 | 303.4 | 166 | — | — | — | Variable valve timing, 4-speed | ||
| 2020 | CR-V (1.5 L) | 46.1 | 221.0 | 190 | 4% | –24% | 6% | Variable valve timing/lift, turbocharging, direct injection, continuously variable transmission | |
| Escape (1.5L) | 46.0 | 225.4 | 180 | 7% | –25% | 3% | Variable valve timing, turbocharging, direct injection, cylinder deactivation, 8-speed | ||
| RAV4 (2.5 L) | 46.6 | 219.2 | 203 | 4% | –28% | 22% | Variable valve timing, direct injection, high compression ratio, cooled exhaust gas recirculation, 8-speed, road load reduction, stop-start | ||
SOURCE: Committee generated using MY 2010 and 2020 vehicle data from EPA (2021) and German (2018).
SOURCE: Committee generated based on NHTSA/EPA (2020) and CARB (2019).
models, it illustrates in a detailed model-by-model manner what is largely happening on a fleet-wide basis (see EPA, 2019).
FINDING 3.1: The latest complete data set of vehicles released as part of the 2020 National Highway Traffic Safety Administration regulatory analysis (based on the MY 2017 fleet) showed considerable penetration of previously identified fuel-efficient technologies across all five vehicle classes under study. There is also ongoing growth of newly developed fuel-efficient technologies by manufacturers up through the current 2020 models. There is roughly a 20% gap between the average fuel economy of the 2017 fleet and the original 2025 standard, when estimated manufacturer use of credits is taken into account.
3.5 BENCHMARK FOR MY 2025 AND MY 2026
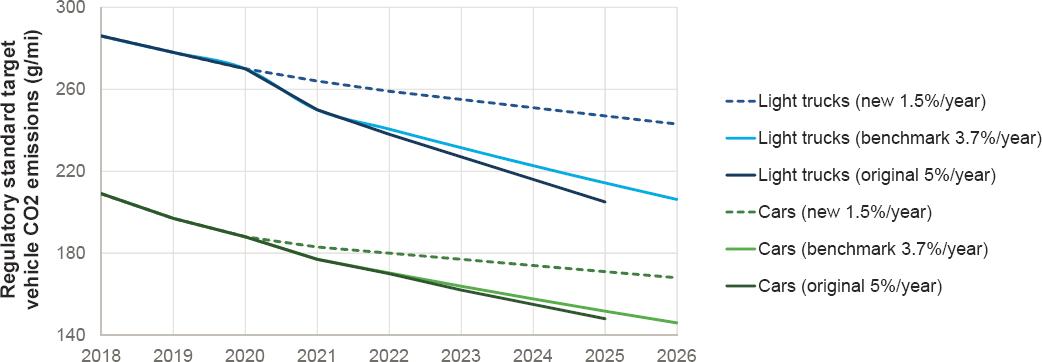
Figure 3.4 shows the original 2012-adopted and the newly revised March 2020 standards through 2026. The original 2012-adopted standards maintain approximately 5% per year CO2 emission reductions for 2020 through 2025. The March 2020 standards would increase fuel economy by 1.5% per year from 2020 through 2026. The announced framework terms by California and four automakers, labeled as the “benchmark” values for cars and light trucks in Figure 3.4, provides a path between the original and rolled-back standards. The benchmark emission levels include lower annual CO2 reduction targets to 3.7% per year from 2021 through 2026 and additional flexibilities that reduce the required test-cycle CO2 reductions, as assessed below.
3.6 BENCHMARK FOR MY 2025
Benchmark vehicle emission levels for 2025 are defined here by the committee to provide an approximation for technology packages that are likely to be commonplace around 2025, the first year of this committee’s analysis. Benchmark efficiency and emission levels are approximated based on the terms of the July 2019 deal between California and four automakers, including incorporation of existing trends for the usage of technology credits. Most of the evaluated technologies assessed below have CO2-reduction effectiveness, measured as a percentage improvement on the standard regulatory test cycles. Because there are also a variety of technology credits (related to air conditioning, off-cycle, and electric vehicle accounting) that affect how much test-cycle vehicle improvement is ultimately needed, an estimate of the potential impact of non-test-cycle technologies toward compliance is included.
TABLE 3.3 Regulatory and Test-Cycle CO2 Emissions for Benchmark 2025 Emission Levels
| Regulation CO2 Emissions | Technology Credit Assumptions for 2025 | Combustion Vehicle Test Cycle CO2 Emission Level | |||||||
|---|---|---|---|---|---|---|---|---|---|
| 2017a (g/mi) | 2025 Target (g/mi) | Change, 2017–2025 | Air Conditioningb (g/mi) | Off-Cycle (g/mi) | Electric Vehiclec Share | 2017a(g/mi) | 2025 Target (g/mi) | Change, 2017–2025 | |
| Car | 223 | 154 | –31% | 19 | 17 | 6.5% | 240 | 198 | –18% |
| Light truck | 306 | 213 | –30% | 24 | 24 | 2.5% | 330 | 271 | –18% |
| Average | 262 | 182 | –31% | 21 | 20 | 4.6% | 283 | 233 | –18% |
a MY 2017 vehicles have 10 g/mi air conditioning and 3 g/mi off-cycle credits for cars; 17 g/mi air conditioning and 7 g/mi off-cycle credits for light trucks.
b Air conditioning credits include 6.0 g/mi for efficiency and 13.8 g/mi for refrigerant leakage for cars; 7.2 g/mi for efficiency and 17.2 g/mi for refrigerant leakage for light trucks.
c Electric vehicle shares in 2025 from regulatory agency March 2020 central case analysis. Electric vehicles, based on regulatory provisions, are multipliers and counted as 0 g/mi for battery electric vehicles (and to extent they are powered by electricity for plug-in hybrid electric vehicles).
Table 3.3 outlines a set of assumptions that translate overall regulatory CO2-emission requirements—incorporating deployment of technology credits and electric vehicles—to the test-cycle combustion vehicle CO2 improvements to meet the benchmark 3.7% annual reduction emission levels by 2025. As the agencies have assumed, the maximum allowable air conditioning credit use is included at 21 g CO2/mi. In addition, following regulatory developments and automaker trends, off-cycle credit usage is estimated to increase to 20 g CO2/mi by 2026. The framework terms of the July 2019 agreement by California and four automakers include the expanded use of off-cycle credits of up to 15 g/mi from the off-cycle menu and additional permits beyond the menu (CARB, 2019). The March 2020 standards also streamline processes for technology credits, and recent trends and analysis support the feasibility of automakers achieving these credits (EPA, 2019; Lutsey and Isenstadt, 2018). Electric vehicles, based on the Advanced Vehicle Technology credit provisions, are counted as 0 g/mi and with applicable multipliers that vary by technology and model year. The national share of new vehicles that are plug-in electric vehicles is assumed to be 5% in MY 2025. Consistent with recent trends, this electric share is above the regulatory requirements but is well below many automakers’ public announcements (as discussed more below). After accounting for the various technology credits, more than half of benchmark 2025 CO2-emission reduction (18%, versus the overall 31% compared to 2017) would come from test-cycle vehicle efficiency improvements.
Table 3.4 summarizes the test-cycle CO2 emission levels, test-cycle fuel economy, and consumer label fuel economy levels estimated for MY 2017 and the 2025 benchmark for each of the five vehicle classes. The table shows values only for the combustion vehicles (i.e., the 99% in 2017 and assumed 95% in 2025 of vehicle sales that
TABLE 3.4 Combustion Vehicles’ 2017 and Benchmark 2025 CO2 and Fuel Economy by Class
| Class | MY 2017 | MY 2025 | 2017–2025 Change | |||||
|---|---|---|---|---|---|---|---|---|
| Test CO2 (g/mi) | Test MPG | Label MPG | Test CO2 (g/mi) | Test MPG | Label MPG | CO2 Emissions | Fuel Economy | |
| Small car | 212 | 42 | 32 | 194 | 46 | 35 | –9% | 10% |
| Medium car | 274 | 32 | 25 | 206 | 43 | 33 | –25% | 33% |
| Crossover | 269 | 33 | 25 | 220 | 40 | 31 | –18% | 22% |
| Sport utility vehicle | 336 | 26 | 20 | 265 | 34 | 26 | –21% | 27% |
| Pickup | 376 | 24 | 18 | 312 | 29 | 22 | –18% | 21% |
| Total | 283 | 31 | 24 | 233 | 38 | 29 | –18% | 22% |
NOTE: CO2 = carbon dioxide; MPG = miles per gallon.
SOURCE: Committee analysis of data sets from NHTSA/EPA (2020).
are not plug-in electric). Table 3.4 accounts for the use of off-cycle, air conditioning, and electric vehicle crediting as in Table 3.3. As one example from the table, the average crossover vehicle would see its consumer label fuel economy improve from 25 MPG in 2016 to 31 MPG in 2026, for a 22% fuel economy increase, approximately the same as the fleet average increase across all five classes. The annualized test-cycle CO2 reduction would be 2.4%, and the annualized fuel economy increase would be 2.5%, for all combustion vehicles over 2017–2025.
3.7 TECHNOLOGY PACKAGES IN 2025
The above analysis provides the fleet-level and class subdivided CO2 emissions and fuel economy context that is expected to impact the technology packages that will be commonplace in 2025. Examining the regulatory analysis associated with the last several proposed and adopted regulations provides examples of efficiency packages, including technology pathways with turbocharging, naturally aspirated engines, and hybridization, and their approximate costs.
Technology packages for two of the five vehicle classes, medium cars and SUVs, are summarized. Similar packages are available in the other vehicle classes. In each case, technology packages that are expected to play prominently in reaching the CO2 and efficiency benchmarks above are shown, including with agency estimates of the overall CO2 emission-reduction benefit and technology cost. Technology package details are based on the EPA (2016, 2017a–d) and NHTSA/EPA (2018, 2020) regulatory files.
For cars, as indicated above, 2017 models typically have variable valve timing (62% of 2017 sales) and 6-speed transmissions (53%). There are many other technologies (e.g., turbocharging 30%, direct injection 22%, variable valve lift 22%, stop-start 14%, and road load technologies) that are also increasing in share in new vehicles. The regulatory agency analyses of potential future-year standards confirms that many of the lower-percentage technologies in Figure 3.1 can be expected to comprise a larger share of new vehicles in 2025.
The above benchmark analysis showing high fuel economy, mass market vehicles indicates that combustion cars could reduce CO2 emissions by 18% from 2017 to 2025 (see Table 3.2). The agencies’ technology evaluations, as illustrated in Table 3.5 for medium cars, provide an estimation of the technologies that can help meet those emission-reduction levels. Technology packages with greater and lesser emission reduction (ranging from 17% to 21%) are shown. Various companies have deployed some of the technologies already to varying degrees, and often many of the technologies are implemented together during vehicle redesign or new powertrain development cycles. Also, as indicated, the data are taken from NHTSA and EPA analyses to show differences in how they assembled and evaluated the technology effectiveness and cost of the packages. Based on these packages and the 18% CO2-reduction 2025 benchmark, a typical cost increase for medium cars from 2017 to 2025 could be approximately $800 per vehicle. For context, $800 is approximately 2% of the average cost of a reference medium car from MY 2017.
TABLE 3.5 Technology Package CO2-Reduction and Associated Cost for Medium Car Class to Obtain a 17% to 21% Reduction in Test-Cycle Fuel Economy from 2017 to 2025
| Analysis | Test-Cycle CO2 and Fuel Consumption Reduction | Incremental Cost per Vehicle (2018$) | Technology Package to Meet the Required Improvement in CO2 Emissions and Fuel Consumption |
|---|---|---|---|
| EPA | 17.3% | $567 | Engine friction reduction, low rolling resistance tires 20%, improved accessories 2, aerodynamic 20%, mass reduction 10% |
| NHTSA | 19.1% | $798 | Rolling resistance 20%, 10-speed transmission, aerodynamic 15%, mass reduction 7.5%, variable valve lift |
| NHTSA | 20.8% | $1,119 | Rolling resistance 20%, 10-speed transmission, aerodynamic 15%, mass reduction 7.5%, variable valve lift, direct injection |
| EPA | 21.0% | $788 | Engine friction reduction, low rolling resistance tires 20%, improved accessories 2, aerodynamic 20%, mass reduction 10%, 10-speed transmission |
SOURCE: NHTSA rulemaking analysis from original and amended standards (NHTSA/EPA, 2020).
TABLE 3.6 Technology Package CO2-Reduction and Associated Cost for SUV Class to Obtain a 21%–23% Reduction in Test-Cycle Fuel Economy from 2017 to 2025
| Analysis | Test-Cycle CO2 and Fuel Consumption Reduction | Incremental Cost per Vehicle (2018) | Technology Package to Meet the Required Improvement in CO2 Emissions and Fuel Consumption |
|---|---|---|---|
| EPA | 20.9% | $995 | Engine friction reduction, low rolling resistance tires 20%, improved accessories 2, aerodynamic 20%, mass reduction 10%, 10-speed transmission, direct injection, turbocharger (18 bar) |
| EPA | 22.5% | $1,143 | Engine friction reduction, low rolling resistance tires 20%, improved accessories 2, aerodynamic 20%, mass reduction 10%, 10-speed transmission, direct injection, turbocharger (18 bar), variable valve lift |
| NHTSA | 22.9% | $1,308 | Rolling resistance 20%, 8-speed transmission, aerodynamic 15%, mass reduction 5%, variable valve lift, turbocharging (18 bar); added to original vehicle with variable valve timing, direct injection |
SOURCE: NHTSA rulemaking analysis from original and amended standards (NHTSA/EPA, 2020).
For the SUV class, baseline 2017 models typically have variable valve timing (79% of 2017 sales) and 6-speed transmissions (51%). There are many other technologies (e.g., direct injection 37%, cylinder deactivation 22%, start stop 20%, variable valve lift 19%, turbocharging 18%, and road load technologies) that also have significant shares. The agency analyses of potential future-year standards indicate that many of the lower-percentage technologies in Figure 3.1 can be expected to comprise a larger share of new vehicles in 2025.
The above benchmark analysis indicates that combustion vehicles in the SUV class could reduce CO2 emissions by 21% from 2017 to 2025 (see Table 3.4). Table 3.6 shows agencies’ technology evaluations of technology packages around that level of emission-reduction levels. Packages with a similar emission-reduction of 21% to 23% are shown, as some companies have deployed more or less of the technologies already, and often many of the technologies are implemented together during vehicle redesign or new powertrain development cycles. Based on these packages and the 21% CO2-reduction 2025 benchmark, a typical cost increase for SUVs from 2017 to 2026 could be approximately $1,000–$1,300 per vehicle. For context, $1,000–$1,300 is approximately 2%–3% of the average cost of a reference SUV from MY 2017.
Although there are uncertainties about the precise technologies that will be deployed, their costs, their consumer interest, and their ultimate technology uptake through 2026, the regulatory agencies’ modeling of the expected uptake provides a reasonable range of potential outcomes for the U.S. LDV market. These agencies’ projected percentages for the above-discussed technologies are summarized in Box 3.1. The committee notes that the agencies’ projected market shares are not a forgone conclusion nor do they offer a precise baseline upon which the report’s estimates are based. Notably, the auto industry and consumer decisions are based on complex factors beyond minimizing the regulatory cost of compliance. For example, many technologies have mutual benefits (e.g., turbocharging with moderate engine downsizing increases acceleration and efficiency) and trade-offs (e.g., engine downsizing alone increases efficiency and reduces acceleration). Technologies also may align differently with automakers branding or market positioning, such as branding for eco-friendliness, high power, aerodynamics, or innovative technology. Technology effects can have different market acceptance and profitability implications, which are not incorporated in regulatory cost minimization analysis, that influence their deployment.
3.8 INTERNATIONAL MARKET AND REGULATIONS
There are broader global considerations for automakers’ technology deployment decisions. Many companies are actively developing global vehicle platforms that can more rapidly deploy engine or transmission technologies at higher annual volumes across continents. This could increase the likelihood that technologies that are being widely deployed in Europe and Asia are also deployed in the United States, even if the technologies are beyond what is minimally needed for compliance. In addition to creating global platforms to reduce engineering and supply chain costs, automakers are making technology decisions and investments that go far beyond regulatory compliance for 2025–2026 (Lutsey, 2018).
SOURCE: Lutsey (2018).
This is especially important in the case of advanced technologies—for example, with electric vehicle technologies, about which many automakers have announced long-term global technology strategies.
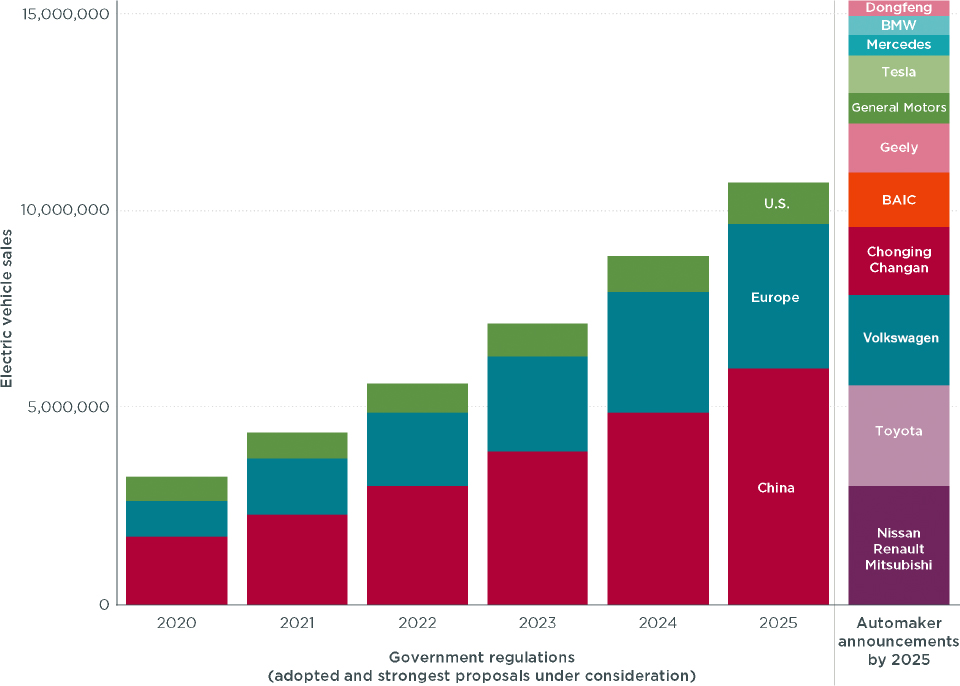
In light of broader policy, market, and technology developments, the global automotive industry is supplementing its combustion efficiency investments with major plans for high-volume electric vehicle production. Many manufacturers have announced that they will greatly increase their electric vehicle deployment within the next 5 years in the United States and elsewhere. Tallying the company announcements indicates that automotive investments surpassing $300 billion are under way, amounting to more than 15 million new plug-in electric vehicle sales annually, by 2025 (Lienert and Chan, 2019; Lienert et al., 2019; Lutsey, 2018). As shown in Figure 3.5, the electric vehicle requirements would be 50% greater than the regulatory requirements in China, Europe, and North America. International markets and regulatory aspects, and their influence on the U.S. vehicle fleet, are discussed further in Chapters 11 and 12, respectively.
3.9 REFERENCES
CARB (California Air Resources Board). 2019. “California and Major Automakers Reach Groundbreaking Framework Agreement on Clean Emission Standards.” https://ww2.arb.ca.gov/newscalifornia-and-major-automakers-reach-groundbreaking-framework-agreement-clean-emission.
EPA (U.S. Environmental Protection Agency). 2016. “Proposed Determination on the Appropriateness of the Model Year 2022–2025 Light-Duty Vehicle Greenhouse Gas Emissions Standards Under the Midterm Evaluation.” https://www.federalregister.gov/documents/2016/12/06/2016-29255/proposed-determination-on-the-appropriateness-of-the-model-year-2022-2025-light-duty-vehicle.
EPA. 2017a. “Final Determination on the Appropriateness of the Model Year 2022–2025 Light-Duty Vehicle Greenhouse Gas Emissions Standards Under the Midterm Evaluation.” https://www.epa.gov/sites/production/files/2017-01/documents/420r17001.pdf.
EPA. 2017b. “EPA Technical Projects to Inform the Midterm Evaluation.” https://www.epa.gov/regulations-emissions-vehicles-and-engines/midterm-evaluation-light-duty-vehicle-greenhouse-gas-ghg#technical-projects.
EPA. 2017c. “EPA Publications Informing the Midterm Evaluation.” https://www.epa.gov/regulations-emissions-vehicles-and-engines/midterm-evaluation-light-duty-vehicle-greenhouse-gas-ghg#publication.
EPA. 2017d. “Optimization Model for Reducing Emissions of Greenhouse Gases from Automobiles [OMEGA].” (Version v1.4.56.) https://www.epa.gov/regulations-emissions-vehicles-and-engines/optimization-model-reducing-emissions-greenhouse-gases.
EPA. 2020. The 2019 EPA Automotive Trends Report: Greenhouse Gas Emissions, Fuel Economy, and Technology since 1975. EPA-420-R-19-002. March.
EPA. 2021. “Download Fuel Economy Data.” https://www.fueleconomy.gov/feg/download.shtml.
German, J. 2018. “How Things Work: OMEGA Modeling Case Study Based on the 2018 Toyota Camry.” International Council on Clean Transportation. https://theicct.org/publications/how-things-work-omega-modeling-case-study-based-2018-toyota-camry.
Lienert, P., and C. Chan. 2019. “Investment in Electric Vehicles.” Reuters. September 1. https://graphics.reuters.com/AUTOS-INVESTMENT-ELECTRIC/010081ZB3HZ/INVESTMENT.jpg.
Lienert, P., N. Shirouzu, and E. Taylor. 2019. “Exclusive: VW, China Spearhead $300 Billion Global Drive to Electrify Cars.” Reuters. January 10. https://www.reuters.com/article/us-autoshow-detroit-electric-exclusive/exclusive-vw-china-spearhead-300-billion-global-drive-to-electrify-cars-idUSKCN1P40G6.
Lutsey, N. 2018. Modernizing Vehicle Regulations for Electrification. International Council on Clean Transportation. https://theicct.org/publications/modernizing-regulations-electrification.
Lutsey, N., and I. Isenstadt. 2018. How Will Off-Cycle Credits Impact U.S. 2025 Efficiency Standards? International Council on Clean Transportation. https://theicct.org/publications/US-2025-off-cycle.
NHTSA/EPA (National Highway Traffic Safety Administration and U.S. Environmental Protection Agency). 2018. “2018 NPRM for Model Years 2021–2026 Passenger Cars and Light Trucks. Compliance and Effects Modeling System.” https://www.nhtsa.gov/corporate-average-fuel-economy/compliance-and-effects-modeling-system#compliance-and-effects-modeling-system-downloads.
NHTSA/EPA. 2020. “2020 Final Rule for Model Years 2021–2026 Passenger Cars and Light Trucks. Compliance and Effects Modeling System.” https://www.nhtsa.gov/corporate-average-fuel-economy/compliance-and-effects-modeling-system#compliance-and-effects-modeling-system-downloads.


