
5
Battery Electric Vehicles
5.1 INTRODUCTION
Motivated by global environmental pressures calling for reduced tailpipe emissions and reduced dependence on petroleum as a source of energy for ground transportation, most automakers have been working for decades on the development of electrified powertrain systems with zero or ultra-low tailpipe emissions. Recent advances in electric drive technologies and battery technologies have made it possible for vehicle manufacturers to commercially deploy battery electric vehicles (BEVs). Globally, electric vehicle (EV) growth surpassed 7 million sales from 2010 through 2019, which was about twice as fast as initial hybrid vehicle growth from 2000 through 2009 (Cui et al., 2020). Currently, market penetration of plug-in electric vehicles (PEVs) has been limited to about 2% in the United States through 2019. To make further progress and move from early adopters to mainstream consumers, EVs will need to overcome the barriers of limited model availability, relatively high cost compared to conventional vehicles, relative convenience of charging versus gasoline refueling, and consumer awareness.
The assumption throughout the chapter is that vehicle electrification improves fuel economy (e.g., in hybrid electric vehicles [HEVs] and plug-in hybrid electric vehicles [PHEVs]), and/or eliminates the use of petroleum-based fuels (e.g., BEVs). If full fuel cycle emissions per mile are considered, the assumptions are more complex and depend upon the upstream emissions of the charging electricity source. When and where electricity is generated with low carbon sources, emissions per mile are significantly reduced relative to an internal combustion engine vehicle (ICEV). However, when and where electric systems depend upon high emitting generation facilities, the emission benefits are reduced. In 2025–2035, the committee anticipates that the U.S. grid will continue to work toward net-zero emissions, which will drive a decrease in total emissions for electrified vehicles. Life cycle emissions from EVs are summarized in Box 5.1, with additional charging and fuel aspects discussed in Section 5.4 and in Chapter 10.
At the core of all electrified powertrains is the electric drive consisting of an electric motor, an inverter, and an electronic controller and, of course, the battery. The electric drive is also critical in HEVs, discussed in Chapter 4, and fuel cell vehicles, which are the subject of Chapter 6. A key objective of this chapter is to explore technologies impacting the size, weight, efficiency, and cost of the electric propulsion system components for 2025–2035. While battery technology is still advancing on multiple fronts to enhance performance and reduce cost (from battery chemistry, to packaging and manufacturing), electric drive technology is relatively mature and has been greatly optimized over the years to achieve the current impressive performance (power and torque densities and efficiency). There are, however, several opportunities in both the motor and power electronics areas that appear
promising for reducing the electric drive cost and weight and further enhancing drive efficiency, which would ultimately translate into increased electric range and energy savings. Section 5.2 reviews the state of the art in electric drive technologies and explores the potential impact of new opportunities.
The cost of battery technology will be a key determinant for BEVs to reach cost parity with combustion vehicles within the next decade. Section 5.3 explores the myriad options for automotive battery materials and cell packing, and assesses their relative cost, efficiency, and in the case of beyond-lithium technologies, possible deployment timelines. The section also describes battery management systems (BMS), thermal effects on battery lifetime, and safety principles. Battery performance, life cycle, and real-world battery usage are also described. Approaches to overcome current limitations, improve performance, improve customer acceptance, and reduce cost are discussed within the battery section as well. After summarizing cost reduction opportunities in each technology section, overall vehicle cost estimates that are expected to be realized in 2025–2035 are provided.
5.2 THE ELECTRIC DRIVE
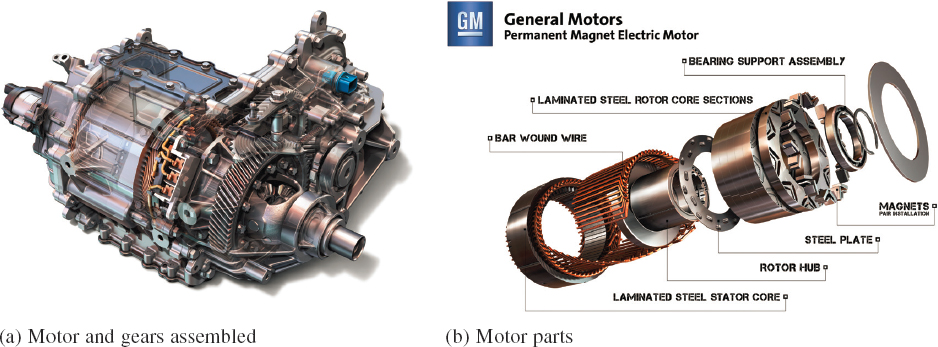
Several electric drive technologies, including brush and brushless direct current (DC) and alternating current (AC) motors, have been investigated over the years for vehicle propulsion. However, thanks to its high efficiency and power density (attributes critical for achieving desirable range in electrified vehicles), the propulsion drive of choice used by most major automakers has been the brushless permanent magnet synchronous motor (PMSM) with rare-earth (RE) magnets (NdFeB) (Figure 5.1). General Motors (GM), Ford, Toyota, Nissan, Tesla, and Honda have used such motors for almost all electrified vehicles produced today.
The PMSM consists of a stationary part (stator) fitted with 3-phase copper windings placed in its slotted structure and a rotating member (rotor) fitted with permanent magnets assembled around its peripheral. The stator windings carry 3-phase AC and the rotor magnets produce the magnetic field. It is the interaction between the stator currents and the magnetic field that is responsible for producing the desired propulsion torque.
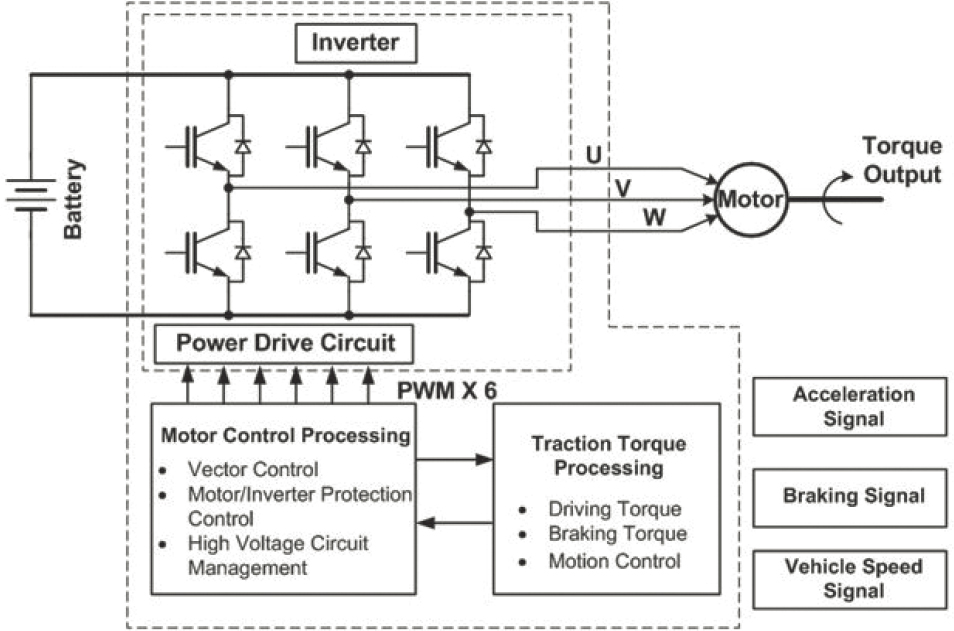
Most automakers use a 3-phase inverter with sinusoidal control to convert the battery’s DC voltage to alternating 3-phase voltage, and then drive 3-phase sinusoidal currents into motor windings, as shown in Figure 5.2. The inverter uses six electronic semiconductor switches mostly of the insulated-gate bipolar transistor (IGBT) type. The role of the electronic controller is to send appropriate signals to the electronic switches to switch the currents on and off at the appropriate timing in response to information obtained by current sensors. This controls the current level and shape (sinusoidal) to the demanded level.
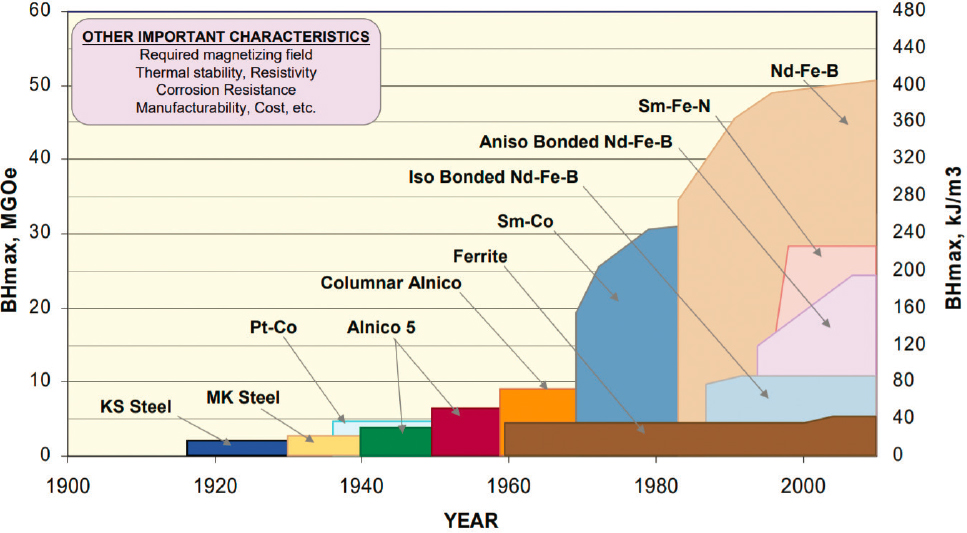
Permanent magnets come in various magnetic strength levels (measured by their maximum energy product) based on their material composition, as shown in Figure 5.3. NdFeB, an alloy of neodymium, iron, and boron, is the strongest and most widely used RE magnet. Strong magnets produce higher magnetic field, hence requiring
SOURCE: (a) Chevrolet Pressroom (2016); (b) Chevrolet Pressroom (2011).
SOURCE: Rajashekara (2013).
SOURCE: Constantinides (2011).
less motor current for a given torque. This results in less ohmic loss in the motor, and thus higher drive efficiency and power density.
However, the above analysis and situation has been disrupted by the unstable cost of RE magnets owing to Chinese dominance of neodymium magnet production based on their control of much of the world’s sources of RE mines (Vekasi, 2019; China Power Team, 2020). The prices jumped from $80/kg in 2010 to $460/kg in 2011. Owing to deep concerns about long-term availability of these materials, many users started to look for alternatives. There has been an intensive research effort focusing on developing technologies aimed at the reduction or elimination of RE magnets in motors (Ames National Laboratory, 2012). The effort to eliminate RE magnets explored two possibilities (Buress, 2016):
- Maintaining the brushless PMSM motor type but developing advanced high-energy non-RE magnets (AlNiCo [Ley, 2016], ferrite, or dysprosium-free RE magnets) to replace the NdFeB magnets having the super-expensive dysprosium content currently used; and
- Reconsidering other non-permanent magnet motor types (e.g., induction motors, switched reluctance motors, synchronous reluctance motors, and wound field excited motors) but incorporating innovative structures/assemblies, and effective thermal and noise management techniques as lower cost alternatives (El-Refaie, 2016; Ludois, 2015; Omekanda, 2013).
It should be understood, however, that moves to replace RE magnets with lower-energy magnets would lead to lower motor efficiency and/or increase motor size and weight, which would have a negative impact on energy consumption and range depending on the approach taken. In the meantime, the price of NdFeB-RE magnets has come back down to reasonable levels of $50–$60/kg in 2020, encouraging automakers to stay the course of brushless motors equipped with RE magnets. The new developments resulting from the above-mentioned research could be revisited and pursued for commercial implementation if RE magnet supply channels are disturbed again (Sekulich, 2020).
The following sections provide a summary of the current status of motors and power electronics, as well as research efforts and ongoing innovation in the field that could have an impact on electrified vehicle energy consumption and electric-only range.
5.2.1 Motors—Current Status and Future Developments
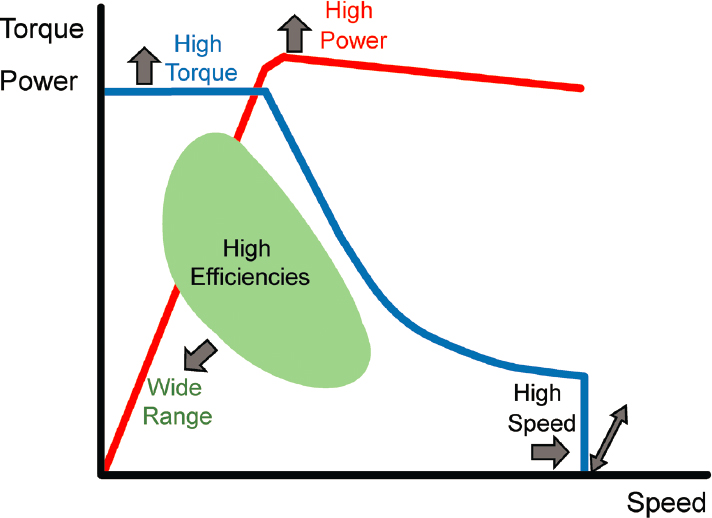
Electric motor technology is a mature one; however, intensive efforts have been made over the past decade to optimize the motor design in order to meet the specific needs of automotive propulsion, as depicted by the torque-speed characteristic chart in Figure 5.4. These are as follows:
- High motor torque at low motor speeds, for adequate vehicle acceleration and hill climbing;
- High maximum motor power, for high-speed cruising;
- Wide speed range, 3–4 times base speed, at the maximum motor power level, for cruising performance;
- High torque and power density, for low motor weight and longer range;
- High efficiency over the most frequently used range of operation, for longer E-range;
- Reasonable cost (parity with internal combustion engines [ICE]), for affordability;
- Higher reliability, to reduce maintenance cost in view of the exposure to road G-forces; and
- Low torque ripple, for low acoustic noise.
To achieve these requirements, most recent production systems incorporate special materials and advanced manufacturing techniques into their motor designs. For example, to minimize iron loss (hysteresis and eddy current loss) at high speeds (high frequencies) and high torque (high flux density) motors use special thin (0.25 mm) electrical steel laminations featuring high flux carrying capability and low loss-factor to improve efficiency (Thanh and Min-Fu, 2017). Also, to achieve the high torque without excessive stator heating, flat wire conductors are being used instead of the traditional round wires for the stator windings. These provide for a higher stator slot fill and thereby minimize ohmic loss and maximize efficiency. Furthermore, a new hairpin winding manufacturing
technique is used to form the wire in a way that minimizes the size of the windings overhang and connections and further minimizes the motor size, weight, and material cost and maximizes efficiency. See Figure 5.5 for a comparison between the traditional winding and the hairpin approaches.
Also, to achieve a desirable high motor speed (to minimize motor size, which is roughly inversely proportional to motor speed) while maintaining a low total motor cost, a single-stage gearbox with a gear ratio of about 7:1 to 10:1 is being used by most automakers. Increasing motor speed would result in unacceptable levels of the gear
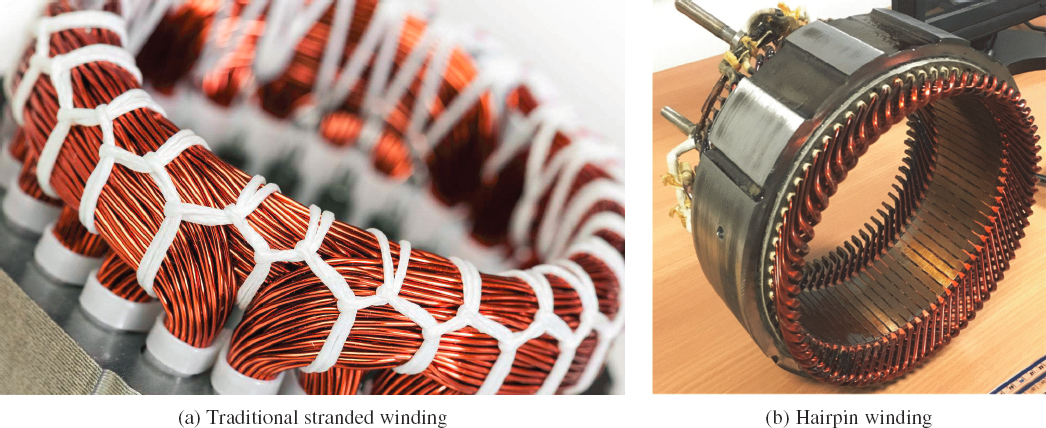
SOURCE: (a) iStock; (b) © 2020 IEEE. Reprinted, with permission, from Liu et al., 2020, Experimental investigation on oil spray cooling with hairpin windings, IEEE Transactions on Industrial Electronics 67(9):7343–7353, doi: 10.1109/TIE.2019.2942563.
TABLE 5.1 Propulsion Motor Performance Status Summary—Motor Only
| Application | Power (kW) |
Gear Ratio | Motor Only Weighta (kg) |
Power Densitya (kW/kg) |
Max Motor Torque (Nm) |
Torque Densitya (Nm/kg) |
Motor Only Costa ($) |
Specific Costa ($/kW) |
|---|---|---|---|---|---|---|---|---|
| GM Bolt | 150 | 7.05 | 43 | 3.5 | 360 | 8.4 | 714 | 4.8 |
| Tesla Model 3 Rear | 188 | 9.03 | 45 | 4.2 | 380 | 8.4 | 750 | 4.0 |
| BMW i3 | 125 | 9.7 | 31 | 4.0 | 250 | 8.1 | 496 | 4.0 |
a Estimated.
SOURCE: Committee-generated data, partially based on motor weight and cost data presented by Munro and Associates to the committee on September 24, 2019.
audible noise at high gear ratios as well as an increase in motor frequency and iron loss, which would impact the efficiency negatively. Furthermore, to protect the magnets at high rotor speeds, a rotor cross-section with deep slots is used to house the RE magnets and provide adequate support and robustness against centrifugal forces. This construction is typically known as buried or interior magnet construction.
Examples for the performance of some of the brushless PMSMs used in BEVs deployed in the market today are given in Table 5.1. This represents the state of the art in propulsion motor technology to date. While all use RE permanent magnets in their design, the BMW i3 motor is designed to have an improved performance at higher speed using a special rotor construction which contributes to an additional torque component (reluctance torque). This type of construction is known as hybrid PM-reluctance motor. Comparing the three vehicles in Table 5.1 reveals that the motor power density and specific cost, which are based on the motor weight and cost without the gearbox, improve with increasing the gear ratio. Adding the gearbox weight and cost, which increase with the gear ratio, will offset this improvement but still show cost improvement, as shown in Table 5.2.
For high-performance vehicles, the use of two motors simultaneously helps achieve the desirable 0–60 miles per hour acceleration performance. For example, the Tesla Model 3 has a PMSM for the rear axle and an induction motor for the front. Using the combination of induction motor and PMSM, as opposed to using the same type motor for front and rear, results in an improved overall efficiency by relying on the induction motor at high speeds and turning the PMSM off. The magnetic field and its associated loss in an induction motor can be easily controlled, unlike in PMSMs. Mechanically disconnecting the PMSM via a clutch in the two-motor system may yield further efficiency improvements by avoiding the substantial magnetic losses associated with the permanent magnet’s constant magnetic field at high speeds. Of course, there are trade-offs between clutch weight and cost versus efficiency gain, which need to be evaluated. Current motor research points to several areas that could potentially impact future propulsion motor performance and cost in the 2025–2035 time frame:
- New magnet material (ARPA-E, 2015): Ames Laboratory is developing a new class of permanent magnets based on the more commonly available element cerium to replace the scarcest and most expensive RE element, dysprosium, which is used in today’s RE magnets for high temperature stability (dysprosium comprises ∼3%–6% by weight of NdFeB magnets). Cerium is four times more abundant and
TABLE 5.2 Propulsion Motor Performance Status Summary—Motor with Gearbox
| Application | Power (kW) |
Gear Ratio | Motor + Gear Weighta (kg) |
Power Densitya (kW/kg) |
Max Motor Torque (Nm) |
Output Torque Densitya (Nm/kg) |
Motor + Gear Costa ($) |
Specific Costa ($/kW) |
|---|---|---|---|---|---|---|---|---|
| GM Bolt | 150 | 7.05 | 59 | 2.5 | 360 | 43.0 | 895 | 6.0 |
| Tesla Model 3 Rear | 188 | 9.03 | 71 | 2.6 | 380 | 48.3 | 1044 | 5.6 |
| BMW i3 | 125 | 9.7 | 49 | 2.5 | 250 | 49.5 | 703 | 5.6 |
a Estimated.
SOURCE: Committee generated data, partially based on motor weight and cost data presented by Munro and Associates to the committee on September 24, 2019.
TABLE 5.3 Potential Impact of Future Motor Technologies on Various Vehicle Classes
| BEV 300 Motor Technologies | Vehicle Class (Power, Torque) | Technology Cost by Class | Motor Total Weight, Cycle Efficiency |
|---|---|---|---|
|
Small (110 kW, 142 Nm) | $ 531 | 43 kg, 90.5% |
| Medium (180 kW, 233 Nm) | $ 868 | 67 kg, 91% | |
| Crossover (150 kW, 194 Nm) | $ 724 | 57 kg, 90.7% | |
| SUV (220 kW, 285 Nm) | $ 1,061 | 81 kg, 91.2% | |
| Truck (250 kW, 324 Nm) | $ 1,206 | 92 kg, 91.5% |
- significantly less expensive than dysprosium. The result is a cost-effective cerium alloy of neodymium, iron, and boron co-doped with cerium and cobalt, with properties that are competitive with traditional sintered magnets containing dysprosium. With magnet cost representing roughly 20% of motor cost (approx. $150 at $75/kg), reducing magnet cost results in a substantial motor cost reduction if RE magnet prices climb to the levels seen in 2011 ($480/kg). Toyota has also announced development of a neodymium-reduced (50%), heat-resistant cerium magnet, stating that it will likely be utilized in power steering applications in the first half of the 2020s, and in propulsion motor applications within the next 10 years (Toyota USA Newsroom, 2018). It is estimated that this technology could reduce the magnet cost by approximately 30%.
- Higher motor speed: Many of the automakers are actively developing high-speed motors. However, because of the negative impact on the gearbox weight and cost, it is not clear what would be the optimum motor speed/gear ratio. To illustrate the point, doubling the speed of the GM Bolt motor from its current 8,800 rpm to 17,600 rpm for the same output power would result in a motor with half the active length, weight, and active material cost. While the gear weight and cost are expected to increase, doubling the speed could result in a total (motor + gear) weight increase of approximately 1 kg but a total cost reduction of approximately $240. This decrease in cost is largely owing to a decrease in required RE magnet material, which is by far the most expensive part of the motor. Some of the challenges with this approach include noise, as well as reliability issues stemming from increasing the gear ratio. One should also keep in mind that operating at higher speed and reduced motor size will also result in a decreased cooling surface, which should be taken into account in sizing the motor cooling system for proper thermal management of the motor.
Table 5.3 provides a summary of estimated potential cost and effectiveness impact of the above technologies by 2025 on the various vehicle classes. The following assumptions were made:
- New cerium-based magnet material to reduce magnet cost by 30% from current prices.
- New gearing with a higher gear ratio of 14:1 instead of the 9:1 assumed in current systems.
From Table 5.2 (current) and Table 5.3 (future) for a medium-size vehicle (Tesla Model 3 rear), one can conclude that there is a potential for weight and cost reduction of approximately 5% and 16%, respectively.
5.2.2 Power and Control Electronics—Current Status and Future Developments
Inverter and controller technologies are also relatively mature, thanks to the industry’s sustained efforts aimed at increasing their performance and efficiency while reducing their size and cost (Zhao, 2016a). These efforts include the following:
- Design optimization of the silicon semiconductor IGBT switches: Design for minimum conduction and switching losses, which translate to high inverter efficiency.
- System integration: An example of an effective system integration is the collaborative effort among GM, Oak Ridge National Laboratory, the National Renewable Energy Laboratory, and suppliers, resulting in
TABLE 5.4 Power Density and Cost of Current Inverter Topologies
| Application | Power (kW) | Inverter Weighta (kg) | Power Densitya (kW/kg) | Inverter Costa ($) | Specific Costa ($/kW) |
|---|---|---|---|---|---|
| 17 GM Bolt | 150 | 10.0 | 15.0 | 700 | 4.7 |
| Tesla Model 3 | 188 | 5.5 | 34.1 | 800 | 3.5 |
| BMW i3 | 125 | 19.0 | 6.6 | 1100 | 8.8 |
a Estimated.
NOTE: BMW i3 system has all electronics including the battery charger integrated with the drive motor, resulting in higher numbers compared with the other listed examples.
SOURCE: Committee generated data, partially based on motor weight and cost data presented to the committee on September 24, 2019 by Munro and Associates.
- achieving new higher levels for efficiency and power-density while maintaining a capability for scalability in their next-generation inverter. This was achieved by an innovative packaging in a design, which integrates active components and reduces/eliminates supporting components.
-
High-performance control: The use of advanced high-performance control techniques, such as deadbeat direct torque control with loss observer, further reduces drive loss and enhances drive efficiency. Additional known areas of advanced control focus on the following:
- Sensor (observers) reduction or elimination, with significant cost implications.
- Acoustic and electromagnetic noise reduction.
- Improved reliability (fault tolerance, diagnostics and prognostics).
Examples for the performance of some of the propulsion inverters used in electrified vehicles deployed in the market today are given in Table 5.4. The power electronics in these three vehicles are not listed here together for the purpose of comparison, as they are adapting different integration philosophies in their execution, but rather as a representation of the state of the art of propulsion power electronics. So, while the Tesla Model 3 inverter (power stage, filtering, and controller) is integrated with the motor drive and tapping into its cooling system, the Chevrolet Bolt inverter and controller are housed with the DC/DC converter and power distribution cabling and all necessary cooling lines in a separate box (listed weight and cost does not include DC/DC converter and distribution). The BMW i3 system has all electronics including the battery charger integrated with the drive motor, resulting in higher numbers compared with the other listed examples. The direct connection between the power electronics and electric motor claimed to be responsible for reducing the overall weight of the drivetrain by about 1.5 kg owing to reduced cabling length (Green Car Congress, 2013).
While most automakers still use IGBT power switching devices, including the Chevrolet Bolt and BMW i3, the Tesla Model 3 inverter uses the new, more expensive but more efficient silicon carbide (SiC) devices. SiC devices belong to a new category of power switching devices, known as wide-bandgap (WBG) devices, which have been evolving in recent years and might emerge as an impactful technology for electrified vehicles in the 2025–2035 time frame. There are two types of materials used in WBG device construction: (1) SiC and (2) gallium nitride (GaN). They have the capability to operate at higher voltages (> 600 volts), temperatures (> 200°C), and frequencies (> 1 MHz), and exhibit a 100-fold lower on-resistance (Figure 5.6)—compared with Si-based devices such as the IGBTs currently being used in automotive inverters.
The higher switching speeds (10 times faster) of WBG devices lead to very low switching loss, which along with their low on-resistance (low conduction loss) could eliminate up to 90% of the loss in power-electronic devices. This could result in very high inverter and converter efficiencies (typically on the order of 99% compared to 96% for the Si-based devices). With less energy expended as heat, and the capability to operate at higher temperature, WBG devices require less cooling and smaller heat sinks. This could result in an overall reduced system size, weight, and material cost. Furthermore, with WBG-based devices operating at higher frequencies, smaller inductors and capacitors can be used in power circuits. The inductance and capacitance scale down in proportion to the frequency: a 10-fold increase in frequency produces a 10-fold decrease in the capacitance and inductance. This can result in a substantial decrease in the weight, volume, and cost of typically large and heavy passive components.
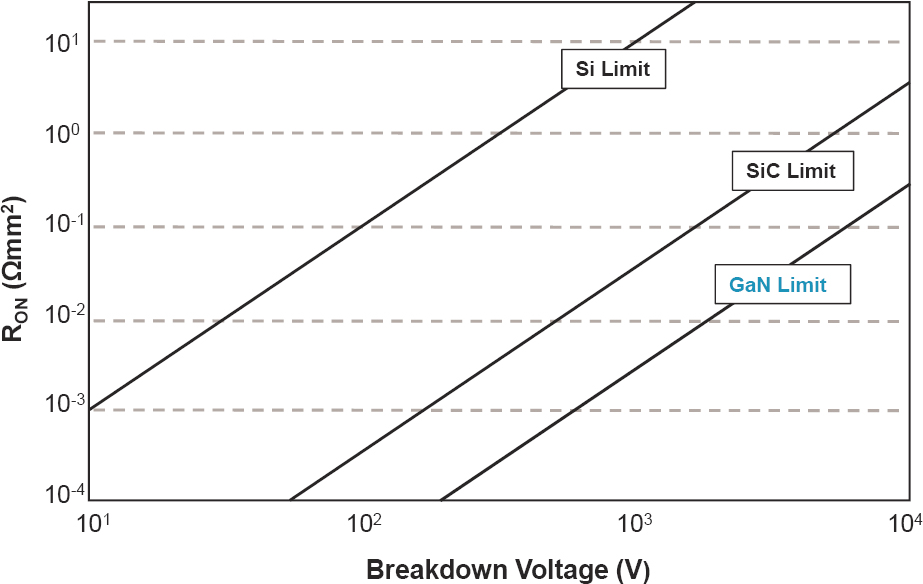
SOURCE: Strydom et al. (2017).
On the other hand, increasing switching frequency may impact the motor iron loss (eddy and hysteresis), which should be a consideration in the motor design and its material selection.
As such, WBG devices have become a focus of current research and are expected to come to fruition in the time frame 2025–2035. Research organizations of automakers and suppliers are active in research to understand the ultra-fast switching of WBG devices and are developing high-frequency circuitry and high-temperature components necessary to sustain and take advantage of WBG devices. Some of these research areas include WBG device characterization, as well as evaluating converter and inverter technologies. Inverter efficiencies of more than 99% have been achieved in a GM program (Jaksic, 2019). It should be noted that currently the cost of WBG devices is higher than silicon devices, but they are expected to eventually be competitive as manufacturing capabilities (e.g., yield, wafer size, etc.) improve and their market grows.
GaN offers some advantages versus SiC. In addition to its lower on-resistance (low conduction loss; see Figure 5.6), there is evidence that GaN also exhibits lower switching loss at high frequencies (Figure 5.7). It should be noted that while both SiC and GaN technologies still need further improvements (PowerAmerica, 2018), SiC-based devices are further ahead in their development than GaN devices, as they were the subject of years of targeted RD&D for aerospace applications, which could afford the high cost of SiC. Most of the WBG device investigations to date have used SiC devices in their experimental builds simply because of availability. Another advantage of lateral GaN devices is that a thin layer of active GaN can be grown on silicon, a cheap substrate. Therefore, GaN on Si devices present a potential cost advantage compared to SiC. However, the advancement of GaN devices faces several challenges that must be resolved first before their broad implementation:
- The difference in thermal coefficient of expansion between GaN and Si in GaN on Si devices causes issues at high temperatures which may limit their usage at these temperatures. This led researchers to explore GaN on SiC substrates, both having a similar coefficient of expansion. GaN on SiC is, however, more expensive than GaN on Si and comes close to the cost of the more mature SiC technology.
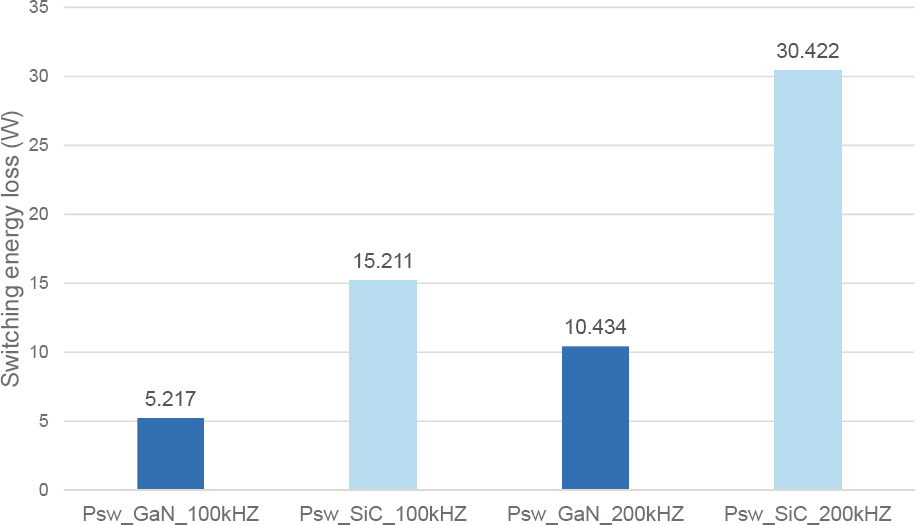
SOURCE: Modified from Xu and Chen (2017).
- Designing a GaN-based device that can withstand high breakdown voltage is a challenge. More established GaN devices utilize a lateral device architecture where the current flow is constrained to a thin section of GaN material. However, higher power applications (e.g., EVs) require higher breakdown voltages and thus more material, making these lateral devices unattractive (Chowdhury and Mishra, 2013). Significantly larger chip sizes would be needed to accommodate this higher breakdown voltage which poses manufacturing challenges. Therefore, researchers are redesigning devices to allow current to pass through the bulk of the GaN material via vertical device architectures. Technical developments needed to realize vertical devices include the production of high-quality GaN substrates and development of reliable selective-area doping processes to control current flow within the device (Hu et al., 2018). Both of these areas are currently priorities for ongoing Advanced Research Projects Agency–Energy (ARPA-E) programs. The ARPA-E Strategies for Wide-Bandgap, Inexpensive Transistors for Controlling High-Efficiency Systems (SWITCHES) program, started in 2013, funds numerous projects to improve the processing of GaN vertical devices and GaN substrates for applications including automobiles. The Power Nitride Doping Innovation Offers Devices Enabling (PNDIODES) program is an extension of SWITCHES focusing specifically on developing selective-area doping processes for GaN power electronics.
While research toward resolving the issues associated with GaN continues, the debate among proponents of GaN versus SiC fills the literature (Boutros et al., 2012; Patterson, 2015; Allan, 2017; Ferdowsi et al., 2017; Green Car Congress, 2017; Guerra, 2017; Slovick, 2017; Transphorm Inc., 2017; Wolfspeed, 2017; Els, 2018; Li, 2018; Business Wire, 2019; Davis, 2019; Semiconductor Today, 2019; Arrow Electronics, 2020; Bakeroot, 2020; Schweber, 2020).
As with motors, an attempt is made here to estimate the potential cost, weight, and efficiency of propulsion inverters assuming that the above discussed technologies have matured for commercial implementation by 2025. These estimates are summarized in Table 5.5 below. The following relatively conservative assumptions are made:
- The baseline for the estimates is today’s Tesla Model 3 inverter, using SiC devices and a high degree of integration as described above; see Table 5.4.
TABLE 5.5 Potential Impact of Future Inverter Technologies on Various Vehicle Classes
| BEV 300 Inverter Technologies | Vehicle Class (Power) | Technology Cost by Class | Inverter Weight, Efficiency |
|---|---|---|---|
|
Small (110 kW) | $ 334 | 2.3 kg, 98.5% |
| Medium (180 kW) | $ 471 | 3.8 kg, 99% | |
| Crossover (150 kW) | $ 412 | 3.2 kg, 98% | |
| SUV (220 kW) | $ 550 | 4.7 kg, 99% | |
| Truck (250 kW) | $ 609 | 5.3 kg, 99% |
- The cost of GaN power switching devices is 25% lower than today’s SiC; this decrease in cost includes the effects of resolving manufacturing issues and increasing production volume.
- The reduced conduction and switching loss (at high switching frequency) will lead to reducing cooling needs by 75%.
- Switching at higher frequency (100 kilohertz) will result in reduced filtering components size, weight, and cost by 75%, particularly for DC/DC converters.
- Natural electronics cost reduction trajectory leads to 25% controller cost reduction.
- Inverter cost includes power stage, cooling and mechanical assembly, filtering, and electronic controller only. It does not include power distribution, DC/DC converter, or charging electronics.
5.2.3 Findings and Recommendation for Motors and Power Electronics
FINDING 5.1: The majority of automakers have converged on using permanent magnet synchronous motors with rare earth magnets as the drive motor for electrified vehicles owing to their superior efficiency, torque, and power density. Although permanent magnet synchronous motors are more costly (approx. 50%–70%) than induction motors, the efficiency gain is important for reducing the costs of the powertrain as a whole.
FINDING 5.2: The industry has converged on the use of a single-stage gearbox for electric propulsion systems, with a gear ratio between 7:1 and 10:1. Increasing the gear ratio to 14:1 in a medium-size vehicle (Tesla Model 3 rear), for example, could potentially lead to a weight and cost reduction of approximately 5% (4 kg) and 16% ($176), respectively. While the cost saving is considerable, the weight reduction is small and would contribute to only an insignificant range increase (< 1 mile).
FINDING 5.3: While the majority of the automakers are still using insulated-gate bipolar transistor (IGBT) power-switching devices in their power electronic circuitry, some are considering the use of wide-bandgap (WBG) devices in their next-generation propulsion systems, owing to their lower loss (only 10% of IGBTs). This could result in boosting inverter and converter efficiencies to 99% (from 96%), while reducing the size and weight of the cooling system components by ~75%. The efficiency gain translates to adding roughly 9–10 miles to a vehicle with a 300-mile range.
FINDING 5.4: There are two types of wide-bandgap devices: silicon carbide (SiC) and gallium nitride (GaN). Most automakers are focusing on SiC owing to its widespread availability. Given the inherent cost advantage of GaN on Si devices compared with SiC devices, GaN on Si could ultimately become the most cost effective among these two competing technologies, provided improvements in GaN device architectures lead to usable performance.
RECOMMENDATION 5.1: The U.S. Department of Energy should continue funding research on advancing gallium nitride on silicon wide-bandgap device technology to help expedite its readiness for the automotive market and advance the practical utilization of its efficient high switching frequency capability.
5.3 BATTERIES FOR EVS
5.3.1 Basic Principles
Today’s EV technology is based primarily on lithium-ion batteries. While the Toyota Prius established a significant market for HEVs using nickel metal hydride batteries, newer Prius models are based on lithium ion as well. All PHEVs and BEVs utilize lithium-ion batteries; to date, lithium ion is the only chemistry that can supply the necessary energy and power density for automotive performance. Lithium-ion batteries are a form of chemical energy storage in which a lithium containing cathode is used in conjunction with a lithium accepting anode, between which lithium ions shuttle back and forth during charge and discharge cycles (Figure 5.8).
The amount of energy stored in the battery is proportional to the voltage differential between the anode and the cathode and the amount of lithium ions that can be moved back and forth. Both parameters are dependent upon the specific active materials used within the battery. Other inactive components within the battery, such as separator, electrolyte, and current collectors, are necessary for the electrochemical cell to operate, but decrease the cell-level energy density on an energy per unit weight or volume basis.
5.3.2 Today’s Performance
Battery performance determines key attributes of vehicle performance. Key metrics of the battery include energy and power density (both gravimetric and volumetric), lifetime, safety, and cost. The cell energy density is the determining factor for driving range and will depend upon the active materials used within the cell, which define the cell voltage and capacity, as well as the inactive materials, which add weight and volume to the battery. The amount of energy stored is proportional to the amount of lithium ions shuttled back and forth in the cell.
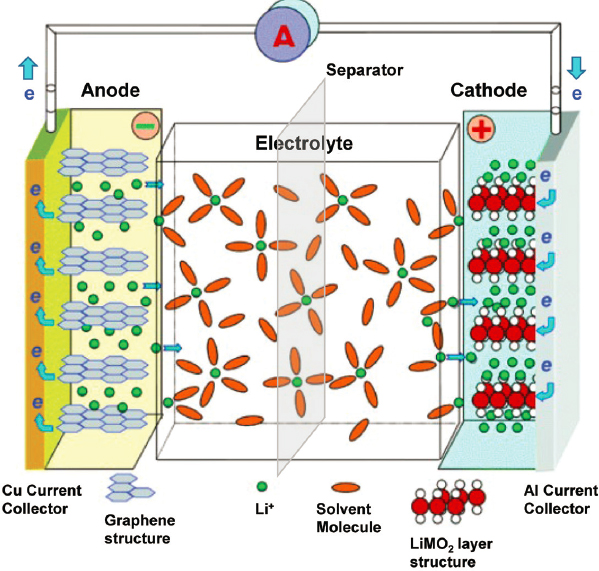
SOURCE: Reprinted with permission from K. Xu, 2004, Nonaqueous liquid electrolytes for lithium-based rechargeable batteries, Chemical Reviews 104(10):4303–4418, copyright 2004 American Chemical Society.
Therefore, the energy density will depend upon the amount of cathode in the cell and the amount of anode required to store the lithium from the cathode. In general, cathodes that contain more usable lithium per unit volume and anodes that can hold more lithium will result in higher energy density.
Power density affects the rate at which the battery can be charged or discharged and plays a large role in automotive performance. The power performance of the cell depends upon the inherent kinetic properties of the active materials (lithium-ion transport properties in the electrolyte and interface layers), and the physical characteristics (thickness, porosity, tortuosity) of the anode, cathode, and separator. Kinetic properties of the materials are temperature dependent and can limit low-temperature performance of the cells. The power (or rate) performance of the active materials is dependent upon the state of charge (SOC), as both the ionic and electronic conductivity of active materials are a function of SOC. Poor conductivity at low states of charge limits the depth of discharge (DOD) at which the cell can be used. Thus, not only do power characteristics of the cell affect driving parameters such as acceleration and charge acceptance during braking but they can also affect the driving range owing to limitations on DOD of the cell.
Cell lifetime can be defined as the time at which the cell capacity falls below a predetermined value (typically 80% of initial capacity), or a cell resistance at which a predetermined capacity cannot be achieved on charge or discharge at a specific rate. These effects may be observed after the battery has undergone hundreds or thousands of cycles or has spent significant amounts of calendar time at high temperature. Failure mechanisms that occur upon cycling or calendar storage will depend upon the specific use case of the battery. For example, BEVs use a wide SOC of the cell over several thousand cycles resulting in true capacity loss and impedance growth. HEVs use a relatively narrow SOC for hundreds of thousands of cycles, with resistance growth being a major issue. Catastrophic failure of the cell can also occur but is more closely linked to cell safety considerations.
The performance of cells across all key metrics will depend upon the application for which they are designed. Table 5.6 summarizes the energy density of some commercial cells used for BEVs.
Safety is a key consideration for all automotive applications and must be considered whenever large amounts of energy are stored in small volumes. Battery safety will depend upon the specific types and amounts of active materials used within the cell, as well as the properties of the inactive components. For example, thin separators which prevent the anode from touching the cathode in a physical short are desirable to improve energy density, but thin separators are also more susceptible to punctures during use, resulting in potential safety hazards. High-quality manufacturing processes are required to eliminate flaws causing internal cell shorting that can lead to a fire. Last, engineering of battery modules and packs with good thermal management can prevent a series of events within the cell from causing thermal runaway and fire. Further discussion of this is given in Section 5.3.5 on thermal management.
5.3.3 Materials and Limitations
Most commercial automotive batteries contain a cathode intercalation material with a graphite-based anode, as well as a separator and an electrolyte. This section will discuss the many different material options for battery
TABLE 5.6 Examples of Energy Densities for Automotive Cells
| Vehicle | Type | Format | Specific Energy (Wh/kg) | Energy Density (Wh/L) |
|---|---|---|---|---|
| Tesla Model 3 | BEV | Cylindrical 21700 | 250 | 721a |
| Nissan Leaf | BEV | Pouch 33Ah | 224 | 460b |
| BMW i3 | BEV | Prismatic 94Ah | 174 | 352c |
| Chevy Bolt | BEV | Pouch 60 Ah | 237 | 444d |
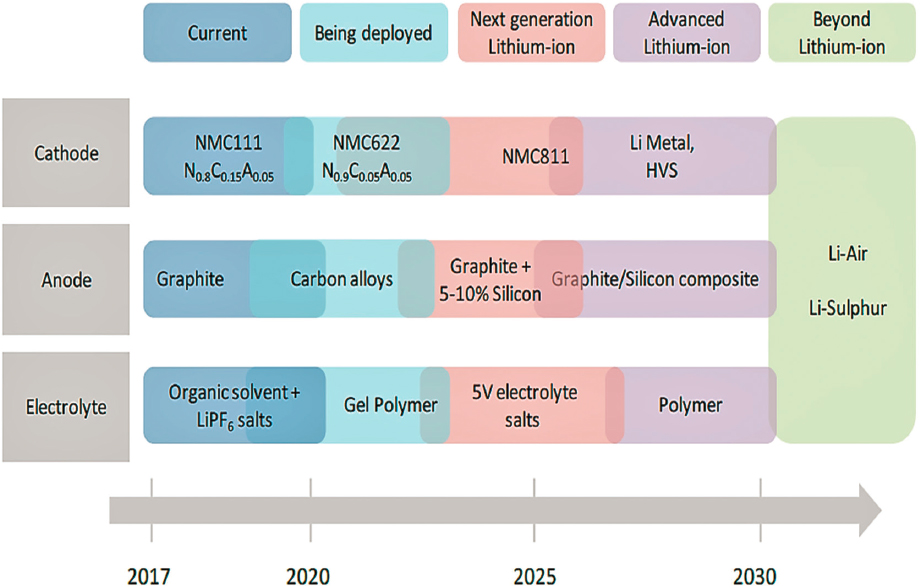
NOTE: HVS = high voltage spinel. The diagram shows the likely beginning of commercialization of a given technology.
SOURCE: Mihet-Popa and Saponara (2018).
components, along with the advantages and disadvantages of each. A summary of the uncertain timeline of battery evolution for each of these components is shown in Figure 5.9. A key focus of the industry is to move toward cheaper cathode materials that include less cobalt.
5.3.3.1 Cathode Materials
The composition of the cathode relates to the energy density of the battery. Commercial cathodes used in lithium-ion batteries are generally intercalation materials, wherein lithium ions can move into (intercalate) and out of (deintercalate) the structure without major phase transitions. Intercalation structures consist of transition metal cations (e.g., Ni, Mn, Co, and Fe) and oxygen or phosphate anions.
The most commonly used cathode materials are layered oxides of nickel, manganese, and cobalt (NMCs), such as LiNi0.33Mn0.33Co0.33O2 (NMC111). These consist of two-dimensional “layers” of transition metals, with lithium ions contained between the layers. The lithium ions can move into or out of the layers with modest changes in the layer spacing of the structure. There are, however, limits to the amount of lithium that can be removed from the structures. At higher voltage, larger quantities of lithium are removed, and phase changes in the material can start to occur (transition metals tend to move into the lithium layer and cause structural rearrangements). These rearrangements are sometimes irreversible and prevent lithium from reintercalating into the structure causing the energy density of the battery to deteriorate. In addition, the phase transitions can be accompanied by a loss of oxygen in the structure causing release of reactive oxide/oxygen to the organic electrolyte, which is a safety concern.
Other structured materials used in lithium-ion batteries include transition metal phosphates (olivines) such as lithium iron phosphate (LiFePO4) or lithium manganese phosphate (LiMnPO4). These materials provide one-dimensional lithium transport through tunnel like channels in the crystal structure. Olivine materials are advantaged over cathodes in that nearly all the lithium can be removed from the structure without irreversible phase changes
or release of oxygen; this structural stability results in long cycle life for these materials. Vehicle applications requiring lower energy densities, such as stop-start or MHEV, can effectively use LiFePO4. Recently, Tesla and CATL announced a “cell to pack” technology that uses low-cost LiFePO4 chemistry as a cathode (Manthey, 2020). Owing to the inherent safety of LiFePO4, cells can be placed directly in packs without the secondary control of using modules within the packs. Elimination of the modules not only reduces cost but also increases system-level energy density owing to lower weight and volume. Although near theoretical capacities can be achieved with olivine materials, they are disadvantaged in energy density owing to the relatively low weight percent of lithium contained in the materials.
Most automakers are expanding the use of higher nickel containing NMCs to improve energy densities. These materials, such as LiNi0.6Mn0.2Co0.2O2 (NMC622) or LiNi0.8Mn0.1Co0.1O2 (NMC811), take advantage of nickel’s 2-electron redox chemistry, increase the amount of lithium that can be cycled in and out of the material, and thus increase the specific capacity and energy density of the cell. NMC811 is primed to potentially be the fastest growing chemistry: its use increased from 1% in 2018 to 12% in early 2020 in China (Statista, 2020a). NMC811 is being deployed by BMW, GM, Nio, and Volkswagen, among other automakers, and suppliers include LG Chem and CATL, a testament to how quickly NMC activity is advancing (LeVine, 2020). Tesla cells also use a high nickel material, LiNi0.8Co0.1Al0.1O2 (nickel cobalt aluminum, NCA), to achieve high energy density. While these materials improve energy density and use a lower amount of expensive and problematic cobalt, they suffer from poorer stability as nickel tends to migrate into the lithium layer more readily than other elements.
For the next several years, automotive battery suppliers and automakers are pushing toward higher nickel materials operated at higher voltage to improve energy density. While NMC111 and NMC532 were common around 2015, NMC622 is the most common cathode chemistry in 2019, and NMC811 has entered commercial vehicle models. Yet, challenges remain regarding material stability to ensure that a target lifetime and safety performance can be met. Solutions for increased stability include the following:
- Doping small amounts of multivalent cations (e.g., Al3+, Si4+, Ti4+, Zr4+, Ta5+) into the crystal structure to stabilize the layered material as more lithium is removed, preventing irreversible phase changes and increasing material stability (Weigel et al., 2019).
- Coating the surface of the cathode particles, which also serves to stabilize the reactive materials at the surface.
- New electrolytes that form passivation layers on the high energy cathode materials can extend lifetime and improve safety.
However, all these approaches increase the cost of the cathode material and thus the overall cost of the lithium-ion cell. Several studies demonstrate the potential of incremental and next-generation NMC technologies in particular to increase cell performance and deliver greater gravimetric (Wh/kg) and volumetric (Wh/L) energy density (Wentker et al., 2019).
5.3.3.2 Anode Materials
Improvements in anode materials, specifically graphite, are focused on fast charge requirements. BEVs need to compete with ICEVs in total travel time for long-distance driving. For travel beyond the range of the BEV, extended recharge times make these vehicles less attractive for consumers. Lithium-ion batteries using graphite intercalation anode materials suffer from lithium plating during charge at high current densities. Plating of lithium metal results in reduced battery lifetimes and safety concerns. The current density limitation of graphite involves both the diffusion rate of lithium within the graphite and the rate of transport across the solid electrolyte interphase (SEI), which is formed owing to reduction of electrolyte on the surface of the anode.
Today’s commercial anodes used in automotive cells are primarily graphite-based. Graphite’s layered structure allows lithium-ion intercalation and deintercalation similar to what occurs in the layered oxide cathodes. Different types of graphite may be used including natural or artificial graphite. Both types have similar specific capacities and performance profiles, but artificial graphite tends to be at least twice as expensive.
Battery performance will be affected by the graphite particle size, morphology, and functional groups, and there are various advantages and disadvantages to using different graphite or carbon materials. For example, amorphous hard carbon anodes exhibit superior lifetime and safety, whereas artificial graphite exhibits higher energy density. Meanwhile, natural graphite is the least cost prohibitive. Any given cell design will have to factor in these anode material trade-offs. Different types of graphites are available in the marketplace. The cheapest material is natural flake graphite, which can provide good electrode density and lower cost cells. However, the material cannot provide good rate or power performance owing to its flake morphology. Natural graphite can be spheroidized and carbon coated to improve the rate performance, while increasing costs. The process also yields a high degree of graphitization, translating to high specific capacity. Artificial or synthetic graphite is more expensive than natural graphite but has much higher purity which leads to long cycle life. The artificial graphite can be produced in a variety of particle sizes and morphologies with good rate performance. Amorphous carbons (e.g., hard carbon, soft carbon) are used for more specialized applications and are generally not widely used in automotive cells.
A key attribute of graphite is the surface functionality. As the graphite is lithiated during battery charge, the potential of the lithiated carbon drops to very low potential—at which the organic electrolyte is not reductively stable. As reduction of the electrolyte occurs, the reaction products precipitate onto the graphite surface forming an SEI layer. The composition of the SEI is dependent upon the specific electrolyte formulation, the graphite surface, the age of the battery, and many other factors. Without formation of the protective SEI, the lithiated graphite will continue to reduce the bulk electrolyte eventually leading to total consumption of electrolyte. Owing to the complexity of studying the SEI, it is difficult to predict which electrolytes and graphites work best together, and optimum electrolytes must be developed for specific anode materials.
Further improvements in energy density require new anode materials to replace graphite. The most promising material is silicon, which can exist in a variety of forms including silicon oxides, silicon alloys, nano-Si/graphite composites, and silicon nanowires, among others.1 While silicon-based anodes have very high specific capacities, the density of the lithium silicon alloy is very dependent upon lithium content. To date, electrodes with high silicon content (> ~ 8%) have not been demonstrated to have cycle life adequate for automotive applications. Key challenges facing use of silicon in anodes include low first cycle efficiency (owing to formation of irreversible phases), varying quality and consistency of starting material options, and manufacturing challenges associated with prelithiation and nanoparticle dispersion. In addition, the SEI formed on silicon anodes is not as robust as that formed on silicon. This can lead to shorter calendar life of the silicon-based cells.
Several studies demonstrate the potential of incremental and next-generation NMC technologies in particular to greatly increase cell performance and deliver greater specific cell energy (watt-hours per kilogram [Wh/kg] cathode or cell material), cell energy density watt-hours per liter (Wh/L), and cost (dollars per kilowatt-hour [$/kWh]). Combining improved cathodes with silicon containing anodes can substantially improve cell-level energy densities. Figure 5.10 shows how higher-nickel and lithium or manganese-rich NMC batteries can deliver 30% to 75% Wh/kg improvement over baseline NMC611 technology that has been the most prevalent BEV technology in the 2019 market.
5.3.3.3 Separators
The separator provides a physical barrier between the anode and the cathode to prevent shorting. Automotive separators must have stringent quality control to ensure pinholes and tears are not present in the membranes. High performance separators consist of a polymer layer or layers coated with inorganic particles, such as Al2O3. These inorganic coatings can improve overall safety of the battery in case of a thermal event. If the temperature of the battery gets high enough such that the polymer layer in the separator melts, the inorganic particles will physically separate the anode from the cathode.
In order to achieve the highest possible energy density, separators should be as thin as possible. A thinner separator takes up less space in the cell, resulting in a smaller cell for a given capacity. However, thinner separators are
___________________
1 Silicon forms alloys with lithium, rather than intercalating lithium ions, and has a theoretical capacity of 3579 mAh/g.
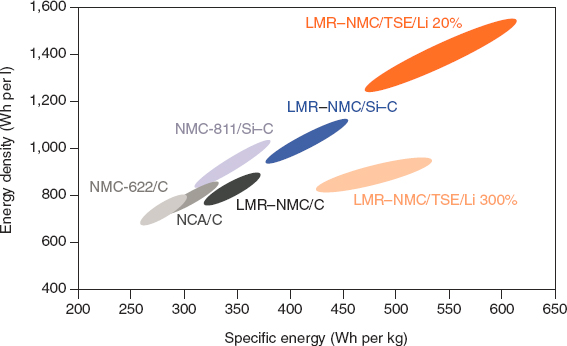
NOTE: C = carbon (graphite); Li (20%) = lithium anode with 20% excess lithium relative to cathode; Li (300%) = lithium anode with 300% excess lithium relative to cathode; LMR-NMC = lithium manganese rich NMC; NCA = lithium nickel cobalt aluminum oxide; NMC622 = LiNi0.6Mn0.2Co0.2O2; NMC811 = LiNi0.8Mn0.1Co0.1O2; NMC = lithium nickel manganese cobalt oxide; Si = silicon; Si-C = silicon-carbon composite; TSE = thiophosphate-based solid electrolyte (e.g., Li7P3S11).
SOURCE: Reprinted by permission from Springer Nature: Schmuch et al. Performance and cost materials for lithium-based rechargeable automotive batteries, Nature Energy 3:267–278, © 2018.
more prone to puncture during use or tear during cell manufacturing, so this trade-off must be managed. Table 5.7 shows key characteristics of separators used for automotive applications.
Key improvements in traditional separator technology involves development of robust, thin, low-cost, high-temperature materials to prevent catastrophic failure in the event of a thermal event.
5.3.3.4 Electrolyte
The electrolyte provides the medium by which lithium ions can move between the anode and the cathode. In addition, it infiltrates the electrodes enabling lithium ions to move into and out of bulk electrolyte. Electrolytes are complex formulations of solvents, salts, and additives. A high dielectric constant solvent, such as ethylene carbonate (EC), is required to solubilize the lithium salt. Most high dielectric solvents have viscosities that are too high to allow fast lithium transport. Therefore, solvents such as EC are diluted with other low viscosity solvents. Typically, linear carbonates (e.g., dimethyl carbonate or ethyl methyl carbonate) are used as low viscosity diluents.
TABLE 5.7 Important Separator Properties for Automotive Applications
| Property | Typical Values | Comments |
|---|---|---|
| Thickness | 10–40 microns | Trend is thinner to improve cell energy density, but need to balance with safety |
| Air permeability (Gurley value) | < 1,000 sec | Reflects porosity and pore structure for a given thickness |
| Porosity | 35%–50% | Higher porosity yields better power performance, but need to balance with safety |
| Shrinkage | < 3% | Minimize shrinkage at elevated temperatures for safety |
| Tensile strength | Variable | Needs to withstand battery manufacturing process |
| Puncture strength | Variable | Needs to withstand puncture from lithium dendrites or sharp particulates as the cell is under some pressure |
TABLE 5.8 Common Electrolyte Components
| Component | Examples | Function | Comment |
|---|---|---|---|
| High dielectric constant solvent | Ethylene carbonate, propylene carbonate | Solvates Li+ | High viscosity detrimental to rate, power, and low temperature performance; participates in SEI formation |
| Low viscosity solvent | Ethyl methyl carbonate, diethyl carbonate, dimethyl carbonate | Lowers viscosity | Volatile, flammable solvents detrimental to safety |
| Salt | LiPF6, LiFSI, LiBF4 | Provides anion for Li+ | Expensive, corrosive, moisture sensitive |
| SEI additives | Vinylene carbonate, fluorinated ethylene carbonate | Anode SEI stabilizer | Adds cost |
| Cathode active additives | 1,3-propane sultone, nitriles | Cathode passivation stabilizer | Regulatory concerns, adds cost |
A lithium-ion salt (or salts) is added to the formulation as a source of anions required to complex the lithium cations. Almost all commercial electrolyte formulations use lithium hexafluorophosphate (LiPF6) as the primary salt. As the lithium ions approach the electrode for intercalation, the solvation sphere and/or anion interaction must be such that the cation can be released to enter the active material. No other salt performs as well as LiPF6. One of the important functions of LiPF6 is passivation of the aluminum current collector, without which corrosion will occur. LiPF6 also plays an important role in the composition of the SEI layer on the anode. However, LiPF6 has deficiencies in that it is expensive, reacts with water, and has poor thermal stability. In the presence of water or at temperatures above about 60°C, LiPF6 generates acidic species such as hydrogen fluoride (HF), which is very detrimental to battery performance and poses safety hazards. The use of LiPF6 as an electrolyte salt requires stringent (and costly) manufacturing processes to keep moisture out of the battery and also requires good thermal management of batteries when in use.
Last, additives are essential for long life of lithium-ion batteries. Solvents, salts, and additives participate in SEI formation on the anode—but additives can enhance the stability and conductivity of the SEI such that good power performance over many cycles can be achieved. As higher nickel cathode materials are more reactive at the upper voltage cutoff, additives are also required to improve the oxidative stability of the organic electrolytes, resulting in passivation layers at both the anode SEI and cathode interface (cathode electrolyte interphase). Common electrolyte components are listed in Table 5.8.
Electrolyte development offers many different approaches to battery improvement. New additives to promote more robust SEI layers on the anode can enable longer cycle life, better low temperature power, lower resistance at high temperatures, and better safety. High voltage additives can stabilize high energy cathodes by forming passivation layers. Other types of additives can scavenge harmful species such as HF. New solvents are being studied to yield less flammable or non-flammable electrolytes, which could contribute to better safety. Several large efforts by companies such as Air Products and Honeywell to develop alternatives to LiPF6 have thus far been unsuccessful, but lower cost and more stable alternatives to LiPF6 should be a research target.
5.3.3.5 Cell Component Cost Reduction
To achieve widespread adoption, BEVs need to approach cost parity with ICEVs. Current battery costs have been a significant barrier to lowering the cost of EVs across more vehicle segments. As shown in Figure 5.11, 70% of the battery cost is owing to the material costs, with the remainder being factors such as manufacturing labor, R&D, and overhead. Efforts to reduce overall BEV costs must focus on reducing the cell cost—which translates to use of cheaper higher energy density materials and more efficient manufacturing methods. The individual cells must be packaged in modules and packs, which further adds to the battery cost. Automotive companies are looking across the value chain from materials through the pack assembly to reduce total system costs.
As shown in Figure 5.11, the materials in the cell account for about 70% of the product cost of the cell. Of the material cost, the cathode accounts for the largest fraction of the cost, typically accounting for 40%–45% of
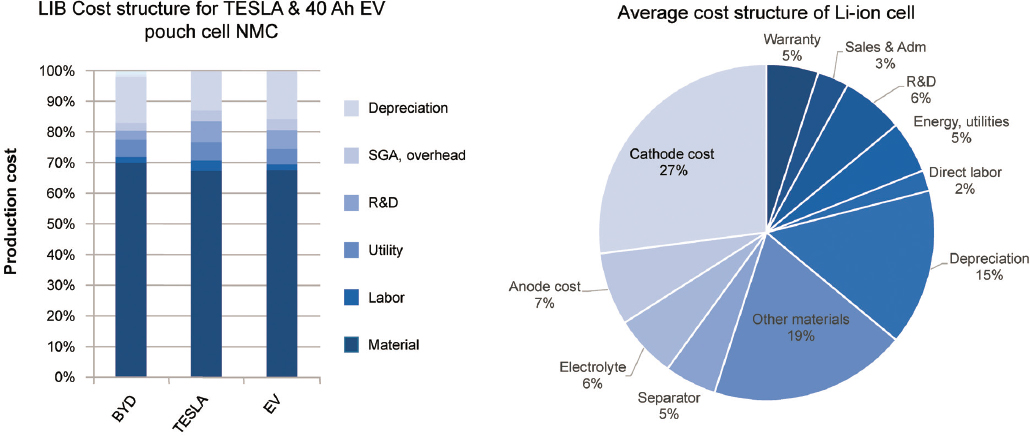
SOURCE: Pillot (2019).
NOTE: LIB = lithium ion battery; SGA = selling, general, and administrative.
material cost, followed by the anode and separator with 10%–15% each (Wentker et al., 2019). Other components include the aluminum and copper current collectors, tabs, cases, and packaging materials.
The constituent raw materials in the cathodes account for approximately 50% of the cathode cost. Figure 5.12a shows results of calculations for total material costs (cell level) per kWh for varying cathode compositions (Wentker et al., 2019). A shift from today’s NMC532//graphite to a high nickel (NMC811 or NCA) can reduce materials costs from $80 to near $70/kWh, primarily owing to the improved energy density of the higher nickel materials and reduced cost owing to minimization of cobalt content. Figure 5.12b shows the sensitivity of various cathode costs to base cobalt market price.
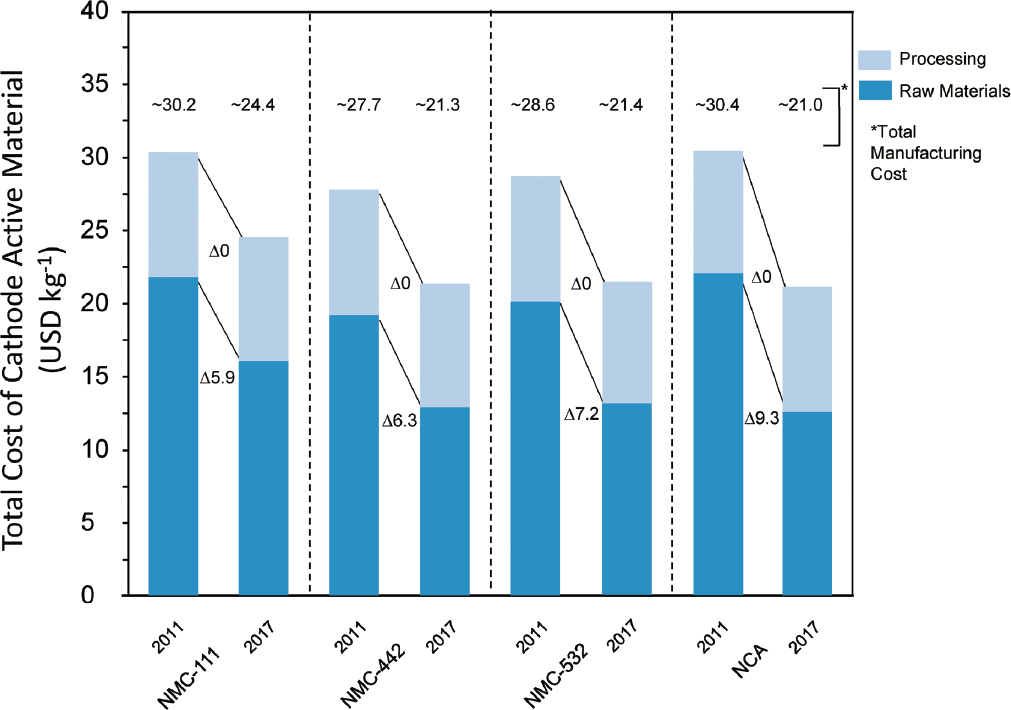
In addition to using lower cost materials, the absolute costs of materials have decreased over time, as shown in Figure 5.13. From 2011 to 2017, a decrease of 5%–10% in the raw materials cost was observed. This decrease mirrored a reduction in the constituent metal prices over that time frame and so may not be sustainable. However, no cost reduction owing to process improvements in cathode powder manufacture was observed.
5.3.3.6 Cell Design
Cell performance is strongly affected by the material components, but the cell design can be equally important. The cell design encompasses the design of the cathode and anode electrodes—including the active material content, the loading of material onto the current collector, and the porosity of the electrodes. A cell design for higher power applications such as HEVs will have thinner, more porous electrodes. This design allows for ample flow of electrolyte containing lithium ions into and out of the electrodes so that power and rate performance is not limited by bulk mass transport of lithium to the surface of the active materials. Each anode and cathode requires a current collector, and a separator is required between the two. Cells containing thinner, less dense electrodes will have a relatively higher weight percent and volume of these inactive components.
Cells designed for high energy will, therefore, tend to have thick, dense electrodes such that the weight and volume percent of inactive components will decrease. However, these types of electrodes can be limited in terms of their rate and power performance. Specially optimized electrolytes with lower viscosity or thinner SEI layers can help to overcome this problem. Thin current collectors are also beneficial in improving overall energy density but can cause problems in the electrode manufacturing process with film breakage or curvature as the electrode dries.
Another important parameter in cell design is the ratio of capacity of the anode to the cathode. In general anode layers are designed to have slightly higher capacity (5%–10%) than the cathode. This ensures that the anode can
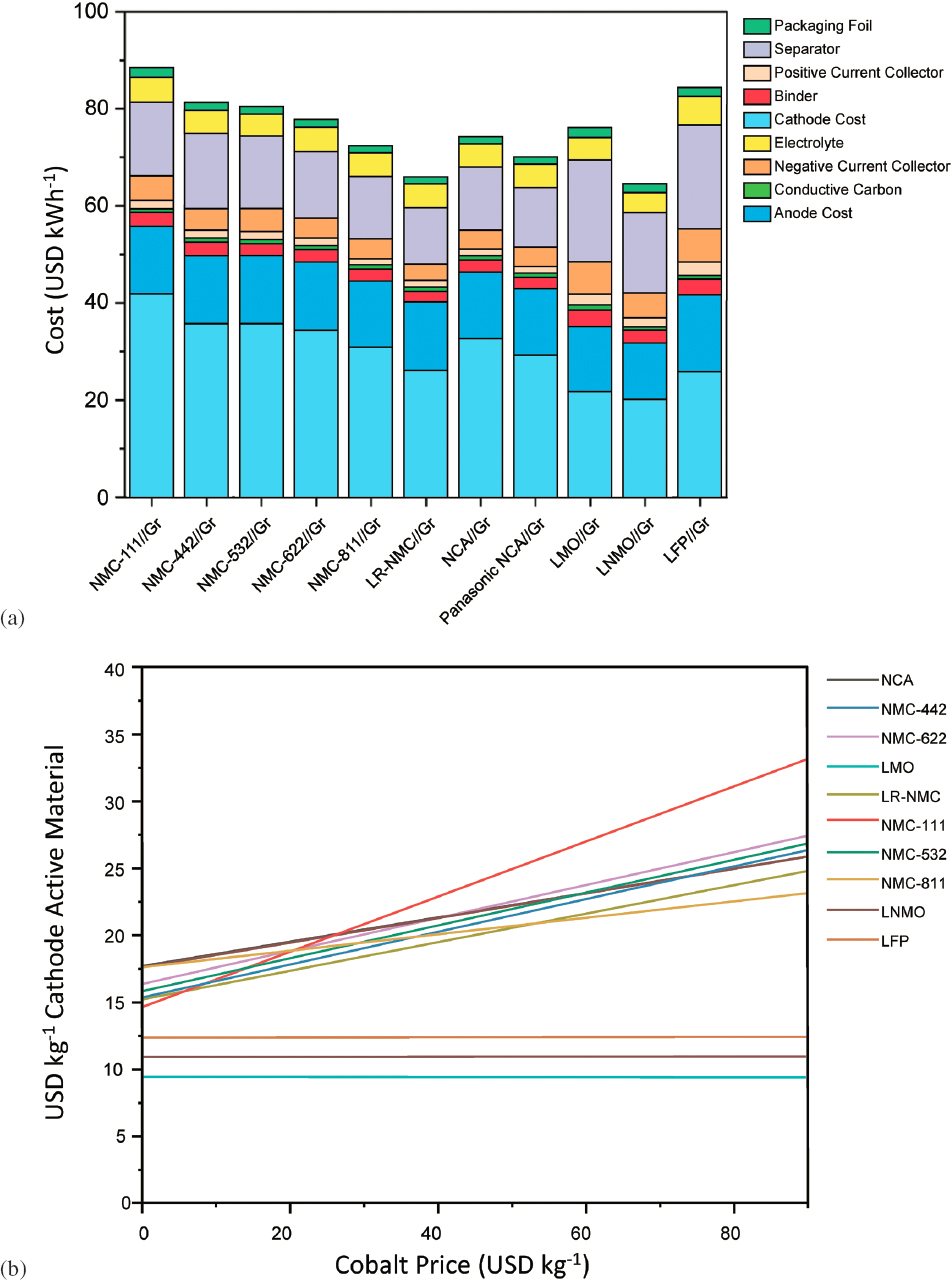
SOURCE: Wentker et al. (2019).
SOURCE: Wentker et al. (2019).
always intercalate all of the lithium ions coming over from the cathode. If the anode cannot accommodate all of the lithium ions, lithium metal plating can occur on the anode, which results in capacity fade and safety concerns. Higher ratios of anode to cathode (> 1.10) capacity provides better insurance against such events, but the excess anode takes up space and adds weight to the cell with no energy density benefit. In addition, excess anode results in more SEI formed, which consumes lithium and lowers energy density. Another safety factor built into most cells is extra anode area relative to the cathode. In other words, the anode is slightly larger than the cathode. Again, this takes up extra space and adds weight to the cell.
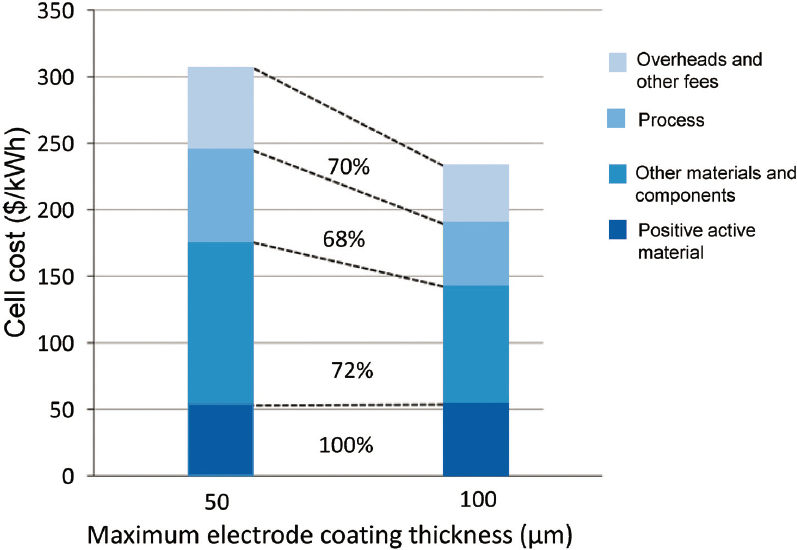
Increasing electrode thickness reduces the volume and weight of inactive materials in a given cell size. In addition to improving cell-level energy density, this also reduces cell costs, as shown in Figure 5.14. Improvements in technology of cathode coating for designed electrodes can enable cost reduction while maintaining performance.
5.3.3.7 Manufacturing Processes
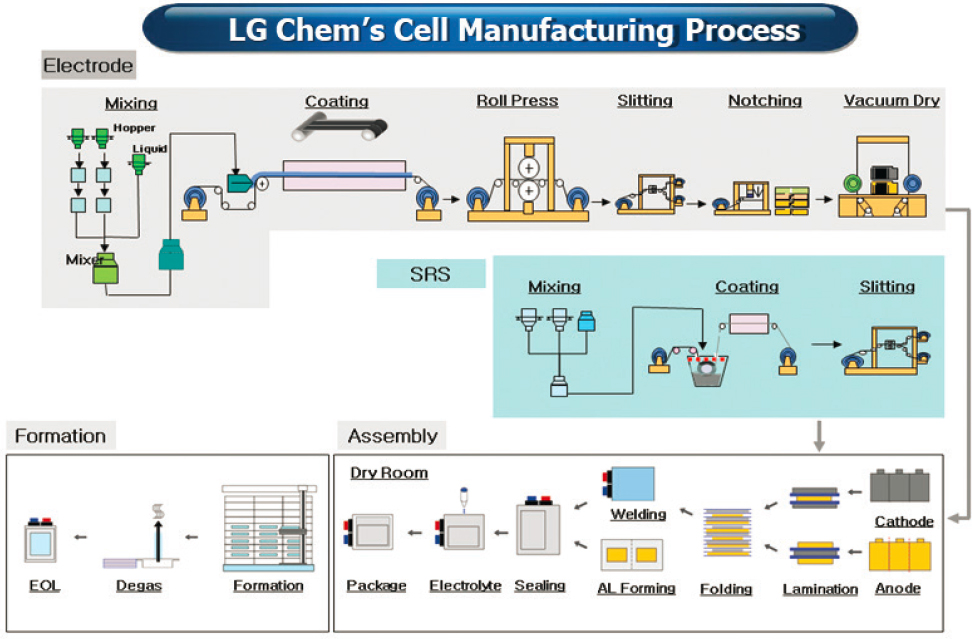
Battery manufacturing constitutes approximately 30%–50% of battery costs, depending upon the location of manufacture and scale. The process is capital intensive and consists of multiple complex operations, an example of which is shown in Figure 5.15.
In addition to the high-cost equipment, the battery manufacturing process is energy intensive. Large furnaces are required to evaporate the solvents from the coated electrodes. Owing to the sensitivity of the cell chemistry to moisture, the cell assembly must be performed in a dry room, which incurs large energy costs.
SOURCE: Patry et al. (2015).
NOTE: SRS = safety reinforced separator.
SOURCE: Koo (2012).
Beyond increasing volume, there are opportunities to reduce the cost of battery manufacturing. Coating thicker and wider electrodes reduces energy costs to dry the solvent. Currently, anodes are coated from aqueous slurries, but cathodes still use an organic solvent, N-methyl-2-pyrrolidone, which requires safety equipment and must be recycled from the drying furnace. Elimination of these organic solvents would reduce processing costs for electrode manufacturing.
The other large cost factor is the dry room manufacturing. At this point, there are not many technical approaches that eliminate the need for a dry room. However, materials that are less sensitive to moisture would be advantageous in cost reduction. Last, the formation process requires expensive equipment and holds up inventory. Formation process for some products can take as long as one week. Ex situ SEI chemistries that would eliminate the need for slow formation cycles could shorten this time and reduce the cost of formation equipment. At current time, there are no viable technologies for liquid electrolyte cells that address this problem.
5.3.3.8 Cell and Pack Cost Reduction
As growth of vehicle electrification has occurred, costs have come down owing to cell-level and pack-level improvements, and they are expected to decrease even further as volume increases. For example, GM announced that LG Chem cells cost $145/kWh total energy in 2019 but will be reduced to $100/kWh by 2021–2022 (Cole, 2015; Gardner, 2017). Similarly, Volkswagen reported that its battery cell costs were around €100/kWh ($108/kWh) in 2018, and battery system costs are reducing to below €100/kWh by 2020 (Witter, 2018). As battery costs continue to come down, various studies suggest cell costs will be 73% to 84% of the total battery pack cost with higher production volume in the 2025–2030 time frame (Anderman, 2017; Pillot, 2019; UBS, 2017). While those companies have focused on nickel manganese cobalt (NMC) technology, Tesla has similarly approached the same $100/kWh cell-level cost in 2020 with NCA technology, which has lower amounts of expensive cobalt (P3, 2020). These announcements underscore how quickly battery costs are declining as automakers and the suppliers move to higher volume and lower cost materials.2
Decreases in cell costs owing to material changes, process changes, and volume translate to decreases in pack costs (Wentker et al., 2019). However, it is noted that material costs and battery costs have reduced to below the numbers shown. For example, cobalt prices in 2019–2020 have consistently been about half of the 2017–2018 prices applied in that study. As previously shown, cell cost is decreased as cobalt content in the cathode is minimized. The sensitivity of the cell cost to the constituent metal pricing can be translated to pack costs as shown in Figure 5.16, which gives an example for a low cobalt NCA/graphite cell. As manufacturing scale increases, the overall production costs drop. The effect on the total cost will depend upon the fraction of the cost that is owing to materials versus process. Therefore, Figure 5.16 shows the effect on costs for scenarios where the materials account for 60% to 80% of the total pack cost (Wentker et al., 2019).
5.3.3.9 BEV Versus HEV Cell Technologies
Much of the previous technology descriptions focused on improved energy density, which is most relevant for BEVs. Cells for HEVs are designed more for power than energy, as their primary role is to support a downsized engine when higher power is required and to run auxiliary equipment in a stop-start fashion. The HEV is not plugged in to recharge, so the battery must be able to capture energy lost during braking. This requires fast charge acceptance to capture a maximum amount of energy. A larger amount of regenerative braking energy that can be captured and stored results in more energy that can be used to augment the engine and ultimately better fuel efficiency. Thus, the electrodes in HEV batteries are thinner and less dense than BEV cells. The cells are also operated over a narrower SOC than BEV cells, which enables the long cycle life (hundreds of thousands) required for HEVs.
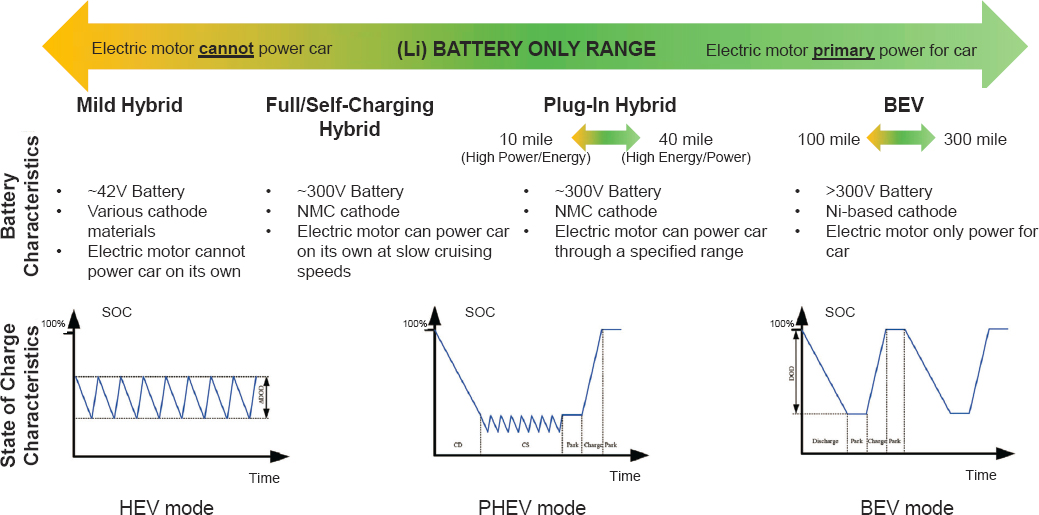
Today’s lithium-ion battery chemistries can meet the performance requirements for HEVs, with some differences along the hybrid spectrum, as illustrated in Figure 5.17. SOC conditions for batteries used in various electrified
___________________
2 As of 2019, five battery suppliers delivered batteries to supply at least 200,000 EVs per year (Sharpe et al., 2020).

SOURCE: Wentker et al. (2019).
SOURCE: Committee generated using images reprinted from Han et al., A review on the key issues of the lithium-ion battery degradation among the whole life cycle, eTransportation 1: 100005, © 2019 with permission from Elsevier.
vehicles are also shown in this figure. An in-depth discussion of SOC implications will follow in Section 5.3.4; however, considering SOC in the context of the different battery requirements between HEVs and BEVs points to very different power and life cycle considerations. Material cost reductions for batteries can still play an important role in overall cost reductions across the mild hybrid to BEV spectrum, but increases in production volume—the key approach for cost reduction in BEVs—can be leveraged in cells for HEVs and PHEVs as well.
5.3.3.10 Next-Generation Technologies
Current trends in more traditional battery materials rely on small incremental improvements toward higher nickel, higher voltage cathodes, and silicon containing anodes. As indicated by the references cited above, greater increases in specific energy (e.g., above about 400 Wh/kg) and cost reductions (e.g., below about $60/kWh) will likely need to originate from next-generation technologies that go well beyond the lithium-ion technologies that are relatively well known in 2020. These future technologies are often referred to as “beyond lithium” technologies and encompass varied approaches and chemistries. The time frame for solving key technical challenges for these next-generation chemistries is unclear.
Lithium Metal Anodes
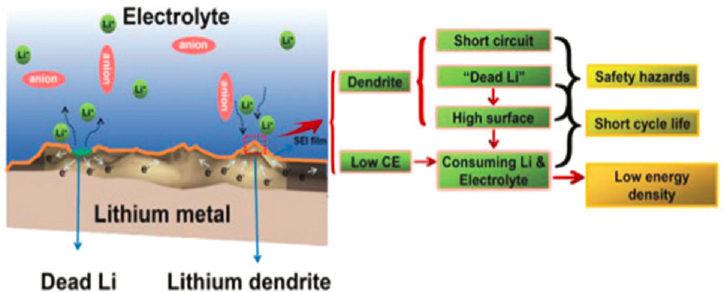
Today’s anodes serve as hosts to take up lithium shuttling from the cathode, with carbon or silicon having theoretical capacities of 370 or 3579 mAh/g, respectively. From an energy density perspective, lithium is also an ideal anode as it is 100% active material with a specific capacity of 3844 mAh/g. The use of lithium anodes is under development but has many challenges that are summarized in Figure 5.18.
Plating and de-plating of lithium is not uniform. The lithium tends to grow dendrites, which are needle-like structures. The dendrites can puncture or grow thorough separators, resulting in a battery short, which can precipitate a safety event. Even if dendrites can be prevented, the plated lithium tends to be low density high surface area material. High surface area lithium is very reactive. The reactivity with liquid electrolyte results in rapid capacity fade and consumption of electrolyte and lithium. In addition, puncture or other damage to the battery can expose high surface area lithium to the atmosphere, which will result in a fire. Last, the lower density plated lithium causes relatively large dimensional changes which can exert large forces on the structure of the battery module or pack. Thus, additional space needs to be incorporated into the design to accommodate these dimensional changes—which negatively affects volumetric energy density. These technical challenges need to be overcome while using the least amount of excess lithium possible. In order to realize the maximum energy density benefit of a lithium metal anode, no lithium would be theoretically built into the anode. A copper current collector would
SOURCE: Reprinted from Wu et al., Perspectives for restraining harsh lithium dendrite growth: Towards robust lithium metal anodes, Energy Storage Materials 15: 148–170, © 2018, with permission from Elsevier.
be built into the cell. The plating and stripping of lithium would be performed on lithium solely coming from the cathode added to the cell. Realistically, this is not possible, as the issues with non-uniform lithium plating and lithium consumption owing to electrolyte reactivity prevent such a cell from cycling very long as there is no excess lithium. Therefore, a factor of twice the lithium in the cathode is targeted to keep energy density high yet achieve stable cycling. At the current time, there are no commercial suppliers of low-cost thin lithium foils to meet this target.
Owing to the technical challenges of safety and life of lithium metal batteries as well as the commercial challenges of low-cost lithium electrodes, it is not anticipated that these will have any significant penetration into automotive markets before 2035.
Solid-State Electrolytes
As previously described, today’s organic electrolytes are volatile and flammable. Significant increases in safety can be achieved by replacing these liquids with solid-state materials. Safer materials may allow a reduction in system-level thermal management, allowing for improved system-level energy density and reduced costs. In addition, solid electrolytes may enable safer use of lithium metal anodes by mitigating growth and penetration of dendrites—which ultimately results in energy density improvements. There are, however, many challenges to the development and implementation of solid-state electrolytes into batteries.
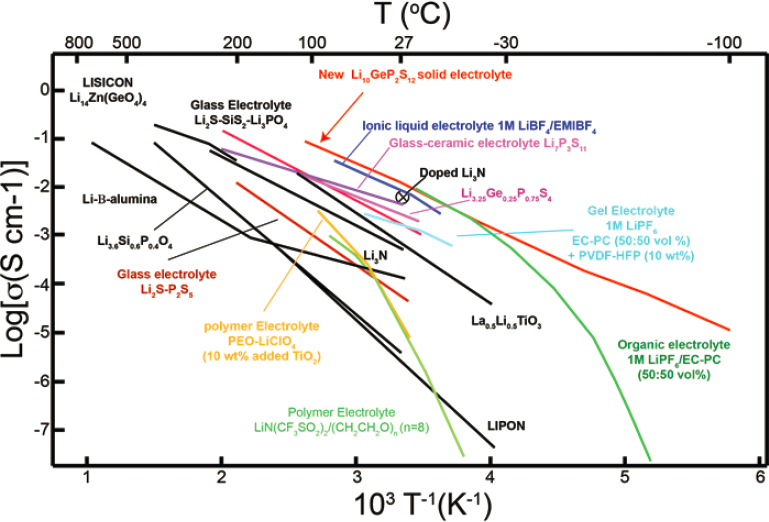
First, solid electrolytes need to transport lithium ions similar to liquid electrolytes over a temperature range appropriate for automotive applications, −30°C to 60°C. The lithium-ion conductivity of various families of solid ion conductors is shown in Figure 5.19. As shown, some solid electrolytes have inherent lithium-ion conductivities equal to or better than typical liquid electrolytes.
However, lithium transport also needs to occur between the solid electrolyte and the active material particles. While liquids generally wet the particles to provide a cohesive interface even during expansion and contraction of
SOURCE: Reprinted by permission from Springer Nature: Kamaya et al. A lithium superionic conductor, Nature Materials 10(9): 682–686, © 2011.
the active material particles, the solid-to-solid interface is not as robust. The following considerations are important for engineering cells with solid electrolyte:
- Large amounts of solid electrolyte may need to be added to achieve adequate lithium transport within the electrodes, which decreases gravimetric energy density.
- High stack pressures are often required to minimize impedance between the electrode layer and the solid electrolyte layer within the cells. These pressures require heavier and more costly structures to contain the cells.
- Solid electrolyte needs to be chemically and electrochemically stable on the surfaces of the electrodes. Some of the most highly conductive solid electrolytes, such as sulfur-containing materials, are not stable at typical cathode potentials in advanced lithium-ion batteries. The cathodes need to be coated with thin layers of LiNbO3 or other materials, which add cost and complexity to the active material manufacturing process. Some of these materials, such as the sulfides, are also not stable on lithium metal anodes.
- Lithium metal anodes are used to improve cell energy density, and the solid electrolyte needs to be wetted by the lithium metal in order to minimize formation of high surface area lithium and lithium dendrites. Ideally, the shear modulus of the solid electrolyte should be a factor of eight higher than that of lithium metal to avoid puncture by dendrites. Experimentally, even very hard ceramic materials suffer from dendrite penetration owing to growth along grain boundaries.
- Manufacturing processes need to be modified. In the case of the highly conducting sulfides, the materials release toxic and explosive H2S when exposed to moisture. While lithium-ion battery manufacturing is done in a dry room, the release of even small amounts of H2S is problematic. Other materials, such as ceramics, are hard, brittle materials that require significant engineering to fit into conventional roll-to-roll manufacturing processes.
While lithium metal anodes are not expected to be have significant use in automotive cells before 2035, solid-state electrolytes can be used with conventional anodes such as graphite or silicon. Although the energy density advantage of a solid-state cell is not realized with conventional anodes, the elimination of organic liquid electrolytes can be a safety advantage. Integration of a high conductivity solid electrolyte into conventional lithium-ion electrodes has been demonstrated and may be commercially relevant by 2030. In terms of cost, as described in previous sections, cell costs are dominated by cathode costs, which would not change. Some cost savings might be realized with the minor components: while a solid electrolyte would still likely cost more than today’s liquid electrolyte, a solid electrolyte would not require a separator. However, processing and manufacture costs to integrate a solid electrolyte would probably be higher than the addition of a liquid electrolyte.
Lithium-Sulfur Batteries
Lithium-sulfur batteries use lithium metal as an anode and low-cost, high-capacity sulfur as a cathode. As such, they are subject to all the technical challenges previously listed for lithium metal anodes. Since the sulfur cathode is not typically prelithiated, all the lithium in the cell must come from the anode—so a thin lithium foil is required. The advantages of a sulfur cathode are multiple, as shown in Table 5.9—high capacity, high availability, and low cost (Zhao, 2016a). However, the relatively low voltage and practical approaches necessary to achieve good cycle life negate some of these advantages.
The cell is built in the charged state, and on first discharge lithium ions move from the anode to the sulfur cathode. The sulfur is reduced at the cathode, and the S-S bonds in the sulfur break. Ultimately, a series of poly-sulfides, Snx−, are created. Complete reduction of sulfur results in the formation of Li2S in the cathode.
In addition to the challenges of using lithium metal in the cell, lithium-sulfur cells have additional technical hurdles. First, the sulfur cathode is not electronically conducting, which is required for a rechargeable battery. This is typically managed by embedding the sulfur into an electronically conductive carbon type matrix. Even with good dispersion of sulfur in the conductive matrix, less than 50% of the sulfur can be typically utilized. Between the addition of the carbon matrix and the poor utilization of sulfur, a theoretical capacity of more than 1000 mAh/g
TABLE 5.9 Redox Properties of Various Lithium Cells
| Properties | LiCoO2 | LiNiO2 | LiMn2O4 | LiFePO4 | Sulfur |
|---|---|---|---|---|---|
| Redox couple | Co4+/Co3+ | Ni4+/Ni3+ | Mn4+/Mn3+ | Fe3+/Fe2+ | S/Snx−/S2− |
| Voltage (V) | 3.6 | 4 | 3.9 | 3.5 | 2.1 |
| Specific capacity (mAh g−1)a | 274 | 274 | 148 | 170 | 1675 |
| Discharge capacity (mAh g−1)b | 145 | 160 | 105 | 155 | 400 |
| Environmental friendliness | Poor | Fair | Good | Good | Good |
| Availability | Low | Fair | High | High | High |
| Cost | High | Fair | Low | Low | Very low |
aTheoretical.
bPractical.
SOURCE: Fan et al. (2018); licensed under CC BY-NC-ND 4.0, https://creativecommons.org/licenses/by-nc-nd/4.0.
becomes a practical capacity of a few hundred (Figure 5.20). Since energy density depends upon both the specific capacity and the cell voltage, the net result is that it is difficult to demonstrate significant improvements in practical energy density over traditional lithium ion.
Another significant challenge for lithium-sulfur cells is achieving long cycle life owing to soluble species formed at the cathode. While Li2S is completely insoluble, some of the intermediate higher order species are soluble in the electrolyte. These dissolved species can migrate to the anode, where they are reduced to lower order and precipitate. This results in loss of active material at the cathode and formation of high resistance layers on the anode—both of which are very detrimental to lithium-sulfur cycle life.
While large improvements in lithium-sulfur technology have been observed in the past few years, significant improvements are still required. Commercial cells are available with stated energy densities of 450 Wh/kg, but cycle life of these cells is only a few hundred cycles. Owing to the low densities of both sulfur and lithium metal, the volumetric energy densities of these cells are lower than those of today’s lithium-ion batteries. Owing to the technical challenges of safety and life of lithium-sulfur batteries as well as the commercial challenges of low-cost lithium electrodes, it is not anticipated that these will have any significant penetration into automotive markets before 2035.
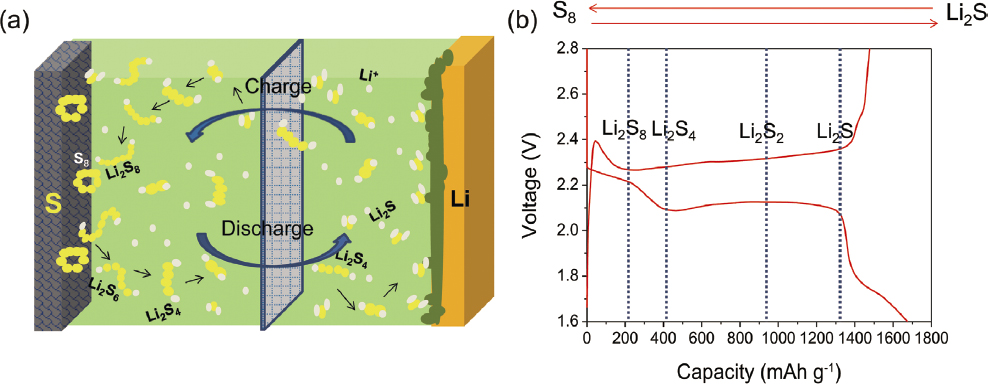
SOURCE: Fan et al. (2018); licensed under CC BY-NC-ND 4.0, https://creativecommons.org/licenses/by-nc-nd/4.0.
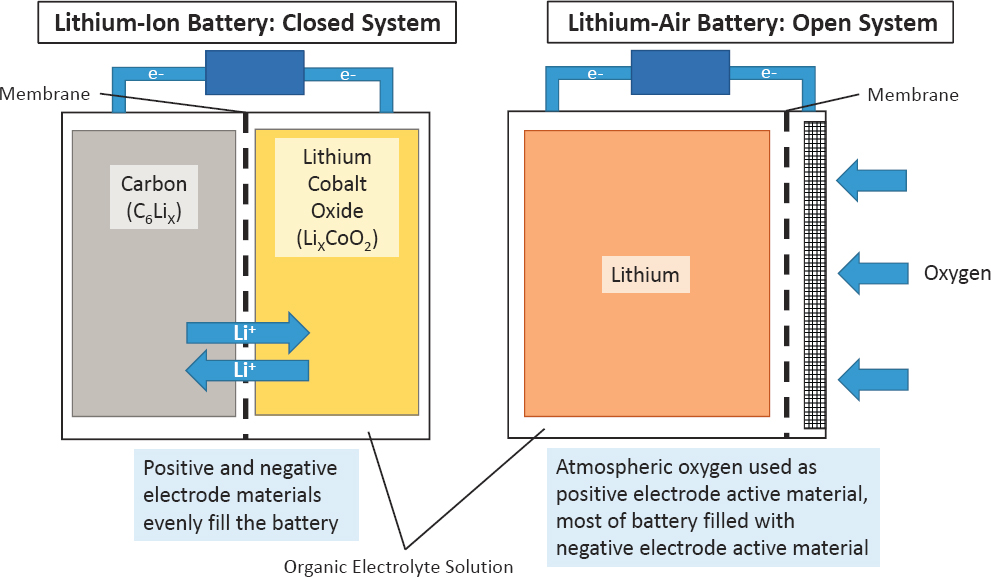
SOURCE: Committee generated using NTT (2016) and NTT (2020).
Lithium-Air Batteries
Theoretically, lithium-air batteries have tremendous potential to improve cell-level energy density and cost, as no cathode material is required. As shown in Figure 5.21, oxygen from the environment serves as the active material. A traditional lithium-ion battery is a closed system where the cathode takes up a substantial amount of space. In an open system with oxygen coming from the environment, the battery would mainly consist of just the lithium anode.
In theory, lithium-air architectures would present a substantial energy density improvement. Practically, lithium-air batteries require significant development. On the cathode side, a cheap, efficient oxygen reduction catalyst is required to achieve high reversible capacities. The catalyst needs to be incorporated into some type of structure, which takes up space in the cell—diminishing the energy density advantage. The structures that contain the catalyst must be porous to allow transport of oxygen through the system, but those pores can become blocked by insoluble reduction products of oxygen, such as Li2O. The anode in these cells is lithium metal, which cannot be exposed to moisture or CO2 (which would result in formation of insoluble LiOH or Li2CO3). The cell needs to contain a membrane through which O2 can rapidly transport but that blocks CO2 and moisture. Current prototypes of lithium-air cells are frequently operated under enhanced oxygen environments to achieve high power performance.
In addition, the lithium metal anode is subject to all the performance and safety issues previously addressed. Owing to the technical challenges of lithium-air cells, it is not anticipated that these will have any significant penetration into automotive markets by mid-century.
Magnesium Batteries
Magnesium batteries continue to be of interest to the industry owing to multiple advantages over lithium-ion batteries. Magnesium batteries consist of a cathode that can intercalate/deintercalate magnesium ions, a separator, electrolyte, and a magnesium metal anode (Figure 5.22a). Because magnesium is multivalent (Mg2+ versus Li+), the movement of a magnesium ion from anode to cathode translates to two electrons—meaning greater storage
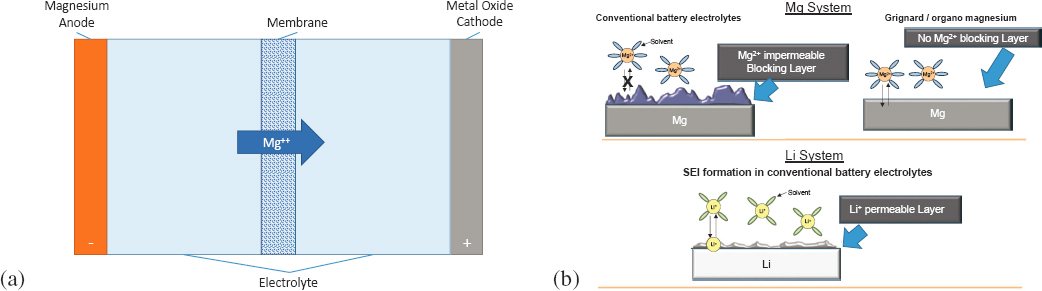
SOURCE: (a) Committee generated; (b) Mohtadi and Mizuno (2014).
of energy relative to lithium. Mg2+ ions are similar in size to Li+ ions, so cathodes exist that can fit the ions into their structure via intercalation. Magnesium metal anodes do not form dendrites like lithium, so they have potential safety advantages. Last, magnesium is abundant and low cost.
While magnesium has many potential advantages to lithium, a significant disadvantage is the reaction of electrolyte with magnesium metal. Like lithium, magnesium metal is very reactive with an organic electrolyte. However, on lithium metal, organic electrolytes are reduced during the formation cycle to form the SEI. The relatively stable SEI allows lithium-ion transport into and out of the anode but electrically insulates the remaining electrolyte from further reaction with the anode. On magnesium metal, the electrolyte reacts and forms an SEI. However, the resulting SEI does not allow magnesium ion transport, as shown in Figure 5.22b. Owing to the complexity of the electrolyte development and further needs to improve cathodes for these systems, it is unlikely that magnesium batteries will have any significant penetration into automotive markets before 2035.
5.3.4 Battery Management Systems
The BMS is the combination of hardware and software responsible for ensuring reliable and safe operation by estimating the remaining usable battery capacity, and health of the battery. The BMS relies heavily on estimation of SOC and state of health (SOH). Together, these estimations act like the ubiquitous fuel gauge in a conventional vehicle, telling the driver how much range remains on the vehicle. To ease range-anxiety, modern PHEVs and BEVs have complex estimation algorithms for the SOC and SOH to translate the remaining battery energy to miles based on recognizing driving and terrain patterns.
The performance and longevity of EV battery packs relies on constraining their operation so that current, SOC, and temperature are regulated within prescribed limits. Enforcement of constraints is achieved by the communication of BMS algorithms with the vehicle electronic control unit to limit the power input (charging) or the power being drawn from the battery pack. Enforcing these limits can cause power denials affecting vehicle torque generation, braking, and charging time. These power limits are encompassed in the real-time estimation of the pack state of power (SOP) based on lithium concentration, and temperature- and age-dependent internal impedance.
The BMS also balances all the cells in a pack—a function that is critical to the safe and efficient function of a BEV. Cell balancing is necessary to extract the maximum energy from the pack, as the cell with the lowest capacity or extremum in SOC will limit the total cyclable energy (charging and discharging must be terminated when any cell reaches its limits). Over time, the fraction of stored charge relative to the total capacity in each cell will begin to drift owing to differences in the temperature-dependent self-discharge rate and the rate of capacity loss.
The BMS also monitors sparse temperature measurements sampled strategically from key cells in a pack. The measurements are typically complemented by the estimation of internal cell temperatures since they might be several degrees higher during high-power operation than the sensed values. The battery SOP limits account for
the estimated highest internal temperature and the thermal gradients developed in the pack depending on cell and pack geometric features, packaging, and cooling from the vehicle thermal management system. The recognition of abnormal battery system conditions and fault detection are also performed in the BMS to assess the conditions against calibrated thresholds and issue messaging to the vehicle owner for condition-based maintenance.
Ultimately, the BMS needs to be able to estimate critical battery states and rely on an accurate prediction of complex electrochemical, thermal, and mechanical phenomena, typically through the combined use of models and measurements. Under normal operation, the BMS enforces safety through set limits that restrict internal states of individual cells inside the pack, with the capability of preventing harmful operation that would result in lithium plating, metal dissolution, or particle cracking. These limits are typically calibrated in the laboratory using a lengthy and comprehensive set of experiments at the beginning of life (BOL) of a cell or pack that probe aging and other harmful mechanisms, building safety margins for the entire life of the pack. Most BMS algorithms are currently reactive and enforce voltage and temperature limits based on short predictions—a combination of data-driven and physics-based models with various levels of fidelity (from equivalent-circuit models to first-principle models). More recently, model-free BMS are being developed based on data-driven predictions (Attia et al., 2020). Critically, BMS research is still addressing the following:
- Computation of first-principles models that can run microcontrollers in real time and provide predictive capability of inner physical states (Dubarry and Beck, 2020).
- Identification of physics-based model parameters to reflect the real battery age using onboard measurements under real-world use. This endeavor is much more difficult than off-line model tuning using lab experiments owing to limited, sparse, and noisy real-world data (Dubarry et al., 2020).
- Machine learning based on aggregation of a plurality of onboard sensing and real-world use features to inform (predict) long-term use. Onboard prediction is much more difficult than prediction under full DOD and repeated cycling conditions (Sulzer et al., 2020; Severson et al., 2019). Despite these difficulties, data collection across academic laboratories and from all EVs across manufacturers and environments worldwide may advance the recognition of features, clustering, and data analytics for the prediction of battery life (Che et al., 2020; Aykol et al., 2020).
- Adaptation of the BMS to slow down aging by adjusting fast charging protocols with optimized pulses if packs are used aggressively (Choe et al., 2013), or stretching their utilization (power, energy, and range limits) if the packs are gently used (Lam et al., 2020).
These efforts involving data, models, and algorithms are considered highly proprietary, but much fundamental and precompetitive research remains to be done that would benefit all battery chemistries, form factors, and applications. Concentrated efforts could leverage the U.S. Department of Energy (DOE) results from a multiyear program called CAEBAT: Computer-Aided Engineering for Electric Drive Vehicle Batteries that developed multiscale multidomain models and the software integration for the design of cells and packs. Such a limited effort was championed and coordinated by the ARPA-E project AMPED for advancing models, algorithms, integrated sensing, data, and power electronics. Data analytics and machine-learning with physics-informed features will enable accurate estimations and predictions of battery SOC, SOP, and SOH in real-world vehicle-use. Onboard or telemetric data collection of battery signals (voltage, current, and temperature) along with driving patterns could provide customized battery life prediction based on the battery’s past history and likely future use patterns. This kind of customized onboard prediction can be a key advance in driver convenience, manufacturer warranty management, battery design, planning for end of life, second use or recycling, and EV policy making.
5.3.4.1 State of Charge
Battery SOC describes the remaining battery capacity and, therefore, remaining driving range. Since battery behavior is affected by several factors such as operating temperature, current direction, and history, battery SOC is a function of these factors. Battery SOC is defined as the ratio of available capacity to the nominal capacity. Many studies have been conducted to accurately estimate battery SOC, the earliest ones from the National Aeronautics
and Space Administration estimating astronaut backpack range (Pop et al., 2005) and automotive applications (Verbrugge and Tate, 2004; Plett, 2004). Today’s estimation methods can be grouped into the following categories:
- Coulomb counting: Coulomb counting relies on the integration of the current drawn from and supplied to a battery over time. Unknown initial SOC is one of the main problems and is circumvented with voltage inversion after a rest. Sensor accuracy is also important since accumulated errors can lead to a drift in the estimated battery SOC.
- Voltage inversion: Battery SOC can be estimated by using voltage measurement, which is referred to as voltage-inversion method since this method utilizes the one-to-one relationship between voltage and battery SOC. The relationship can be implemented or programmed using a look-up-table, piecewise linear function, or mathematical function (Pop et al., 2005). Including temperature and c-rate dependency for SOC correction makes this estimation process more complicated and more expensive than coulomb counting.
- Combination of coulomb counting and voltage inversion: Considering the deficiencies of coulomb-counting-based and voltage-inversion-based SOC estimation, some early implementations of onboard SOC estimation algorithms attempted to combine both methods. The need for heuristics tuning was made redundant with the adoption of modern model-based estimation.
- Model-based closed-loop SOC estimation: In model-based estimation, the output error injection (measured voltage) and model-based prediction (predicted voltage) assuming an SOC and comparing with the actual measured voltage; the error between measured and estimated voltage can then be used to reduce the error in the assumed SOC from a closed-loop estimation as a means to combine the coulomb counting and the voltage inversion in a systematic way. This is depicted in Figure 5.23.
Model-based closed-loop estimation has been adopted as the most widely used method for battery SOC estimation. The representative models used for estimation are nonlinear extended Kalman filters, as first presented by Plett (2004) using equivalent circuit models of battery cell behavior. Thereafter, a slew of other model-based techniques—including extended Kalman filters for electrochemical models (Plett, 2004; Xia et al., 2014), sigma-point/unscented Kalman filters (Ji et al., 2013; Hu and Yurkovich, 2012), particle filters (He et al., 2014; Hannan et al., 2017), sliding mode observers (Wang et al., 2017), and their variants—have been proposed. Wang et al. (2018) published a comprehensive review of model-based methods for SOC estimation.
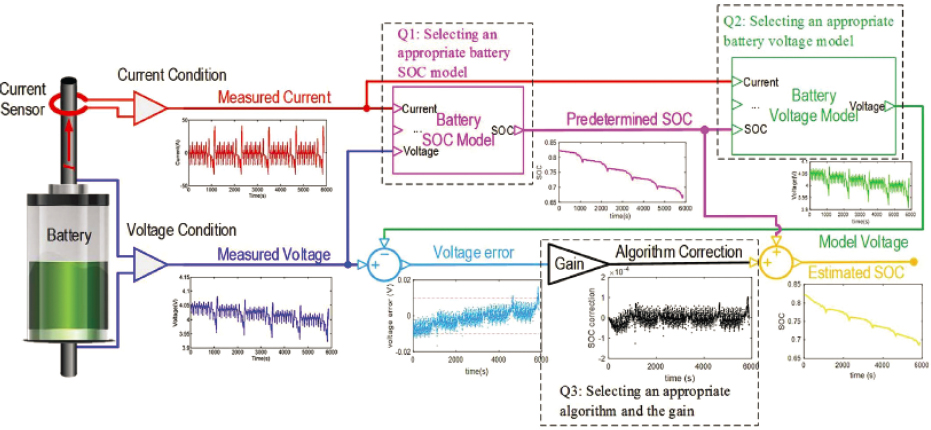
SOURCE: Reprinted from Zheng et al., Investigating the error sources of the online state of charge estimation methods for lithium-ion batteries in electric vehicles, Journal of Power Sources 377: 161–188, © 2018 with permission from Elsevier.
Nevertheless, model-based estimation methods suffer from two issues in practice: (1) the need for knowledge of model parameters (Lin, 2017), which are often difficult to obtain and subject to change over time; and (2) limited fidelity even for the complicated electrochemical model (Speltino et al., 2009). Therefore, in recent years, data-driven and machine learning approaches for battery state estimation have received increasing attention. However, the data-driven approaches need to be handled with caution. The drawbacks include the need for massive training data, data labeling, and specialized tests or measurements to extract features; overfitting under biased or noisy data; and the heavy computational load required for training. Last, the resulting model states may not represent any physical state of the battery, making their interpretation difficult.
5.3.4.2 State of Power
Battery SOP, or power capability, refers to the constant power that can be safely drawn from or provided to the battery over a finite window of time (Verbrugge and Koch, 2006; Wang et al., 2011). Information on the battery SOP is useful when making decisions for optimal power split in the core of hybrid powertrain systems (Lin et al., 2003). Battery SOP estimation is also important for battery thermal management (Kim et al., 2013, 2014) and charging limitations where thermal constraint as well as electrical constraints are considered, as shown in Figure 5.24.
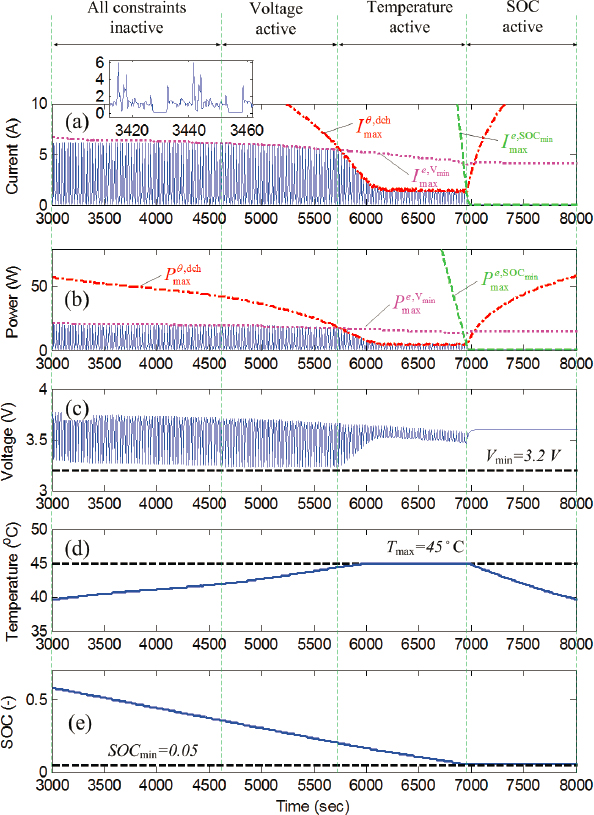
SOURCE: Republished with permission of the American Society of Mechanical Engineers, from Kim et al., 2014, “Maximum Power Estimation of Lithium-Ion Batteries Accounting for Thermal and Electrical Constraints,” ASME 2013 Dynamic Systems and Control Conference, Paper DSCC2013-3935, https://doi.org/10.1115/DSCC2013-3935; permission conveyed through Copyright Clearance Center, Inc.
It is expected that future SOC and SOP algorithms will impose constraints associated with internal stresses that can fracture the electrode particles and consume the lithium inventory and hence cause capacity loss or stress rates that can cause layer delamination and impedance increase (Lin, 2018).
5.3.4.3 State of Health
Batteries degrade over time so that a battery that is several years old and has been through many charge cycles will not hold a charge as well as a brand-new one. The degree of battery degradation is quantified by impedance increase and capacity loss; both of these measures decrease the power capability and energy availability, and consequently the vehicle range. SOH estimation seeks to identify the capacity fade or impedance increase in an aged pack. The impedance increase is particularly important in HEVs, since batteries act as power buffers for the ICEs or the fuel cells on board. Capacity fade is more relevant to BEVs that can travel long enough distances to reach the stored energy limit. The pack degradation depends on the degradation of the weakest (lowest capacity and highest resistance) cell in a series string, making cell-to-cell balancing an important BMS functionality. Cell-to-cell variability is caused by non-uniform temperature distributions owing to cooling and manufacturing tolerances.
The factors that affect battery degradation and cause aging are SOC, current, and temperature. These factors influence the cell’s potential and the rate of change in potential that each electrode experiences, potentially resulting in internal particle stress, cracking, and more SEI build-up from phase transitions in the electrode material. Fast charging or low temperature are aggravating conditions that can lead to lithium plating. Beyond the loss of cyclable lithium, lithium plating can cause internal shorts and lead to thermal runaways. High SOC also coincides with high cathodic overpotential, which could cause dissolution of the cathode electrode metal oxide. High currents are also damaging for Li-ion batteries, especially the ones with thick electrodes (high-capacity cells), because they cause internal overpotential gradients owing to limitations in electrode and electrolyte diffusivity.
The most accurate method for estimating the actual battery capacity on board a vehicle is to fully charge and then fully discharge while counting (integrating) the current drawn, also known as coulomb counting. Electronic devices are fully charged and discharged more often than most EVs. Assuming the median driving distance, most large battery packs do not utilize more than 20% of their stored energy, which begs for other methods that will provide accurate estimation of the remaining capacity on board the vehicle.
Most methods rely on comparing the measured voltage versus coulomb counting versus the BOL open circuit voltage and inferring the capacity loss. Researchers have shown that capacity loss can be estimated based on identifiable peaks and plateaus in incremental capacity analysis and differential voltage curves (Mendoza et al., 2017; Lin, 2018; Zhao, 2016b), which do not require complete charge and discharge. The degradation can be identified by matching the changes of the aged open circuit voltage curve to various degradation modes. But all these methods also require operation until a certain DOD—associated with electrode phase transitions—is reached.
Without such data, the estimation suffers from the loss of accuracy; hence, the reliability of the estimation results has to be questioned. The estimation uncertainty of the SOH at shallow depths of discharge is shown to be inaccurate by up to 30% (Lee et al., 2020b), posing significant concern on the ability to predict automotive battery end of life. Additional measurements, such as the cell expansion as the cell charges, allow SOH derivation under limited DODs (Mohtat et al., 2019), raising the possibility of reducing the range anxiety with the additional cost of pack sensors. Another possible option is that the BMS can prompt the user to fully discharge occasionally, followed by a slow-charging protocol, to enable a more accurate SOH estimation.
Life Cycle Prediction
Life cycle models have been extensively researched and published for both physics-based and empirical modeling approaches using laboratory data. Physics-based models employ an electrochemical model with a side reaction sub-model to capture the mechanism of battery degradation (Kleinet al., 2013; Schwunk et al., 2013; Tanim et al., 2015), such as the SEI growth and lithium deposition. These models can predict the capacity loss and resistance growth over time driven by inputs, such as current and temperature. The empirical approach, however, uses a heuristic formula obtained from historic data fitting. In this approach, SOH metrics (e.g., capacity loss and resistance growth) are expressed as a function of time and impacting factors (e.g., current magnitude, temperature, DOD, etc.).
These open-loop prediction methods are generally convenient to implement in practice and provide prognostic tools for chemistry selection and component sizing. They rely on a rich data set for fitting the model, but they have to be used in combination with an estimation of the actual degradation state for higher accuracy predictions of future aging. It is worth noting that recent machine learning techniques (Severson et al., 2019) predict the life of a cell based on how certain features changed between the first and the 100th cycle. This technique’s predictive ability is limited, however, by the repetition of the duty cycle.
Testing Battery Degradation and Real-World Use
Battery capacity degradation is considered a barrier for market penetration of BEVs. Battery life is commonly measured by the number of charge-discharge cycles before the battery capacity is degraded to 80% of its original capacity. However, the most common testing method is based on an accelerated test with deep discharge and full recharge cycles. This method is reasonable for technology benchmarking but does not represent real-world end-use factors and therefore is inadequate for informing consumers and BEV makers—for example, on total cost of ownership, range anxiety over vehicle lifetime, BEV range design, and battery warranty offering. Real-world driving involves shallow discharges and micro-cycling that is very different from the degradation testing done in the laboratory under accelerating stress conditions.
Some laboratory-based battery testing studies show that battery capacity degradation progresses more slowly with smaller SOC windows during charge-discharge cycles (Omar et al., 2014). It is also reported that the BEV leasing company Tesloop has its Tesla Model S vehicles driven more than 400,000 miles without significant battery capacity degradation (Tesloop, 2018), although it is not yet clear if smaller SOC windows are the explanation. Recent Nissan battery life data suggest that the battery itself may last more than 10 years beyond the life of the vehicle (Loveday, 2019).
Indeed, Figure 5.25 shows the life cycle for various DOD versus the 100% DOD that typically is exercised in laboratory tests. How conditions affect the SOC and DOD, both on average and within a cycling window, are critical for assessing battery life; thus, they contribute to a combination of onboard cell diagnostics for estimating the battery SOH. Together with a (off-line trained) prognostic model, these measures can provide life prediction based on the intended or learned duty cycle as shown in Figure 5.25.
If real-world battery lifetime can be even longer than previously understood with rich and reliable data from real-world BEV operation, it could have implications on battery R&D priority, battery warranty provision, consumer confidence and acceptance of BEVs, and the role of electrification in fuel economy policies.
Life prediction also guides battery sizing (Samad et al., 2018), warranty, and resale value, as discussed below. Other economic and environmental assessments that guide decisions for repurposing batteries to grid application or recycling automotive packs depend on accurate estimations of the battery life. Some of these considerations are discussed in Box 5.2.
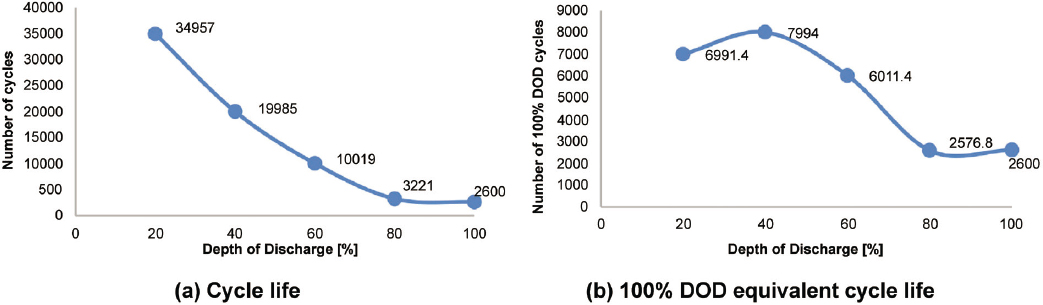
SOURCE: Reprinted from Han et al., A review on the key issues of the lithium-ion battery degradation among the whole life cycle, eTransportation 1: 100005, © 2019 with permission from Elsevier.
Many automakers use active cooling and heating systems to help keep the battery at a healthy temperature and limit exposure to damaging conditions. Some also advise owners against fully charging or discharging the battery, since storing batteries at 100% or discharging them to 0% tends to cause fast degradation. Tesla owners, for example, may control their maximum charge, while they are advised to a “daily” charging to 80%–90% unless they know they will need the full range and to plugging in as soon as possible whenever the battery energy is very low.
5.3.4.4 Accidents, Faults, and State of Safety
Trends in Li-ion battery technology feature a continuous increase in battery energy density, which also increases the severity of battery failures. But for comparison, it is important to note that the heat of combustion for Li-ion cells (EB(Wh) = 0.14 MB(g)) is an order of magnitude smaller than the one associated with similar mass of gasoline (EG(Wh) = 12.8 MG(g)). Given the considerably longer range reached by 1 kg of gasoline than 1 kg of battery, the fire heat release should be compared for similar vehicle range as it is shown in Figure 5.26.
To maintain safety, the BMS must prevent each individual cell in the pack from overcharging, discharging, or reaching too high a temperature to minimize failures associated with harmful operation. Some failures, however, involve mechanical abuse or other unanticipated events that can lead to battery internal short circuit and self-heating (Feng et al., 2018). At elevated temperatures, exothermic battery side reactions will become active, starting with the decomposition of the SEI layer. This leads to gas evolution that further leads to cell swelling and potentially cell rupture and gas venting. The resulting hazards include toxic off-gassing, smoke, fire, and even an explosion if combustible gases accumulate (Nedjalkov et al., 2016; Abada et al., 2016).
Regarding the risk of electrochemical failure, the 2017 National Highway Traffic Safety Administration report concludes that the propensity and severity of fires and explosions from the accidental ignition of flammable electrolytic solvents used in Li-ion battery systems are anticipated to be somewhat comparable to or perhaps slightly less than those for gasoline or diesel vehicular fuels (Stephens et al., 2017). The overall consequences for Li-ion batteries are expected to be less because of the much smaller amounts of flammable solvent released in a catastrophic failure situation. Recent studies, however, have measured the gas emission from lithium-ion batteries during malfunction for different fault scenarios, showing a large variety of species with mostly toxic to highly toxic properties (Nedjalkov et al., 2016). Although statistically rare, battery fires pose specific hazards and safety challenges that must be understood (Bravo-Diaz et al., 2020).
Detection of a thermal runaway event inside a battery pack should be made immediately after the fault to avoid further damage. From a regulation perspective, the proposed global technical regulation No. 20 on EV safety also requires that in an event of thermal runaway, the vehicle shall provide an advance warning indication to allow egress of 5 minutes prior to hazardous conditions inside the passenger compartment (NTSB, 2020). This requirement is deemed to be satisfied if the thermal propagation does not lead to a hazardous situation for the vehicle occupants.
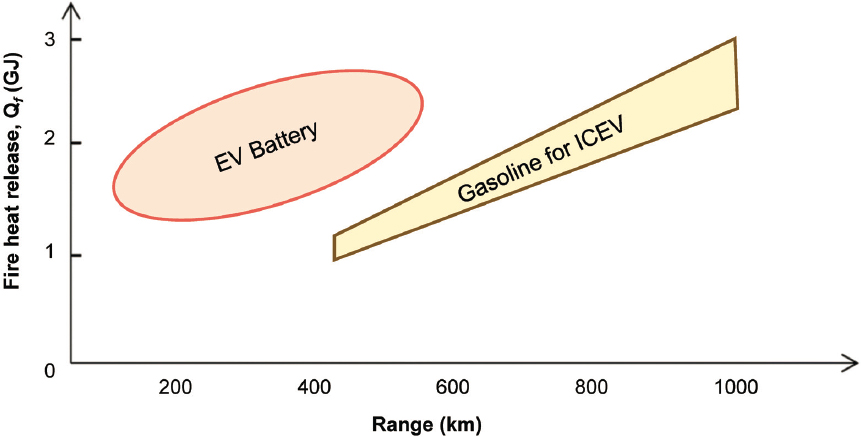
SOURCE: Reprinted by permission from Springer Nature: Sun et al., 2020, A review of battery fires in electric vehicles, Fire Technology 56(4): 1361–1410, © 2020.
Conventional methods of battery thermal runaway detection are usually based on voltage and surface temperature measurements. These methods work well for a single cell but are difficult to apply in large scale battery packs used in automotive and grid storage applications. Moreover, in EV battery packs, the batteries are connected in parallel. For example, the Tesla Model S battery packs come with 74 cells in parallel. A large number of parallel-connected batteries will suppress the battery fault voltage signal. Because the other healthy cells in parallel will continue to supply the nominal voltage, the pack voltage with a single cell at fault will be very similar to that of a healthy battery pack, making the fault detection using voltage alone challenging.
Note here that overcharging (discharging) protection for cells in parallel connections requires additional hardware and design measures that for most small parallel arrays is accomplished by internal disconnects, such as positive temperature coefficient devices embedded in cells that limit current at the cell level. Although these internal cell measures exist, cell rupture and leakage can still occur; thus, gas detection methods are also used to identify cell failure events. The composition of battery vent-gas during a thermal runaway event includes CO2, CO, H2, and volatile organic compounds. The gas venting is considered the precursor of thermal runaway events (Cai et al., 2019a). Although the gas venting will not necessarily lead to thermal runaway every time, such faults should be identified to prevent escalating the fault (Cai et al., 2019b). Ongoing research is investigating the target gas species that (1) appears with good consistency in all vent tests, (2) is present in first venting event, and (3) is measurable by an onboard sensor.
The additional sensors and the redundancy that would be required for the detection of the onset of a fault could increase the cost of the pack and reduce the pack energy density, but it is important to systematically address fault detection as EVs start aging and becoming an important portion of the 2035 automotive landscape (Sulzer et al., 2020).
From 2013 through late summer 2020, there have been 17 EV fires in the United States. For Tesla alone, there have been 19 EV fire incidents globally. Among these, 8 accidents are related to collision, 5 accidents are related to charging, 3 accidents happened while the vehicle was parked, and 3 accidents happened during operation. Given the concerns and publicity that EV fires attracted, Tesla has included a fire-safety comparison in their 2019 impact report showing 1 EV fire incident per 175 million miles, whereas there is 1 ICEV fire per 19 million miles. The conclusion drawn was that EVs are approximately 10 times safer than their counterparts based on linear interpolation of the statistics. Notably, the U.S. average age of vehicles on the road is 12 years, whereas the EV average population age cannot be larger than 4 years (Statista, 2020b). EVs seem to be statistically at least two times safer than ICEVs when the population age is taken into account. While these safety statistics are encouraging, it is worth noting that many fire departments in the United States do not yet have protocols in place to respond to EV-specific incidents, and battery-related fires are currently being probed by safety regulators in the United States and abroad (Levin, 2020; Foldy, 2020; IDTechEx, 2020).
Recent recalls of Hyundai’s Kona EV and Ford Kuga PHEV along with an investigation on Chevy Bolt EV are drawing public attention, despite the fact that there is still no statistical evidence that EVs are less safe than ICEVs (Riley, 2020). All manufacturers are investing enormous efforts and continue improving their cells, chemistry, pack design, and battery management toward zero battery fires since EVs are that emerging technology that all manufacturers wish to accelerate.
5.3.5 Thermal Management
Lithium-ion batteries’ cycle life or capacity is considerably affected by operating temperature owing to irreversible chemical reactions. Thermal management systems monitor and control the battery pack temperature at certain locations. Cooling systems are also designed to maintain a uniform temperature distribution in the battery packs to avoid battery aging via hot spots.
5.3.5.1 Temperature Sensing and Estimation
The temperature of a battery cell or a pack can be directly measured using thermocouples. Despite this simple principle, there are two major concerns on temperature monitoring: (1) whether the measured temperature can be representative of the whole cell, and (2) how many sensors are required to monitor all the batteries inside a pack.
For a relatively small cell (e.g., 18650 type), the Biot number3 of the battery cell is small, suggesting that the heat transfer at the surface is much smaller than the internal heat transfer by conduction. Hence, no significant temperature gradient inside the cell is expected, meaning that measured temperature can be considered as cell temperature. However, as reported in literature (Forgez et al., 2010; Lin et al., 2013; Kim et al., 2014) for a relatively large cylindrical battery (e.g., 26650 type), core temperature can be considerably higher than surface temperature.
Cost constraints do not allow the temperature measurements of all the cells in a pack limiting the onboard monitoring and state awareness (Lin, 2014). Thermal nonuniformity inside battery cell and across packs requires temperature estimators utilizing control-oriented battery thermal models such as lumped parameter model (Forgez et al., 2010; Lin et al., 2013; Debert et al., 2013) and reduced order model (Kim et al., 2013). The combination of estimators and optimal deployment of temperature sensors under frugal sensing can provide the real-time information to guide and adapt computationally compact thermal models that can propagate the sparse temperature sensing to the entire pack and inform the battery management and power limits even under aged cell conditions (Lin, 2018).
Beyond thermal management under normal conditions, temperature monitoring is extremely important for detecting and diagnosing faults and irregularities like fast degradation through increased cell resistance (Lin et al., 2013) or malfunctioning of the cooling system (Kim et al., 2013). Temperature sensing for safety measures against thermal runaway, however, is too slow, and other sensing requirements will increase cost but dramatically improve mitigation actions, improve first responders’ response, and reduce the impact of EV accidents. Comprehensive analysis and improvements in sensing will be required as EV market penetration increases and as a transition occurs to more reactive and energy dense material (e.g., nickel) and away from cobalt. Many committees are currently working on safety standards (e.g., SAE International, 2014). Additional efforts are needed in workforce development and consumer education for the operation, transportation, storage, and disposal of EVs.
5.3.5.2 Cooling Systems
Thermal management for heating and cooling of lithium-ion batteries relies on the existence of auxiliary systems using a medium such as fluid (air or liquid), solid, or phase change material. The thermostatic control, one of the heuristic or rule-based control techniques, has been widely employed for temperature regulation. The basic idea of the thermostatic control is that cooling is applied when the measured temperature exceeds a target maximum temperature. The cooling control (fan-off or pump-off) is turned off when the measured temperature falls below another temperature threshold. Model predictive control can provide optimal and smooth cooling or heating if a good preview of low load or high load demands are predicted accurately (Zhu et al., 2018).
Fluids such as air and liquid are commonly used as a heat transfer medium for thermal management. Air is in direct contact with modules for heat transfer whereas liquid can be in either direct or indirect contact with modules—for example, submerging modules in a dielectric fluid or placing a heat sink plate between the modules. It can be found that there is a trade-off between the heat rejection and power consumption for cooling. Moreover, these performances are influenced by design factors such as the number of cells in series and parallel in the cooling circuit, along with the size of the gap between cells and arrangements. Parallel cooling is advantageous to minimize cell-to-cell variations of temperature, and temperature nonuniformity, which is important to minimize localized degradation in the module or pack. Toyota Prius and Ford Fusion use a parallel cooling for thermal management by supplying the conditioned air from the cabin. Moreover, a parametric study has been conducted to optimize design parameters for both air and liquid cooling systems (Park and Jung, 2013), wherein it was reported that a liquid cooling system consumes much less power compared with an air-cooling system owing to better thermal properties of liquid and high heat exchange efficiency of the radiator. Nevertheless, air cooling involves simple design, lower cost, easier maintenance, and shorter warm-up period over liquid cooling. Mahamud and Park (2011) proposed a method using reciprocating air flow to achieve uniform temperature
___________________
3 Biot number (Bi) is the ratio of heat convected to the surroundings to heat conducted to the surface.
distribution across a battery pack. It was shown that a reciprocating flow method can reduce the cell temperature difference of the battery system by about 4°C (72% reduction) and the maximum cell temperature by 1.5°C compared to the unidirectional flow case.
Phase change material can be an alternative option for heat transfer material. This option is advantageous in terms of efficiency since parasitic power consumption can be removed by using the latent heat of phase change (solid to liquid) at constant temperature or the melting point. Even though this method is beneficial to obtain the minimum temperature distribution in a battery module or pack, there are several concerns associated with the increase of volume and weight of the system owing to phase change material (Bandhauer et al., 2011). Moreover, warm-up of the battery in cold temperature would be difficult owing to the low thermal conductivity of phase change material.
Most existing or planned thermal auxiliary systems depend on a combination of fluid and solid media for an effective heat conduction from the cells to a cooling system.
5.3.5.3 Cold Weather Packages for Light-Duty EVs
Light-duty EVs are reported to have lower range in cold weather owing to lower powertrain efficiency and higher energy consumption for cabin heating. To mitigate this issue, some automakers include the so-called cold weather package into their standard model or as an additional option for customers in cold weather regions. Additionally, battery capacity and charging speed decrease in cold weather. Reduction in range from battery capacity decrease and resulting reduction in trips that can be completed is compounded by the reduced capability to extend range via charging. Slow EV charging in cold weather may be especially unacceptable to drivers as a long wait in a cold car may be unpleasant or dangerous. Even with the availability of optional cold-weather upgrades, automakers want their vehicles to be sellable and drivable in all climates in the United States. The impact of weather on range and charging may mean that longer electric ranges are more cost-effective in cold regions.
In 2018, GM had a survey for its Chevy Bolt and Volt EV owners to inquire about their preference on the different Cold Weather Packages with suggested prices (Malone, 2018). The Cold Weather Package usually consists of a dedicated battery heater, a heat pump system, and multimode thermal management. A dedicated battery heater can warm up the battery pack indirectly by heating the liquid coolant and running the warmer liquid coolant through the pack. A smaller liquid cooler volume typically through a shorter circuit is utilized for more effectiveness and speed of response. Warming up the battery enables higher regenerative braking and faster charging that is typically reduced at low temperatures owing to the slow diffusion and associated propensity of lithium to plate instead of intercalating in the anode material (graphite). In both cases, the vehicle range improves. The heater can be powered by the charger but the fastest way to heat up the pack is to discharge it and generate heat through internal Joule heating (I2R) (Vlahinos and Pesaran, 2002). Using the battery discharge current to power the heater can double the effectiveness and speed up the time to reach a bulk temperature threshold (Mohan et al., 2019). Once this temperature threshold is achieved, the battery can be charged quickly and safely from the charger or high currents from regenerative breaking.
Many automakers, including Tesla, suggest immediately plugging the car into the charger to maintain a room temperature and avoid the lengthy warm-up process. Trickle heating is, however, energy consuming owing to the ambient heat dissipation and wasteful if applied during long periods of parking or storage. Again, discharging some of the energy stored in the battery is the fastest and most efficient way to warm up and condition the battery before charging it up.
Replacing a resistive heating system with a heat pump in an EV can reduce the energy consumption for cabin heating, which is critical in cold weather. A heat pump is more effective than a resistive heating system in that it extracts the heat from outside instead of generating heat itself (Hu et al., 2020). A multimode thermal management system can have different system settings to optimize for different temperatures. For example, Hyundai Kona model year (MY) 2019 (Nisewanger, 2018) includes three coolant loop modes, for mild, hot, and cold temperatures. For other EV models, Tesla Model Y includes a heat pump and a battery heater as a standard while the Kia Soul has both a heat pump and battery heater as additional options.
5.3.6 Battery Pack Cost
Reflecting the battery innovations discussed above, battery cost estimates are drawn from various battery cost reports as well as information from various automakers and other experts. The battery pack cost is a critical factor for the future prospects of EV adoption, owing to it being a high fraction of the EV cost. Average battery pack prices have declined by at least 80% within 10 years: DOE indicates that battery pack prices declined from more than $1,000 to $197/kWh from 2008 to 2018 (Simmons and Chalk, 2019; DOE, 2019a), and an industry survey indicates that the cost decline was $1,160 to $176/kWh, from 2010 to 2018 (Goldie-Scot, 2019). Technological improvements in cell chemistry, cell design, pack design, and manufacturing have resulted in higher energy density and lower costs than predicted: to provide context for how these cost reductions have greatly exceeded earlier projections, the National Research Council (NRC, 2013) estimated that average battery costs would still be $200–$250/kWh in 2030 and reach $175–$200/kWh by 2050.
Table 5.10 summarizes recent applicable technical studies that quantify EV battery pack costs for continued advances in battery technology and volume. These studies are state of the art in terms of offering transparent bottom-up engineering and manufacturing analysis with specificity on lithium-ion battery chemistries and production volume and include details on battery pack production (e.g., material, cell, and pack costs; cost versus production volume; bottom-up cost engineering approach). The table also includes automaker statements from Volkswagen, GM, and Tesla.
The battery pack costs from these studies and automaker announcements pertain to 2018 through 2030. They generally assume production volumes of 100,000 EV battery packs per year for 2020 and 500,000 units per year for 2025. For context, there were five battery suppliers in 2018 that supplied batteries for at least 200,000 EVs (Lutsey et al., 2018). Several of the estimates indicate that costs will decline to $120 to $135/kWh by 2025. The research studies are corroborated by several industry statements. Tesla (2018), reaching higher volume more quickly than others, indicated that it will reach $100/kWh much sooner, and Berckmans et al. (2017) found that even greater
TABLE 5.10 Technical Reports and Automaker Statements on EV Battery Pack Cost
| Type | Report | Battery Specifications and Cost Elements Included |
|---|---|---|
| Technical reports | Ahmed et al. (2018) | Pouch NMC 6,2,2-graphite, production volume-based; includes total cost to automaker for material, process, overhead, depreciation, warranty. |
| Anderman (2017) | Cylindrical 21700, NCA 83,13,4, production volume-based; includes cost of material, capital, pack integration, labor, overhead, depreciation, R&D, administration, warranty, profit. | |
| Anderman (2018) | Pouch NMC 8,1,1-graphite, production volume-based; includes cost of materials, capital, pack integration, labor, overhead, depreciation, R&D, administration, warranty, profit. | |
| Berckmans et al. (2017) | Pouch NMC 6,2,2-graphite anode, production volume-based; includes material, process, labor, overhead, depreciation, profit. | |
| Pouch NMC 6,2,2-silicon alloy anode, production volume-based; includes material, process, labor, overhead, depreciation, profit. | ||
| UBS (2017) | Pouch NMC 6,2,2-graphite, production volume-based; includes material, process, labor, overhead, depreciation, profit. | |
| Automaker statements | Davies (2017) | Volkswagen statement. Associated with planned production volume of 100,000 per year by 2020 for I.D. series. |
| Lienert and White (2018) | GM statement related to Chevrolet Bolt (NMC 6,2,2); associated time frame for production volume has not been stated. | |
| Tesla (2018) | Tesla statement related to Model 3 production volume of 500,000 with Panasonic battery production (cylindrical 21700, NCA 83,13,4) in Nevada by 2020. |
NOTE: NCA = nickel cobalt aluminum; NMC = nickel manganese cobalt oxide (numbers refer to the proportion of each element).
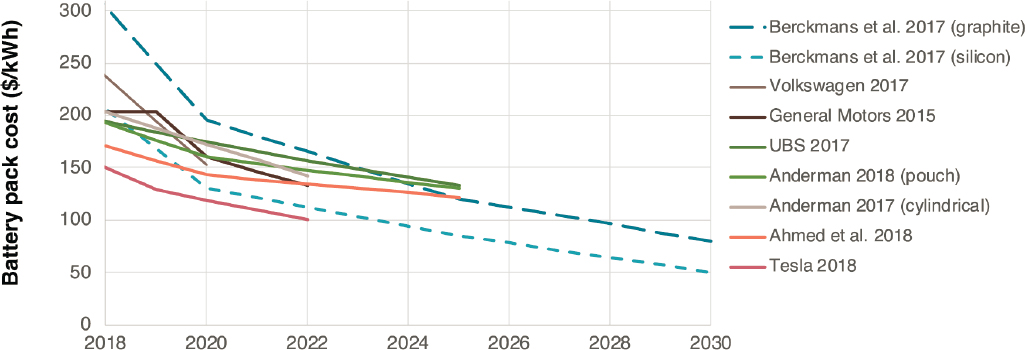
SOURCE: Modified from Lutsey and Nicholas (2019a).
battery cost declines will occur. An industry survey by Bloomberg New Energy Finance (BloombergNEF) projects a volume-weighted average battery cost reduction from $176/kWh in 2018 to $62/kWh in 2030 (Goldie-Scot, 2019). In addition, Tesla’s October 2020 battery analysis indicates the viability of high-volume production battery pack costs reaching approximately $50/kWh in the 2025–2030 time frame (P3, 2020).
Figure 5.27 shows findings from the studies cited above in Table 5.10 to illustrate the likely range of battery pack costs for 2020 to 2030. Several estimates indicate that battery pack costs will decline to $130–$160/kWh by 2020 to 2022, and then to $120–$135/kWh by 2025. However, Tesla states it will reach $100/kWh by 2022, associated with its NCA-based battery pack technology and based on its earlier high-production volume. Berckmans et al. (2017) find that even greater battery cost declines can be achieved with NMC cathode batteries, if the anode can transition from the 2018-dominant graphite to a silicon alloy while overcoming cycle-life issues.
The estimates of overall vehicle prices in the chapter summary (Section 5.5) are based on these references and a baseline 2018 average battery cost of $128/kWh at the cell level, and $176/kWh at the pack level (for a 45-kWh battery pack). The assumption for projected 2030 costs is that incremental improvements to current Li-ion technology will result in ~7% cost reduction per year. This level of cost reduction includes battery improvements in lithium-ion technology as described above, pack manufacturing improvements, and a shift to high-production volume (battery suppliers serving 500,000 EVs per year). Although battery costs are reduced by 7% per year from 2018 through 2030, the precise cell and pack costs will differ by battery pack size. Based on these assumptions, high-volume battery production is expected to decrease battery pack costs to $90–$115/kWh by 2025 and $65–$80/kWh by 2030. To apply battery cost estimates for the vehicle-level costs in the summary section, we apply a decreasing pack-to-cell cost ratio with increasing pack capacity. Our pack-to-cell cost ratio ranges from 1.54 for a 16 kWh pack down to 1.20 for 112 kWh and larger packs, based on Safoutin et al. (2018). This means larger battery packs (e.g., for a 300-mile range sport utility vehicle [SUV]) have lower per-kilowatt-hour pack costs, compared to smaller packs.
5.3.7 Findings and Recommendations for Battery Technologies for EVs
FINDING 5.5: Innovation in materials, components, and packaging is required for improvements in cost and energy density of EV batteries. Lithium-ion batteries, thanks to incremental improvements in materials, supplier competition, and production scale, will be the dominant battery technology in 2025–2035. Further improvements toward “beyond lithium ion” technologies all require breakthroughs that are not guaranteed. Advances in solid-state electrolytes may become commercially relevant after 2030 and could enable the use of lithium metal anodes, which have an extremely high theoretical specific capacity of 3860 mAh/g.
FINDING 5.6: EV batteries are generally composed of cells, modules, and a pack. A cluster of cells makes a module, and a cluster of modules makes a pack. While material improvements (Finding 5.5) are related to the cell-level, pack-level improvements such as wiring and balancing, cooling, and BMS advances will be critical (to meet projected costs) as well.
FINDING 5.7: Battery degradation affects ownership costs and consumer acceptance of plug-in electric vehicles. Relative to laboratory-based estimation, battery degradation under real-world driving is less understood. It is challenging to leverage laboratory aging data to predict the remaining useful life under real-world driving and charging patterns that involve mixed operating conditions, various temperatures, powers, depth of discharge, and voltage.
RECOMMENDATION 5.2: Evaluation of battery life in distance and calendar years should be conducted with real-world driving in mind. The U.S. Department of Energy Vehicle Technologies Office (VTO), in collaboration with the private sector, should investigate real-world battery life for battery EVs and plug-in hybrid electric vehicles using simulation and testing. Results from these studies will inform VTO’s battery research investments and target setting, impact flexible design of the new corporate average fuel economy standards, and potentially lead to greater consumer acceptance and faster market penetration of plug-in electric vehicles.
FINDING 5.8: With an increasing emphasis on improving battery energy density, and extending range and performance, some automakers are currently considering new chemistries and new battery management systems to address safety concerns, which could result in increased battery costs.
FINDING 5.9: Although EV fires have attracted attention and raised safety concerns among some consumers, statistical comparison of fire incidents (between battery electric vehicles and internal combustion engine vehicles of all ages) suggests that EVs may be less prone to fire incidents than conventional vehicles. However, the slow and hidden evolution of an internal battery fault is still an issue that needs to be addressed.
RECOMMENDATION 5.3: Efforts by automakers to pack more energy density into EV batteries and speed up charging, motivated by both consumer demand and policy incentives, should be matched with efforts to understand, detect, mitigate, and manage fire risks. The National Highway Traffic Safety Administration in collaboration with the U.S. Department of Energy and automakers will need to lead an effort on advancing battery electric vehicle system safety, and preventing and responding to battery failure.
RECOMMENDATION 5.4: Comparison of fire safety between battery electric vehicles (BEVs) and internal combustion engine vehicles (ICEVs) needs to be further studied, especially between BEVs and ICEVs at similar ages, and between BEVs with different chemistries, battery management system designs, vehicle classes, charging rates, and electric ranges, and even over time between BEV product generations.
5.4 ELECTRIC CHARGING INFRASTRUCTURE
A charging infrastructure for PEVs can be viewed as a technology to reduce fuel consumption of on-road light-duty vehicles. Rather than directly improving fuel efficiency, as with ICE efficiency technologies, a better charging infrastructure allows more charging events, by existing PEVs or new PEVs. Better charging infrastructure permits more electricity to contribute to the total energy needed to power total vehicle miles traveled (VMT), thus reducing the average per-mile fuel consumption of on-road light-duty vehicles. Better charging infrastructure also alleviates range anxiety and encourages adoption of BEVs, resulting in more vehicle miles being powered by electricity. A charging infrastructure consists of a network of chargers, as simple as a regular 120 V power outlet or as sophisticated as a high-power charging station, at different locations to allow PEVs to be safely recharged with grid electricity and to extend vehicle driving range. Dedicated electric charging stations serve a similar role
TABLE 5.11 EV Charging Infrastructure Specifications in the United States
| Charging Level | Input Voltage (V AC) | Typical Power (kW AC) | Electric Vehicle Range per Charging Hour (miles) | Location |
|---|---|---|---|---|
| Level 1 | 120 | 1.2–1.4 | 3–4 | Primarily home, some workplace |
| Level 2 | 208–240 | 3.3–6.6 | 10–20 | Home, workplace, and public |
| DC fast | 400–1000 | 50 or more | 150–1000 | Public, frequently intercity |
NOTE: AC = alternating current; DC = direct current; kW = kilowatt; V = volt.
SOURCE: Nicholas (2019).
to gasoline stations, but the overall charging infrastructure has an advantage in that the ubiquity of the electric grid and charging capability at different power levels allows electric chargers to be installed at private homes, residential communities, workplaces, customer parking areas of business entities or any institutions, or dedicated parking garages. This diversity of charging location, power and time options, and associated accessibility has profound implications with respect to technical attributes, costs, impact on VMT electrification and PEV adoption, the infrastructure need, and usage behavior. In general, when the charging infrastructure becomes more powerful, affordable, available, and convenient, more PEVs will be adopted and more charging events will occur, resulting in more VMT powered by electricity and fewer by petroleum energy. Business models for charging infrastructure are not yet clear or well understood. It is clear, however, that the improvement of charging infrastructure requires investment. The key questions are when, where, how many, and with what technologies to invest and deploy more chargers to achieve the most cost-effective energy impact.
5.4.1 Electric Charging Infrastructure Technologies and Costs
5.4.1.1 AC Level 1, AC Level 2, and DC Fast Chargers
For a given electric range, longer available charging time at some locations (e.g., at-home overnight charging) allows less-expensive, low-power charging. Other locations or travel contexts make high-power charging necessary (e.g., stopping for recharges during long-distance or urgent trips, or complete dependency on public charging owing to lack of access to home charging). As a result, a wide range of charging technologies, largely differentiated by charging power, have been developed and are being deployed. In this chapter a charger is defined as the electric device necessary to connect a PEV with the existing power grid to achieve safe charging. It can be in the form of a charging cable connecting the vehicle directly to a 120 V power outlet, or an electric vehicle supply equipment (EVSE) connection, or a wireless charging pad. The three most common types of charging technologies—AC Level 1, AC Level 2, and DC fast chargers4—are the focus of this report, as they are expected to dominate the charging infrastructure in 2025–2035 (Engel et al., 2018b; Nicholas, 2019). Their voltage, power, distance extended per charging hour, and typical application locations are summarized in Table 5.11. Note that even with the most powerful DC fast charging, the charging speed is still far lower than gasoline refueling at about 250 miles per minute.5 Other charging technologies, including static or dynamic wireless charging, extreme fast charging (xFC), and battery swapping, are not expected to be mature enough or widely deployed to have significant impacts during 2025–2035.
A key distinction between Level 1 or 2 AC and DC fast charging is the location of the AC-DC converter. A battery can only be charged directly with DC electricity. Most PEVs are equipped with an onboard converter (called a charger in Figure 5.28) to accept 120 V–240 V AC electricity from the grid and convert it to DC electricity to
___________________
4 The schematics of these charging technologies can be found in Smith and Castellano (2015).
5 Assuming 10 gallons per minute of maximum dispensing flow rate according to 40 CFR 80.22 through 80.33 and the average fuel economy of 25 MPG for MY 2019 new vehicles (EPA, 2020).
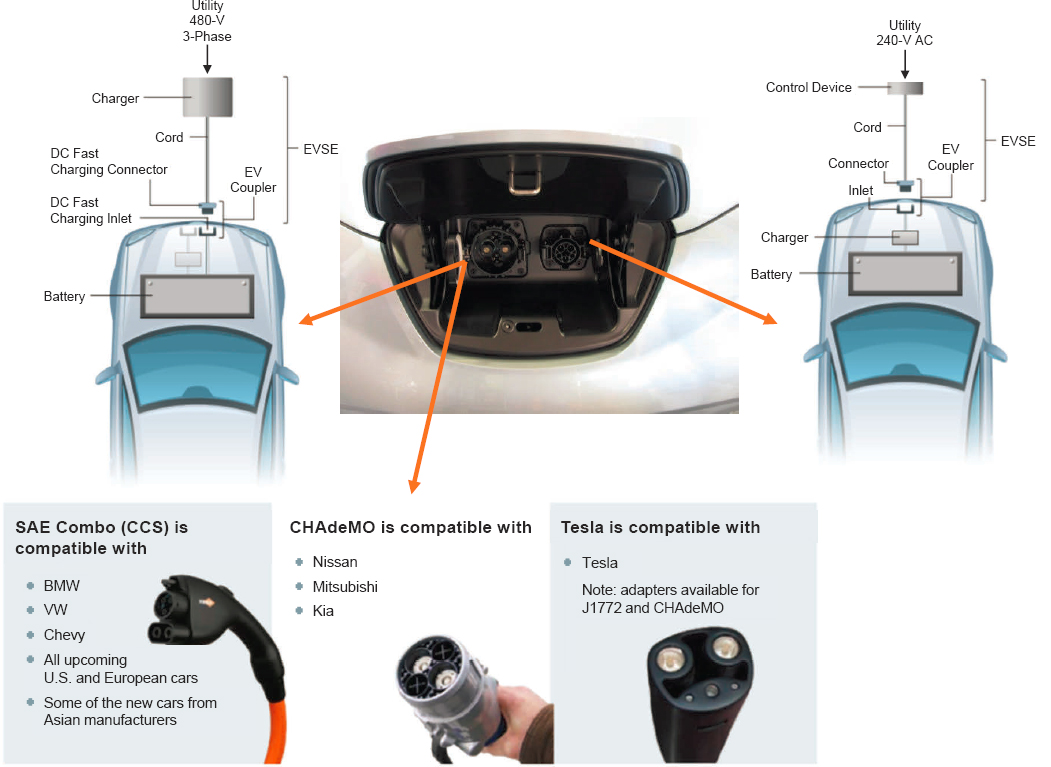
SOURCE: Clean Cities (2012).
charge the battery. In contrast, DC fast chargers have built-in converters and directly provide DC electricity that bypasses the onboard converter and feeds into the battery. Many PEV models are equipped with two charging inlets—one for AC and one for DC, as shown in Figure 5.28. In terms of connector design, most PEV models in the United States adopt the SAE 1772 for Level 1 and 2 AC charging. For DC fast charging, there currently are three types of connectors—SAE Combined Charging System (CCS), CHAdeMO, and Tesla—shown in Figure 5.28. The SAE CCS combines single-phase AC, three-phase AC, and DC high-speed charging in a single set of charger, connector, and inlet system, making it compatible with PEV models in both the United States and Europe. Adaptors are available to connect otherwise incompatible EVSE. The lack of a uniform charger interface standard means a need for multiple charger networks and has implications on infrastructure costs and user convenience. Efforts are ongoing to harmonize these different standards (e.g., Buckley, 2011; ANL, 2020; Wolbertus et al., 2020; EPRI, 2019).
The differences among Level 1 AC, Level 2 AC, and DC fast charging affect location availability and required hardware upgrades. In a sense, the electric charging infrastructure is already ubiquitous for Level 1 AC, as PEVs can charge directly with a regular 120 V power plug. Level 2 AC requires a 240 V power plug, which is available with commercial buildings and in residential units, usually for electric dryers but also in garages outfitted for PEV readiness. Installing a 240 V plug and the associated wiring in a home or public garage is much cheaper during new construction than in retrofitting an existing building or garage. The International Code Council has approved
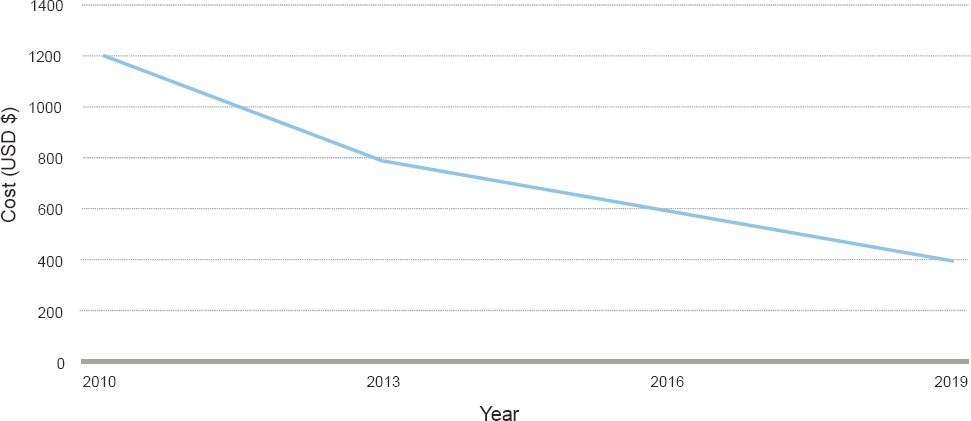
SOURCE: RMI, from Nelder and Rogers (2019).
the 2018 International Energy Conservation Code that recommends installation of the electrical requirements in all new homes to make them “EV-ready.” For single-family homes, that means installing the panels, outlets, and conduits. For multifamily buildings, the code calls for two “EV-ready” parking spots and some “EV-capable” spots. Such an EV-ready home recommendation has been adopted by an increasing number of localities, such as Atlanta, Denver, and some parts of California (Energy Star, 2020; SWEEP, 2020). Some cities or states have enacted or proposed legislation requiring public parking garages, if to be constructed or renovated, to be EVSE ready. For example, “Electric vehicle charging stations in open parking lots and parking garages,” a law passed in 2013 by the City Council in New York, requires that a minimum of 20% of parking spaces in new-construction open lots (or older lots being upgraded) be readied for EV charging (New York City Council, 2013). Specifically, the law requires the spaces to be embedded with at least 1-inch conduit that can support later installation of an EVSE to an electric supply panel with ≥ 3.1 kilowatts of capacity. An EVSE is usually needed to connect the PEV’s Type 2 inlet with the 240 V power plug or source. DC fast charging stations require 480 V power sources that are available typically only in industrial or commercial settings. Installation of DC fast charging stations may vary in cost by tens of thousands of dollars depending on readiness of the site (Smith and Castellano, 2015).
More powerful chargers are generally more expensive owing to the higher manufacturing costs for charger components with higher amperage ratings. The cost of owning and installing chargers can be largely categorized in the equipment capital cost, the installation cost, and the operation and maintenance cost. Networked chargers can be connected to the internet and monitored and controlled remotely, including implementation of pricing mechanisms and charging location discovery for customers. Table 5.12 shows charger hardware costs for various charging options in 2019. For context, the cost of a commercial-use Level 2 charger in 2011 was estimated to be $1,875–$4,500 (in 2009$, or $2,234–$5,362 in 2019$) (NRC, 2013), indicating only a small reduction in cost from 2011 to 2019. Meanwhile, the cost of a home-use Level 2 charger has decreased by 67% from 2010 to 2019 (Nelder and Rogers, 2019). Despite a clear decline in the hardware costs of Level 2 residential chargers over the past decade (Figure 5.29), cost reduction seems slower for commercial-use chargers based on the above literature, for reasons unknown.
Installation costs estimated by the International Council on Clean Transportation (ICCT) are shown in Table 5.13 for workplace and public Level 2 chargers and in Table 5.14 for DC fast chargers. The data in both tables demonstrate that the per-charger installation cost can decrease significantly with increasing the number of chargers per site. Charger lifespan, a key parameter for calculating total cost of ownership, is not well understood.
TABLE 5.12 Cost Ranges for Chargers and Infrastructure Components
| Cost Element | Lowest Cost | Highest Cost |
|---|---|---|
| Level 2 residential charger | $380 (2.9 kW) | $689 (7.7 kW) |
| Level 2 commercial charger | $2,500 (7.7 kW) | $4,900 (16.8 kW); outlier: $7,210 (14.4 kW) |
| DCFC (50 kW) | $20,000 | $35,800 |
| DCFC (150 kW) | $75,600 | $100,000 |
| DCFC (350 kW) | $128,000 | $150,000 |
| Transformer (150–300 kVa) | $35,000 | $53,000 |
| Transformer (500–750 kVa) | $44,000 | $69,600 |
| Transformer (1000+ kVa) | $66,000 | $173,000 |
| Data contracts | $84/year/charger | $240/year/charger |
| Network contracts | $200/year/charger | $250/year/charger |
| Credit card reader | $325 | $1,000 |
| Cable cost | $1,500 | $3,500 |
NOTE: DCFC = direct-current fast chargers; kVA = kilovoltampere.
SOURCE: RMI (2019).
Operation and maintenance costs are typically assumed as a percentage of the equipment capital cost, ranging from 1%–7% (Serradilla et al., 2017), and also need further studying.
Besides the costs of equipment, installation, and maintenance, the costs of charging infrastructure are also affected by electricity cost, which in turn is affected by time of use. The total cost of the charging infrastructure system also depends on its scale, the number of PEVs, and the total electric vehicle miles traveled (eVMT). The total infrastructure cost can be divided by the total electricity consumption to estimate a levelized cost (in $ per kWh) that can be easily compared to electricity prices. Including home, workplace, and public charging equipment costs and electricity prices, the levelized cost of charging has been estimated at $0.15/kWh for light-duty BEVs (assuming a charging mix of 13% residential Level 1, 68% residential Level 2, 14% workplace or public Level 2, and 5% DC fast charging) and $0.14/kWh for light-duty PHEVs (assuming a charging mix of 40% residential Level 1, 41% residential Level 2, and 19% workplace or public Level 2) on average in the United States.
5.4.1.2 Extreme Fast Charging
One major technology direction is xFC, typically aimed at 400 kilowatt (kW) or higher of charging power, which is equivalent to extending about 200 miles of driving in less than 10 minutes (DOE, 2017). xFC could achieve similar convenience as gasoline refueling. This goal is natural but perhaps unnecessary, since most of
TABLE 5.13 Installation Costs per Level 2 Public and Workplace Charger, by Chargers per Site, California Only
| 1 Charger per Site | 2 Chargers per Site | 3–5 Chargers per Site | 6+ Chargers per Site | ||
|---|---|---|---|---|---|
| California | Labor | $2,471 | $1,786 | $1,491 | $1,747 |
| Materials | $1,235 | $958 | $1,014 | $908 | |
| Permit | $283 | $172 | $110 | $65 | |
| Tax | $156 | $121 | $128 | $115 | |
| Total | $4,148 | $3,039 | $2,745 | $2,837 |
SOURCE: Nicholas (2019).
TABLE 5.14 Installation Costs per DC Fast Charger by Power Level and Chargers per Site
| Power Level (kW) | Chargers per Site | Labor | Materials | Permit | Taxes | Total |
|---|---|---|---|---|---|---|
| 50 | 1 | $19,200 | $26,000 | $200 | $106 | $45,506 |
| 2 | $15,200 | $20,800 | $150 | $85 | $36,235 | |
| 3–5 | $11,200 | $15,600 | $100 | $64 | $26,964 | |
| 6–50 | $7,200 | $10,400 | $50 | $42 | $17,692 | |
| 150 | 1 | $20,160 | $27,300 | $210 | $111 | $47,781 |
| 2 | $15,960 | $21,840 | $158 | $89 | $38,047 | |
| 3–5 | $11,760 | $16,380 | $105 | $67 | $28,312 | |
| 6–20 | $7,560 | $10,920 | $53 | $45 | $18,577 | |
| 350 | 1 | $27,840 | $37,700 | $290 | $154 | $65,984 |
| 2 | $22,040 | $30,160 | $218 | $123 | $52,541 | |
| 3–5 | $16,240 | $22,620 | $145 | $92 | $39,097 | |
| 6–10 | $10,440 | $15,080 | $73 | $62 | $25,654 |
SOURCE: Nicholas (2019).
the eVMT will be powered by electricity from home, workplace, or secondary6 fast (6–60 kW) public charging. In these charging events, the cost per unit of time for the traveler is lower than that for gasoline refueling, where the traveler needs to dedicate all attention to the refueling activity. The total time value associated with electricity charging and gasoline refueling may be a better metric of comparison. From this perspective, it is worth questioning how many PEV drivers will need 400 kW of charging power and for those who will, how often. Occasional urgent needs for fast charging may not require a full charge of 200 or more miles. If the need is for a quick extension of, for example, 50 miles in order to arrive at home or another charger location with ample dwell time, the required power for 10 minutes of charging is only 90 kW (assuming 0.3 kWh/mile of electricity rate for driving). Enabling more miles to be extended is certainly valuable, but the value of additional miles charged diminishes—that is, the next additional 50 miles charged is less valuable than the first 50 miles charged. However, the presence of xFC may be perceived as an assurance for usability of the BEV at any time, critical at least for some buyers, and thus motivates BEV adoption.
While xFC can be valuable for PEV operation, it may or may not be cost effective, depending on the additional cost required for technology improvements. After all, profitable business models for 100 kW DC fast chargers are yet to be proved, not to mention for 400 kW xFC, which are presumably more expensive than the current DC fast charging systems. Two types of xFC systems are being pursued, with important cost implications. One is an AC-connected system, where a low-frequency step-down transformer interfaces between the medium-voltage distribution network and a three-phase AC bus, providing 250–480 line-to-line voltage to each charger at the charging station. Such systems use mature technologies but are bulky, complicated, and expensive, especially in public places where the step-down transformer has not been built. Another technology direction under development, xFC chargers based on DC-connected systems (using a single front-end AC/DC converter rather than one with each charger; see Figure 5.30), could potentially reduce costs and footprints and increase system efficiency, especially with the use of a solid-state transformer. xFC infrastructure costs are not well understood. The equipment cost per xFC charger was estimated to be $245,000 based on early prototypes (Francfort et al., 2017), about 4–10 times the cost of current DC fast chargers, but it is expected to reach similar cost levels of the current DC fast charging systems (Borlaug et al., 2020).
___________________
6 As opposed to charging as the main trip purpose. When the driver has a main trip purpose such as eating lunch or shopping, the concurrent charging event is viewed as a secondary trip purpose.
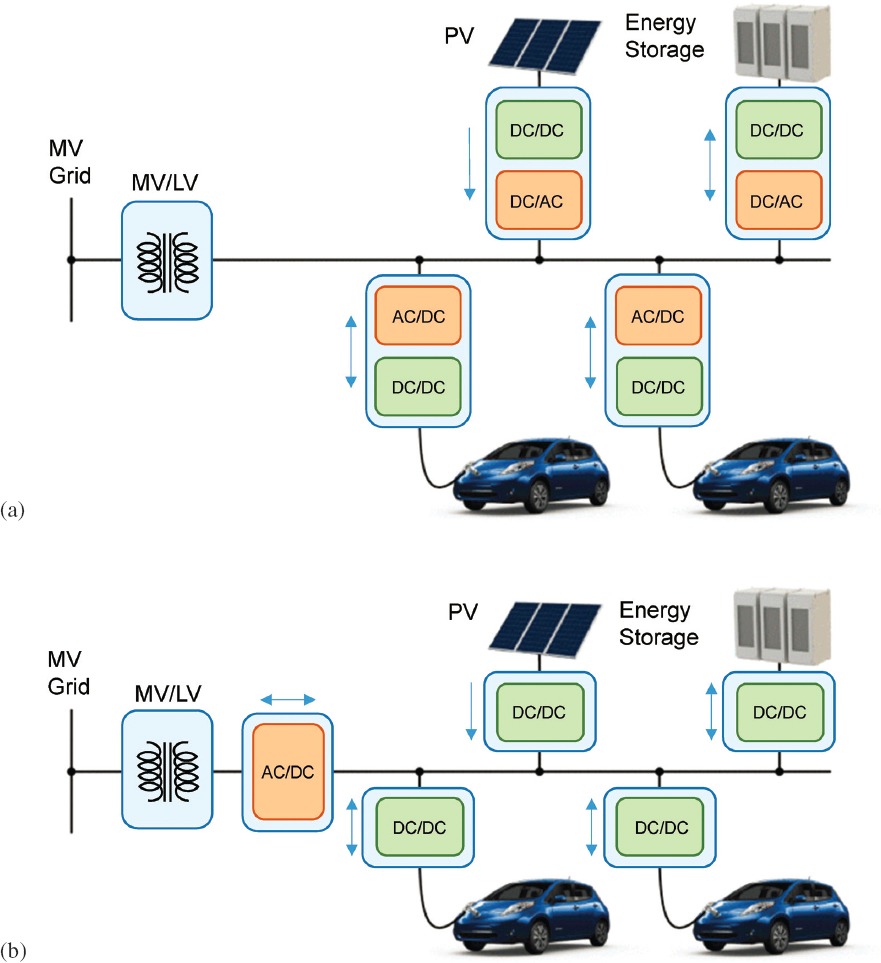
NOTE: LV = low voltage (mains voltage); MV = medium voltage (distribution voltage, 2–35 kV); PV = photovoltaic.
SOURCE: Reprinted with permission from Tu et al., 2019, Extreme fast charging of electric vehicles: A technology overview, IEEE Transactions on Transportation Electrification 5(4):861–878, https://doi.org/10.1109/TTE.2019.2958709; © 2019 IEEE.
In addition to cost uncertainty, there are technical challenges to xFC chargers, such as the impact of high power demand on the distribution system, stress and aging of distribution transformers, integration of multiple EVs with random charging demand while maintaining grid stability, communication between the xFC charging station and the existing grid system, lack of fast acting protective devices, lack of standards for xFC practices, adverse effect on battery degradation, higher requirements and costs for vehicle electric components owing to high current, and compatibility with non-xFC-capable PEVs. Solutions are being studied and developed, and include distribution system upgrades, smart charging techniques, and onsite storage (Nicholas, 2019).
5.4.1.3 Grid Impact
The electricity demand from PEVs will likely represent a small fraction of the total electricity demand in the 2025–2035 time frame. Incremental increase in generation capacity will be needed. From the perspective of PEVs reducing life cycle greenhouse gas emissions, it is critical that that added generation capacity comes from renewable sources and the existing generation capacity transitions to low-carbon technologies.
The main challenge will be for the transmission and distribution systems, especially for the residential feeder circuits and local transformers, to meet the power demand from a large number of PEVs charging at the same time, each expecting the rated power of the charger, altogether in the same grid subsystem, and even concurrently with peak demand from other electricity end-users (Clement-Nyns et al., 2010; Dharmakeerthi et al., 2014; Engel et al., 2018a; Nicholas and Hall, 2018). Simply put, the grid impact of PEVs is not an energy or kWh issue, but a peak power or kW issue. For the same feeder-circuit of 150 homes with 25% local EV penetration, for example, the local peak power load could increase by 30% if charging activities are not intervened. Public fast charging can be highly volatile. Unmanaged charging demand at a single DC fast charger could easily exceed the peak-load capacity of a residential feeder-circuit transformer. Multiple DC fast chargers together could easily require peak power capacity beyond the megawatt level. Three potential strategies for addressing these challenges are grid upgrades, demand management and off-peak charging, and onsite storage. These solutions only address the technical challenges of the power system from supply to demand as a whole. There are some challenges related to transactions and pricing between different entities of the system. For example, demand charge can be costly for fast charging, especially xFC during peak hours. In theory, grid upgrades could increase demand charge as they add to the upstream cost. Onsite storage could reduce demand charge but add to end-user (chargers) capital costs.
5.4.2 Electric Charging Behavior
Even when a charger is present, PEV drivers may or may not plug in; the probability of charging therefore depends not only on the availability of charging networks but also on the temporal and spatial nature of travel activities. There are many possible reasons for not needing a recharge when a charger is present, such as sufficient SOC, proximity to home, high fees, and energy cost. BEVs and PHEVs are distinct in this regard, as the decision to recharge when a charger is available is an economic issue (energy cost) for PHEV users but an operation feasibility issue for BEV users. Understanding charging behavior is crucial for assessing the cost-effectiveness of charging infrastructure improvements on increasing eVMT and PEV sales. Overall, charging activities could increase when the charging infrastructure becomes more powerful, affordable, available, and convenient.
Charging behavior may be reflected in charging activities. An Idaho National Laboratory study of the first mass-market PEVs, Nissan Leafs and Chevy Volts, showed that early Chevy Volt drivers powered more than 70% of their miles using electricity (utility factors [UF] of 0.72 and 0.75 for different model years with slightly different ranges; Smart et al., 2014). A more recent study exploring PHEV UF for various ranges of PHEVs in California found similar results for the Volt (35/38 mi range, 0.67 UF; 53 mi range, 0.68 UF) and lower UF for the plug-in Prius (11 mi range, 0.18 UF), Cmax (20 mi range, 0.41 UF), and Fusion (20 mi range, 0.35 UF) (Raghavan and Tal, 2020). The study also found that longer range vehicles charged farther from home. In the United States, “Public charge infrastructure usage was low (1.4 events per week) but was also very location dependent, some of the public charge stations had between 7 and 11 charge sessions a day. Public fast charging was used more intensively (7.2 charges a week)” (Raghavan and Tal, 2020). Utilization of the charging infrastructure grows with EV adoption (Wolbertus et al., 2016; Lee and Clark, 2018).
These observed charging activities do not reveal the underlying reasons of charging behavior and thus do not show to what extent charging activities, and the eVMT they enable, can be further motivated. BEVs have to be recharged to meet minimum travel needs, but more frequent charging of BEVs to accomplish more trips increases BEV utility for the owners. Charging frequency has to increase if the BEV range is shorter or long-distance trips are more frequent. Charging frequency can, but does not have to, increase if charging opportunities are more available. The downside is the increased physical and mental effort owing to more charging events (see discussion of charging convenience later), while the benefit includes feasibility of more affordable, shorter range BEVs
or better battery life owing to reduced numbers of deep charge-discharge cycles. A charging behavior survey by University of California, Davis, shows that, contradictory to the common assumption, BEV drivers do not plug in their vehicles every night, especially when free public charging motivates substitution for home charging (Nicholas et al., 2017). It is important to recognize the possibility that charging behavior may change significantly as a result of expansion of the charging infrastructure, behavior adaption, and consumer prioritization of cost and time in diverse contexts. More surveys and behavior analysis are needed.
In contrast to BEVs, PHEVs do not need to be recharged to be used. Surveys of early Chevrolet Volt adopters show that they are diligent in plugging in at home (Hardman et al., 2016), but it is unclear if that is owing to early adopter enthusiasm for advanced technology or environmental stewardship, or a conscious decision to save energy cost. In a PHEV, the cost saving is about 1.4 cents per mile when electricity replaces gasoline (assuming 45 miles per gallon [MPG], $2 per gallon, 0.3 kWh/mile, and $0.1/kWh). This translates into $0.56 of savings for each full recharge of 40 miles. If the effort of plugging in is perceived to be significant (e.g., pulling a charging cable in a disorganized garage or on a hot day), this cost saving may not be enough to motivate the charging action. This possibility seems to be reflected by the finding by University of California, Davis, that drivers of the Prius PHEV (13 miles of charge depleting range; discontinued) rarely recharged their vehicles. Their purchases were found to be motivated by obtaining the HOV lane access tag. Similarly, several studies indicated that PHEVs without home chargers in Shanghai were rarely plugged in and were purchased to avoid the high license fee of a gasoline-only vehicle (Ou et al., 2020; SHEVDC, 2017). When chargers are not widely available and each recharge saves so little money, consumers may lose the early adopter enthusiasm over time and skip recharging, especially when the gasoline price is low.
Charging convenience, shaped by technology, location, and management of chargers, affects charging behavior, PEV adoption, and business models. Technologies being developed for increased convenience include wireless charging and robotic charging. For example, DOE and Oak Ridge National Laboratory worked with industry to develop a 20 kW, 90% efficiency system (DOE, 2016), and Tesla has developed robotic charging stations (Yvkoff, 2019). Such technologies could also enable the use of autonomous EVs with autonomous charging. Convenience encompasses many factors that allow charging to be easy to use and worry-free for the consumer, including availability of chargers at desirable locations, charger station maintenance and functionality, ubiquity of chargers to prevent worry about finding a charger when traveling an unfamiliar route, redundancy of chargers to avoid charging congestion, and streamlined user experience enabled by connectivity and no-payment (free charging or free member use). Locations of chargers need to match the vehicle dwell locations and dwell time to maximize charging opportunities. Kontou et al. (2019) uses travel data to estimate the relationship between charger availability and charging opportunities and suggests that charger locations should be optimized to increase the probability of parked vehicles encountering chargers.
Business models for public EV charging are still uncertain, even 5 years after the publication of a previous National Academies report on EV deployment that extensively explored the EV charging business models (TRB and NRC, 2015). Public chargers are most often owned by a site (a shopping mall, hotel, apartment complex, etc.) or by a third party (e.g., a charging provider, electric utility, or an automaker). As noted above, charger utilization has been variable and mostly low for public chargers. Low utilization does not necessarily indicate a lack of utility for the charging facility owner, although it does indicate that business models based on high charging utilization and throughput may not be operative. Some chargers have been placed intentionally by networks of charging providers to provide range confidence or strategic range extension. Other existing charging siting may not be motivated to encourage charger use but rather may be motivated to encourage EV drivers to patronize a nearby business, or customers to perceive a business commitment to sustainability. The needs for public charging may still be nascent, with small volumes of BEVs on the road, and with unclear motivations for public charger placement, low utilization is not indicative of lack of future need for public charging.
Additionally, improved business models for public charging could improve the customer experience. User-friendly transaction interfaces could improve charging convenience. In theory, the combination of wireless charging, vehicle-to-charger connectivity, and autonomous payment (e.g., free charging or membership-type business models) could maximize the charging convenience during the transaction by making it essentially free of physical and mental efforts. Availability of charging infrastructure has been found to significantly affect adoption of PEVs, but the impact of charging convenience on PEV adoption and charging behavior requires further research.
Maness and Lin (2019) borrow insights from the marketing literature and use a modeling approach to demonstrate the impact of free charging on the adoption of PEVs. More research is needed on how consumers value more charging convenience with better technologies (e.g., wireless charging), better location (e.g., aligned with travel activities), and better management (e.g., free charging or membership unlimited charging).
5.4.3 Electric Charging Infrastructure Needs
Unlike biofuel- or hydrogen-powered vehicles, PEVs do not require a public charging infrastructure in order to be accepted by some consumers owing to the feasibility of home or workplace charging enabled by the existing electricity infrastructure. On the other hand, deployment of more (and more powerful) public chargers will increase feasibility and appeal of PEV products, and may be necessary for certain consumers including those who do not have access to a home charger or need public charging for long trips with a BEV as their primary vehicle. Therefore, the needs for the charging infrastructure can be estimated by understanding how and where PEVs are used and parked and where new PEV buyers are.
The total number of chargers needed has been estimated based on anticipated on-road PEV population and charging demands. However, the definition of “infrastructure needs” is still vague, as it is unclear whether these estimates represent the minimum, desirable, optimal, or ideal level of deployment for the given PEV population target. The shares of charging activities among home, work, and public chargers are not consistently assumed, possibly resulting in different estimates of needs for public chargers. According to the Alternative Fuels Data Center, as of September 20, 2020, there are 88,122 public charging outlets (at 27,129 charging locations) and 10,817 private charging outlets in the United States, excluding residential chargers (AFDC, 2020). This translates into about 0.06 charging outlets per PEVs on the road. A study by Edison Electric Institute found that 9.8 million charge ports are needed to support 18.7 million PEVs by 2030 (Cooper and Schefter, 2018; Figure 5.31). That equals 0.52 chargers per PEV overall, including about 0.12 non-home chargers per PEV, about double the current level. Based on this study, the International Code Council has adopted a new guideline that recommends all new homes in the United States to be EV-ready (Coren, 2020). According to ICCT, by 2025, about 2.2 million chargers (including
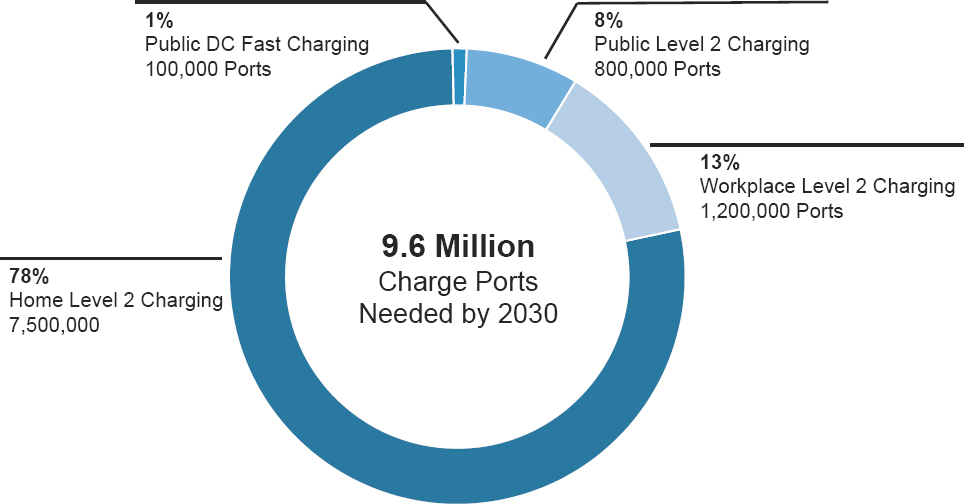
SOURCE: Cooper and Schefter (2018).
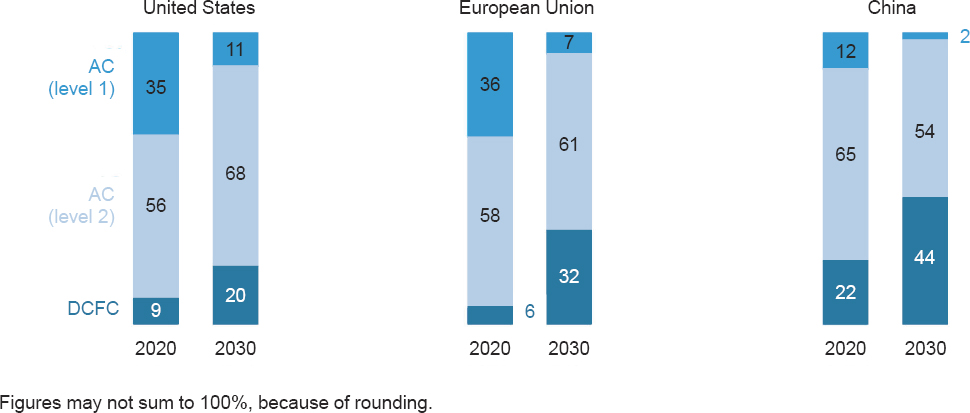
SOURCE: Exhibit from Engel et al., 2018, “Charging Ahead: Electric-Vehicle Infrastructure Demand,” August, McKinse & Company, www.mckinsey.com. Copyright © 2021 McKinsey & Company. All rights reserved. Reprinted by permission.
2.1 million for home charging) are needed for 2.6 million PEVs in the 100 most populous U.S. metropolitan areas. That equates to about 0.85 chargers per PEV, much higher than Edison Electric Institute’s estimate for 2030.
Home charging is widely viewed as most necessary, in both the number of chargers and the magnitude of electric load. Many studies have concluded that home charging is more cost-effective and important than workplace and public charging (Lin and Greene, 2011; Hardman et al., 2018; Lee et al., 2020a). Early EV charging activity data show that 82% of charging events were conducted at home (Smart and Schey, 2012). Edison Electric Institute estimates that by 2030, 78% of chargers will be home chargers. Similarly, McKinsey projects that by 2030 in the United States, about 80% of PEV electricity will come from home charging. These U.S. projections are much higher than the projected 68% and 60% for EU and China, respectively (Figure 5.32), possibly owing to the higher percentage of homes with garages in the United States. Long hours of home parking and the low time cost of home charging explain the importance of home charging, which makes inexpensive low-power charging feasible with residential distribution systems.
However, not every household or vehicle has easy access to home charging, as indicated by measures of dedicated home parking places, which can serve as a proxy for Level 1 AC charging availability. About two-thirds of all occupied housing units in the United States have garages or carports (Census Bureau, 2017), where 120 V outlets are usually available or inexpensive to add. More directly, more than half of new vehicle buyers in the United States park their vehicle within 25 feet of a 120 V power outlet (Axsen and Kurani, 2012). Although about 80% of households have off-street parking, only 56% of vehicles have a dedicated off-street parking space (with only 47% at an owned residence) (Traut et al., 2013). Thus, while much of the new vehicle market will have easy access to home charging, expanding the market to all vehicle buyers will require enabling PEV charging for those in dense cities or multiple-unit developments, where a higher proportion of drivers are unable to access dedicated home charging. According to several studies, a lack of home charging capability is perceived as one major barrier to PEV purchase (Ajanovic and Haas, 2016; Nilsson and Nykvist, 2015; Axsen and Kurani, 2013). Upgrades to Level 1 or 2 wiring to enable home charging can be expensive, depending on home circumstances, but are much cheaper if done during home construction or renovation. For those without dedicated parking spaces, available solutions include residential curbside Level 2 charging stations (Hall and Lutsey, 2017), on-street chargers (Grote et al., 2019), and residential driveway chargers (Traut et al., 2013). An alternative solution to lack of home charging access would be exclusive dependence on workplace or public chargers. However, reliance on non-home charging can be subject to high charging cost and inconvenience that could amount to significant vehicle operating cost over the vehicle lifetime (Ou et al., 2018).
Another important factor in evaluating the electric charging infrastructure needs is charging time. Level 1 (or even Level 2) home charging is usually regarded as too slow based on the calculation that a full recharge would take more than 25 hours even with a 100-mile electric range. This “tank refueling” reasoning likely stems from the experience of gasoline refueling, where the consumer needs to be attentive during gasoline refueling and thus loses the value of the few minutes of time during the refueling process. Similarly, if the driver would need to be attentive during the charging session, long charging hours would mean extremely high time cost, making the reduction of the charging time more important. However, if the value of per-unit time is low because the consumer is capturing the value of the time via other activities, such as sleeping during nighttime charging, the time cost may be significantly reduced and even ignored, making long hours of charging under these circumstances acceptably convenient. Then analysis should be based on whether the average and variation of travel distance can be accommodated by available charging time and power (Lin and Greene, 2011). Assuming 10 hours of night charging at 4 miles charged per hour, typical of a Level 1 connection, the 40 miles of extended range can cover about 75% of the travel days of U.S. drivers or the round-trip commuting travel of 80% of U.S. workers, based on the National Household Travel Survey (NHTS) 2009 data (Van Haaren, 2011). In fact, home charging with 110 V outlets for long-range Tesla EVs is a popular topic in the Tesla owner’s forum (Yamauchi, n.d.), which suggests the practicability of Level 1 charging at least for some owners. A Level 2 charger in a home garage can extend the electric range by 150 miles per 10 hours of nighttime charging. This can cover about 95% of travel days of U.S. drivers and meet the round-trip commuting need of virtually everyone, based on the NHTS 2009 data (Nicholas et al., 2013).
Nonetheless, home charging alone cannot satisfy all travel needs and must be supplemented with workplace and public charging. Studies have suggested that a limited number of DC fast chargers is required to support intercity travel, regular charging demand by PEV owners without home or workplace charging, and urgent charging demand by those with access to other charging types. The needs for non-home chargers depend on home charging availability as well as BEV ranges. The marginal benefit of additional public chargers in enabling more electric miles has been found to decrease with longer BEV ranges. With Level 2 home charging, long-range BEVs depend less on non-home chargers. On the other hand, more non-home chargers can make the more affordable short-range BEVs more useful (Lin, 2014; Wenig et al., 2019; Peterson and Michalek, 2013; Lin and Greene, 2010). Non-home chargers may also provide the psychological benefit of “range confidence.” For example, TEPCO showed that the addition of a second quick DC charger for their EV fleet in the Tokyo area led to significantly more use of EVs, without actual increased use of the second charger (Botsford and Sczczepanek, 2009). Such range confidence may, in the longer term, increase public charger utilization as BEVs are used by drivers even more extensively. The range confidence benefit may be important for understanding the value of some low-utilization public chargers and needs to be further studied. Other considerations that justify deploying more non-home chargers include BEV range reduction owing to cold weather and intercity or long-distance travel.
5.4.4 Impact on eVMT and PEV Adoption
When charging infrastructure becomes more available, powerful, and convenient to use, more VMT will be electrified. For PHEVs, a better charging infrastructure increases the UF—that is, the share of VMT powered by electricity. A case study in Massachusetts showed that the addition of workplace and public charging increased the UF of PHEVs 40%–88% from 70% with only home charging (Wood et al., 2017; Figure 5.33). For BEVs, a better charging infrastructure increases the daily effective driving range and usability, which reduces dependence on a backup vehicle for long trips and increases eVMT. For example, studies have shown that in areas where drivers have access to 50-kW or 120-kW fast charge stations, annual eVMT increased by more than 25%, even in cases where fast charging was used for only 1%–5% of total charging events (Howell et al., 2017; Keyser et al., 2017) (Figure 5.34).
Improving the availability, speed, and convenience of the charging infrastructure can accelerate PEV adoption, as charging infrastructure concerns have been found to be among the top reasons that consumers resist PEV purchase (Figure 5.35). The effect of charging infrastructure on PEV purchase depends on how consumers value additional improvement of charging infrastructure. Their willingness to pay for public charging has estimated to be similar in magnitude to the $7,500 tax credit (Greene et al., 2020).
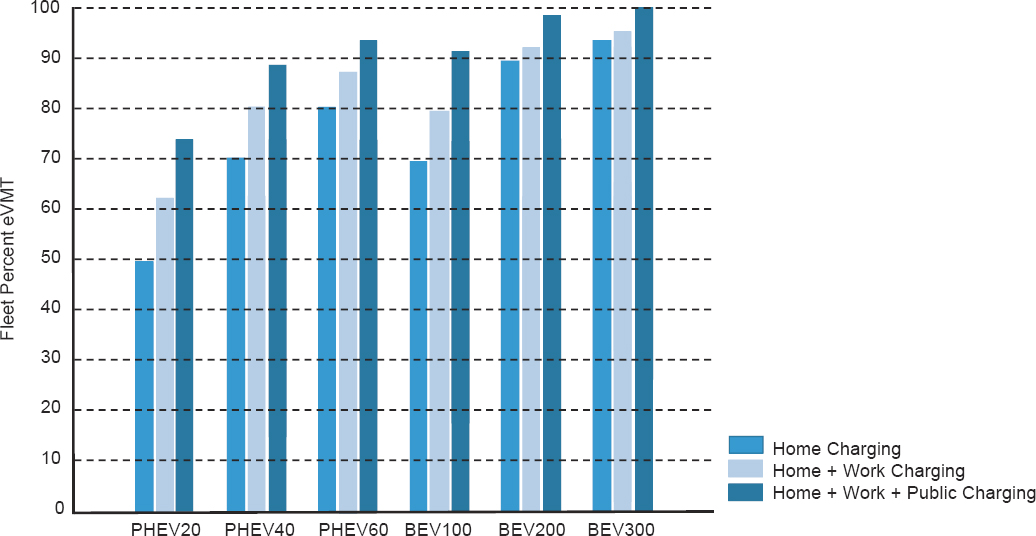
SOURCE: Wood et al. (2017).
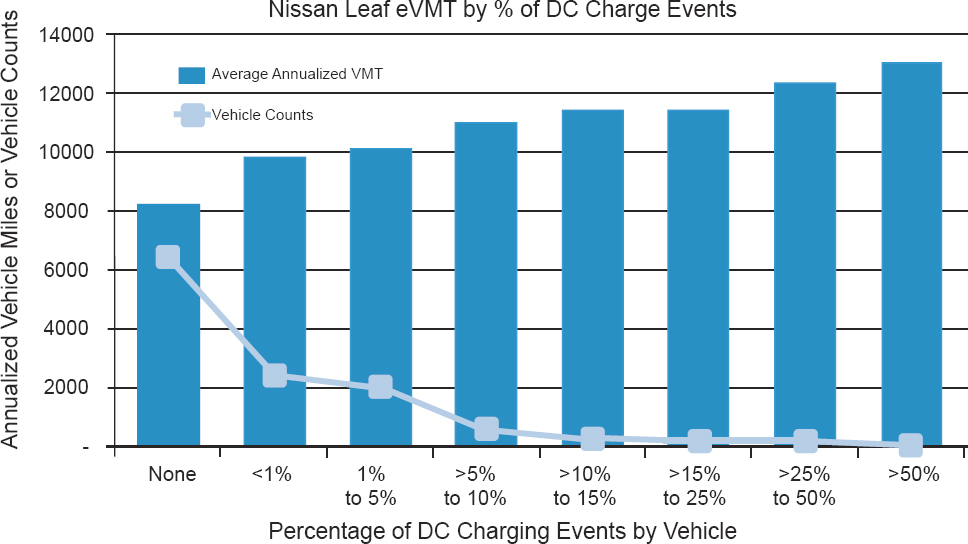
SOURCE: Howell et al. (2017).
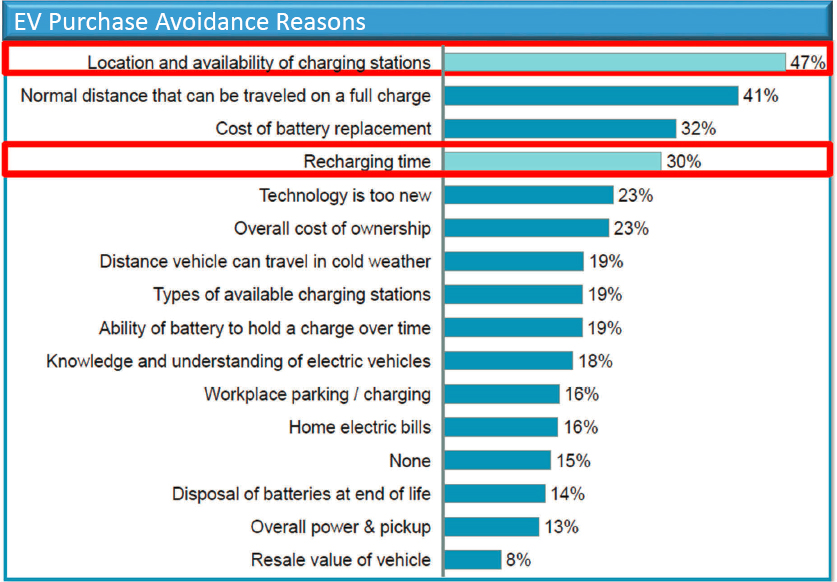
SOURCE: New Vehicle Experience Study, Strategic Vision (2017).
5.4.5 Findings and Recommendations on EV Infrastructure
FINDING 5.10: Better charging infrastructure increases electrified vehicle miles traveled, reduces petroleum-fueled vehicle miles traveled, and thus improves the average fuel economy of on-road vehicles. Better charging infrastructure can increase the usability of the electric portion of plug-in hybrid vehicle propulsion and of limited-range battery electric vehicles. Better charging infrastructure can also encourage adoption of plug-in vehicles and further improve the fleet fuel economy.
RECOMMENDATION 5.5: The cost-effectiveness of charging infrastructure for improving the overall fuel economy of existing light-duty vehicles should be further studied and compared to other vehicle efficiency technologies. The findings should be used to guide research, development, and deployment priorities and policies around charging infrastructure relative to other fuel economy technologies.
FINDING 5.11: The trade-off between charging infrastructure deployment and electric range has been studied, but consensus has not been reached with respect to diversity and cost-effective levels of ranges for consumers. In theory, improvements in charging infrastructure can make affordable short-range battery electric vehicles (BEVs) more practical for more consumers. However, there is a strong trend in the industry toward offering long-range BEV products.
RECOMMENDATION 5.6: The U.S. Department of Energy should further study the consumer preferences for electric range, including before-purchase stated preferences, revealed choices, and after-ownership opinions. Consumer value of range anxiety, range uncertainty, and charging availability should be further studied.
FINDING 5.12: Home charging is expected to dominate with respect to number of charge ports and capital costs. About 7.5 million out of 9.6 million charge ports, or ∼80% by 2030, are expected to be in homes.
Expensive public fast chargers appear to offer both values of psychological assurance and practical utilization, but the extent and marginal effects are not well understood. Low utilization public chargers are common.
RECOMMENDATION 5.7: Owing to the high cost and low utilization of direct current fast chargers (at least as appears currently), the U.S. Department of Energy should investigate the consumer value, expected utilization, and business models of public charging for the purpose of guiding further deployment decisions.
FINDING 5.13: The most discussed charging technologies are Level 1, Level 2, and DC fast chargers. The equipment costs for at-home Level 2 chargers have come down significantly in recent years, but the installation cost varies greatly, mostly depending on awareness, EV attitude, and experience of the deployment decision maker. Installation cost is much cheaper for home builders who are aware and supportive of the EV trend and have experience installing the Level 2 wiring for new constructions. There has been slower progress in reducing equipment costs of Level 2 chargers in commercial settings.
RECOMMENDATION 5.8: Government agencies, automakers, and utilities should proactively educate charging infrastructure decision makers (builders, employers, business entities with large parking capacity, etc.) on the EV trends and low-cost opportunities for charger deployment.
FINDING 5.14: Preconstruction EV-ready guidelines have been adopted, indicating a good level of education and outreach to construction and planning stakeholders, but the real-world implementation or enforcement is not clear.
RECOMMENDATION 5.9: Actual impacts of preconstruction EV-ready guidelines for buildings should be tracked and analyzed to identify barriers to implementation.
FINDING 5.15: Charging behavior, in terms of likelihood of plugging in when a charger is available, has been studied, but strategies to make charging more convenient and increase charging events are less studied. Electric vehicle automakers are trying to make charging more convenient and available.
RECOMMENDATION 5.10: In conjunction with deployment of chargers, strategies for encouraging public use should also receive attention. Strategies can include convenience, user-friendliness, free charging or membership business models (as opposed to pay-per-use), and pricing, among others.
5.5 SUMMARY OF EV COSTS
This section takes input from the above sections and analyzes the overall vehicle costs and cost differences for propulsion and EVs. This section’s analysis applies expected combustion vehicle cost increases from previous chapters with EV component and battery costs (Sections 5.2 and 5.3). The bottom-up vehicle cost framework is based on evaluation of EVs of differing electric range from two ICCT papers (Lutsey and Nicholas, 2019a and 2019b). These papers relied on a detailed engineering teardown assessment of the Chevrolet Bolt BEV with a 60-kWh battery pack, electric power output of 145 kW, and consumer label range of 238 miles (UBS, 2017) and updated battery cost data, per the above studies.
This bottom-up vehicle cost analysis offers the committee’s best estimate of the relative technology costs over time, as EV costs decline, per the underlying technologies assessed below. This vehicle cost analysis is neither conservative nor optimistic. The committee recognizes that there is research indicating EV costs, especially for batteries, declining faster or slower than represented here. For example, among the battery cost studies cited, some indicate that batteries will remain at higher cost (e.g., Anderman, 2017; Ahmed et al., 2018; Anderman, 2018), while others indicate lower cost (Berckmans et al., 2017; P3, 2020) than those applied here through 2030. The committee’s estimates, as analyzed here, rely on lithium-ion battery innovations (cathode, anode, and pack-level) that reduce the use of costly materials and increase battery plant-level production volume to at least 500,000 battery
packs per year, which are consistent with industry developments. It is also emphasized that this analysis, by design, sought to inform on how EV price parity is ultimately not a point in time but a broad range of years over which different vehicles, across vehicle classes and electric ranges, approach conventional vehicle prices.
As defined in Chapter 4, the analysis includes representative vehicles in five classes: small car, medium car, crossover, SUV, and pickups. The comparable average conventional gasoline vehicle prices in MY 2016 were about $21,000 for small cars, $34,000 for medium cars, $28,000 for crossovers, $41,000 for SUVs, and $36,000 for pickups. For the various representative vehicles, powertrain components are scaled to vehicle power, vehicle-level manufacturing costs are scaled to the vehicle footprint, and indirect conventional vehicle costs are treated as a percentage of direct manufacturing costs.
The evaluated BEVs include electric ranges of 150–300 miles, and the PHEVs have electric range capabilities of 20–60 miles. The initial EV efficiency is based on existing MY 2018 models (DOE, 2019b). These efficiency values account for increased electricity use per mile for longer-range EVs owing to larger, heavier battery packs, as well as other attributes regarding the utility of vehicles (e.g., more crossovers have all-wheel drive; SUVs have four-wheel drive and higher towing capacity). EV efficiency is assumed to improve by 1% per year owing to vehicle-level (aerodynamic, tire, mass reduction) and electric powertrain improvements, as discussed above. These effects incrementally reduce the battery pack size, for a given vehicle class and range, over time.
Vehicle cost increases for increased efficiency improvements for conventional gasoline vehicles are applied. Per above, 2% per year fuel economy improvements are included—starting from consumer label values of approximately 34 MPG for the small car, 27 MPG for the medium car, 26 MPG for the crossover, 20 MPG for the SUV, and 18 MPG for the pickup in 2018. The associated incremental price increases amount to $500–$900 for cars and crossovers, and $900-$1,000 for SUVs and pickups for the expected efficiency increase by 2025. These combustion vehicle technologies are incorporated with a 0.35% annual price increase from 2018 on.
Figure 5.36 illustrates vehicle manufacturing costs, including conventional and BEV technology components for two of the five vehicle classes. As indicated, BEV costs in 2018 are substantially higher than conventional vehicle costs. The incremental cost for BEVs is at least $8,500 for the medium car (i.e., $36,800 BEV150 versus $28,300 conventional) to about $26,000 for the long-range SUV (i.e., $57,000 BEV300 versus $31,000 conventional). From 2018 to 2025, the absolute cost of each BEV is reduced by $9,000 (BEV150) to $13,000 (BEV300) for the medium cars, and from $14,000 (BEV150) to $19,000 (BEV300) for the SUVs.
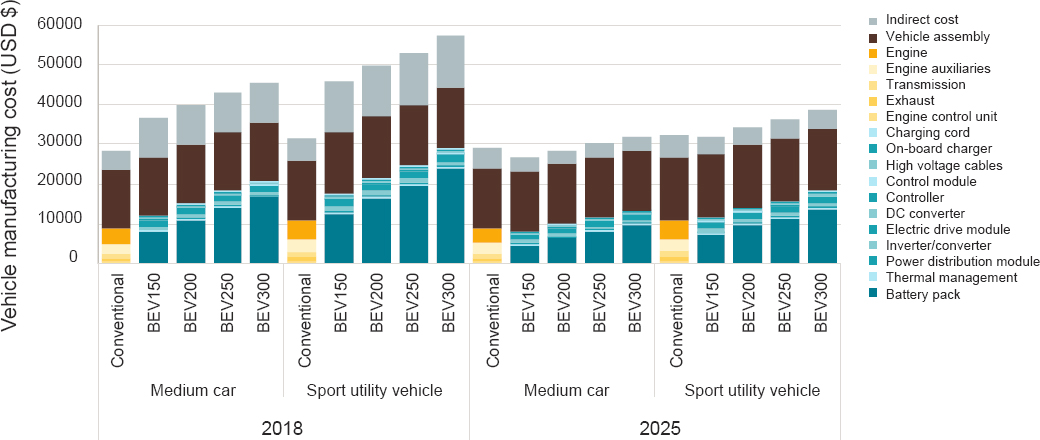
SOURCE: Lutsey and Nicholas (2019a).
TABLE 5.15 BEV Technology Cost Element Estimates by Vehicle Class and Year
| Technology Detail and Cost | Year Vehicle Class | 2025 BEV200 | 2030 | 2025 BEV300 | 2030 |
|---|---|---|---|---|---|
| Battery capacity (kWh) | Small car | 49 | 47 | 78 | 76 |
| Medium car | 60 | 59 | 97 | 94 | |
| Crossover | 66 | 64 | 104 | 101 | |
| SUV | 95 | 92 | 149 | 144 | |
| Pickup | 105 | 101 | 167 | 162 | |
| Battery cost | Small car | $5,154 | $3,475 | $8,193 | $5,524 |
| Medium car | $6,358 | $4,282 | $9,790 | $6,659 | |
| Crossover | $6,979 | $4,699 | $10,207 | $6,996 | |
| SUV | $9,662 | $6,563 | $13,791 | $9,287 | |
| Pickup | $10,215 | $7,003 | $15,462 | $10,412 | |
| Motor cost | Small car | $548 | $521 | $548 | $521 |
| Medium car | $896 | $852 | $896 | $852 | |
| Crossover | $747 | $710 | $747 | $710 | |
| SUV | $1,095 | $1,041 | $1,095 | $1,041 | |
| Pickup | $1,244 | $1,183 | $1,244 | $1,183 | |
| Inverter cost | Small car | $414 | $394 | $414 | $394 |
| Medium car | $578 | $550 | $578 | $550 | |
| Crossover | $508 | $483 | $508 | $483 | |
| SUV | $672 | $639 | $672 | $639 | |
| Pickup | $742 | $706 | $742 | $706 |
NOTE: Power ratings by vehicle class in kilowatts: small car 110, large car 180, crossover 150, SUV 220, pickup truck 250.
Several assumptions for markups are applied to link the vehicle cost to the vehicle price. All vehicles include a 15% dealer markup for dealer incentives and marketing. Automaker profit margins of 3% for small cars, 7% for medium cars, 10% for crossovers, 15% for SUVs, and 10% for pickups are included based on discussions with industry experts and to match the bottom-up costs with available average vehicle prices for the five classes. These approximations across technology types ensure that EVs have the same dealer markup and automaker profit built in as assumed for conventional vehicles for each vehicle class over time.
Table 5.15 summarizes some of the critical technical and cost elements for the BEV cost estimations for 2025 and 2030; as there is higher uncertainty related to battery technology past 2030, rigorous cost estimates past this point are not attempted. The table shows the battery capacity, including incremental reduction for efficiency improvements for BEV200 and BEV300 technology packages across the five vehicle classes. The associated costs are shown for the battery pack, the motor, and the inverter, per the discussion above.
Figure 5.37 shows the changing vehicle technology prices from 2020 through 2030 for the five vehicle classes. Each segment includes the average conventional gasoline vehicle (gray line) with incrementally increasing prices for efficiency improvements. The figure shows the decreasing prices for the EVs of various ranges from the 20-mile PHEV (PHEV20) to the 300-mile BEV (BEV300).
As shown in Figure 5.37, reducing BEV prices results in their reaching price parity with conventional vehicles during the 2023–2030 time frame. The BEV150 vehicles achieve price parity soonest, crossing the conventional vehicle line by 2023–2026. The longer-range BEV300s achieve price parity 4–5 years later than the BEV150s in each case: this is primarily owing to longer-range BEVs having larger battery packs, thus adding substantial costs over the shorter-electric-range versions of the same vehicle type. To give a sense of this price difference for a prospective vehicle buyer in 2030, compared to the shorter-range BEV150 small car, a BEV300 would be priced $3,500 higher. Similarly, longer-range 300-mile crossovers would be priced $4,500 above the BEV150, and the 300-mile pickup would be priced $6,000 over the BEV150 version, by 2030.
PHEVs with 20 miles (PHEV20) to 60 miles (PHEV60) of electric range are also shown in Figure 5.37. The PHEV price differential versus conventional gasoline vehicles is reduced by 2030, but there are no price parity points with conventional vehicles in any vehicle class. The PHEV20 small car price differential with
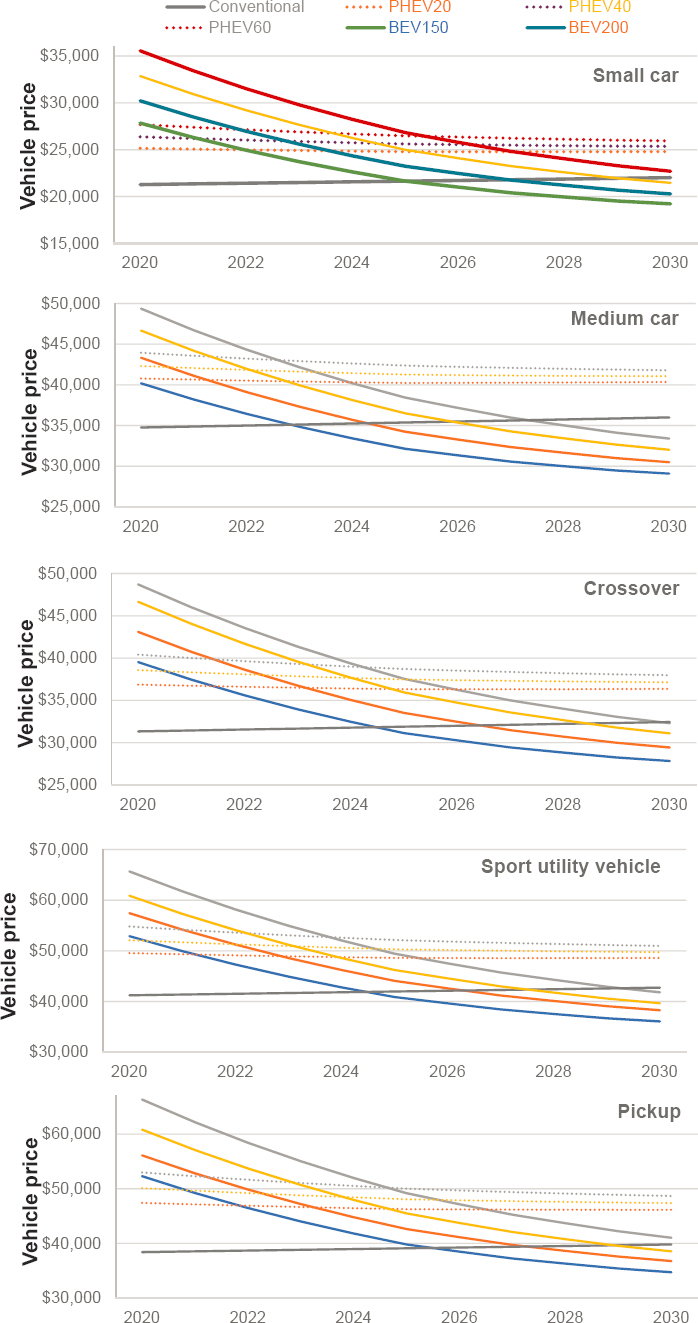
conventional vehicles declines from $4,500 in 2020 to $2,900 in 2030. For an example of a larger vehicle class and larger pack, the PHEV60 SUV cost differential drops from $13,000 in 2020 to $8,400 in 2030. PHEVs do not have a price parity point like BEVs because the battery pack—where there are large price reductions—is a much lower contributor to the PHEV price and because the PHEVs retain the combustion powertrain in addition to all the electric components.
The finding from this vehicle analysis is that one of the EV barriers, upfront vehicle cost, is likely to incrementally subside over 2025–2030, first for shorter-range EVs and later for longer-range vehicles. Incorporated in this figure’s analysis are substantial lithium-ion battery improvements and battery producers increasing to higher production volume to supply an expanding global EV volume. As indicated through the course of this report, the upfront cost differential of EVs versus comparable conventional vehicles is one of several major EV barriers, which also include model availability, charging convenience, and consumer awareness. This multibarrier aspect underscores the importance of considering policy and benefits of EVs over a longer-term time frame while simultaneously promoting the uptake of advanced ICEVs, HEVs, and PHEVs that also contribute substantially to emission reductions.
5.5.1 Findings and Recommendation for EV Cost Summary
FINDING 5.16: Although battery pack costs are reduced by 7% per year from 2018 through 2030 with continued improvements to lithium-ion battery technologies and higher volume production, the precise cell and pack costs will differ by battery pack size. The key cost driver for EVs is the battery, which for high-volume battery production is expected to decrease to $90-$115/kWh by 2025 and $65-$80/kWh by 2030 at the pack level. The committee views breakthrough changes in “beyond lithium ion” materials technology, like solid-state batteries or lithium metal, as unlikely by 2030.
FINDING 5.17: Engineering (packing) solutions for lowering battery cost are also a promising solution for economic deployment of battery electric vehicles in the 2025–2030 time frame. However, owing to multiple players and various packing solutions, companies will be slow to converge on a common cell type (e.g., prismatic, pouch, etc.) owing to substantial overhead investments in manufacturing processes.
FINDING 5.18: Battery electric vehicles with increasing electric range are expected to reach first-cost parity with combustion vehicles during 2025–2030 for companies moving to high-production volume. Reducing battery cost in addition to meeting specifications for greater durability and rapid charging capabilities will widen their appeal.
RECOMMENDATION 5.11: Fuel economy standards should avoid overcrediting performance (e.g., range) of plug-in electric vehicles; overcrediting range may result in greater use of additional safety features, sensors, and algorithms, which in turn will increase cost. Plug-in electric vehicles with policy-motivated oversized batteries could slow market penetration. Policy makers should align any regulatory incentives with customer needs, in order to ensure that automaker decisions about battery electric vehicle range are based on customer demands rather than regulatory credit.
5.6 REFERENCES
Abada, S., G. Marlair, A. Lecocq, M. Petit, V. Sauvant-Moynot, and F. Huet. 2016. Safety focused modeling of lithium-ion batteries: A review. Journal of Power Sources 306:178–192.
AFDC (Alternative Fuels Data Center). 2020. “Alternative Fuels Data Center: Electric Vehicle Charging Station Locations.” https://afdc.energy.gov/fuels/electricity_locations.html#/find/nearest?fuel=ELEC.
Ahmed, S., P. Nelson, N. Susarla, and D. Dees. 2018. “Automotive Battery Cost Using BatPaC.” Presented at the IEA Workshop on Batteries for Electric Mobility, March 7, 2018, Paris. https://www.iea.org/media/Workshops/2018/Session2ShabbirAhmedANL.pdf.
Ajanovic, A., and R. Haas. 2016. Dissemination of electric vehicles in urban areas: Major factors for success. Energy 115: 1451–1458. http://dx.doi.org/10.1016/j.energy. 2016.05.040.
Allan, R. 2017. “SiC and GaN vs. IGBTs: The Imminent Tug of War for Supremacy,” Power Electronics, Informa PLC. July 27. https://www.powerelectronics.com/automotive/sic-and-gan-vs-igbts-imminent-tug-war-supremacy.
Ames National Laboratory. 2012. “Beyond Rare Earth Magnets.” FY 2012 APEEM Annual Progress Report, Section 3. https://www.energy.gov/sites/prod/files/2014/03/f10/vtpn08_rogers_ape_2011_o.pdf.
Anderman, M. 2017. The Tesla Battery Report: Tesla Motors: Battery Technology, Analysis of the Gigafactory and Model 3, and the Automakers’ Perspectives. Total Battery Consulting. http://www.totalbatteryconsulting.com/industry-reports/Tesla-report/Extract-from-the-Tesla-Battery-Report.pdf.
Anderman, M. 2018. The xEV Industry Insider Report. Total Battery Consulting. June. https://totalbatteryconsulting.com/industry-reports/xEV-report/Extract-from-the-2018-xEV-Industry-Report.pdf.
ANL (Argonne National Laboratory). 2020. “EV-Smart Grid Interoperability Center.” https://www.anl.gov/es/evsmart-grid-interoperability-center.
ARPA-E (Advanced Research Projects Agency–Energy). 2015. “Cerium-Based Magnets, Ames National Laboratory, Novel High Energy Permanent Magnet Without Critical Elements.” https://arpa-e.energy.gov/?q=slick-sheet-project/cerium-based-magnets.
Arrow Electronics. 2020. “Silicon Carbide (SiC) vs. Gallium Nitride (GaN).” Arrow.com. January 22. https://www.arrow.com/en/research-and-events/articles/silicon-carbide-and-gallium-nitride-compared.
Attia, P.M., A. Grover, N. Jin, K.A. Severson, T.M. Markov, Y.-H. Liao, M.H. Chen, et al. 2020. Closed-loop optimization of fast-charging protocols for batteries with machine learning. Nature 578(7795):397–402. https://doi.org/10.1038/s41586-020-1994-5.
Axsen, J., and K.S. Kurani. 2012. Who can recharge a plug-in electric vehicle at home? Transportation Research Part D: Transport and Environment 17:349–353. http://dx.doi.org/10.1016/j.trd. 2012.03.001.
Axsen, J., and K.S. Kurani. 2013. Hybrid, plug-in hybrid, or electric-What do car buyers want? Energy Policy 61: 532–543. http://dx.doi.org/10.1016/j.enpol.2013.05.122.
Aykol, M., P. Herring, and A. Anapolsky. 2020. Machine learning for continuous innovation in battery technologies. Nature Reviews Materials 5(10):725–727. https://doi.org/10.1038/s41578-020-0216-y.
Bakeroot, B., and S. Decoutere. 2020. “New Power Electronics Will Make EVs More Efficient and Less Expensive.” Wards Auto. March. https://www.wardsauto.com/industry-voices/new-power-electronics-will-make-evs-more-efficient-and-less-expensive.
Bandhauer, T.M., S. Garimella, and T.F. Fuller. 2011. A critical review of thermal issues in lithium-ion batteries. Journal of the Electrochemical Society 158(3):R1–R25.
Berckmans, G., M. Messagie, J. Smekens, N. Omar, L. Vanhaverbeke, and J. Van Mierlo. 2017. Cost projection of state of the art lithium-ion batteries for electric vehicles up to 2030. Energies 10(9):1314. http://www.mdpi.com/1996-1073/10/9/1314.
Borlaug, B., S. Salisbury, M. Gerdes, and M. Muratori. 2020. Levelized cost of charging electric vehicles in the United States. Joule 4(7):1470–1485. https://doi.org/10.1016/j.joule.2020.05.013.
Botsford, C., and A. Sczczepanek. 2009. “Fast Charging vs. Slow Charging: Pros and Cons for the New Age of Electric Vehicles.” In EVS24 International Battery, Hybrid and Fuel Cell Electric Vehicle Symposium. Stavanger, Norway.
Boutros, K.S., R. Chu, and B. Hughes. 2012. “GaN Power Electronics for Automotive Applications.” IEEE Energytech. May.
Bower, G. 2019. “Tesla Model 3 2170 Energy Density Compared To Bolt, Model S P100D.” InsideEVs. February 7. https://insideevs.com/news/342679/tesla-model-3-2170-energy-density-compared-to-bolt-model-s-p100d/.
Bravo Diaz, L., X. He, Z. Hu, F. Restuccia, M. Marinescu, J.V. Barreras, Y. Patel, et al. 2020. Review—Meta-review of fire safety of lithium-ion batteries: Industry challenges and research contributions. Journal of the Electrochemical Society 167(9):090559. https://doi.org/10.1149/1945-7111/aba8b9.
Buckley, S. 2011. “EV Manufacturers Get Harmonized, Agree to Build a Universal Charging System.” Engadget. https://www.engadget.com/2011-10-14-ev-manufacturers-get-harmonized-agree-to-build-a-universal-char.html.
Burress, T. 2016. “Advanced Electric Motor Research.” Presentation at the DOE Annual Merit Review, June 7, Washington, DC. http://energy.gov/eere/vehicleBs/downloads/vehicle-technologies-office-merit-review-2016-advanced-electric-motor.
Business Wire. 2019. “Transphorm Ships Over Half a Million GaN Power Devices for Multi-Kilowatt Class Applications.” Business Wire. November. https://www.businesswire.com/news/home/20191107005291/en/Transphorm-Ships-Million-GaN-Power-Devices-Multi-kilowatt.
Cai, T., A.G. Stefanopoulou, and J.B. Siegel. 2019a. Modeling Li-ion battery temperature and expansion force during the early stages of thermal runaway triggered by internal shorts. Journal of the Electrochemical Society 166(12):A2431.
Cai, T., A.G. Stefanopoulou, and J.B. Siegel. 2019b. Early detection for Li-ion batteries thermal runaway based on gas sensing. ECS Transactions 89(1):85.
Census Bureau. 2017. 2017 “American Housing Survey.” https://www.census.gov/programs-surveys/ahs/data.2017.List_1739896299.html.
Chevrolet Pressroom. 2011. “Chevrolet Showcases Spark EV Electric Motor.” Media.Gm.Com. October 26. https://media.gm.com/media/us/en/chevrolet/news.detail.html/content/Pages/news/us/en/2011/Oct/1026_spark_elec_mtr.html.
Chevrolet Pressroom. 2016. “Drive Unit and Battery at the Heart of Chevrolet Bolt EV.” Media.Gm.Com. January 11. https://media.gm.com/media/us/en/chevrolet/home.detail.html/content/Pages/news/us/en/2016/Jan/naias/chevy/0111-bolt-du. html.
China Power Team. 2020. “Does China Pose a Threat to Global Rare Earth Supply Chains?” https://chinapower.csis.org/china-rare-earths/.
Choe, S.-Y., X. Li, and M. Xiao. 2013. Fast charging method based on estimation of ion concentrations using a reduced order of electrochemical thermal model for lithium ion polymer battery. World Electric Vehicle Journal 6(3):782–792. https://doi.org/10.3390/wevj6030782.
Chowdhury, S., and U.K. Mishra. 2013. Lateral and vertical transistors using the AlGaN/GaN heterostructure. IEEE Transactions on Electron Devices 60(10):3060–3066. https://doi.org/10.1109/TED.2013.2277893.
Clean Cities. 2012. Plug-In Electric Vehicle Handbook for Public Charging Station Hosts. Washington, DC: U.S. Department of Energy. http://www.afdc.energy.gov/pdfs/51227.pdf.
Clement-Nyns, K., E. Haesen, and J. Driesen. 2010. The impact of charging plug-in hybrid electric vehicles on a residential distribution grid. IEEE Transactions on Power Systems 25(1):371–380. https://doi.org/10.1109/TPWRS.2009.2036481.
Cole, J. 2015. “LG Chem ‘Ticked Off’ with GM For Disclosing $145/kWh Battery Cell Pricing—Video.” InsideEVs. October 23. https://insideevs.com/news/327874/lg-chem-ticked-off-with-gm-for-disclosing-145-kwh-battery-cell-pricing-video/.
Constantinides, S. 2011. “Arnold Magnetics, DOE Vehicle Technologies Program, APEEM R&D FY12 Kickoff Meeting, ORNL, Nov. 2–4.” https://www.arpa-e.energy.gov/sites/default/files/documents/files/Breakout_Session_Magnetics_LowRes.pdf.
Cooper, A., and K. Schefter. 2018. “Electric Vehicle Sales Forecast and the Charging Infrastructure Required Through 2030.” Edison Electric Institute. https://www.edisonfoundation.net/-/media/Files/IEI/publications/IEI_EEI-EV-Forecast-Report_Nov2018.ashx.
Coren, M.J. 2020. “New US Building Codes Will Make Every Home Ready for Electric Cars.” Quartz. January 9. https://qz.com/1781774/new-us-building-codes-require-plugs-for-electric-cars/.
Cui, H., D. Hall, and N. Lutsey. 2020. “Update on the Global Transition to Electric Vehicles through 2019.” Briefing. International Council on Clean Transportation. https://theicct.org/sites/default/files/publications/update-global-EV-stats-sept2020-EN.pdf.
Davies, C. 2017. “VW I.D. EV Boast: We’ll Hugely Undercut Tesla’s Model 3 Says Exec.” Slashgear. July 12. https://www.slashgear.com/vw-i-d-ev-boast-well-hugely-undercut-teslas-model-3-says-exec-17491688/.
Davis, S. 2019. “The Great Semi Debate: SiC or GaN?” Power Electronics, Informa PLC. February 15. https://www.powerelectronics.com/power-management/great-semi-debate-sic-or-gan.
Debert, M., G. Colin, G. Bloch, and Y. Chamaillard. 2013. An observer looks at the cell temperature in automotive battery packs. Control Engineering Practice 21(8):1035–1042.
Dharmakeerthi, C.H., N. Mithulananthan, and T.K. Saha. 2014. Impact of electric vehicle fast charging on power system voltage stability. International Journal of Electrical Power and Energy Systems 57(May):241–249. https://doi.org/10.1016/j.ijepes.2013.12.005.
DOE (U.S. Department of Energy). 2016. “Wireless Charging for Electric Vehicles.” Video. June 16. https://www.energy.gov/eere/videos/wireless-charging-electric-vehicles.
DOE. 2017. Enabling Fast Charging: A Technology Gap Assessment. https://www.energy.gov/sites/prod/files/2017/10/f38/XFC%20Technology%20Gap%20Assessment%20Report_FINAL_10202017.pdf.
DOE. 2019a. “Vehicle Technologies Office’s Research Plan to Reduce, Recycle, and Recover Critical Materials in Lithium-Ion Batteries.” https://www.energy.gov/sites/prod/files/2019/07/f64/112306-battery-recycling-brochure-June-2019%202-web150.pdf.
DOE. 2019b. “Fuel Economy Dataset.” https://www.fueleconomy.gov/feg/download.shtml.
Dubarry, M., G. Baure, and D. Anseán. 2020. Perspective on state-of-health determination in lithium-ion batteries. Journal of Electrochemical Energy Conversion and Storage 17(4):044701. https://doi.org/10.1115/1.4045008.
Dubarry, M., and D. Beck. 2020. Big data training data for artificial intelligence-based Li-ion diagnosis and prognosis. Journal of Power Sources 479(December):228806. https://doi.org/10.1016/j.jpowsour.2020.228806.
El-Refaie, A. 2016. “Alternative High-Performance Motors with Non-Rare Earth Materials.” GE Global Research, 2016 DOE-VTO Annual Merit Review, June 7.
Els, P. 2018. “SiC Is Revolutionising EV/HEV Power Electronics, but Is the Packaging up to the Job?” Automotove IQ. August. https://www.automotive-iq.com/electrics-electronics/articles/sic-is-revolutionising-evhev-power-electronics-butis-the-packaging-up-to-the-job.
Energy Star. 2020. Building Electric Vehicle-Ready Homes. https://www.energystar.gov/sites/default/files/asset/document/Building%20Electric%20Vehicle-Ready%20Homes_1.pdf.
Engel, H., R. Hensley, S. Knupfer, and S. Sahdev. 2018a. “How Electric Vehicles Could Change the Load Curve.” McKinsey. August 8. https://www.mckinsey.com/industries/automotive-and-assembly/our-insights/the-potential-impact-of-electric-vehicles-on-global-energy-systems.
Engel, H., R. Hensley, S. Knupfer, and S. Sahdev. 2018b. “Charging Ahead: Electric-Vehicle Infrastructure Demand.” McKinsey. August 8, updated October 2018. https://www.mckinsey.com/industries/automotive-and-assembly/our-insights/charging-ahead-electric-vehicle-infrastructure-demand.
EPA (U.S. Environmental Protection Agency). 2020. 2019 Automotive Trends Report. https://www.epa.gov/automotive-trends/download-automotive-trends-report.
EPRI (Electric Power Research Institute). 2019. Interoperability of Public Electric Vehicle Charging Infrastructure. https://www.epri.com/research/products/3002017164.
Fan, X., W. Sun, F. Meng, A. Xing, and J. Liu. 2018. Advanced chemical strategies for lithium–sulfur batteries: A review. Green Energy and Environment 3(1):2–19. https://doi.org/10.1016/j.gee.2017.08.002.
Feng, X., M. Ouyang, X. Liu, L. Lu, Y. Xia, and X. He. 2018. Thermal runaway mechanism of lithium ion battery for electric vehicles: A review. Energy Storage Materials 10:246–267.
Ferdowsi, M., P. Shamsi, and B. Baddipadiga. 2017. “Gallium Nitride (GaN) Based High Frequency Inverter for Energy Storage Applications.” InnoCit. https://eesat.sandia.gov/wp-content/uploads/2017/12/Mehdi_Ferdowsi.pdf.
Field, K. 2019. “Tesla Model 3 Battery Pack and Battery Cell Teardown Highlights Performance Improvements.” CleanTechnica. January 29. https://cleantechnica.com/2019/01/28/tesla-model-3-battery-pack-cell-teardown-highlights-performance-improvements/.
Foldy, B. 2020. “Auto Makers Grapple with Battery-Fire Risks in Electric Vehicles.” Wall Street Journal. October 19. https://www.wsj.com/articles/auto-makers-grapple-with-battery-fire-risks-in-electric-vehicles-11603099800.
Forgez, C., D. Vinh Do, G. Friedrich, M. Morcrette, and C. Delacourt. 2010. Thermal modeling of a cylindrical LiFePO4/ graphite lithium-ion battery. Journal of Power Sources 195(9):2961–2968.
Francfort, J., S. Salisbury, J. Smart, T. Garetson, and D. Karner. 2017. “Considerations for Corridor and Community DC Fast Charging Complex System Design.” INL/EXT—17-40829, 1459664. Idaho National Laboratory. https://doi.org/10.2172/1459664.
Gardner, G. 2017. “GM: Cheaper Batteries Will Lead to Electric Car Profits.” USA Today. November 17. https://www.usatoday.com/story/money/business/2017/11/17/gm-thinks-cheaper-batteries-make-electric-cars-more-profitable/869372001/.
Goldie-Scot, L. 2019. “A Behind the Scenes Take on Lithium-Ion Battery Prices.” Bloomberg New Energy Finance. March 5. https://about.bnef.com/blog/behind-scenes-take-lithium-ion-battery-prices/.
Green Car Congress. 2013. “BMW Unveils the Production I3 in New York, London and Beijing; Efficiency, Dynamics and a Supporting Ecosystem of Services.” https://www.greencarcongress.com/2013/07/i3-20130730.html.
Green Car Congress. 2017. “Mitsubishi Electric Develops World’s Smallest SiC Inverter for HEVs.” March 9. http://www.greencarcongress.com/2017/03/20170309-sic.html.
Greene, D.L., E. Kontou, B. Borlaug, A. Brooker, and M. Muratori. 2020. Public charging infrastructure for plug-in electric vehicles: What is it worth? Transportation Research Part D: Transport and Environment 78:102182. https://doi.org/10.1016/j.trd.2019.11.011.
Grote, M., J. Preston, T. Cherrett, and N. Tuck. 2019. Locating residential on-street electric vehicle charging infrastructure: A practical methodology. Transportation Research Part D: Transport and Environment 74:15–27. doi:10.1016/j. trd.2019.07.017.
Guerra, M. 2017. “SiC Power Modules Charge up Venturi Formula E Cars.” Electronic Design. July. http://www.electronicde-sign.com/power/sic-power-modules-charge-venturi-formula-e-cars.
Hall, D., and N. Lutsey. 2017. “Emerging Best Practices for Electric Vehicle Charging Infrastructure.” White Paper. International Council on Clean Transportation.
Hall, D., and N. Lutsey. 2019. “Estimating the Infrastructure Needs and Costs for the Launch of Zero-Emission Trucks.” White Paper. International Council on Clean Transportation. August.
Han, X., L. Lu, Y. Zheng, X. Feng, Z. Li, J. Li, and M. Ouyang. 2019. A review on the key issues of the lithium ion battery degradation among the whole life cycle. eTransportation 1(August):100005. https://doi.org/10.1016/j.etran.2019.100005.
Hannan, M.A., M. Lipu, A. Hussain, and A. Mohamed. 2017. A review of lithium-ion battery state of charge estimation and management system in electric vehicle applications: Challenges and recommendations. Renewable and Sustainable Energy Reviews 78:834–854.
Hardman, S., A. Jenn, G. Tal, J. Axsen, G. Beard, N. Daina, and P. Plötz. 2018. A review of consumer preferences of and interactions with electric vehicle charging infrastructure. Transportation Research Part D: Transport and Environment 62:508–523.
Hardman, S., E. Shiu, and R. Steinberger-Wilckens. 2016. Comparing high-end and low-end early adopters of battery electric vehicles. Transportation Research Part A: Policy and Practice 88:40–57. https://doi.org/10.1016/j.tra.2016.03.010.
He, W., N. Williard, C. Chen, and M. Pecht. 2014. State of charge estimation for li-ion batteries using neural network modeling and unscented Kalman filter-based error cancellation. International Journal of Electrical Power and Energy Systems 62:783–791.
Holland, S.P., E. T. Mansur, N. Z. Muller, and A. J. Yates. 2016. Are there environmental benefits from driving electric vehicles? The importance of local factors. American Economic Review 106(12):3700–3729.
Howell, D., S. Boyd, B. Cunningham, S. Gillard, L. Slezak, S. Ahmed, I. Bloom, et al. 2017. Enabling Fast Charging: A Technology Gap Assessment. October. https://www.energy.gov/sites/prod/files/2017/10/f38/XFC%20Technology%20Gap%20Assessment%20Report_FINAL_10202017.pdf.
Hu, J., Y. Zhang, M. Sun, D. Piedra, N. Chowdhury, and T. Palacios. 2018. Materials and processing issues in vertical GaN power electronics. Materials Science in Semiconductor Processing 78:75–84. https://doi.org/10.1016/j.mssp.2017.09.033.
Hu, X., Y. Zheng, D.A. Howey, H. Perez, A. Foley, and M. Pecht. 2020. Battery warm-up methodologies at subzero temperatures for automotive applications: Recent advances and perspectives. Progress in Energy and Combustion Science 77:100806. https://doi.org/10.1016/j.pecs.2019.100806.
Hu, X., Y. Che, X. Lin, and S. Onori. 2021. Battery health prediction using fusion-based feature selection and machine learning. IEEE Transactions on Transportation Electrification 7(2):382–398. https://doi.org/10.1109/TTE.2020.3017090.
Hu, Y., and S. Yurkovich. 2012. Battery cell state-of-charge estimation using linear parameter varying system techniques. Journal of Power Sources 198:338–350.
IDTechEx. 2020. “China to Enforce Electric Vehicle Safety by 2021 Says IDTechEx.” PR Newswire. May 15. https://www.prnewswire.com/news-releases/china-to-enforce-electric-vehicle-safety-by-2021-says-idtechex-301060053.html.
International Energy Conservation Code. 2018. CE217-19 Part II. https://newbuildings.org/wp-content/uploads/2019/05/CE217-P2.pdf.
Jaksic, M. 2019. “Integrated Wide Band Gap Power Module for Next Generation Plug-in Vehicles.” General Motors, DE-EE0007285. June 12. https://www.energy.gov/sites/prod/files/2019/06/f63/elt082_jaksic_2019_o_5.2_11.21am.pdf.
Ji, Y., Y. Zhang, and C.Y. Wang. 2013. Li-ion cell operation at low temperatures. Journal of the Electrochemical Society 160:A636–A649.
Kamaya, N., K. Homma, Y. Yamakawa, M. Hirayama, R. Kanno, M. Yonemura, T. Kamiyama, et al. 2011. A lithium superionic conductor. Nature Materials 10(9):682–686. https://doi.org/10.1038/nmat3066.
Kane, M. 2018. “BMW I3 Samsung SDI 94 Ah Battery Rated For 524,000 Miles.” InsideEVs. May 28. https://insideevs.com/news/338067/bmw-i3-samsung-sdi-94-ah-battery-rated-for-524000-miles/.
Keyser, M., A. Pesaran, Q. Li, S. Santhanagopalan, K. Smith, E. Wood, S. Ahmed, et al. 2017. Enabling fast charging—battery thermal considerations. Journal of Power Sources 367:228–236. https://doi.org/10.1016/j.jpowsour.2017.07.009.
Kim, Y., J.B. Siegel, and A.G. Stefanopoulou. 2013. “A Computationally Efficient Thermal Model of Cylindrical Battery Cells for the Estimation of Radially Distributed Temperatures.” American Control Conference. Washington, DC.
Kim, Y., S. Mohan, J.B. Siegel, and A.G. Stefanopoulou. 2014. Maximum Power Estimation of Lithium-Ion Batteries Accounting for Thermal and Electrical Constraints. Proceedings of the ASME 2013 Dynamic Systems and Control Conference. V002T23A003. ASME. https://doi.org/10.1115/DSCC2013-3935.
Klein, R., N.A. Chaturvedi, J. Christensen, J. Ahmed, R. Findeisen, and A. Kojic. 2013. Electrochemical model based observer design for a lithium-ion battery. IEEE Transactions on Control Systems Technology 21:289–301.
Kontou, E., C. Liu, F. Xie, X. Wu, and Z. Lin. 2019. Understanding the linkage between electric vehicle charging network coverage and charging opportunity using GPS travel data. Transportation Research Part C: Emerging Technologies 98:1–13. https://doi.org/10.1016/j.trc.2018.11.008.
Koo, R. 2012. “Advanced Li-Ion Polymer Battery Cell Manufacturing Plant in USA.” Presented at the 2012 DOE Hydrogen and Fuel Cells Program and Vehicle Technologies Program Annual Merit Review and Peer Evaluation Meeting, May 16. https://www.energy.gov/sites/prod/files/2014/03/f10/arravt001_es_koo_2012_p.pdf.
Lam, F., A. Allam, W.T. Joe, Y. Choi, and S. Onori. 2020. Offline multiobjective optimization for fast charging and reduced degradation in lithium-ion battery cells using electrochemical dynamics. IEEE Control Systems Letters: 1. https://doi.org/10.1109/LCSYS.2020.3046378.
Lee, H., and A. Clark. 2018. “Charging the Future: Challenges and Opportunities for Electric Vehicle Adoption.” Belfer Center for Science and International Affairs, Cambridge, MA: Harvard University. August.
Lee, J.H., D. Chakraborty, S.J. Hardman, and G. Tal. 2020a. Exploring electric vehicle charging patterns: Mixed usage of charging infrastructure. Transportation Research Part D: Transport and Environment 79:102249.
Lee, S., P. Mohtat, J.B. Siegel, A.G. Stefanopoulou, J. Lee, and T. Lee. 2020b. Estimation error bound of battery electrode parameters with limited data window. IEEE Transactions on Industrial Informatics 16(5):3376–3386. doi:10.1109/TII.2019.2952066.
Levin, A. 2020. “Half of U.S. Fire Departments Are Ill-Prepared for EV Fires, NTSB Says.” Automotive News. October 9. https://www.autonews.com/regulation-safety/half-us-fire-departments-are-ill-prepared-ev-fires-ntsb-says.
LeVine, M. 2020. “A New Battery Breakthrough That Could Save Electric Vehicles During a Recession.” Medium Marker. March 24. https://marker.medium.com/a-new-battery-breakthrough-that-could-save-electric-vehicles-during-a-recessionc193ebdd3a5d.
Ley, J. 2016. “Unique Lanthanide-Free Motor Construction.” Presentation at the DOE Annual Merit Review, June 7, Washington, DC. http://energy.gov/eere/vehicles/downloads/vehicle-technologies-office-merit-review-2016-unique-lanthide-free-motor.
Li, Z. 2018. “Where SiC Outperforms GaN.” Power Electronic Tips, February 27. https://www.powerelectronictips.com/sicoutperforms-gan/.
Lienert, P., and J. White. 2018. “GM Races to Build a Formula for Profitable Electric Cars.” Reuters. https://www.reuters.com/article/us-gm-electric-insight/gm-races-to-build-a-formula-for-profitable-electric-cars-idUSKBN1EY0GG.
Lima, P. 2018. “2018 Nissan Leaf Battery Real Specs.” PushEVs. January 29. https://pushevs.com/2018/01/29/2018-nissanleaf-battery-real-specs/.
Lin, C., H. Peng, J.W. Grizzle, and J. Kang. 2003. Power management strategy for a parallel hybrid electric truck. IEEE Transactions on Control Systems Technology 11(6):839–849. https://doi.org/10.1109/TCST.2003.815606.
Lin, X. 2017. Analytic analysis of the data-dependent estimation accuracy of battery equivalent circuit dynamics. IEEE Control Systems Letters 1(2):304–309. doi: 10.1109/LCSYS.2017.2715821.
Lin, X. 2018. Theoretical analysis of battery SOC estimation errors under sensor bias and variance. IEEE Transactions on Industrial Electronics 65:7138–7148.
Lin, X., H.E. Perez, J.B. Siegel, A.G. Stefanopoulou, Y. Li, R.D. Anderson, Y. Ding, et al., 2013. Online parameterization of lumped thermal dynamics in cylindrical lithium ion batteries for core temperature estimation and health monitoring. IEEE Transactions on Control Systems Technology 21(5):1745–1755. https://doi.org/10.1109/TCST.2012.2217143.
Lin, Z. 2014. Optimizing and diversifying electric vehicle driving range for U.S. drivers. Transportation Science 48(4):635–650. http://dx.doi.org/10.1287/trsc.2013.0516.
Lin, Z., and D.L. Greene. 2010. “Rethinking FCV/BEV Vehicle Range: A Consumer Value Trade-off Perspective.” Presentation at the 25th World Battery, Hybrid and Fuel Cell Electric Vehicle Symposium and Exhibition, Shenzhen, China, November 5–9.
Lin, Z., and D.L. Greene. 2011. Promoting the market for plug-in hybrid and battery electric vehicles: Role of recharge availability. Transportation Research Record 2252(1):49–56. http://dx.doi.org/10.3141/2252-07.
Liu, C., Z. Xu, D. Gerada, J. Li, C. Gerada, Y.C. Chong, M. Popescu, et al. 2020. Experimental investigation on oil spray cooling with hairpin windings. IEEE Transactions on Industrial Electronics 67(9):7343–7353. doi: 10.1109/TIE.2019.2942563.
Loveday, S. 2019. “Nissan LEAF Batteries to Outlast Car by 10–12 Years.” InsideEVs. May 24. https://insideevs.com/news/351314/nissan-leaf-battery-longevity/.
Ludois, D. 2015. “Brushless and Permanent Magnet Free Wound Field Synchronous Motors for EV Traction.” Presentation at the DOE Annual Merit Review. June 9. Washington, DC. http://energy.gov/eere/vehicles/downloads/vehicle-technologies-office-merit-review-2015-brushless-and-permanent-magnet.
Lutsey, N., and M. Nicholas. 2019a. Update on Electric Vehicle Costs in the United States through 2030. International Council on Clean Transportation. https://www.theicct.org/publications/update-US-2030-electric-vehicle-cost.
Lutsey, N., and M. Nicholas. 2019b. Electric Vehicle Costs and Consumer Benefits in Colorado in the 2020–2030 Time Frame. International Council on Clean Transportation. https://theicct.org/publications/ev-costs-colorado-2020-2030.
Lutsey, N., D. Meszler, A. Isenstadt, J. German, and J. Miller. 2018. Efficiency Technology and Cost Assessment for U.S. 2025–2030 Light-Duty Vehicles. International Council on Clean Transportation. http://www.theicct.org/US-2030-technology-cost-assessment.
Mahamud, R., and C. Park. 2011. Reciprocating air flow for Li-ion battery thermal management to improve temperature uniformity. Journal of Power Sources 196(13):5685–96. https://doi.org/10.1016/j.jpowsour.2011.02.076.
Malone, W. 2018. “Chevy Bolt EV Survey Hints at Cold Weather Package with Heat Pump.” InsideEVs. October 24. https://insideevs.com/news/340561/chevy-bolt-ev-survey-hints-at-cold-weather-package-with-heat-pump.
Maness, M., and Lin, Z. 2019. Free charging: Exploratory study of its impact on electric vehicle sales and energy. Transportation Research Record 2673(9):590–601.
Manthey, N. 2020. “CATL to Kick-off LFP Cell Supply for Tesla China Model 3.” electrive.com. July. https://www.electrive.com/2020/07/20/catl-to-kick-off-lfp-cell-supply-for-tesla-china-model-3/.
Mendoza, S., J. Liu, P. Mishra, and H. Fathy. 2017. On the relative contributions of bias and noise to lithium-ion battery state of charge estimation errors. Journal of Energy Storage 11:86–92.
Mihet-Popa, L., and S. Saponara. 2018. Toward green vehicles digitalization for the next generation of connected and electrified transport systems. Energies 11(11):3124. https://doi.org/10.3390/en11113124.
Mohan, S., J.B. Siegel, A.G. Stefanopoulou, and R. Vasudevan. 2019. An energy-optimal warm-up strategy for Li-ion batteries and its approximations. IEEE Transactions on Control Systems Technology 27(3):1165–1180. https://doi.org/10.1109/TCST.2017.2785833.
Mohtadi, R., and F. Mizuno. 2014. Magnesium batteries: Current state of the art, issues and future perspectives. Beilstein Journal of Nanotechnology 5(1):1291–1311. https://doi.org/10.3762/bjnano.5.143.
Mohtat, P., S. Lee, J.B. Siegel, and A.G. Stefanopoulou. 2019. Towards better estimability of electrode-specific state of health: Decoding the cell expansion. Journal of Power Sources 427:101–111, https://doi.org/10.1016/j.jpowsour.2019.03.104.
Nedjalkov, A., J. Meyer, M. Köhring, A. Doering, M. Angelmahr, S. Dahle, A. Sander, et al. 2016. Toxic gas emissions from damaged lithium ion batteries—analysis and safety enhancement solution. Batteries 2(1):5. https://doi.org/10.3390/batteries2010005.
Nelder, C., and E. Rogers. 2019. “Reducing EV Charging Infrastructure Costs.” Rocky Mountain Institute. https://rmi.org/insight/reducing-ev-charging-infrastructure-costs/.
New York City Council. 2013. Local Law 130 of 2013. City Council Int. No.1176-A of 2013. https://www1.nyc.gov/assets/buildings/local_laws/ll130of2013.pdf.
Nicholas, M. 2019. Estimating Electric Vehicle Charging Infrastructure Costs Across Major U.S. Metropolitan Areas. International Council on Clean Transportation. https://theicct.org/publications/charging-cost-US.
Nicholas, M., and D. Hall. 2018. “Lessons Learned on Early Electric Vehicle Fast-Charging Deployments.” International Council on Clean Transportation. July. https://theicct.org/sites/default/files/publications/ZEV_fast_charging_white_paper_final.pdf.
Nicholas, M., G. Tal, and J. Woodjack. 2013. “California Statewide Charging Assessment Model for Plug-In Electric Vehicles: Learning from Statewide Travel Surveys.” International Council on Clean Transportation. http://www.its.ucdavis.edu/wp-content/themes/ucdavis/pubs/download_pdf.php?id=1832.
Nicholas, M., G. Tal, and J. Woodjack. 2017. “Lessons from In-Use Fast Charging Data: Why Are Drivers Staying Close to Home?” Research Report. UC Davis Institute of Transportation Studies, January. https://itspubs.ucdavis.edu/download_pdf.php?id=2699.
Nilsson, M., and B. Nykvist. 2015. Governing the electric vehicle transition—near term interventions to support a green energy economy. Applied Energy 179:1360–1371. http://dx.doi.org/10.1016/j.apenergy.2016.03.056.
Nisewanger, J. 2018. “Exclusive: Details on Hyundai’s New Battery Thermal Management Design.” Electric Revs. 2018. https://electricrevs.com/2018/12/20/exclusive-details-on-hyundais-new-battery-thermal-management-design.
NRC (National Research Council). 2013. Transitions to Alternative Vehicles and Fuels. Washington, DC: The National Academies Press.
NTSB (National Transportation Safety Board). 2020. “Highway Special Project HWY19SP002.” https://data.ntsb.gov/Docket/?NTSBNumber=HWY19SP002.
NTT (Nippon Telegraph and Telephone Corporation). 2016. “Lithium-Air Secondary Battery Technology: NTT Device Technology Laboratories.” https://www.ntt.co.jp/dtl/e/technology/sd_product-lithium-battery.html.
NTT. 2020. “Lithium-Air Secondary Battery Technology: NTT Device Technology Laboratories.” https://www.ntt.co.jp/dtl/e/technology/sd_product-lithium-battery.html.
Omar, N., M.A. Monem, Y. Firouz, J. Salminen, J. Smekens, O. Hegazy, H. Gaulous, et al. 2014. Lithium iron phosphate based battery—assessment of the aging parameters and development of cycle life model. Applied Energy 113:1575–1585. https://doi.org/10.1016/j.apenergy.2013.09.003.
Omekanda, A. 2013. “Switched Reluctance Machines for EV and HEV Propulsion: State-of-the-art.” 2013 IEEE Workshop on Electrical Machines Design Control and Diagnosis (WEMDCD). March 11–12. Paris, France.
Ou, S., Z. Lin, X. He, and S. Przesmitzki. 2018. Estimation of vehicle home parking availability in China and quantification of its potential impacts on plug-in electric vehicle ownership cost. Transport Policy 68:107–117. https://doi.org/10.1016/j.tranpol.2018.04.014.
Ou, S., Z. Lin, X. He, S. Przesmitzki, and J. Bouchard. 2020. Modeling charging infrastructure impact on the electric vehicle market in China. Transportation Research Part D: Transport and Environment 81:102248. https://doi.org/10.1016/j.trd.2020.102248.
P3. 2020. “Tesla Battery Day 2020—Technology Announcement Analysis.” Electrive.net. https://www.electrive.net/wp-content/uploads/2020/09/200923_Tesla_Battery-Day_P3-Assessment-published.pdf.
Park, S., and D. Jung. 2013. Battery cell arrangement and heat transfer fluid effects on the parasitic power consumption and the cell temperature distribution in a hybrid electric vehicle. Journal of Power Sources 227 (April): 191–98. https://doi.org/10.1016/j.jpowsour.2012.11.039.
Patry, G., A. Romagny, S. Martinet, and D. Froelich. 2015. Cost modeling of lithium-ion battery cells for automotive applications. Energy Science and Engineering 3(1):71–82. https://doi.org/10.1002/ese3.47.
Patterson, G. 2015. Automotive opportunities for power GaN. Power Electronics Europe (4):20–23.
Peterson, S.B., and J.J. Michalek. 2013. Cost-effectiveness of plug-in hybrid electric vehicle battery capacity and charging infrastructure investment for reducing US gasoline consumption. Energy Policy 52:429–438.
Pillot, C. 2019. “The Rechargeable Battery Market and Main Trends 2011–2020.” Presented at the Avicenne Energy, Paris, France, May 28. http://cdn.ceo.ca.s3.amazonaws.com/1em2t4r-02%20-%20Presentation%20Avicenne%20-%20Christophe%20Pillot%20-%2028%20Mai%202019.pdf.
Plett, G.L. 2004. Extended Kalman filtering for battery management systems of LiPB-Based HEV battery packs: Part 3. State and parameter estimation. Journal of Power Sources 134(2):277–292. https://doi.org/10.1016/j.jpowsour.2004.02.033.
Pop, V., H.J. Bergveld, P.H.L. Notten, and P.P.L. Regtien. 2005. State-of-the-art of battery state-of-charge determination. Measurement Science and Technology 16(12):R93–R110. https://doi.org/10.1088/0957-0233/16/12/R01.
PowerAmerica. 2018. “PowerAmerica Strategic Roadmap for Next Generation Wide Bandgap Power Electronics.” White Paper. February. https://poweramericainstitute.org/wp-content/uploads/2018/02/PowerAmerica_Roadmap_Final-Public-Version-February-2018.pdf.
Raghavan, S.S., and G. Tal. 2020. Influence of user preferences on the revealed utility factor of plug-in hybrid electric vehicles. World Electric Vehicle Journal 11(1):6. https://doi.org/10.3390/wevj11010006.
Rajashekara, K. 2013. “Trends in Electric Propulsion—IEEE Transportation Electrification Community.” IEEE Transportation Electrification Community Newsletter. October. https://tec.ieee.org/newsletter/october-2013/trends-in-electric-propulsion.
Riley, C. 2020. “Ford Delays Production of Plug-in Escape after SUV Fires in Europe.” CNN. October 14. https://www.cnn.com/2020/10/14/business/ford-escape-hybrid-delay/index.html.
Robinius, M., J. Linβen, T. Grube, M. Reuβ, P. Stenzel, K. Syranidis, P. Kuckertz, et al. 2018. Comparative analysis of infrastructures: Hydrogen fueling and electric charging of vehicles. Energie and Umwelt/Energy and Environment 408.
SAE International. 2014. “Safety Standard for Electric and Hybrid Vehicle Propulsion Battery Systems Utilizing Lithium-based Rechargeable Cells.” https://www.sae.org/standards/content/j2929/.
Safoutin, M., J. McDonald, and B. Ellies. 2018. Predicting the future manufacturing cost of batteries for plug-in vehicles for the U.S. Environmental Protection Agency (EPA) 2017–2025 light-duty greenhouse gas standards. World Electric Vehicle Journal 9(3):42. https://www.mdpi.com/2032-6653/9/3/42.
Samad, N.A., Y. Kim, and J.B. Siegel. 2018. On power denials and lost energy opportunities in downsizing battery packs in hybrid electric vehicles. Journal of Energy Storage 16:187–196. https://doi.org/10.1016/j.est.2018.01.013.
Schmuch, R., R. Wagner, G. Hörpel, T. Placke, and M. Winter. 2018. Performance and cost of materials for lithium-based rechargeable automotive batteries. Nature Energy 3(4):267–278. https://doi.org/10.1038/s41560-018-0107-2.
Schweber, B. 2020. “GaN Power Devices: Potential Benefits, and Keys to Successful Use.” Mouser Electronics. https://www.mouser.com/applications/gan-power-devices/.
Schwunk, S., N. Armbruster, S. Straub, J. Kehl, and M. Vetter. 2013. Particle filter for state of charge and state of health estimation for lithium-iron phosphate batteries. Journal of Power Sources 239:705–710.
Sekulich, D. 2020. “Chinese Rare Earth Metals Surge in Price.” Northern Miner. https://www.northernminer.com/news/chinese-rare-earth-metals-surge-in-price/1003825605/.
Semiconductor Today. 2019. “Transphorm’s Gen III GaN Platform Earns Automotive Qualification.” February 26. http://www.semiconductor-today.com/news_items/2019/feb/transphorm_260219.shtml.
Serradilla, J., J. Wardle, P. Blythe, and J. Gibbon. 2017. An evidence-based approach for investment in rapid-charging infrastructure. Energy Policy 106:514–524.
Severson, K.A., P.M. Attia, N. Jin, N. Perkins, B. Jiang, Z. Yang, M.H. Chen, et al. 2019. Data-driven prediction of battery cycle life before capacity degradation. Nature Energy 4(5):383–391. https://doi.org/10.1038/s41560-019-0356-8.
Sharpe, B., N. Lutsey, C. Smith, and C. Kim. 2020. Power Play: Canada’s Role in the Electric Vehicle Transition. Retrieved from the International Council on Clean Transportation, https://theicct.org/publications/canada-zev-transition.
SHEVDC. 2017. Shanghai New Energy Vehicle Market Characteristics and User Behavior Research Report (in Chinese). SHEVDC.org. https://www.shevdc.org/report/original_report/1718.jhtml.
Simmons, D., and S. Chalk. 2019. Presentation to the National Academies Committee on Modernizing the U.S. Electricity System. March 4. https://sites.nationalacademies.org/cs/groups/depssite/documents/webpage/deps_191612.pdf.
Slovick, M. 2017. “Making the Jump to Wide Bandgap Power.” Electronic Design. December. http://www.electronicdesign.com/analog/making-jump-wide-bandgap-power.
Smart, J., and S. Schey. 2012. Battery electric vehicle driving and charging behavior observed early in the EV Project. SAE International Journal of Alternative Powertrains 1(1):27–33. https://doi.org/10.4271/2012-01-0199.
Smart, J., T. Bradley, and S. Salisbury. 2014. Actual versus estimated utility factor of a large set of privately owned Chevrolet Volts. SAE International Journal of Alternative Powertrains 3(1):30–35. https://doi.org/10.4271/2014-01-1803.
Smith, M., and J. Castellano. 2015. Costs Associated with Non-Residential Electric Vehicle Supply Equipment. U.S. Department of Energy’s (DOE) Clean Cities program. November. https://afdc.energy.gov/files/u/publication/evse_cost_report_2015.pdf.
Speltino, C., D. Di Domenico, G. Fiengo, and A.G. Stefanopoulou. 2009. “Comparison of Reduced Order Lithium-Ion Battery Models for Control Applications.” Pp. 3276–3281 in Proceedings of Joint 48th IEEE Conference on Decision and Control and 28th Chinese Control Conference. October.
Statista. 2020a. “EV Batteries in China and Rest of World by Chemistry 2020.” https://www.statista.com/statistics/964355/ev-batteries-elements-market-share-in-china-vs-rest-of-world/.
Statista. 2020b. “Age of US Automobiles and Trucks since 1990.” https://www.statista.com/statistics/185198/age-of-us-automobiles-and-trucks-since-1990/.
Stephens, D., P. Shawcross, G. Stout, E. Sullivan, J. Saunders, S. Risser, and J. Sayre. 2017. Lithium-Ion Battery Safety Issues for Electric and Plug-In Hybrid Vehicles. Report No. DOT HS 812 418. Washington, DC: National Highway Traffic Safety Administration. https://www.nhtsa.gov/sites/nhtsa.dot.gov/files/documents/12848-lithiumionsafetyhybrids_101217-v3-tag.pdf.
Strategic Vision. 2017. “New Vehicle Experience Study.” www.strategicvision.com/nves.
Strydom, J., D. Reusch, S. Colino, and A. Nakata. 2017. Using Enhancement Mode GaN-on-Silicon Power FETs. Application Note AN003. El Segundo, CA: Efficient Power Conversion. https://epc-co.com/epc/DesignSupport/ApplicationNotes/AN003-UsingEnhancementMode.aspx.
Sulzer, V., P. Mohtat, S. Lee, J.B. Siegel, and A.G. Stefanopoulou. 2020. “Promise and Challenges of a Data-Driven Approach for Battery Lifetime Prognostics.” https://arxiv.org/abs/2010.07460.
Sun, P., R. Bisschop, H. Niu, and X. Huang. 2020. A review of battery fires in electric vehicles. Fire Technology 56(4):1361–1410. https://doi.org/10.1007/s10694-019-00944-3.
SWEEP (Southwest Energy Efficiency Project). 2020. “EV Infrastructure Building Codes: Adoption Toolkit.” https://www.swenergy.org/transportation/electric-vehicles/building-codes#who.
Tanim, T.R., C.D. Rahn, and C.Y. Wang. 2015. State of charge estimation of a lithium ion cell based on a temperature dependent and electrolyte enhanced single particle model. Energy 80:731–739.
Tesla. 2018. “Tesla 2018 Shareholder Meeting.” Online video. June 5. https://youtu.be/OIdjv6oHzio.
Tesloop. 2018. “Tesloop’s Tesla Model S Surpasses 400,000 Miles (643,737 KM).” Tesloop. https://www.tesloop.com/blog/2018/7/16/tesloops-tesla-model-s-surpasses-400000-miles-643737-kilometers.
Thanh, A., and H. Min-Fu. 2017. Performance evaluation of interior permanent magnet motors using thin electrical steels. IEEJ Journal of Industry Applications 6(6):422–428. doi:10.1541/ieejjia.6.422.
Toyota USA Newsroom. 2018. “Toyota Develops New Magnet for Electric Motors Aiming to Reduce Use of Critical Rare-Earth Element by up to 50% | Corporate | Global Newsroom.” Toyota Motor Corporation Official Global Website. February 20. https://global.toyota/en/newsroom/corporate/21139684.html.
Transphorm Inc. 2017. “Transphorm Announces First Automotive-Qualified GaN FETs, Second Generation Platform Passes AEC-Q101 Tests for High Power Automotive Applications.” Company press release. March 17. https://www.transphor-musa.com/en/news/transphorm-announces-first-automotive-qualified-gan-fets/.
Traut, E.J., T.C. Cherng, C. Hendrickson, and J.J. Michalek. 2013. US residential charging potential for electric vehicles. Transportation Research Part D: Transport and Environment 25:139–145.
TRB and NRC (Transportation Research Board and National Research Council). 2015. Overcoming Barriers to Deployment of Plug-in Electric Vehicles. Washington, DC: The National Academies Press. https://doi.org/10.17226/21725.
Tu, H., H. Feng, S. Srdic, and S. Lukic. 2019. Extreme fast charging of electric vehicles: A technology overview. IEEE Transactions on Transportation Electrification 5(4):861–878. https://doi.org/10.1109/TTE.2019.2958709.
UBS. 2017. “UBS Evidence Lab Electric Car Teardown: Disruption Ahead?” Q-Series newsletter. https://neo.ubs.com/shared/d1ZTxnvF2k/.
Van Haaren, R. 2011. Assessment of Electric Cars’ Range Requirements and Usage Patterns Based on Driving Behavior Recorded in the National Household Travel Survey of 2009. Earth and Environmental Engineering Department, Columbia University, Fu Foundation School of Engineering and Applied Science, New York.
Vekasi, K. 2019. “China’s Control of Rare Earth Metals.” National Bureau of Asian Research (NBR). Pacific Energy Summit, August 13. https://www.nbr.org/publication/chinas-control-of-rare-earth-metals/.
Verbrugge, M., and B. Koch. 2006. Generalized recursive algorithm for adaptive multiparameter regression: Application to lead acid, nickel metal hydride, and lithium-ion batteries. Journal of the Electrochemical Society 153(1):A187. https://doi.org/10.1149/1.2128096.
Verbrugge, M., and E. Tate. 2004. Adaptive state of charge algorithm for nickel metal hydride batteries including hysteresis phenomena. Journal of Power Sources 126(1):236–249. https://doi.org/10.1016/j.jpowsour.2003.08.042.
Vlahinos, A., and A.A. Pesaran. 2002. “Energy Efficient Battery Heating in Cold Climates.” Future Car Congress, Arlington, VA. SAE International.
Wang, S., M. Verbrugge, J.S. Wang, and P. Liu. 2011. Multi-parameter battery state estimator based on the adaptive and direct solution of the governing differential equations. Journal of Power Sources 196(20):8735–8741. https://doi.org/10.1016/j.jpowsour.2011.06.078.
Wang, T., S. Chen, H. Ren, and Y. Zhao. 2018. Model-based unscented Kalman filter observer design for lithium-ion battery state of charge estimation. International Journal of Energy Research 42(4):1603–1614. https://doi.org/10.1002/er.3954.
Wang, Y., H. Fang, L. Zhou, and T. Wada. 2017. Revisiting the state-of-charge estimation for lithium-ion batteries: A methodical investigation of the extended Kalman filter approach. IEEE Control Systems 37(4):73–96. https://doi.org/10.1109/MCS.2017.2696761.
Weigel, T., F. Schipper, E. Erickson, F. Susai, B. Markovsky, and D. Aurbach. 2019. Structural and electrochemical aspects of LiNi0.8Co0.1Mn0.1O2 cathode materials doped by various cations. ACS Energy Letters 4(2):508–516.
Wenig, J., M. Sodenkamp, and T. Staake. 2019. Battery versus infrastructure: Tradeoffs between battery capacity and charging infrastructure for plug-in hybrid electric vehicles. Applied Energy 255:113787.
Wentker, M., M. Greenwood, and J. Leker. 2019. A bottom-up approach to lithium-ion battery cost modeling with a focus on cathode active materials. Energies 12(3):504. https://doi.org/10.3390/en12030504.
Witter, F. 2018. “Shaping the Transformation Together.” Volkswagen Group, investor meetings, Frankfurt and London, 29th–30th November 2018. Retrieved from https://www.volkswagenag.com/presence/investorrelation/publications/presentations/2018/11_november/2018_11_29-30_Volkswagen_Group_Presentation_Investor_Meetings_Frankfurt_London.pdf.
Wolbertus, R., R. Van den Hoed, and S. Maase. 2016. Benchmarking charging infrastructure utilization. World Electric Vehicle Journal 8(4):754–771. https://doi.org/10.3390/wevj8040754.
Wolbertus, R., S. Jansen, and M. Kroesen. 2020. Stakeholders’ perspectives on future electric vehicle charging infrastructure developments. Futures 123(October):102610. https://doi.org/10.1016/j.futures.2020.102610.
Wolfspeed. 2017. “Wolfspeed Introduces New SiC MOSFET for EV Drive Trains.” Press release. January. https://www.wolfspeed.com/news/900v10mohm.
Wood, E., S. Raghavan, C. Rames, J. Eichman, and M. Melaina. 2017. “Regional Charging Infrastructure for Plug-In Electric Vehicles: A Case Study of Massachusetts.” January. https://www.nrel.gov/docs/fy17osti/67436.pdf.
Wu, F., Y. Yuan, X. Cheng, Y. Bai, Y. Li, C. Wu, and Q. Zhang. 2018. Perspectives for restraining harsh lithium dendrite growth: Towards robust lithium metal anodes. Energy Storage Materials 15:148–170. https://doi.org/10.1016/j.ensm.2018.03.024.
Xia, B., C. Chen, Y. Tian, W. Sun, Z. Xu, and W. Zheng. 2014. A novel method for state of charge estimation of lithium-ion batteries using a nonlinear observer. Journal of Power Sources 270:359–366.
Xu, J., and D. Chen. 2017. “A Performance Comparison of GaN E-HEMTs Versus SiC MOSFETs in Power Switching Applications.” Bodo’s Power Systems. June.
Xu, K. 2004. Nonaqueous liquid electrolytes for lithium-based rechargeable batteries. Chemical Reviews 104(10):4303–4418. https://doi.org/10.1021/cr030203g.
Yamauchi, M. n.d. “Tesla Charging Speed on a 110 Volt Outlet.” PluglessPower. https://www.pluglesspower.com/learn/can-tesla-charge-regular-110v-wall-outlet-technically-yes/.
Yuksel, T., M.-A. M. Tamayao, C. Hendrickson, I.M.L. Azevedo, and J.J. Michalek. 2016. Effect of regional grid mix, driving patterns and climate on the comparative carbon footprint of gasoline and plug-in electric vehicles in the United States. Environmental Research Letters 11(4):044007. https://doi.org/10.1088/1748-9326/11/4/044007.
Yvkoff, L. 2019. “Robotic EV Fast-Charging Stations Planned For San Francisco.” Forbes. August 1. https://www.forbes.com/sites/lianeyvkoff/2019/08/01/robotic-ev-fast-charging-stations-planned-for-san-francisco/.
Zhao, X. 2016a. Lithium/sulfur secondary batteries: A review. Journal of Electrochemical Science and Technology 7(2):97–114. https://doi.org/10.5229/JECST.2016.7.2.97.
Zhao, Z. 2016b. “Next Generation Inverter.” General Motors. DOE-VTO Annual Merit Review. June 7.
Zheng, Y., M. Ouyang, X. Han, L. Lu, and J. Li. 2018. Investigating the error sources of the online state of charge estimation methods for lithium-ion batteries in electric vehicles. Journal of Power Sources 377:161–188. https://doi.org/10.1016/j.jpowsour.2017.11.094.
Zhu, C., F. Lu, H. Zhang, J. Sun, and C.C. Mi. 2018. A real-time battery thermal management strategy for connected and automated hybrid electric vehicles (CAHEVs) based on iterative dynamic programming. IEEE Transactions on Vehicular Technology 67(9):8077–8084. https://doi.org/10.1109/TVT.2018.2844368.


