
2
Fuel Economy, Greenhouse Gas Emissions, and Vehicle Efficiency Background
Consumers look for many vehicle attributes including improved vehicle fuel economy and energy efficiency to reduce their fueling costs, time spent refueling, and environmental impact. Government leaders in the United States have required increasing fuel economy and reduced greenhouse gas (GHG) emissions to reach national goals of energy security, improved consumer value, and reduced emissions of GHGs and other tailpipe pollutants. Automakers have responded to the consumer and regulatory impetus by improving energy efficiency of technologies for vehicle operation. More efficient technologies developed by automakers and automotive suppliers provide competitive advantage with consumers and meet regulatory requirements for fuel economy and emissions ratings of whole vehicles, but also enable improvement of other vehicle attributes valued by consumers, such as power, acceleration time, towing, and other capabilities. These improvements are occurring in technologies for petroleum-fueled vehicles and also for vehicles fueled by a diversity of energy carriers, including biofuels, blended fuels, hydrogen, and electricity. New technologies, implemented for fuel efficiency or to improve other vehicle attributes, often cost more than the technologies they replace. This has implications for vehicle cost, price, sales, consumer value, and the costs of fuel economy and emissions standards.
This chapter briefly describes the history of energy efficiency in light-duty vehicles (LDVs), including technical and regulatory aspects. It provides context for current fleet performance described in Chapter 3 and the technologies (Chapters 4–8) and policies for 2025–2035 described and recommended in the remainder of the report.
2.1 TECHNOLOGY PRINCIPLES AFFECTING VEHICLE EFFICIENCY
This report is tasked with informing the National Highway Traffic Safety Administration (NHTSA), Congress, and the public on fuel economy technology potential relevant in 2025–2035. To understand technology value and interactions, it is important to understand the physical principles controlling the efficiency of vehicle movement.
The movement of vehicles, and their drivers, passengers, and goods, requires input of energy. A portion of the energy input is converted to the desired output, travel of the vehicle mass, and a portion instead goes into energy loss pathways, such as aerodynamic, rolling resistance, and pumping losses. The forces impeding vehicle motion can be written as follows:
F = ma + Ra + Rrr,
where ma is the inertial force, Ra is the aerodynamic resistance, and Rrr is the rolling resistance.
Reduction of energy loss pathways improves the efficiency of vehicle movement. Efficiency of vehicle movement can also be improved through reduction in vehicle mass and operational factors for more efficient travel of passengers and drivers.
2.1.1 Mass
If all other factors are equal, vehicles with less mass are more fuel efficient. Lighter vehicles require less power to overcome inertial force impeding vehicle motion than heavier vehicles, which have greater inertia. Consequently, mass reduction is an effective way of increasing vehicle fuel economy. Lightweighting is accomplished through vehicle design changes and use of lighter materials, such as aluminum, high-strength steel, and advanced composites.
2.1.2 Aerodynamics
Reductions in fuel consumption can be achieved by decreasing vehicle aerodynamic drag. Vehicle aerodynamic drag is the product of the drag coefficient, the frontal area, air density, and speed squared.1 The drag coefficient measures the force of air resistance on the vehicle. A lower drag coefficient indicates that the vehicle will have less aerodynamic drag. The average passenger vehicle has a drag coefficient between 0.302 and 0.395 (EPA/NHTSA/CARB, 2016). Because aerodynamic drag increases with the square of speed, its effects increase at higher speeds. At low speeds, aerodynamic drag accounts for about one-fourth of fuel burned. At high speeds, more than half of fuel can be used to overcome aerodynamic drag. External vehicle add-ons (e.g., roof storage units) can degrade aerodynamic efficiency. Optimizing vehicle shape by streamlining and with active and passive design add-ons can reduce the drag coefficient, and hence the energy losses in aerodynamic drag.
2.1.3 Rolling Resistance
In addition to aerodynamic drag and inertial force owing to mass, tire rolling resistance is one of the many forces that must be overcome in order for a vehicle to move. Rolling resistance is the product of the repeated deformation of a tire during rotation resulting in energy loss.
F = Crr N,
where F is the force of rolling resistance, N is the normal force, and Crr is the rolling resistant coefficient. A lower rolling resistance coefficient indicates less energy loss. In addition to pavement conditions, tire pressure, vehicle mass, and vehicle brake type affect rolling resistance. Tire rolling resistance can be decreased through tread design and composition, inflation, stiffening sidewalls, and a smaller tire footprint.
2.1.4 Engine Thermal Efficiency
Spark ignition (Otto Cycle) engines, the most common type in the U.S. fleet, typically convert only about one-third of the total fuel energy consumed to indicated work done on the piston (indicated thermal efficiency). Of the remaining energy, approximately one-third is lost as heat rejected to the coolant and another one-third is lost as exhaust enthalpy. Of that indicated work at conditions representative of the Federal Test Procedure fuel economy test cycle, brake work delivered at the crankshaft (brake thermal efficiency) is further reduced by up to 40% owing to losses attributable to intake and exhaust pumping (5%), mechanical friction (8%), and engine driven accessory drive requirements (1%). In discussing technologies and approaches to improve the fuel efficiency
___________________
1 The force required to overcome drag is represented by the product of the drag coefficient, Cd; the frontal area, A; and the square of speed, V2. The formula is ![]()
of an internal combustion engine (and thereby reduce its carbon dioxide [CO2] emissions), it is convenient to categorize them as improving efficiency through the following:
- Thermodynamic factors such as combustion timing, compression ratio, working fluid properties, or heat loss reduction.
- Reducing losses to mechanical rubbing friction via design, surface treatments, lubricants, downsized/turbocharged engines (fewer number of cylinders).
- Reducing engine pumping losses with technologies such as variable valve timing and lift, cylinder deactivation, and engine downsizing.
- Additionally, accessory loads can be made more efficient and/or converted to electrically driven.
2.1.5 Electrical System Losses
Electrical loads in LDVs come primarily from accessories for safety, entertainment, and comfort, and electric drive components. Electrical accessories such as lights, electric power steering, air conditioning, power windows, seats, and door locks, seat and steering wheel warmers, windshield wipers, navigation systems, and entertainment systems require power. Energy losses from accessories can account for up to 2% of total fuel use in a typical vehicle. Driver assist systems for safety, comfort, and convenience are a growing source of electric loads and can be in the tens of percents of total fuel use (EPA, n.d.).
In electric and hybrid vehicles, energy losses occur primarily as resistive loses in the battery and other electronics, and motor losses when a permanent magnet motor is spinning but not powering the vehicle or generating charge on the battery. Resistive losses transform some of the stored energy into internal heat instead of external power, thereby lowering the energy efficiency. Internal resistance varies by material.
2.1.6 Operational Factors
Operational factors affect the efficiency of individual vehicle use and also of total energy use of the transportation system. Total energy use impacts will be discussed in later chapters. For an individual vehicle, operational factors include choice of vehicle for a trip, driver behaviors like speeding and idling, fueling choices such as use of premium fuel or charging of plug-in hybrid electric vehicles (PHEVs), efficient trip planning and routing, and vehicle maintenance.
2.1.7 Total Vehicle System Energy Flows
Figure 2.1 shows a schematic of system energy flows in a hybrid vehicle. Table 2.1 shows the related breakdown of energy losses and resulting power to the wheels for internal combustion engine vehicles (ICEVs), hybrid electric vehicles (HEVs), and battery electric vehicles (BEVs). The system losses are areas where vehicle efficiency can be improved.
2.2 FUEL CONSUMPTION, GHG EMISSIONS, AND ENERGY USE
As introduced in Chapter 1, vehicle energy consumption, fuel consumption, and GHG emissions are related metrics. At base is vehicle energy use. As shown in Table 2.1, different vehicles use different amounts of energy to provide the same power to the wheels. Energy consumption is directly related to fuel consumption for both liquid petroleum fuels and various forms of non-petroleum fuel, although the metric used varies (gallons of gasoline or diesel, kWh of electricity, and kg of hydrogen). GHG emissions are also related to vehicle energy consumption, although the fuel used to provide the energy determines the relationship. GHG emissions related to vehicle energy consumption occur not just on board the vehicle but also upstream in the fuel generation and transport to the vehicle. Chapter 10 discusses the detailed considerations around a well-to-wheels evaluation of vehicle energy use and GHG emissions.
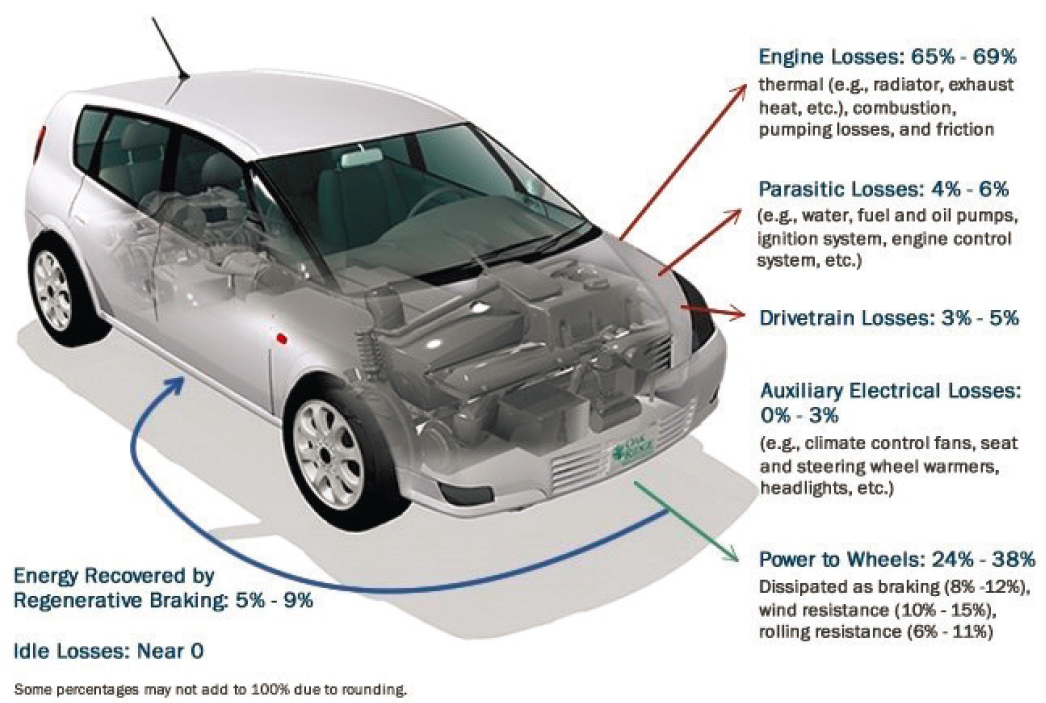
SOURCE: EPA (n.d.).
TABLE 2.1 Total Onboard Energy Flows as Estimated for ICEVs, HEVs, and BEVs
| Energy Flow | ICEV % Energy Loss | HEV % Energy Loss | BEV % Energy Loss |
|---|---|---|---|
| Engine losses | 68–72 | 65–69 | N/A |
| Battery charging and electric drive system losses | N/A | N/A | 20 |
| Parasitic losses | 4–6 | 4–6 | N/A |
| Drivetrain losses | 5–6 | 3–5 | N/A |
| Auxiliary electrical losses | 0–2 | 0–3 | 0–4 |
| Idle losses | 3 | 0 | 0 |
| Regenerative braking recovery | N/A | + 5–9 | + 17 |
| Power to wheels | + 16–25 | + 24–38 | + 86–90 |
NOTE: Some percentages may not add to 100% owing to rounding and variable ranges.
SOURCE: EPA (n.d.).
Energy efficiency is motivated by reduced use of resources. Concerns on the use of liquid fuels and efficiency were brought into U.S. public consciousness largely following the 1973 oil crisis, which resulted in shortages of automotive fuel at gas stations and saw sharp increases in the price of oil (U.S. Department of State, n.d.). However, in recent years, fuel economy has come into focus as a means for reducing the contribution of vehicles to climate change. Transportation comprised 29% of 2017 U.S. GHG emissions, with LDVs contributing 59% of this total (EPA, 2019). In the LDV sector, energy efficiency leads to reduced use of petroleum fuels and other energy carriers/sources, reduced GHG emissions, reduced impacts associated with energy use such as criteria emissions, as well as reduced costs to the consumer and increased protection from price volatility.
2.3 TECHNICAL, REGULATORY, AND STATUTORY HISTORY
2.3.1 Vehicle Efficiency Regulatory History
Vehicle efficiency has been an explicit government goal since the passage of the Energy Policy and Conservation Act of 1975 (EPCA, 1975). EPCA assigned authority for regulating manufacturer fleet-averaged fuel economy of LDVs to the U.S. Department of Transportation (DOT)’s NHTSA beginning with model year (MY) 1978. Since the enacting of fuel economy regulations under EPCA, there have been changes in the particular structure of fuel economy regulations, which are detailed in Chapter 12. A summary of fuel economy statutes and regulations is shown in Table 2.2.
Notably, the Energy Independence and Security Act of 2007 (EISA) was passed, providing a new mandate for fuel efficiency beginning for MY 2012 (EISA, 2007). In addition to fuel economy regulations mandated by EISA and EPCA, in 2007 the Supreme Court case Massachusetts v. EPA obligated the U.S. Environmental Protection Agency (EPA) to determine if emissions of CO2 and other GHGs from motor vehicles were required to be regulated under Section 202 of the Clean Air Act (United States Code, 1990). Under these two new mandates, a national program of fuel economy and GHG regulations was implemented. NHTSA, EPA, and the California Air Resources Board produced a single set of requirements for MY 2012–2016, and a second national program for MY 2017–2025.
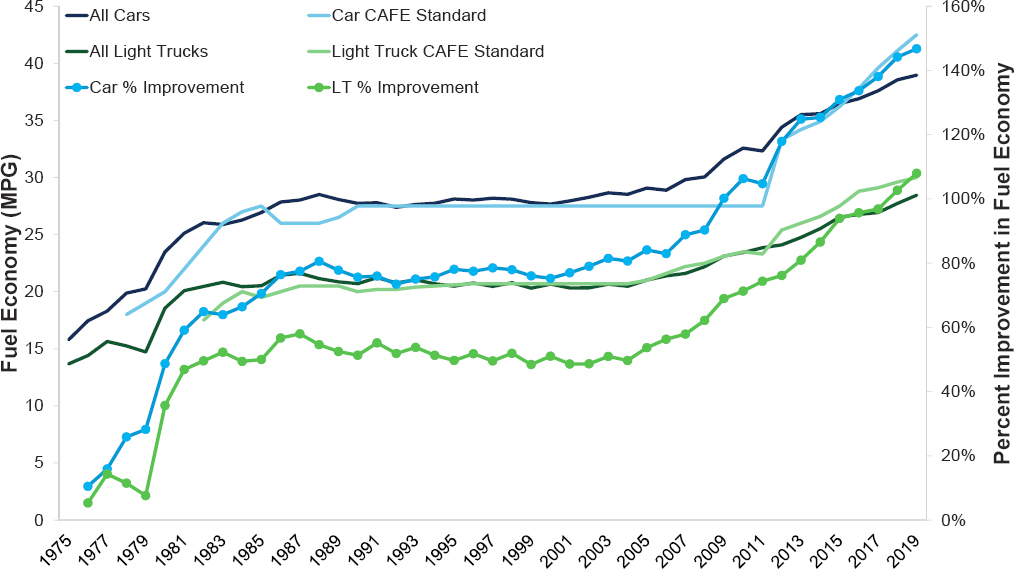
The most recent set of regulations is The Safer Affordable Fuel-Efficient (SAFE) Vehicles Rule, setting fuel economy and GHG emissions standards over 2021–2026. Under this new regulation, fuel economy and emissions standards increase by 1.5% each year through MY 2026, compared with 5% per year under the previously proposed standard, resulting in a projected 40.4 miles per gallon (MPG) required fuel economy in MY 2026, compared with 46.7 MPG projected under the previous regulations (NHTSA/EPA, 2020). Fuel economy standards as set by NHTSA can be complied with by achieving the appropriate weighted average of tested fuel economy, by paying a fine, and through various credit mechanisms, described further in Chapter 12 (EPA/NHTSA, 2012). Fuel economy standards, achieved fuel economy, and resulting vehicle energy efficiency improvements over time are shown in Figure 2.2.
NHTSA is required by EISA to set maximum feasible fuel economy standards through 2030, but for no more than 5 years. This means that standards beginning in MY 2027 can at most cover MY 2027–2031. This report is tasked with informing NHTSA, Congress, other federal agencies, and the public about fuel economy technologies, consumer behavior, and policy issues pertinent to the 2025–2035 time frame, and so can inform the upcoming standards.
2.3.2 Vehicle Technology History
Vehicle technology development has occurred in response to consumer demands for fuel economy and other vehicle attributes, as well as regulatory stringency drivers. Technologies have advanced to better use fuel in engines and motors, to better use the power output of those engines and motors, and to reduce the power required to move the vehicle. To better use fuel, engines have been improved to accomplish more complete combustion, and to transform more of that combustion energy into mechanical energy output of the engine. Similarly, motors have been improved to more efficiently convert electrical energy to mechanical energy. Transmissions and other aspects of the drivetrain have been improved to more effectively convert mechanical energy out of the motor or
TABLE 2.2 Statutes Governing Fuel Economy and GHG Standards for LDVs, Including Relevant Mandate by Year Enacted and Active Status, and Additional Regulatory Aspects by Model Year Implemented
| Statute | Regulation(s) |
|---|---|
|
Clean Air Act (1970, updated 1990) The CAA gives the EPA the authority to regulate air pollutants harmful to humans. Originally passed in 1970, the CAA has been amended several times since to include newly recognized pollutants and was the focus of a 2007 Supreme Court case establishing if GHGs fall under the CAA (42 U.S.C. 85 §7521–§7554; 42 U.S.C. 85 §7581–§7590). Status: Active
|
|
|
Energy Independence and Security Act (2007) EISA enacts the three provisions of the corporate average fuel economy (CAFE) standards, the Renewable Fuel Standard, and lighting and appliance efficiency standards for the goal of reducing U.S. dependence on oil. This was the first statutory increase in fuel economy (FE) standards since EPCA in 1975. Status: Active DOT given authority to set FE standards through 2030.
|
|
|
Energy Policy and Conservation Act (1975) EPCA established a federal program to set energy targets for consumer products. It gives NHTSA the authority to set fuel economy standards for the purpose of reducing energy and oil consumption and led to the first CAFE standards in 1975 (EPCA, 1975). See Title III, Part A. Automotive Fuel Economy Status: Inactive |
Note: Only regulations after MY 2008 are included. |
|
Alternative Motor Fuels Act of 1988 AMFA encourages the production of dual-fueled vehicles or those entirely using a fuel other than petroleum by providing credits toward the calculation of CAFE performance, with the goal of energy independence. It specifies this incentive program will last until 2004, at which point the DOT could choose to extend the program an additional four MYs (AMFA, 1988). Status: Inactive (at least with regards to CAFE)
|
|
|
Energy Policy Act of 2005 The Energy Policy Act of 2005 calls for the development of grant programs, demonstration and testing initiatives, and tax incentives that promote alternative fuels and advanced vehicles production and use. EPAct 2005 also amends existing regulations, including fuel economy testing procedures and EPAct 1992 requirements for federal, state, and alternative fuel provider fleets. (EPAct, 2005). See Title VII: Vehicles and Fuels Status: No active FE/GHG standards |
SOURCE: Committee generated using data from EPA (2019).
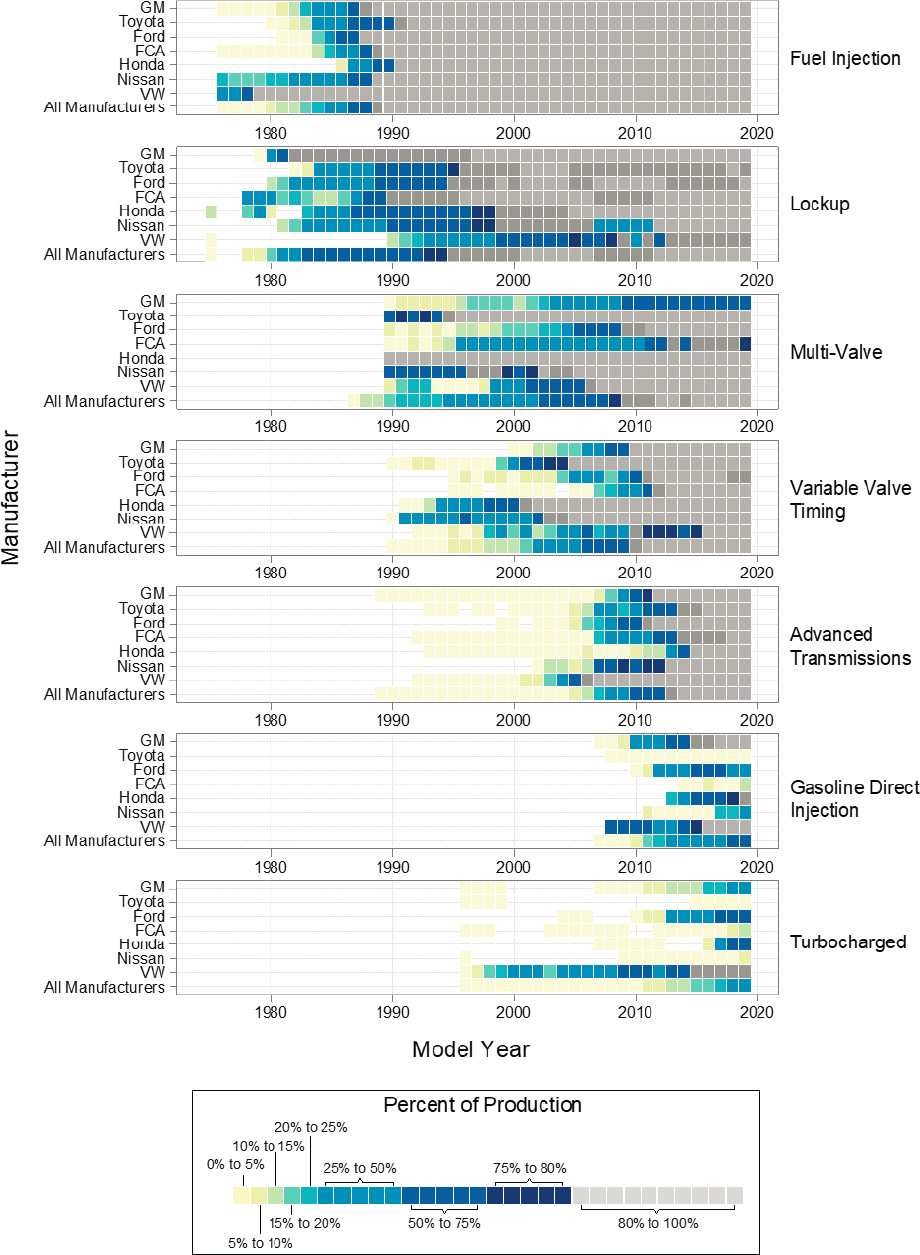
engine to movement in the wheels. Road load has been reduced through mass reduction, improved aerodynamics, and reduced rolling resistance. New propulsion systems that can recover braking energy and eliminate idling, and have inherently more efficient energy use, have been implemented (stop start, hybrids, and electric vehicles [EVs]). Figure 2.3 shows some of the vehicle technologies that were uncommon or nonexistent in 1975 that have been implemented to improve efficiency and have become commonplace.
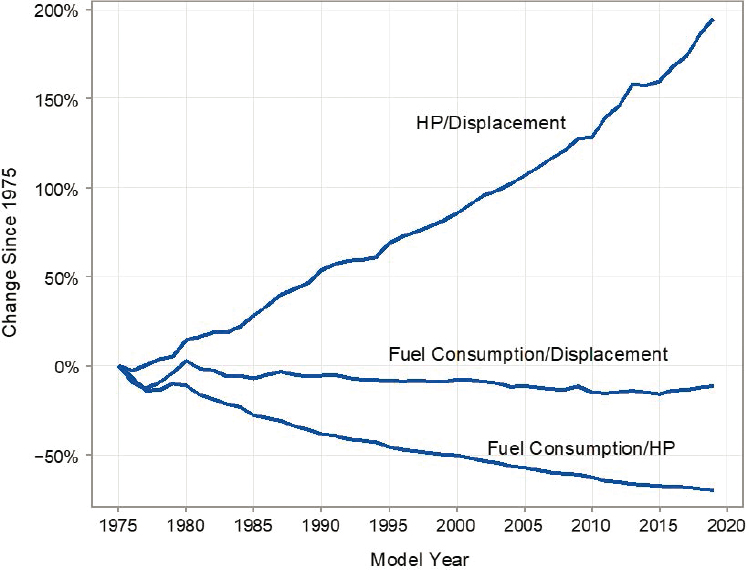
While these efficiency improvements have been implemented to reduce fuel consumption, horsepower and other desired vehicle attributes have continued to increase. Figure 2.4 illustrates the energy improvement and reduced fuel consumption available as engines have been improved from 1975 to 2020.
2.3.3 Other Vehicle Regulations That Impact Vehicle Efficiency
2.3.3.1 Vehicle Safety Regulations
Federal Motor Vehicle Safety Standards issued by NHTSA reflect congressional laws pertaining to vehicle safety. Safety and fuel economy have potential trade-offs and synergies. One notable example is that reducing the mass of materials on the vehicle can present improvements in fuel economy; however, historically, there has been concern about the passenger safety implications of reducing vehicle mass, or “lightweighting.” The precise relationship between vehicle mass and safety risk is complex, however, with the potential for vehicle material selections to be made that improve fuel economy through mass reductions but without necessarily decreasing safety. Recent technological developments such as advanced driver assistance systems can enhance both safety and fuel economy through assisting drivers with breaking, acceleration, and/or steering (NHTSA/EPA, 2020), although the impact of these devices is still under study. Further overall discussion of the relationship between vehicle mass and safety considerations is presented in Chapter 7. Safety considerations regarding specific vehicle types (e.g., BEVs, fuel cell electric vehicles [FCEVs], connected and automated vehicles) are presented in Chapters 5, 6, and 8.
SOURCE: EPA (2020).
SOURCE: EPA (2020).
2.3.3.2 Criteria Pollutants
Under the Clean Air Act, EPA began regulating nitrogen oxide emissions from LDVs, with the 1990 amendment expanding standards to non-methane organic gases, carbon monoxide, particulate matter, and formaldehyde (EPA, 2015c). EPA considers vehicle fuel economy as part of its GHG rules (EPA, 2015b), as reducing the quantity of fuel combustion reduces the vehicle emissions released. In addition to climate change-related benefits, reductions in vehicle emissions present benefits to public health, with exposure to criteria pollutants associated with negative health outcomes (Utell et al., 1994). Switching vehicles to non-petroleum sources of energy, such as electricity, has the potential to provide reductions in criteria pollutants where the vehicle is operating, and also at the source of electricity emissions, if non-combustion processes are used, or if emissions reductions are implemented at the power plant.
2.3.3.3 Vehicle Efficiency Information and Labeling
EPA fuel economy labeling has been on vehicles since 1974, with the most recent label design (2012) providing ratings on vehicle smog and GHG emissions and estimates of how much the consumer will save on fuel in the next 5-year period (compared with an average new vehicle), among other information (EPA, 2015a). Fuel economy labels provide information to inform consumers’ purchases. However, the way consumers perceive and experience value from fuel economy is complex, as detailed in Chapter 11.
2.3.3.4 State and Local LDV Efficiency and Emissions Regulations
Several states and localities also have requirements for vehicle fuel economy, energy use, or GHG emissions. California’s Zero-Emission Vehicle (ZEV) program is a prominent example, establishing a credit system to require
automakers to produce a certain number of vehicles that do not necessarily emit directly at the tailpipe (e.g., PHEVs, BEVs, FCEVs). Estimates show that this credit system may lead to 8% of 2025 new vehicle sales in California being ZEVs, and these ZEV regulations have been adoption by nine other states (CARB, 2020). In September 2020, Governor Newsom signed an executive order requiring 100% of new passenger cars and light trucks purchased in the state of California to be zero-emissions by 2035, although the regulations that will enforce meeting this goal have not yet been developed. The current California ZEV program is discussed further in Chapter 12.
2.3.3.5 Incentives for Different Fuels and Powertrains
Governments (international and U.S. national, state, and local governments) have provided incentives for the adoption of different powertrain technologies and use of different fuel types. Such incentives have included purchase subsidies and operational incentives. One example of purchase subsidies for powertrains is the U.S. federal government plug-in electric vehicle tax credit, which provides consumers with a tax rebate ranging from $2,500 to $7,500 depending on vehicle specifications (AFDC, 2020a). A discussion of the economic considerations pertaining to incentives is presented in Chapter 11. Incentives and requirements for the use of alternative fuels are also present, notably, the Renewable Fuel Standard (RFS) and the California Low Carbon Fuels Standard (LCFS). The RFS program sets volume requirements for the presence of different renewable fuels in the fuel mix sold in the United States (AFDC, 2020b). The California LCFS requires yearly decreases in the carbon emissions intensity of gasoline, diesel, and their substitutes. This is accomplished through decreasing life cycle GHG emissions standards to be met by fuel providers, with tradeable credits between under- and over-emitting providers. Further discussion of alternative fuels’ GHG and energy use impacts are found in Chapter 10, and discussion of incentivizing fuels through regulation is presented in Chapter 12.
2.4 TEST CYCLE AND REAL-WORLD FUEL ECONOMY
Manufacturer compliance with the fuel economy standard is based on an individual vehicle model’s performance of a two-cycle test procedure under controlled conditions on a vehicle dynamometer (49 U.S.C. § 32904[c]). A driver completes one of two speed versus time traces on a dynamometer while the vehicle’s energy consumption (FCEVs, EVs) or emissions (HEVs, ICEVs) or a combination (PHEVs) are collected to determine its energy consumption, fuel consumption, and/or GHG emissions. One time trace is meant to mimic a city driving cycle and one a highway driving cycle, and they are weighted at 55% for the city cycle and 45% for the highway cycle. These tests are typically conducted by auto manufacturers, with occasional compliance checks by the EPA.
The two-cycle test overestimates the efficiency of vehicles relative to what drivers experience in typical driving. Fuel economy estimates for customer communication and labeling purposes for new LDVs are determined based on five standardized fuel economy test cycles conducted in a highly controlled laboratory environment. The five tests are the city cycle, highway cycle, a high-speed cycle, a cycle including air conditioning, and a cold temperature cycle, each of which are meant to simulate specific real-world driving conditions. Off-cycle credits can be awarded to technologies that deliver real-world fuel economy benefits or decrease emissions but are insufficiently counted on the official test cycle. Other driving conditions excluded from the tests that may reduce fuel economy, such as wind, low tire pressure, rough roads, hills, snow, or ice, are accounted for in the fuel economy labels by decreasing the measured fuel economy by an adjustment factor; however, this adjustment is not applied to CAFE compliance measurements.
The fuel economy label values, which include correction factors and are better estimates of real-world fuel economy, are about 20% lower on average than the fuel economy calculated using the test cycles. This discrepancy is particularly important because compliance with CAFE standards is based solely on the test cycles, with no adjustment for real-world conditions that are not accounted for in the cycles. This gap between test cycle and real-world fuel economy could adversely affect advances in real-world fuel economy in two key ways. It could incentivize manufacturers to design their vehicles to minimize fuel consumption based on the specific parameters of the test cycles, rather than real-world driving conditions. Second, this system does not reward manufacturers for non-powertrain technologies that reduce fuel consumption in real-world conditions but do not impact the test cycle results.
Up-to-date real-world fuel economy data are critical to evaluating the performance of vehicles, of the standards, and of the test cycles as compliance measures, but the United States currently has no database of or method to collect such data. The data could be collected through sampling of vehicle emissions, through collection of information stored in the vehicle’s onboard diagnostic unit, or through remote sensing methods.
2.5 REFERENCES
AFDC (Alternative Fuels Data Center). 2020a. “Qualified Plug-In Electric Vehicle Tax Credit.” https://afdc.energy.gov/laws/409.
AFDC. 2020b. “Renewable Fuel Standard.” https://afdc.energy.gov/laws/RFS.html.
AMFA (Alternative Motor Fuels Act of 1988.) 1988. United States Code. Vol. 102. https://www.govinfo.gov/content/pkg/STATUTE-102/pdf/STATUTE-102-Pg2441.pdf.
CARB (California Air Resources Board). 2020. “Zero-Emission Vehicle Program.” https://ww2.arb.ca.gov/our-work/programs/zero-emission-vehicle-program/about.
EISA (Energy Independence and Security Act). 2007. United States Code. Vol. 121.
EPA (U.S. Environmental Protection Agency). n.d. “Where the Energy Goes.” https://www.fueleconomy.gov/feg/atv-hev.shtml.
EPA. 2015a. “Learn About the Fuel Economy Label.” Collections and Lists. September 3. https://www.epa.gov/greenvehicles/learn-about-fuel-economy-label.
EPA. 2015b. “Carbon Pollution from Transportation.” Overviews and Factsheets. September 10. https://www.epa.gov/transportation-air-pollution-and-climate-change/carbon-pollution-transportation.
EPA. 2015c. “Light Duty Vehicle Emissions.” Overviews and Factsheets. October 13. https://www.epa.gov/greenvehicles/light-duty-vehicle-emissions.
EPA. 2019. Inventory of U.S. Greenhouse Gas Emissions and Sinks 1990–2017. EPA-430-R-19-001. April.
EPA. 2020. The 2019 EPA Automotive Trends Report: Greenhouse Gas Emissions, Fuel Economy, and Technology Since 1975. EPA-420-R-19-002. March.
EPA/NHTSA (U.S. Environmental Protection Agency and National Highway Traffic Safety Administration). 2012. “2017 and Later Model Year Light-Duty Vehicle Greenhouse Gas Emissions and Corporate Average Fuel Economy Standards.” Federal Register 77(99).
EPA/NHTSA/CARB (U.S. Environmental Protection Agency, National Highway Traffic Safety Administration, and California Air Resources Board). 2016. Draft Technical Assessment Report: Midterm Evaluation of Light-Duty Vehicle Greenhouse Gas Emission Standards and Corporate Average Fuel Economy Standards for Model Years 2022–2025. EPA-420-D-16-901. https://www.nhtsa.gov/staticfiles/rulemaking/pdf/cafe/Draft-TAR-Final-Executive-Summary.pdf.
EPAct (Energy Policy Act of 2005). 2005. United States Code. Vol. 119.
EPCA (Energy Policy and Conservation Act). 1975. United States Code. Vol. 89.
NHTSA/EPA (National Highway Traffic Safety Administration and U.S. Environmental Protection Agency). 2020. The Safer Affordable Fuel-Efficient (SAFE) Vehicles Rule for 2021–2026 Passenger Cars and Light Trucks. April 30. https://www.govinfo.gov/content/pkg/FR-2020-04-30/pdf/2020-06967.pdf.
U.S. Department of State. n.d. “Oil Embargo, 1973–1974.” Office of the Historian. https://history.state.gov/milestones/1969-1976/oil-embargo.
United States Code. 1990. Clean Air Act Amendments, Pub. L. No. 101–549 (1990). https://www.govinfo.gov/content/pkg/STATUTE-104/pdf/STATUTE-104-Pg2399.pdf.
Utell, M.J., J. Warren, and R.F. Sawyer. 1994. Public health risks from motor vehicle emissions. Annual Review of Public Health 15:157–178. https://doi.org/10.1146/annurev.pu.15.050194.001105.


