
Appendix C
Determining Risk Values When Evaluating Medical Product Supply Chain Resilience
As described in Chapter 5, one way to think of the resilience of medical product supply chains is in terms of reducing the Total Expected Harm (Equation 5-1), which is the sum of expected harm to individual people. To compute Total Expected Harm, estimate the patient harm from a unit of shortage of product i (Hi) and the expected supply shortage of product i in any given year (Si), and multiply them to compute product risk level (Ri = Hi × Si). Total patient harm is the sum of the risks from all medical products. To reduce it in an efficient manner, products with high expected risk levels (Ri) warrant increased attention. However, as pointed out in Chapter 5, equity and risk of events must be considered, which requires thinking beyond products with high expected risk levels. Reducing the likelihood or severity of shortages of some products may be needed to protect small populations (e.g., patients with a rare condition) from extreme harm, or to protect the public against unlikely but catastrophic events (e.g., nuclear attacks). Supply chain critical refers to products for which enhancing supply chain resilience is important to mitigate Total Expected Harm or specialized risks.
For each product on the supply chain critical list, appropriate targets must be determined for how much to enhance supply chain resilience. The reason for this is to achieve a balanced resilience strategy that allocates resources where they will do the most good. Adding protections should be avoided for one product that provides little added benefit when the resources could have yielded more benefit if spent protecting another product. This appendix describes the procedures for estimating expected risks and setting protection targets for medical products.
DETERMINING EXPECTED RISK VALUES
Assigning values to Hi and Si for a given product can be done with simple, subjective surveys and/or sophisticated, analytical evaluations. An example of a simple process would be to survey appropriate experts for categorical (e.g., low, medium, high) estimates. For example, to estimate Hi, medical experts could be asked to evaluate the health consequences of a single patient being deprived of product i because of a shortage. To do this, the experts should consider the alternative treatment strategy (e.g., crisis standards of care) and the difference in the clinical outcome with and without product i. Knowledgeable professionals can probably give qualitative (low, medium, high) estimates with relative ease. Analogously, supply chain experts could be polled to estimate the likelihood of small (e.g., <10% of annual demand), medium (10-50% of annual demand) or large (>50% of annual demand). Averaging expert estimates would constitute a form of crowd sourcing to estimate Hi and Si.
Subjective estimates by experts could be complemented or replaced by more detailed analytic evaluations. For example, one could estimate Hi by evaluating the impact on quality adjusted life years (QALYs) of forcing patients in different categories (e.g., age groups or severity levels) to substitute the next best treatment alternative for product i and averaging across categories. Similarly, analytic estimates of Si could be made by evaluating shortages caused by various trigger events. Analytics techniques, such as machine learning, might be helpful in leveraging past data to estimate event probabilities and shortage levels.
However, because it is impossible to identify every possible trigger event, such estimates will always be subject to error. The uncertainty in estimates will be relatively small for routine events, such as shortages caused by manufacturing quality events or firm exit from the market. But they will be large for rare emergency events, such as global pandemics. To consider these, each trigger should be evaluated to generate a reasonably comprehensive range of scenarios. For example, the triggers might suggest scenarios that cause partial and full shutdowns of production, brief and lengthy disruptions, demand surges, and combinations of these (e.g., a scenario in which supply is constrained while demand surges, as happened with N95 masks in the early months of the COVID-19 pandemic). Clearly, such detailed scenario analysis is not needed to make reasonable choices about what products to include on the supply chain critical list. However, the data from such an analysis can be useful in determining supply chain resilience targets, which is the subject of the next section.
SETTING SUPPLY CHAIN RESILIENCE TARGETS
Knowing that a product presents a supply chain risk, the challenge then becomes how to reduce this risk to a socially acceptable level. To guide the risk reduction process, a target should be set for the amount of shortage protection needed for the product. Such a protection target can be thought of in terms of the number of units, Xi for product i, or equivalently in terms of the “weeks of supply,” labeled Ti. These are equivalent because if Di represents the average weekly demand for product i, then one can compute the time Xi units will last as follows:
| Ti weeks = Xi units 4 Di units/week | (Equation C-1) |
That is, a supply of Xi units will cover a shortage event that cuts off 100 percent of production for Ti weeks.
It is standard practice in inventory and supply chain management to refer to inventory levels in units of time because it highlights the level of protection much more clearly than does referring to inventory in units of items. For instance, holding 10,000 units of inventory in a stockpile provides a much higher level of protection for a product with weekly demand of 1,000 units than for a product with weekly demand of 100,000 units. This inventory level represents a 10-week supply in the first case, but only a 1/10-week supply in the second case.
However, the conversion between time and inventory needs to be adjusted when the disruption rate does not equal the normal demand rate. For example, if a product has multiple suppliers, it might be the case that almost all plausible disruptions would cut off only a fraction of the supply. If it were estimated that a disruption is likely not to exceed Fi times the demand, where Fi is an adjustment factor (unitless), the “weeks of supply” target Ti can be converted into inventory units as follows:
| Xi units = Ti weeks × Di units/week × Fi | (Equation C-2) |
For many products, such as insulin for diabetics or chemotherapy drugs for cancer patients, the underlying demand Di is very stable. For such products, the value of adjustment factor Fi will be less than or equal to 1 (≤ 1) and will depend on the diversification of the supply chain. However, some medical products, such as personal protective equipment (PPE) and blood plasma, are part of the emergency response and therefore can experience substantial demand surges. For these, it is possible for Fi to be greater than 1 (>1). Therefore, Fi must be accounted for when setting a protection
target Xi, which may be more easily done by dividing the list of supply chain critical products into two subgroups, those for which demand is independent of an emergency and those for which demand may be amplified by an emergency.
Protection Volume and Time Targets
The protection volume target (Xi) for product i is the amount of supply shortfall that product i should be able to accommodate without harming people, while the protection time target (Ti) for product i is the duration of a disruption that creates a supply shortfall equal to a fraction (Fi) of the normal demand rate (Di). The two targets are equivalent because they are related by Equation C-2.
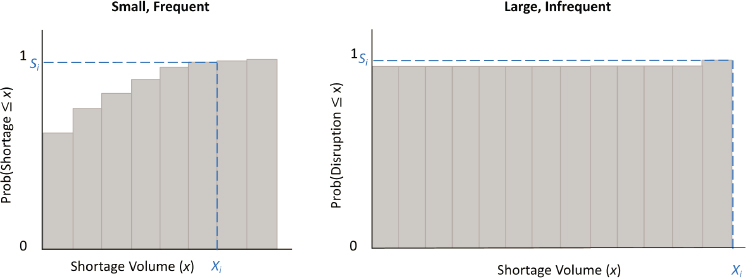
Setting an appropriate protection volume target of Xi or a protection time target of Ti requires consideration of the profile of possible shortages. For example, if a detailed scenario analysis was performed to compute the expected shortage amount Si, one could use the data shortage probabilities and magnitudes to generate a cumulative probability distribution like those shown in Figure C-2. In these histograms, the bars represent that the total shortage of supply in the upcoming year will be less than or equal to x for various values of x. The first bar on the left of each graph indicates the probability of a shortage of less than or equal to zero (i.e., equal to zero, since negative shortages do not occur), and hence all bars include the probability of no shortage at all.
The two graphs in Figure C-1 represent two very different types of products. The left graph, labeled “Short, Frequent,” characterizes a product where shortages are likely, as indicated by the fact that the first bar in the histogram (which represents the probability of zero shortage) is substantially less than 1. However, the likelihood that the shortage will be small is high, as indicated by the fact that the bars approach 1 for a modest level of x. In contrast, the right graph, labeled “Long, Infrequent,” characterizes a product where shortages are very unlikely, as indicated by the fact that the first bar is almost 1. But there is a small probability of a very large shortage (indicated by the slightly taller bar toward the far right of the graph).
It is possible that the two scenarios depicted in Figure C-1 have the same expected shortage (Si). As such, if they both have high patient harm scores (Hi), they may both warrant inclusion on the supply chain critical list. Nevertheless, both present very different situations for setting and achieving a supply chain resilience target. The short, frequent shortage product might be virtually prevented by holding a relatively modest amount of inventory, which would be used often. This is why high-margin products generally have such protections built into their supply chains, since the revenue and reputation preservation value of maintaining continuity of supply outweighs
the cost of holding extra inventory. However, as noted in Chapter 5, products with low margins, such as generic drugs, are much less likely to have protections against short, frequent shortages built into their supply chains.
In contrast, providing almost certain protection against long, infrequent shortages would require holding a massive amount of inventory, which is unlikely to be used. In general, regardless of margin, private industry will not find it economical to provide such protection. However, these scenarios will occur and may require public intervention to address. Since holding large amounts of rarely used inventory is expensive, there is strong incentive to consider alternative resilience interventions. The medical product supply chain resiliency framework in Chapter 5 provides a tool for identifying options.
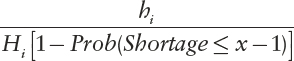
Returning to the quantitative question of how much protection is appropriate for product i, suppose (for the sake of building intuition) that the bars in the Small, Frequent case of Figure C-1 are only one unit wide. That is, a massively detailed set of scenarios has been generated to estimate the probabilities of a shortage of 1 unit, 2 units, 3 units, and so forth. The Prob(Shortage ≤ x) for any integer value of x can be computed, which allows one to express the probability of needing the xth unit of protection in any given year as Prob(Shortage ≥ x) = 1 – Prob(Shortage ≤ x−1). Therefore, if Hi is expressed in QALYs, the expected benefit (in units of expected QALYs) of having the xth unit of protection is Hi [1 – Prob(Shortage ≤ x−1)]. Therefore, if Hi is expressed in QALYs, the expected benefit (in units of expected QALYs) of having the xth unit of protection is Hi [1 – Prob(Shortage ≤ x−1)]. If that protection is provided by inventory, then the cost of this extra inventory is simply the cost to hold one unit of inventory for one year, which is conventionally expressed by hi. This would imply one is paying
 |
(Equation C-3) |
dollars per QALY saved.
If the objective is to save as many QALYs as possible for a given investment budget, then protection targets should be set for the various products on the supply chain critical list so that the cost per QALY is roughly the same. If not, then the implication is that shifting investment from one product to another can increase the reduction in total harm. Deliberate overspending on some products may occur to avoid inequitable risk to certain populations or to provide protection against rare but catastrophic outcomes. Furthermore, it is clear that probability data at a granular level in the real world will almost never be possible. Nevertheless, this technical dive into the analytics of setting protection targets highlights the need for alignment of risks and rewards. For example, if the Strategic National Stockpile holds inventory for two products with similar Hi values but holds an amount equivalent to the 99.9th percentile of the shortage distribution for one product and inventory equivalent to the 50th percentile of the shortage distribution for the other, then there is probably an opportunity to make better use of resources.
An approximate or qualitative version of the above calculation can be useful for products subject to short, frequent shortages. But for products with long, infrequent shortages, even a heuristic version of this calculation is impractical because we must deal with tiny probabilities of major events, where the tiny probabilities are subject to considerable uncertainty. Because of this, it makes sense to approach products with a very low risk of a major disruption by focusing on a single reference event that represents a major emergency, such as a global pandemic. One rationale for this is that whatever measures used to attain a given service level for this major reference event will provide even higher service levels for smaller events. Furthermore, considering a single scenario allows for the disruption factor (Fi) to be fixed, for instance to account for a demand surge that is part of the scenario. This in turn will allow for considering the protection target in terms of the more intuitive weeks of supply (Ti) instead of in terms of volume (Xi).
With a single major reference event in mind, a more narrowly focused risk analysis of the possible outcomes can be made, from best case to worst case, and generate a conditional cumulative probability distribution like that shown in Figure C-2. This distribution is conditional because it assumes the event has happened. Hence, the histogram bars represent the probability that the reference shortage event results in a shortage of t weeks or less (at an adjusted demand level of FiDi) given that the trigger event has occurred. If the event is presumed to have occurred, there is no chance of zero shortage (and hence no histogram bar at the origin). Furthermore, the probabilities represented by the histogram bars will rise steadily to 1 as the values of t traverse the possible durations of the shortage event. The choice
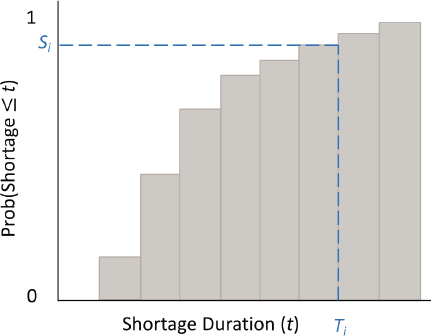
of a protection time target (Ti) will boil down to deciding the length of a disruption to the supply chain for product i that can be endured without harm to humans.
Note that the histogram bars in any conditional cumulative probability distribution like that depicted in Figure C-2 will equal 1 for all values of t above some level. The reason is that, given sufficient lead time, new production capacity can be brought online. For example, suppose a massive natural disaster destroys a large percentage of the world’s capacity for producing N95 masks at the same time a global biological event spikes worldwide demand for masks. Surging demand means the demand fraction adjustment factor (Fi) will be greater than 1, and hence weekly shortfall may well exceed the pre-emergency demand rate. Hence, a very large protection volume target (Xi) will be needed to provide protection for several weeks or months. Nevertheless, if Xi is sized to cover a time period long enough to repair and expand the existing production facilities or to construct new ones, the service level will be 1 (100 percent).
This implies the need to consider existing capabilities for capacity expansion or restoration when deciding on a volume or time protection level for a given product. For example, a trigger event should not be considered a shortage until it exceeds readily available capacity, which includes that from working overtime or scheduling extra shifts. Intermediate lead time capacity must also be accounted for, such as that achieved by hiring and training new workers or repurposing existing facilities to expand capacity, when estimating shortage magnitudes in the risk assessment process. Finally, the time to bring entirely new capacity online as an upper limit on
the protection time target must also be accounted for. The framework in Chapter 5 provides a structure for thinking through options for generating capacity that will limit the need to store excessive amounts of inventory as protection against a rare but extreme emergency.


