
Appendix E
White Paper: Review of the PFAS Personal Intervention Literature
Prepared for:
Elizabeth B. Boyle
Senior Program Officer
Board on Environmental Studies and Toxicology
Board on Population Health and Public Health Practice
National Academies of Sciences, Engineering, and Medicine
and
Committee on the Guidance on PFAS Testing and Health Outcomes
Washington, DC, USA
Prepared by:
Judy S. LaKind, Ph.D.
LaKind Associates, LLC
Catonsville, MD, USA
Josh Naiman, B.A.
LaKind Associates, LLC
Philadelphia, PA, USA
Acronyms and Abbreviations
| AC | activated carbon |
| ATDSR | Agency for Toxic Substances and Disease Registry |
| CDC | Centers for Disease Control and Prevention |
| CI | confidence interval |
| EPA | U.S. Environmental Protection Agency |
| Et-PFOSA-AcOH | 2-(n-ethyl-perfluorooctane sulfonamido) acetic acid |
| EtFOSAA | 2-(n-ethyl-perfluorooctane sulfonamido) acetic acid |
| FDA | U.S. Food and Drug Administration |
| GAC | granular activated carbon |
| H2PFDA | 2H,2H-perfluorodecanoic acid |
| H4PFOS | 1H,1H,2H,2H-perfluorooctane sulfonic acid |
| H4PFUnDA | 2H,2H,3H,3H-perfluoroundecanoic acid |
| L-PFHpS | sodium perfluoro-1 heptanesulfonate |
| LOD | limit of detection |
| LOQ | limit of quantitation |
| MDH | Minnesota Department of Health |
| Me-PFOSA-AcOH | 2-(n-methyl-perfluorooctane sulfonamido) acetic acid |
| MeFOSAA | 2-(n-methyl-perfluorooctane sulfonamido) acetic acid |
| MRL | Minimum Reporting Level |
| n-EtPFOSAA | n-ethyl-perfluoro-1 octanesulfonamido acetic acid. |
| n-MePFOSAA | n-methylperfluoro-1 octanesulfonamido acetic acid |
| n-PFOA | n-perfluorooctanoic acid |
| n-PFOS | n-perfluorooctane sulfonic acid |
| NEtFOSE | N-ethyl perfluorooctane sulfonamidoethanol |
| NHANES | National Health and Nutrition Examination Survey |
| NIEHS | National Institute of Environmental Health Sciences |
| PBDE | polybrominated diphenyl ether |
| PCB | polychlorinated biphenyl |
| PFAA | perfluoroalkyl acid |
| PFAS | per- and polyfluoroalkyl substances |
| PFBA | perfluorobutanoate |
| PFBS | perfluorobutane sulfonic acid |
| PFC | perfluorinated compound |
| PFCA | perfluoroalkyl carboxylic acid |
| PFDA | perfluorodecanoic acid |
| PFDcA | perfluorodecanoate |
| PFDoA (PFDoDA) | perfluorododecanoic acid |
| PFDeA | perfluorodecanoic acid |
| PFDS | perfluorodecane sulfonate |
| PFHpA | perfluoroheptanoic acid |
| PFHpS | perfluoroheptane sulfonate |
| PFHxA | perfluorohexanoate |
| PFHxS | perfluorohexane sulfonic acid |
| PFNA | perfluorononanoic acid |
| PFOA | perfluorooctanoic acid |
| PFOS | perfluorooctane sulfonic acid |
| PFOSA or FOSA | perfluorooctane sulfonamide |
| PFPeA | perfluoropentanoate |
| PFTeA | perfluorotetradecanoate |
| PFTeDA | perfluorotetradecanoic acid |
| PFTrA | perfluorotridecanoate |
| PFTrDA | perfluorotridecanoic acid |
| PFUA | perfluoroundecanoate |
| PFUnA | perfluoroundecanoic acid |
| PFUnDA | perfluoroundecanoic acid |
| POE | point of entry |
| POTW | publicly owned treatment work |
| POU | point of use |
| RO | reverse osmosis |
| Sb-PFOA | branched perfluorooctanoic acid |
| SD | standard deviation |
| Sm-PFOS | perfluoromethylheptane sulfonic acid |
| UCMR | Unregulated Contaminant Monitoring Rule |
| ww | wet weight |
Abstract
This white paper provides an overview of the published literature on whether personal behavior modifications can demonstrably reduce exposure to per- and polyfluoroalkyl substances (PFAS) (e.g., by showing decreases in serum levels). The reviewed studies are presented by exposure source. The preponderance of the identified literature relates to diet and drinking water. Literature on interventions for other exposure sources, such as dust and consumer products, is more limited. Breastfeeding is an important potential source of exposure for infants; the effect of lactation on mothers’ PFAS levels is unclear. For communities with high levels of PFAS in drinking water, interventions related to tap water filtration showed some efficacy in reducing PFAS levels in the water. It is possible that an intervention may reduce PFAS levels in a particular medium, but if this medium is not a major source of overall exposure, then that intervention may not contribute significantly to reduction in human exposures. Overall, the intervention literature is sparse and has many limitations. Thus, the committee may have to rely on assumptions and other bodies of evidence to make recommendations to individuals and communities about exposure reduction.
E-1
Introduction
Per- and polyfluoroalkyl substances (PFAS) are anthropogenic chemicals that have been produced and utilized globally since the 1940s.1 PFAS have garnered attention for several reasons, including their ubiquitous presence in the environment (Ahrens and Bundschuh, 2014; von der Trenck et al., 2018) and in humans (Calafat et al., 2019; Göckener et al., 2020; Health Canada, 2019; Kannan et al., 2004), and because—as their epithet “forever chemicals” suggests—many of these chemicals are persistent both in the environment and in humans, with half-lives estimated to be several years (Li et al., 2018; Myers et al., 2012). Exposure to PFAS has been linked with such health endpoints as reduced immune response, lipid metabolism, and kidney function; thyroid disease; liver disease; glycemic parameters and diabetes; cancer; and impaired fetal and child development (ATSDR, 2020).
Activities to limit the production and use of exposure to PFAS compounds include regulatory limits, voluntary reductions in manufacture (Butenhoff et al., 2006) and use in products, cleanup of contaminated sites, and modifications to publicly owned treatment works (POTWs) to reduce PFAS in drinking water. However, as evidenced by studies of measurements of PFAS in serum from nationally representative populations in the United States (Calafat et al., 2019), as well as serum measurements in communities near sites with known contamination (Herrick et al., 2017), exposure to PFAS is ongoing. It has been well documented that PFAS are present in numerous media and products, including drinking water; breast milk; other foods and food packaging material; cosmetics; and household products, including carpets, stain- and water-repellent fabrics, nonstick products, polishes, waxes, paints, and cleaning products (D’Hollander et al., 2010; EFSA, 2020; Eichler and Little, 2020; Fromme et al., 2009; Sajid and Ilyas, 2017; Sunderland et al., 2019).2
Communities impacted by PFAS exposure would like advice on how they can prevent its potential health effects. To help clinicians respond to patient concerns about PFAS exposure, the Agency for Toxic Substances and Disease Registry (ATSDR) has published PFAS: An Overview of the Science and Guidance for Clinicians on Per- and Polyfluoroalkyl Substances (referred to hereafter as the ATSDR PFAS Clinical Guidance) (ATSDR, 2019). This guidance summarizes general information about PFAS and PFAS health studies and suggests answers to example patient questions. Some people living in PFAS-impacted communities have voiced frustration that the clinical guidance lacks clear recommendations to their physicians about what people can do to protect their health, which prompted the ATSDR and the National Institute of Environmental Health Sciences (NIEHS) to request that the National Academies of Sciences, Engineering, and Medicine convene a committee to provide advice for clinicians about PFAS testing, such as when to test, whom to test, how to test, what to test for, and the risks of testing. The committee is also charged with developing principles clinicians can use to advise patients on exposure reduction.3 The committee commissioned this white paper to determine whether evidence exists that supports the effectiveness of these types of behavior changes. The literature review in this white paper is intended to help the National Academies committee evaluate possible evidence-based recommendations for improving the ATSDR’s PFAS Clinical Guidance. This white paper is not intended to be a comprehensive review of human exposure to PFAS; the National Academies have other sources for that information.
Various organizations have provided suggestions for personal actions to lower individual PFAS exposure. These include avoiding contaminated water or fish and selecting personal care products that do
___________________
1 See https://www.epa.gov/pfas/basic-information-pfas (accessed May 12, 2021).
2 See also https://www.epa.gov/pfas/basic-information-pfas (accessed May 12, 2021).
3 See the committee’s full Statement of Task at https://www.nationalacademies.org/our-work/guidance-on-pfas-testing-and-health-outcomes (accessed May 19, 2021).
not contain PFAS and related compounds (ATSDR, 2020; EWG, 2016; Loria, 2019; ODH, 2020). Reducing intake of PFAS should reduce exposure, but people may not necessarily know whether their foods, beverages, or products contain PFAS. This review addresses the following question: Based on current research, are there interventions or personal changes that individuals can make to effectively reduce their PFAS exposure? This question includes two key concepts. First, “personal” indicates that the focus is on research related to media and products that people may be able to control partly or wholly (see Figure E-1) as opposed to activities that occur on a larger scale, such as contaminated site cleanup, changes in occupational exposures, or modifications to publicly owned water treatment plants. Second, “effectively” refers to changes in personal behavior that can result in measurable or substantial reductions in exposures.
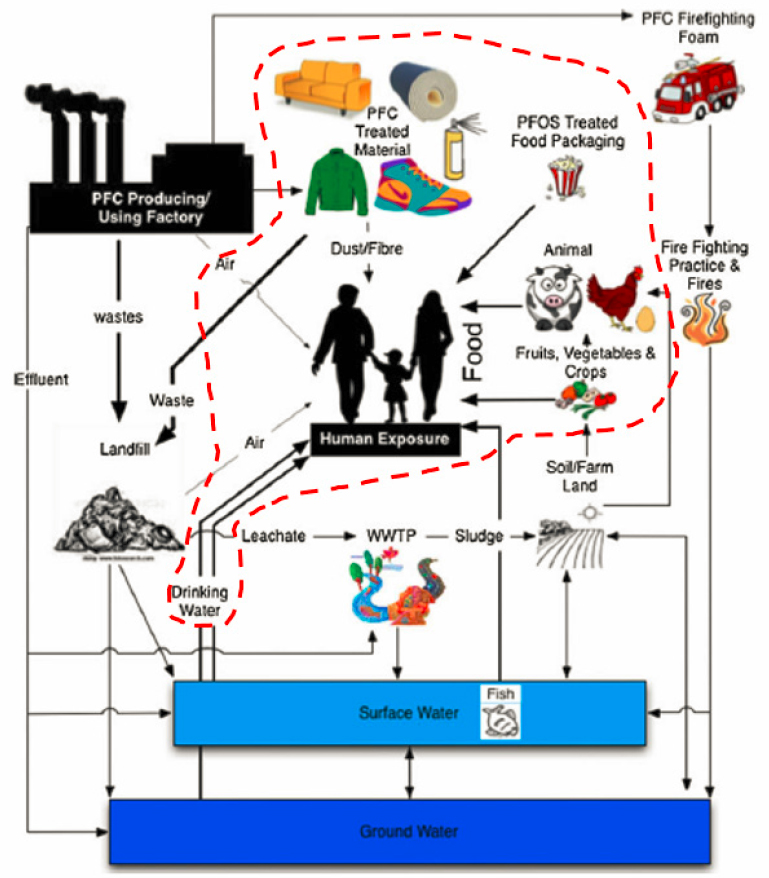
NOTE: PFC = per-/polyfluorinated chemical; WWTP = wastewater treatment plant.
SOURCE: Adapted from Oliaei et al., 2013. CC BY 4.0.
To answer the above question, it is important to consider several factors related to reducing human PFAS exposure. First, PFAS must be present in the media or products of interest. While this seems like a straightforward notion, information on PFAS concentrations in local media (e.g., local
drinking water) and specific products (e.g., cookware) may in fact be sparse or unavailable. Second, there must be a complete exposure pathway between the medium or product and humans. In other words, if PFAS are present in a medium or product but there is no human contact, then exposure will not occur. Third, an exposure pathway may be complete but not contribute substantially to overall human exposure. In this case, a reduction in the PFAS source may not result in a meaningful reduction in human PFAS exposure. Fourth, actions to reduce PFAS exposure from one pathway may result in exposure to PFAS or other chemicals from a new pathway (e.g., an action to remove exposure to one food item with known PFAS levels may result in exposure to another food item that has not yet been analyzed for PFAS or other chemicals). Finally, PFAS tend to have long physiological half-lives; thus, interventions or changes in behavior may not produce near-term changes in internal PFAS levels (i.e., serum levels).
Taking these issues into consideration, this white paper explores the following three questions:
- Is there research that links specific interventions or changes to reductions in human exposures? This paper focuses on studies seeking to establish that an intervention or behavioral change produces a quantifiable reduction in human exposure as evidenced by measurements of PFAS in the media of interest or directly in humans. As noted above, studies relying on biomonitoring to assess the efficacy of an intervention must consider the long half-lives of many PFAS and must be of appropriate duration to enable observation of postintervention decreases in serum levels.
- Can information from exposure assessments that estimate human intakes from multiple pathways of exposure and exposure routes be used as the basis for individual or community recommendations? In this type of study, measurements of PFAS in various media are used to model human PFAS intake (i.e., nanograms [ng] per day or ng/kilogram [kg] per day). If sufficient measurement data are available, it may be possible to estimate the relative importance of various pathways of exposure.
- Is the available research sufficiently robust such that recommendations for modifications to behavior can be made? Studies differ in terms of their quality and generalizability (i.e., how well the results translate from the studied population and conditions to other populations and conditions). They therefore also differ in terms of the confidence one can place in the results. Factors impacting confidence in studies can include sample size, quality assurance, inter- and intrastudy consistency in results, and completeness of reporting. In addition, for recommendations applicable to the United States, it is important to consider whether the studies reflect conditions that apply to behaviors and exposures in this country.
The remainder of this paper first describes our approach to identifying and reviewing the literature. We then provide results by medium. Next, we discuss efforts to model relative contributions of media and products to overall PFAS intakes in the United States.
We note that there are more than 9,000 PFAS compounds (NASEM, 2021), and any given study generally examines only a very small subset of these. We focus here on the 16 PFAS4 chemicals included in the Centers for Disease Control and Prevention’s (CDC’s) National Report on Human Exposure to Environmental Chemicals (CDC, 2009).
___________________
4 PFBS: perfluorobutane sulfonic acid; PFDA: perfluorodecanoic acid; PFDoA: perfluorododecanoic acid; PFHpA: perfluoroheptanoic acid; PFHxS: perfluorohexane sulfonic acid; PFNA: perfluorononanoic acid; PFOA: perfluorooctanoic acid; n-PFOA: n-perfluorooctanoic acid; Sb-PFOA: branched perfluorooctanoic acid; PFOS: perfluorooctane sulfonic acid; n-PFOS: n-perfluorooctane sulfonic acid; Sm-PFOS: perfluoromethylheptane sulfonic acid; PFOSA or FOSA: perfluorooctane sulfonamide; EtFOSAA: 2-(n-ethyl-perfluorooctane sulfonamido) acetic acid; MeFOSAA: 2-(n-methyl-perfluorooctane sulfonamido) acetic acid; PFUnDA: perfluoroundecanoic acid. The various PFAS abbreviations used in this paper are defined in the listing at the beginning of the paper. For brevity, these abbreviations are not spelled out further in the text of this paper.
E-2
Methods
This review is a scoping review that aims to (1) “identify the types of available evidence in a given field,” (2) “report on the types of evidence that address and inform practice in the field and the way the research has been conducted,” (3) “examine how research is conducted on a certain topic,” and (4) “identify and analyze gaps in the knowledge base” (Munn et al., 2018).
LITERATURE IDENTIFICATION
Online data sources, including PubMed, EMBASE, and Google Scholar, were used to conduct the initial literature searches. We used such keywords as “(PFBS OR PFDA OR PFDoA OR PFHpA OR PFHxS OR PFNA OR PFOA OR n-PFOA OR sb-PFOA OR PFOS OR n-PFOS OR Sm-PFOS OR PFOSA OR FOSA OR EtFOSAA OR MeFOSAA OR PFUnDA OR PFAS),” “PFAS,” “perfluoroalkyl,” “human,” “exposure,” “cooking,” “dust,” “fish,” “shellfish,” “water,” “nail polish,” “cleaning,” “consumer products,” “filter,” “water filter,” “filtration,” “intervention,” “determinant,” “reduction,” “diet,” “vacuum,” “popcorn,” “biomonitor,” “breast milk,” “breastfeeding,” “infant formula,” “milk powder,” “carpeting,” “packaging,” “indoor,” “bottled water,” “air conditioning,” “fabrics,” “well water,” “water treatment,” “apparel,” “inhalation,” “ventilation,” “cosmetics,” “dental floss,” and “personal care products,” as well as various combinations of these and related keywords. We selected articles describing interventions designed to reduce human exposure to PFAS, specifically interventions that could be carried out by individuals (e.g., excluding site cleanups, modifications of publicly owned treatments works [POTWs]). Secondary references of retrieved articles were reviewed to identify publications not identified by the electronic search. Additional literature searches were conducted to identify reviews that contained estimates of human PFAS intakes using the following keywords in different combinations: “(PFBS OR PFDA OR PFDoA OR PFHpA OR PFHxS OR PFNA OR PFOA OR n-PFOA OR sb-PFOA OR PFOS OR n-PFOS OR Sm-PFOS OR PFOSA OR FOSA OR EtFOSAA OR MeFOSAA OR PFUnDA),” “PFAS,” “exposure,” “review,” “biomonitor,” “PFOA,” and “human.” The final search date was March 5, 2021.
The criteria for inclusion in the review were as follows: studies of interventions related to personal modifiable behavior and English-language publications. Exclusion criteria included the following: occupational studies and those interventions requiring professional activities, such as modifications to POTWs. For publications on modeled intake estimates, we were interested primarily in PFAS intakes in the United States. Research focused on clinical interventions is outside the scope of this review (e.g., Ducatman et al., 2021; Genuis et al., 2014).
LITERATURE REVIEW AND DATA EXTRACTION
Each study that met the above inclusion criteria was examined by both authors. The data from each intervention study were tabulated. Information extracted from each study included (where available5) the following:
- description of the study population: size, composition, source, and location;
- study design: laboratory and population;
- type of specimen and number of samples;
___________________
5 Because of the disparate nature of the identified studies, it was often possible to include only a portion of the elements.
- PFAS and concentrations or changes in concentrations; and
- results: percent decrease/increase, concentration decrease/increase, and a measure of precision (e.g., 95% confidence interval [CI], standard deviation [SD]). (For publications with results reported qualitatively, the text was extracted and reproduced verbatim.)
ASSESSMENT OF EVIDENCE
We evaluated the overall strength of evidence for each medium, considering such elements as overall study design, participant selection, sample size, and exposure assessment (LaKind et al., 2014; Vandenbroucke et al., 2007). For studies using biomonitoring data to assess the efficacy of an intervention, we considered whether sampling intervals were designed to capture potential effects of the intervention. To assess the utility of the available evidence for providing recommendations for behavior modifications to reduce PFAS exposures, we examined such factors as (1) the number of available studies for each medium/PFAS chemical/intervention type combination, (2) the quality of the individual studies, (3) the intra- and interstudy consistency in results, and (4) the generalizability of the information to U.S. populations.
E-3
Results
Studies with the potential to provide information on methods that could be used by individuals for reducing exposure to PFAS were identified. The intervention areas include preparation of fish and other foods, reduction of exposure to PFAS in drinking water either via water filtration at point of entry (POE) or point of use (POU) or via consumption of bottled water, selection of cookware, minimization of indoor dust exposure through modification of indoor products, and use of personal care products or dietary fiber. Literature on breast milk/infant formula and both mother and infant PFAS exposure reduction is discussed. Finally, studies on source contributions to overall PFAS intake in the United States were identified. Each of these bodies of literature is described in the following sections.
FOOD PREPARATION: FISH, SHELLFISH, AND MOLLUSKS
Fish, shellfish, and mollusks have been studied for their potential as a source of PFAS exposure in humans. Nine studies examining the effect of various fish and seafood preparation methods on PFAS levels were identified. The studies included different species, cooking practices, and PFAS. We briefly summarize these studies here.
Alves and colleagues (2017) measured PFOS and PFUnA levels in mackerel and flounder purchased in markets in Spain, Italy, and the Netherlands (25 samples per species/location). PFAS were measured in raw samples and from samples steamed at 105°C for 15 minutes. No significant differences in concentrations were found between the steamed and raw samples. Mean concentrations of PFOS in flounder for raw and steamed samples were 24±1.5 nanograms per gram (ng/g) wet weight (ww) and 22±1.5 ng/g ww, respectively. Mean concentrations of PFUnA in mackerel for raw and steamed samples were 3.1±0.2 ng/g ww and 2.9±0.1 ng/g ww, respectively.
The 16 PFAS compounds identified previously (PFBA, PFPeA, PFHxA, PFHpA, PFOA, PFNA, PFDcA, PFUnA, PFDoA, PFTrA, PFTeA, PFBS, PFHxS, PFHpS, PFOS, and PFDS) were measured in raw and steamed tuna, hake, plaice (n = 25 each; fillets), and mussels (n = 50) purchased in European markets (Barbosa et al., 2018). Steaming was performed at 105°C for 15 minutes (fish) or 5 minutes (mussels). The effects of steaming varied considerably by both species and compound. Selected results shown in Figure E-2 illustrate these differences.
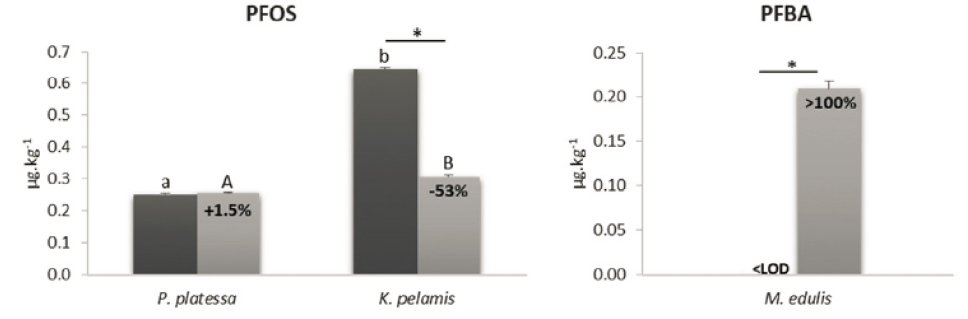
NOTE: * = significant differences (p <0.05) between raw and steamed samples.
SOURCE: Partially reprinted from Barbosa et al., 2018.
Bhavsar and colleagues (2014) measured various PFAS (including perfluoroalkyl carboxylic acids, perfluoroalkane sulfonic acids, perfluoroalkyl phosphonic acids, perfluoroalkyl phosphinic acids, and polyfluoroalkyl phosphoric acid diesters) in fresh-caught Chinook salmon, lake trout, common carp, and walleye obtained in Ontario, Canada (fillets from four or five fish per species). PFAS levels in the cooking oil were below the limit of detection (LOD). Fillet samples were placed on a layer of canola oil and fried, baked, or broiled for 10–15 minutes. PFOS was by far the dominant PFAS in each species; thus, the results were focused on the effects of cooking methods on PFOS fish concentrations. All cooking methods resulted in mostly statistically significant increases in concentrations of PFOS in salmon, trout, and walleye (the increase in walleye after frying did not appear to be statistically significant). For example, PFOS concentrations in raw, baked, broiled, and fried chinook salmon (mean ± standard deviation [SD]) were, respectively, 12.70±12.61 ng/g ww, 16.56±18.00 ng/g ww, 16.45±15.63 ng/g ww, and 16.03±15.19 ng/g ww. For carp, broiling and frying resulted in no significant changes. The authors also assessed the change in amount of PFOS (in contrast with the concentration change) to account for loss in mass due to cooking. With this approach, results were mixed in directionality and mostly nonsignificant.
Del Gobbo and colleagues (2008) analyzed fish and shellfish species purchased in Canadian markets for PFOA, PFNA, PFDA, PFUA, PFDoDA, PFTeDA, and PFOS. Species included catfish, cuttlefish, grey mullet, grouper, monkfish, octopus, red snapper, sea squirt, skate, whiting, and yellow croaker. Composites from each species were comprised of at least three individuals from three different sources or markets (total of nine). The fillets (sometimes with skin) were baked, boiled, or fried in water, sesame oil, rice wine, or vegetable oil. PFAS levels in the cooking oil were below the LOD. Baking and frying times were 15 minutes at 163°C or 325°C. All cooking interventions were found to decrease PFAS concentrations, with boiling and frying reducing total PFAS concentrations by an average of 79 percent and 54 percent, respectively. Baking reduced all measured PFAS to below the LOD (0.03–10 ng/g ww). Boiling appeared to increase concentrations of PFOS in octopus (from nondetect to 0.23 ng/g ww) but not in red snapper, skate, or yellow croaker. The authors hypothesize that large loss of mass in the boiled octopus (87 percent) may have resulted in an increase in levels above the LOD.
Hu and colleagues (2020) measured 13 PFAS compounds (PFBA, PFPeA, PFHxA, PFHpA, PFOA, PFNA, PFDA, PFUnDA, PFDoDA, PFBS, PFHxS, PFOS, and FOSA) in grass carp taken from Tangxun Lake, China (n = 5). The fillets were either steamed, boiled, fried, or grilled, with cooking temperatures for the various processes ranging from 100°C to 210°C. The authors note that in the “cooking blank juice samples all PFAS were below the MLQs [Method Quantitation Limit] except PFBS and PFOS. The concentrations of PFBS and PFOS in cooking blank samples were 1.31–2.43 ng/g and 0.131–0.169 ng/g, respectively” (Hu et al., 2020, p. 4). The effects of the cooking methods on concentrations of various PFAS compounds were found to be inconsistent. For example, median PFOS concentrations increased from 71.3 ng/g ww in uncooked fish to 146 ng/g ww in fried fillets. In contrast, median PFBS concentrations decreased from 20.3 ng/g ww in raw fish to 8.08 ng/g ww after grilling. These results exemplify the difficulty in characterizing the directionality and magnitude of the effectiveness of cooking fish as a proposed type of intervention.
Kim and colleagues (2020) measured 19 PFAS (PFOS, PFDS, PFHxS, PFTeDA, PFTrDA, PFDoA, PFUnDA, PFBS, PFDA, PFNA, PFOA, PFHpA, PFHxA, PFPeA, PFOSA, N-EtPFOSAA, N-MePFOSAA, L-PFHpS, and PFBA) in mackerel bought from a market in Korea (n = 10). Composited fillets from three mackerels each were prepared with various washing, soaking, and cooking (grill, braise, steam, or fry) methods (two composites each). The fish were cooked between 6 and 25 minutes with various ingredients including oil, water, potato, soy sauce, pepper paste, sugar, garlic, and ginger. Preparation methods included such traditional Korean practices as soaking the fillets in sake or rice-washed solutions. These soaking practices reduced PFAS levels by 51 to 80 percent. Washing the mackerel with water resulted in a reduction in PFAS of 74 percent. Similarly, all cooking methods reduced total PFAS content compared with the raw samples: grilling—91 percent, steaming—75 percent, frying—58 percent, and braising—47 percent. While cooking with potatoes further reduced PFAS levels in the mackerel, it also increased the levels in the potatoes.
Luo and colleagues (2019) assessed the effect of pretreatments and cooking on levels of 19 PFAS (PFOA, PFOS, PFBA, PFPeA, PFHxA, PFHpA, PFNA, PFDA, PFUnDA, PFDoDA, PFTrDA, PFTeDA, PFBS, PFHxS, L-PFHpS, PFDS, PFOSA, N-MePFOSAA, and N-EtPFOSAA) in fish cakes (n = 4 brands) and swimming crabs (n = 100) purchased in markets in Korea. The effects of a wide range of cooking methods were evaluated. Additional foods used in the cooking processes included soybean oil, two types of soy sauce, and Korean radish. Blanching, commonly used as a pretreatment before cooking fish cakes, did not yield significant changes in PFAS levels. Significant reductions in total PFAS were observed after boiling, frying, and stir-frying fish cakes (total PFAS in control, boiled, fried, and stir-fried fish cakes, respectively, were as follows: 2.96 ± 0.6 ng/g, 1.60 ± 0.16 ng/g, 1.93 ± 0.19 ng/g, and 1.94 ± 0.07 ng/g). For the crabs, presoaking reduced PFAS levels. PFAS in the crabs were significantly decreased after steaming and stewing.
Taylor and colleagues (2019) collected school prawn, blue swimmer crab, and dusky flathead from contaminated or reference estuaries in New South Wales and analyzed them for 20 PFAS compounds (PFAS above the limit of quantitation [LOQ] were PFHxA, PFHpA, PFOA, PFNA, PFDA, PFUnDA, PFDoDA, PFBS, PFHxS, PFOS, PFDS, FOSA, and NEtFOSE) before and after cooking. Dusky flathead fillets were baked or pan-fried in olive oil, while the crab and prawn were boiled in salted water. PFAS were below LODs in the cooking water and oil. Five or six replicates were used for each species and each cooking treatment (for prawns, each replicate was comprised of a composite of 10 individuals). The effect on PFAS concentrations varied with species, cooking method, and chemical. For instance, PFOS concentrations showed no change in crab following boiling, whereas PFHxS and PFOA concentrations were reduced. However, PFOS, PFHxS, and PFOA concentrations increased in prawns after cooking. For the dusky flathead, PFOS levels did not change significantly after frying, but baking resulted in a small but significant increase. The authors conclude that “cooking does not consistently reduce PFAS concentrations, and cannot mitigate dietary exposure” (Taylor et al., 2019, p. 280).
Vassiliadou and colleagues (2015) obtained several species of fish (anchovy, bogue, hake, picarel, sardine, sand smelt, and striped mullet) and shellfish (Mediterranean mussel, shrimp, and squid) from local markets in Greece and mussels from a mariculture farm. Twelve PFAS compounds (PFBA, PFPeA, PFHxA, PFHpA, PFOA, PFNA, PFDA, PFUnDA, PFDoA, PFBS, PFHxS, and PFOS) were measured in raw or washed samples that were then fried (in virgin olive oil at 170°C) or grilled (at 180°C). Total PFAS concentrations were found to be mostly higher after grilling and after frying, but changes in individual PFAS were inconsistent.
In general, there appear to be numerous factors related to preparation of fish, shellfish, and mollusks that can impact changes (increases or decreases) in concentrations of PFAS. Taylor and colleagues (2019) observe that whether cooking reduces PFAS concentrations in fish depends on the physicochemical properties of the chemical, the cooking method used, and the species. They note several processes that could impact changes in PFAS levels in fish from food preparation: losses to the cooking medium (e.g., cooking oil), moisture loss during cooking, PFAS precursors in fish tissues transforming during cooking to PFAAs, protein loss, or protein increase. Additional factors possibly affecting changes in concentration are the size, shape, and thickness of fish fillets (Hu et al., 2020).
Overall, robust recommendations for fish preparation interventions would ideally be based on consistent intra- and interstudy results; use of fish species and preparation methods common to the United States; and well-powered, replicated studies. The results from the studies reviewed here indicate that the effects of preparation of fish and shellfish on PFAS levels are inconsistent (examples are shown in Figure E-3). It is therefore difficult to use this information to inform recommendations regarding the efficacy of fish and shellfish preparation for reducing PFAS intake.
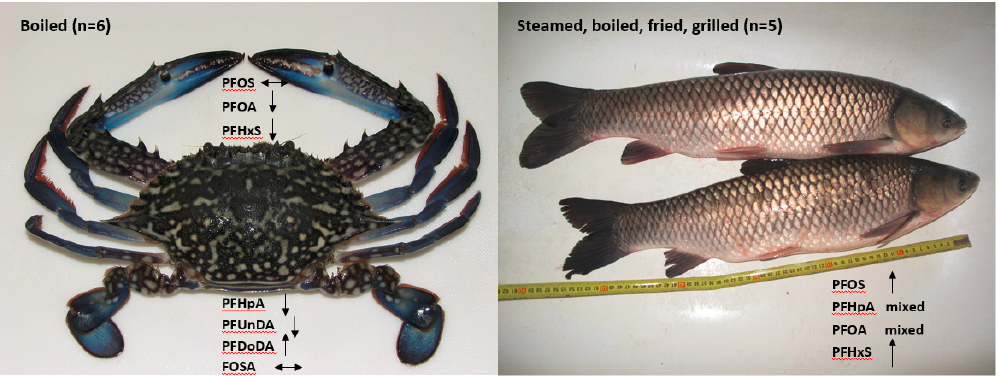
SOURCES: Blue swimmer crab information is from Taylor et al., 2019. Carp information is from Hu et al., 2020. Crab photo: Judy S. LaKind, CC BY SA 3.0, https://commons.wikimedia.org/w/index.php?curid=4963391. Carp photo: Dezidor—Self-photographed, CC BY 3.0, https://commons.wikimedia.org/w/index.php?curid=12661115.
Furthermore, some of the fish species and preparation methods included in this body of research are not common to the United States, limiting the generalizability of results for U.S. communities. Additionally, because very few of these studies used the same cooking methods and species, it is difficult to corroborate even the instances in which a particular intervention appears to have been effective (within this small group of studies, various cooking preparation approaches included soaking followed by stewing, steaming, boiling, frying, or stir-frying; grilling, steaming, baking, boiling, or frying without presoaking; and baking in rice wine or vegetable oil). Furthermore, several of the studies included very small sample sizes. Finally, while some studies considered the effect of moisture or mass variations on PFAS concentration changes, others reported only concentration data. A more relevant metric in terms of human exposure would be the mass of PFAS remaining in the samples after preparation.
FOOD PREPARATION: OTHER
Two studies were identified that examined the effect of preparation on PFAS levels in foods other than fish (Binnington et al., 2017; Jogsten et al., 2009). Jogsten and colleagues (2009) measured several PFAS in various uncooked and cooked foods (see Table E-1).6 Specifically, composite samples (n = 2) of beef, pork, or chicken were cooked in an oil mixture using nonstick cookware. Only PFHxS, PFOS, PFHxA, and PFOA were detected in at least one of two composite samples. PFOS levels increased in grilled pork, grilled chicken, and fried chicken compared with the raw samples. In contrast, levels did not increase in cooked veal or fried pork. The results from this study are not directly relevant for intervention recommendations. First, foods were purchased outside of the United States, and it is not known whether PFAS in these foods are similar to those in foods found in the United States. Second, only two samples per food type were included; there was no information on brands and limited information on cooking procedures; and results were inconsistent regarding the efficacy of cooking in reducing PFAS concentrations. Finally, it is not clear whether the effects of cooking can be disentangled from those of the Teflon-coated cookware used in this study.
___________________
6 Jogsten and colleagues (2009) also measured PFAS in foods wrapped in different types of packaging. The foods were purchased in Spain, and the brands were not identified, so the relevance to the U.S. population is unclear. Egeghy and Lorber (2011) note that while fluorochemical-treated food packaging can be a source of PFAS in food, it appears that PFAS levels in packaging such as fast-food wrappers have decreased over time.
Binnington and colleagues (2017) studied the effects of preparation of beluga whale blubber on nutrients and environmental chemicals, including PFAS. They collected samples from two male whales (aged 24 and 37 years) from the Northwest Territories and prepared them using traditional approaches. Measured PFAS (detected in ≥50 percent of the samples) were PFNA, PFDA, PFUnDA, PFDoDA, and PFOS. PFAS were measured in raw and prepared (boiled, roasted, and aged) samples. Roasting increased concentrations of some of the PFAS compared with certain other treatments (e.g., air-drying, hang-drying, and boil pot), but were reduced in oil (Table E-1 includes concentration results for PFOS). According to the authors, issues with sample preparation may prevent these results from being considered representative of the overall mixture.
TABLE E-1 Summary of Results of Studies Examining the Effect of Food Preparation on PFAS Levels
| Source | PFAS | Study Location | Food Type | Number | Concentration |
|---|---|---|---|---|---|
| Jogsten et al., 2009 | PFBuS PFHxS PFOS PFHxA PFHpA PFOA PFNA PFDA PFUnDA PFDoDA |
Spain | Beef, pork, chicken | Two composite samples from at least six subsamples for each food type from each of two sampling locations | PFOS, ng/g fresh weight (standard deviation) Veal raw: <0.015 grilled: <0.008 fried: <0.018 Pork raw: <0.008 grilled: 0.011 (0.009) fried: <0.008 Chicken raw: <0.008 grilled: 0.012 (0.01) fried: 0.010 (0.007) |
| Binnington et al., 2017 | PFNA PFDA PFUnDA PFDoDA PFOS |
Canadian Arctic |
Male beluga whale blubber |
Blubber sample divided into portions for different preparation processes | nanograms per gram wet weight (ng/g ww)a PFOS: nondetect (ND) to <1 PFNA: ND to <4 PFDA: ND to <4 PFUnDA: ND to <4 PFDoDA: ND to <4 |
a Estimated from publication figures.
In summary, only two studies of changes in PFAS levels associated with cooking foods were identified. These studies included small sample sizes and yielded inconsistent results.
LOCAL FOOD CONSUMPTION ADVISORIES
State advisories for guidance on consumption of locally grown foods could be a source of information to inform exposure reduction decisions. Eleven states have advisory guidelines for consumption of fish, wildlife, and other foods (California [seafood], Connecticut, Hawaii [in process], Maine [fish, beef, and milk], Michigan [fish and deer], Minnesota, New Hampshire, New Jersey, New York, Washington [in process], Wisconsin [fish and deer]) to protect human health from exposure to PFAS.7 These advisories offer guidance on limiting the quantity of these foods consumed. Depending on the state-specific PFAS and concentrations, different consumption levels are indicated, ranging from do not eat (e.g., fish or deer in Michigan with PFOS concentrations of more than 300 parts per billion [ppb])
___________________
7 See https://www.ecos.org/wp-content/uploads/2021/04/Updated-Standards-White-Paper-April-2021.pdf (accessed June 30, 2022).
to unlimited consumption (e.g., fish in New Jersey with 0.56 ng/g PFOS). While fish consumption has a role in a healthy diet (Mozaffarian and Rimm, 2006), weighing the risks of PFAS exposure from fish consumption against the benefits of fish consumption is a complex process, and no intervention studies were identified that evaluated the impact of reduced consumption of fish on PFAS levels in blood and urine.
DRINKING WATER
Ingestion of drinking water is thought to be a major pathway for PFAS exposure (Domingo and Nadal, 2019). Research on two types of drinking water interventions is described in this section. The first addresses whether—and the extent to which—the use of water filters at POE into the home, under the sink (POU), or in water pitchers reduces PFAS exposure. The second addresses whether the use of purchased bottled water results in lower PFAS exposure compared with the use of tap water. Because PFAS levels in water can vary widely, we focus on studies that measured PFAS in tap and bottled water obtained from the same geographic area.
Six publications and one agency report evaluating possible drinking water interventions were identified. Four (Ao et al., 2019; Iwabuchi and Sato, 2021; MDH, 2008; Patterson et al., 2019) evaluated use of POE, POU, and water pitcher filtration devices; and three (Ao et al., 2019; Gellrich et al., 2013; Heo et al., 2014) evaluated differences in PFAS concentrations between tap water and bottled water. These studies are summarized here. Also discussed is one association paper assessing the relationship between drinking water source and serum levels in a highly contaminated area (Emmett et al., 2006).
POE, POU, and Water Pitcher Filtration
Ao and colleagues (2019) (also discussed in the next section) measured six PFAS compounds (PFOA, PFOS, PFNA, PFBS, PFHpA, and PFHxS) in tap (n = 9), filtered (n = 9), and bottled (n = 9) water in Shanghai, China. Paired tap and filtered water samples were collected from each of nine homes served by three different water sources. The filtered water samples were collected from the effluent of the home’s water purification device. No further information on sampling or quality control in the field was given, nor was information on the type or brand of filter provided. ΣPFAS median concentrations in tap water and filtered water were 4.44 nanograms per Liter (ng/L) and 3.13 ng/L, respectively, but the differences were not statistically significant.
Herkert and colleagues (2020) tested municipal, well, and filtered (n = 89) and unfiltered (n = 87) tap water in residences (n = 73) in North Carolina for 11 PFAS compounds (GenX, PFBS, PFBA, PFHxS, PFOS, PFPA, PFHxA, PFHpA, PFOA, PFNA, and PFDA). The 89 POE and POU filters tested varied in both type (e.g., pitcher, under sink, faucet, whole house) and filtration method (reverse osmosis [RO], granular activated carbon [GAC], single-stage, two-stage). Notably, RO filters and dual-stage filters were found to consistently remove most measured compounds (except PFNA and GenX) at an average of ≥90 percent efficiency. On the other hand, GAC filters had more variable performance and were far less effective in removing short-chain PFAS compounds, with an average removal efficiency of just 41 percent for those chemicals. Whole-house activated carbon POE systems resulted in increased levels of PFAS in half of the tests (n = 4). The authors did not observe any correlations between removal efficiency and brand, source water, loading, or filter age.
Iwabuchi and Sato (2021) tested pitcher-type water filters for their ability to reduce concentrations of six PFAS compounds (PFOA, PFOS, PFHxA, PFDA, PFDoA, and PFHxS). Four different models from four manufacturers were evaluated—two with a carbon, ceramic, and hollow fiber membrane design; and two with an activated carbon (AC) and ion exchange design (brand names not given). One liter of the test water was applied to the water filters 200 times, with filtrate analyzed after 10 L, 100 L, and 200 L had been passed through the filters. For each model, filtration effectiveness decreased with prolonged use, but three of the four models were effective in removing the majority of all PFAS compounds. Removal efficiency did not appear to be related to filter material type. Removal
efficiency varied by carbon-chain length (i.e., more efficient removal was observed for longer-carbon-chain PFAS) and the PFAS functional group (PFOS >PFOA, and PFHxS >PFHxA). All tests were performed with initial PFAS concentrations of 50 ng/L. It is possible that filter effectiveness may vary with initial concentration levels. Iwabuchi and Sato (2021) conclude that household water purifiers are effective at reducing PFAS levels in drinking water.
Patterson and colleagues (2019) tested five commercially available POU/POE water treatment systems for six PFAS (PFOS, PFOA, PFHpA, PFHxS, PFBS, and PFNA). These included three RO systems (iSpring RCS5T, HydroLogic Evolution RO1000, and Flexeon LP-700) and two GAC systems (Calgon Filtrasorb 600 AR+ and Evoqua 1230CX). The filters were tested at various flow rates. The authors found that both RO and GAC systems had the potential to remove PFAS to below the LOD under their experimental water quality and operational conditions. They note, though, that performance was variable and that the long-term performance of the systems was not tested.
In addition to the publications described above, the Minnesota Department of Health (MDH, 2008) conducted a survey of POU water filtration devices for PFAS. Fourteen filters were lab-tested, and 11 of these that passed initial testing were field-tested using water from municipal wells. The brands were AC (n = 8)—Aquion Rainsoft Hydrefiner P-12 9878, Kinetico MACguard 7500, and Sears Kenmore Elite 625.385010; and RO (n = 6)—GE Smartwater GXRM10GBL and Watts Premier WP-4V. The four AC devices removed PFAS compounds to below the analytical reporting level (0.2 micrograms [μg]/L). The RO devices also removed PFAS to below the reporting limit. In terms of use by consumers, MDH notes, AC filters, RO membranes, and other filter elements have a limited service life and must be periodically replaced. Manufacturer recommendations vary, but many suggest replacing filters after 500 gallons of treatment or every 6 months (MDH, 2008).
MDH also tested a small, inexpensive, faucet-mounted carbon filter (PUR models FM-2000B, FM-3333B) using chlorinated and unchlorinated water with levels of PFAS that exceeded the U.S. Environmental Protection Agency (EPA) Lifetime Health Advisory Levels. The filter removed all PFAS from the unchlorinated water to below the LODs (which ranged from 5 to 10 ng/L). Some breakthrough of PFBA occurred for the chlorinated water test, but even at the filter capacity recommended by the manufacturer (100 gal), the filter was still removing 73 percent of the PFBA.8
In the course of their work sampling private well water in Washington County, Minnesota, MDH staff collected incidental samples of water treated by homeowner-installed carbon and RO systems. While many of these systems performed quite well, others achieved only partial removal of PFAS or none at all. MDH did not have the capacity to investigate further regarding the reasons for poor performance, but suspected that inadequate system maintenance may have been the main cause. When conveying the results of such tests, whether the system was performing well or not, MDH cautions homeowners that no guarantee can be made regarding long-term effectiveness of the system and recommends that they work with a qualified water treatment company to ensure proper maintenance of their system (Virginia Yingling, personal communication, July 14, 2021).
For those homes that exceed the state’s drinking water guidance values, the Minnesota Pollution Control Agency installs and maintains whole-house GAC filter systems consisting of two 90 lb carbon canisters in series. As there are currently more than 1,000 of these systems in place, the state does not manage them individually, but changes the carbon out annually (which is more frequent than needed for the levels of PFAS present in the groundwater). Testing shows that the state’s GAC systems remove all PFAS below reporting limits (4.4 ng/L). However, some trace levels, especially of PFBA, have been detected above the method detection limits (which range from 0.5 to 1.0 ng/L). In a few instances, the filter systems were found not to be working, but these cases were related to the homeowners having accidentally switched the bypass valve or altered the plumbing in a way that bypassed the filter. As a result, the state’s contractor now inspects every system and plumbing at the annual filter changeout (Virginia Yingling, personal communication, July 14, 2021).
___________________
8 The information in this and the subsequent two paragraphs was provided by Virginia Yingling, Environmental Health Division, Minnesota Department of Health, Saint Paul, Minnesota.
A study of residents living in an area served by the Little Hocking water system in Ohio—with water PFOA levels in the low ppb range at the time of the study—examined whether a community relying on highly contaminated public water could significantly reduce exposure through the use of a carbon water filter (Emmett et al., 2006). Serum PFOA was measured in a random sample of study participants (n = 324), who also provided information on their drinking water habits. Those who used only water from the Little Hocking water system in their homes were categorized as using a home carbon water filtration system (n = 64) versus no home water filtration system, a system not known to remove PFOA, or a system of unknown type (n = 209). Participants with home carbon water filters were shown to have statistically significantly (p = 0.008) lower median serum PFOA levels compared with those who did not (318 nanograms per milliliter [ng/ml] versus 421 ng/ml, respectively). The difference in serum PFOA levels in these two groups of participants was not as large as that seen for individuals using bottled, spring, or cistern water (see the next section for more information). The authors ascribe this finding to the limited effectiveness of water filters, as well as reliability issues associated with filter maintenance. They do not recommend use of home filtration systems that were available at the time.
All but one of the studies reviewed here found that various filtration methods showed evidence of their potential effectiveness. These studies suggest that pitcher-type, POE, and POU filtration systems can reduce PFAS levels in drinking water under the conditions tested. It is worth noting that optimal filtration depends on the user’s actively maintaining these devices, and no study has yet looked at the effectiveness of these interventions in real-world circumstances.9
Bottled Water (Versus Tap Water)
Here we summarize three studies that included measurements of PFAS in bottled, tap, or filtered water from the same area in order to compare levels across drinking water sources. This research was conducted in China, Germany, and Korea.
Ao and colleagues (2019) measured six PFAS compounds (PFOA, PFOS, PFNA, PFBS, PFHpA, and PFHxS) in tap (n = 9), filtered (n = 9), and bottled (n = 9) water in Shanghai, China. Tap and filtered water samples were collected from each of nine families served by three different water sources. Paired tap and filtered water samples were taken from each home. The filtered water samples were collected from the effluent of the home’s water purification device. Bottled water was purchased from local markets and represented nine best-selling brands. No further information on sampling or quality control in the field was given. ΣPFAS median concentrations in tap water, filtered water, and bottled water were 4.44 ng/L, 3.13 ng/L, and 2.36 ng/L, respectively; the differences were not statistically significant.
Mineral water (n = 119), tap water (n = 26), and spring water (n = 18) samples were measured for 10 or 19 (tap water only) PFAS compounds (PFBA, PFBS, PFPeA, PFHxA, PFHxS, HPFHpA, PFHpA, PFOA, H4PFOS, PFOS, FOSA, PFNA, H2PFDA, PFDA, PFDS, H4PFUnDA, PFUnDA, PFDoDA, and PFTeDA) (Gellrich et al., 2013). The mineral water samples were from Germany; spring water samples from Switzerland, the Czech Republic, and Germany; and tap water samples from homes in unidentified locations. No further information on water sampling was given. The highest ΣPFAS concentration was in tap water (42.7 ng/L). The proportions of individual PFAS differed across water type. For example, PFOS was below the LOD in all of the spring water samples but was detected in 9 percent of all of the mineral water samples. The authors note that the PFAS concentrations in the three water types were similar and described the concentrations as “low.” For example, the median PFOA levels in mineral, spring, and tap water samples were 1.6 ng/L, 1.4 ng/L, and 2.6 ng/L, respectively.
Heo and colleagues (2014) measured 16 PFAS compounds (PFBA, PFPeA, PFHxA, PFHpA, PFOA, PFNA, PFDA, PFUnDA, PFDoDA, PFTrDA, PFTeDA, PFBS, PFHxS, PFHpS, PFOS, and
___________________
9 Information on certified water filters can be found at the following website: https://www.nsf.org/knowledgelibrary/perfluorooctanoic-acid-and-perfluorooctanesulfonic-acid-in-drinking-water (accessed May 12, 2021). Note that the certification applies only to PFOA and PFOS, and the water filter must be able to reduce these chemicals to under 70 parts per trillion (ppt).
PFDS) in tap (n = 34) and bottled (n = 8) water from Busan, Korea. The bottled water samples were purchased in markets, and the tap water samples were collected from 16 districts in Busan (no further information on types of bottled water or sampling methods for tap water was provided). PFAS concentrations and detection frequencies were higher in the tap water than in the bottled water samples. For example, mean ΣPFAS levels in bottled and tap water were 0.48 ng/L and 41.3 ng/L, respectively. The authors do not provide information on whether the observed differences were statistically significant.
A study of residents living in an area served by the Little Hocking water system in Ohio suggests that a community relying on highly contaminated public water could significantly reduce exposure through the use of bottled water (Emmett et al., 2006). Serum PFOA was measured in a random sample of study participants (n = 324), who also provided information on their drinking water habits. Residents who reported drinking primarily bottled/spring/cistern water had a median serum PFOA level of 71 ng/mL, compared with a statistically significantly higher level of 374 ng/mL for those who drank only Little Hocking system water. Overall, the authors observed a strong relationship between serum PFOA levels and PFOA concentrations in the drinking water source.
For communities with highly contaminated water supplies, the use of alternative drinking water sources has been shown to be associated with significantly reduced exposures. However, none of the intervention studies reviewed here provide robust evidence for the effectiveness of replacing tap water with bottled water for U.S. locations with background levels of PFAS. The studies reviewed here were conducted in Europe and Asia, and the water PFAS concentrations there may not be generalizable to the United States. Lack of brand information and small sample sizes present additional challenges for evaluating this intervention.
Use of bottled water as a replacement for tap water can be expensive and inconvenient. To be confident that the use of bottled water will result in a reduction in PFAS exposure, an understanding of local water conditions in comparison with PFAS levels in specific types of bottled water is needed. As described above, while PFAS levels in bottled water tend to be approximately between <LOD to <100 ng/L, it cannot be assumed that levels in bottled water are always lower than those in tap water. Outside of highly contaminated areas, the degree of spatial granularity for concentration data required to ensure that replacing tap water with bottled water will reduce PFAS exposure is not well understood. However, based on public data POTWs (EPA, 2017), PFAS levels in treated water can vary widely within regions or states (e.g., PFOS water concentrations in Delaware ranged from <MRL [Minimum Reporting Level] of 0.04 to 1.8 µg/L, while PFOA water concentrations in Pennsylvania ranged from <MRL of 0.02 to 0.349 µg/L).
The EPA’s Third Unregulated Contaminant Monitoring Rule (UCMR) (EPA, 2017) includes monitoring data for PFOS, PFOA, PFNA, PFHxS, PFHpA, and PFBS (data from 2013 to 2015 from a representative sample of public water systems serving ≤10,000 people). Figure E-4 shows varying concentrations of these six PFAS across the United States for PFAS levels above the method reporting limits. Levels in drinking water can vary across the United States by at least an order of magnitude. The concentrations are in the low ng/L range, similar to reported levels in bottled water. Also note that for much of the United States, PFAS levels in drinking water are below the method reporting limit (see Figure E-5, green symbols) and so would possibly be similar to those in bottled water.
BREAST MILK AND INFANT FORMULA
In considering the idea of “intervention” as it pertains to breast milk, there are two underlying concepts. The first is whether there are interventions that could reduce exposure to the breastfeeding infant, and the second is whether lactating can be an effective method for reducing the mother’s levels of PFAS compounds. We discuss each of these concepts in this section.
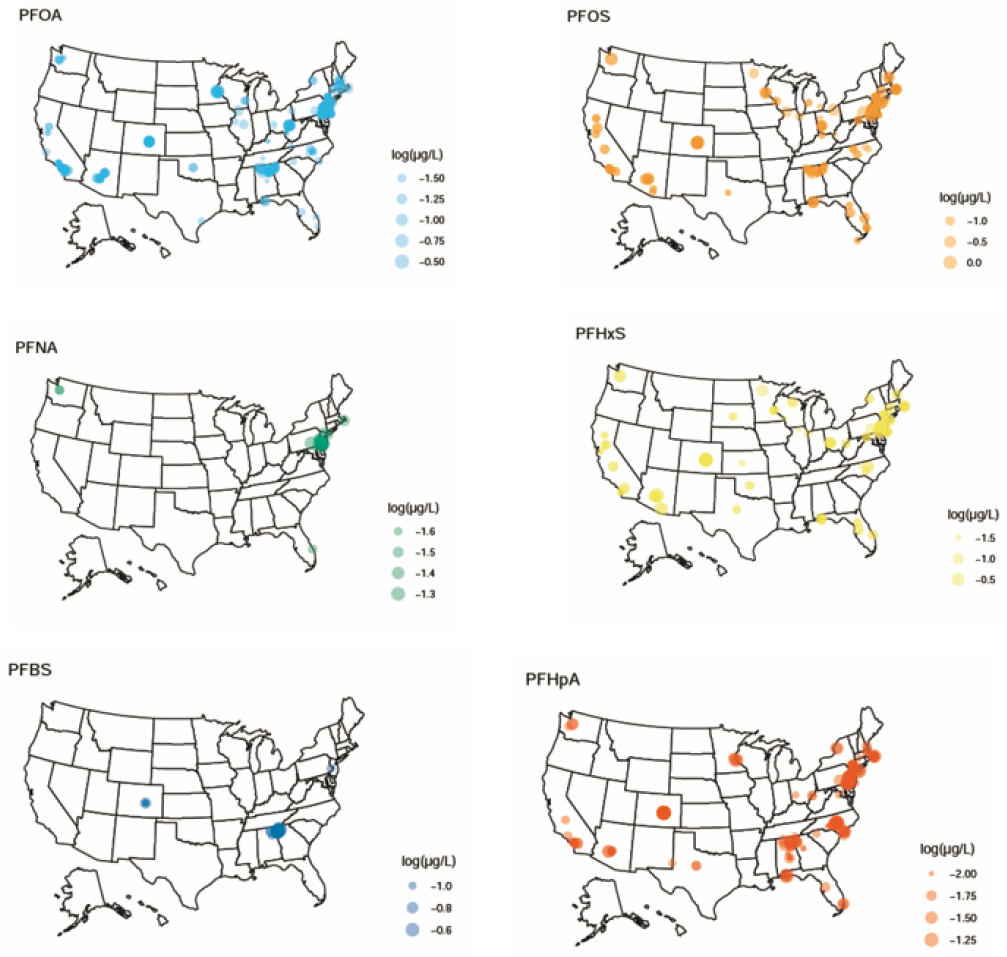
NOTES: The relative sizes of the symbols correspond to the actual measured water concentrations. The legends show exemplar concentrations. Plotted: log10(concentration), excluding data below minimum reporting levels. μg/L = microgram per Liter.
SOURCE: Data were extracted from the U.S. Environmental Protection Agency’s (EPA’s) Third Unregulated Contaminant Monitoring Rule (UCMR 3) (2013–2015) database (EPA, 2017). Individual concentration data for each point on the graphics can be found at http://lakindassociates.com/interactive-map (accessed June 30, 2022).
The Infant’s Exposure: Does Formula Feeding in Place of Breastfeeding Reduce Exposure?
Many mothers choose to breastfeed rather than use infant formula. Breastfeeding confers various health advantages to the infant and mother (AAP, 2012; WHO, 2020). At the same time, breast milk includes environmental chemicals (LaKind et al., 2001, 2018; Lehmann et al., 2018) that derive from the mother’s body and are transferred to the infant via breastfeeding. Thus, concern has been expressed about the possible health effects on the infant from those environmental chemical exposures. This concern raises the question of whether formula feeding would serve as a method for “intervening,” or reducing infant exposure to PFAS.
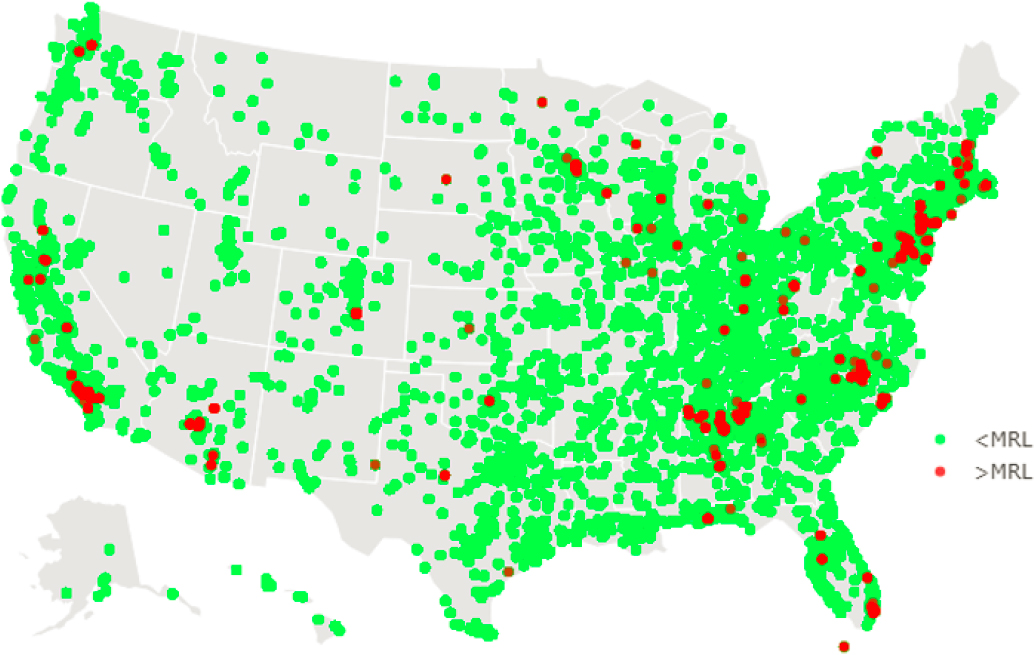
NOTES: The symbols represent a total of 215,963 measurements from the U.S. Environmental Protection Agency’s (EPA’s) Third Unregulated Contaminant Monitoring Rule (UCMR 3) for PFOA, PFOS, PFHxS, PFBS, PFHpA, and PFNA. MRL = Minimum Reporting Level.
SOURCE: Data were extracted from the EPA’s UCMR 3 (2013–2015) database (EPA, 2017).
At least two factors need to be taken into consideration. The first is that infants’ exposures begin in utero. Some studies suggest that despite environmental chemical exposures associated with breastfeeding, infants who are breastfed may do better in a number of health-related aspects compared with formula-fed infants (LaKind et al., 2008). The World Health Organization has stated, “in studies of infants, breastfeeding was associated with beneficial effects, in spite of the contaminants present. The subtle effects noted in the studies were found to be associated with transplacental, rather than lactational, exposure” (WHO, 2000, p. 237). These conclusions are drawn from research on persistent chemicals, such as dioxins; to our knowledge, there is no PFAS-specific literature on health effects of breastfed versus formula-fed infants. At present, there does not appear to be sufficient PFAS-related research that would allow for a definitive conclusion regarding infant health and the choice between breastfeeding and use of infant formula. Thus, it is not clear that formula feeding is a scientifically supported “intervention” that would prevent adverse health outcomes.
The second factor is that in choosing formula feeding to reduce infant exposure to PFAS, the assumption is being made that infant formulas do not themselves contain PFAS compounds. While studies have reported on detectable levels of PFAS in infant formula in other countries (e.g., Llorca et al., 2010; Macheka et al., 2021), it is instructive to review available data on levels of PFAS in breast milk versus infant formula in the United States to assess whether levels in formula are lower than those found in breast milk. As an additional complication, it is not uncommon to purchase powdered formula and reconstitute it with drinking water. Therefore, we provide here a synopsis of U.S. levels of PFAS in breast milk, formula, and drinking water.
PFAS in Breast Milk in the United States
Reviews of PFAS in breast milk (Lehmann et al., 2018; Liu et al., 2020) identify three studies reporting measurements of PFAS levels in breast milk in the United States. One of these studies (Kuklenyik et al., 2004) is an analytical methods study. No information on either the milk donors or the sampling procedures is reported; the information from this study is not relevant to this discussion. In a second study, von Ehrenstein and colleagues (2009) collected milk samples from 34 breastfeeding women in North Carolina at 2–7 weeks and 3–4 months postpartum. Nine PFAS were measured (PFOS, PFOA, PFNA, PFHxS, PFOSA, MeFOSAA, EtFOSAA, PFBS, and PFDA). Measurements below the LOD were assigned a value of LOD/sqrt2. PFAS levels were below the LOQ in most of the 34 milk samples collected at both sample times (note that the LOQs for PFAS in milk ranged from 0.15 to 0.60 ng/ml, or ppb). Specifically, PFAS were detected in samples from only 4 of the 34 women, and of these only three PFAS were above the LOQ: Et-PFOSA-AcOH (1.0 ng/ml) and Me-PFOSA-AcOH (0.7 ng/ml) in one woman, and PFOSA in three women (0.3 ng/ml, 0.5 ng/ml, and 0.6 ng/ml). The remainder of the milk samples from both collections were found to have concentrations <LOQ.
In contrast, Tao and colleagues (2008a) measured PFAS (PFOS, PFOA, PFHxS, PFNA, PFHpA, PFDA, PFUnDA, and PFDoDA) in milk samples collected from 45 primiparous and multiparous women in Massachusetts. Levels that were below the detection limit were assigned a value of zero, while those detected but below the LOQ were assigned a value of one-half the LOQ. Mean levels of PFOS and PFOA were 131±103 parts per trillion (ppt) (mean±SD) and 43.8±33.1 ppt, respectively. Mean PFHxS and PFNA levels were 14.5±13.7 ppt and 7.26±4.70 ppt, respectively. The remainder of the PFAS were detected in only ≤4 samples (<24 ppt).
PFAS in Infant Formula in the United States
In a 2018 review of environmental chemicals in breast milk and infant formulas (Lehmann et al., 2018), only one publication is identified with measurements of PFAS in infant formula in the United States (Tao et al., 2008b). Tao and colleagues (2008b) measured PFAS in 21 formula samples purchased in Washington, DC, and Boston, Massachusetts. The brands represented >99 percent of the U.S. market. Most of the samples were organic or nonorganic milk- or soy-based powders and ready-to-use or concentrated liquids. PFOS was detected in one sample (11.3 ppt; LOQ = 11.0 ppt). PFHxS was detected in two samples (1.36 ppt and 3.59 ppt; LOQ = 1.35 ppt). No other PFAS (PFOA, PFNA, PFBS, PFHpA, PFDA, PFUnDA, and PFDoDA) were detected in any samples.
PFAS in Drinking Water in the United States
An assessment of infant exposure to environmental chemicals would not be complete without considering exposures via drinking water used to reconstitute infant formula (LaKind et al., 2005). ATSDR (2019) has noted that a source of PFAS exposure to infants and toddlers is “formula mixed with PFAS contaminated water.” It is important to be able to provide information on what is meant by “contaminated,” as PFAS levels in tap water vary widely. For example, Andrews and Naidenko (2020), using national and state databases, estimated that 18−80 million people in the United States use tap water containing at least 10 ng/L (ppt) PFOA and PFOS combined, and more than 200 million people may have water with a combined PFOA and PFOS level of at least 1 ng/L.
Formula may also be reconstituted with bottled water. There is a paucity of data on PFAS levels in bottled water in the United States. Akhbarizadeh and colleagues (2020) reviewed the international literature on PFAS levels in bottled water (with none from the United States) and report levels of various PFAS in the low ng/L range, with some levels as high as the low 100s ng/L depending on the type and number of PFAS included in the reporting. They note that researchers have attributed the PFAS in bottled water to several possible sources, including PFAS from the plastic bottles themselves; introduction of PFAS to the water before bottling or during bottle closure; or contamination of contact materials during
bottling, handling, and storage of the bottles. In a study of tap, spring, and mineral water from Germany, Gellrich and colleagues (2013) found PFAS levels to be generally in the low ng/L range.
Looking beyond the peer-reviewed literature, Consumer Reports (Felton, 2020) conducted a study on PFAS levels in bottled water purchased in stores in the United States and from online retailers. The noncarbonated water levels in 31 brands were less than 1 ppt, and two other brands had levels of 1.21 ppt and 4.64 ppt. These results derive from the averages of two to four samples of each product, but it is not clear whether these were replicates from the same bottle or different bottles. The report does not include information on detection limits or specific PFAS compounds detected, but merely describes “total PFAS as the sum of average concentrations of all PFAS detected in the samples tested of a product.”
The U.S. Food and Drug Administration (FDA) measured PFOA and PFOS in carbonated and noncarbonated bottled water (n = 30; brands not identified) and found that levels were below the lower LOQ in all samples (0.004 µg/L).10
Studies have also detected PFAS in bottled water from other countries (see, e.g., Le Coadou et al., 2017). As brand names are not provided by these authors, it is not clear how this information could be used for intervention recommendations for the United States.
Based on these very limited data, it is possible that ready-to-use formulas may have lower PFAS levels than formulas reconstituted with tap or bottled water (see Figure E-6). However, the following caveats must be noted: data comparisons across studies are complicated by differences in total PFAS included; measurements may include more legacy PFAS compounds and not include PFAS compounds used to replace the older chemistries; studies use varying detection limits and approaches for assigning values to measurements below the LOD; and sampling in these studies is not representative of regions within the United States.
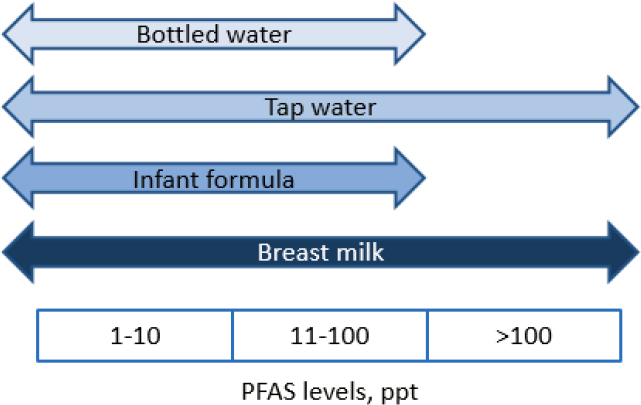
NOTES: Double-headed arrows indicate that these bars could extend in either direction as new data are obtained. ppt = parts per trillion.
SOURCE: Author generated.
___________________
10 See https://www.fda.gov/media/130564/download (accessed May 12, 2021).
The Mother’s Exposure: Does Lactation Reduce Internal Exposure?
There are two likely sources of persistent chemicals in breast milk: legacy stores in the mother from her lifetime exposure, and current sources of exposure, such as diet (LaKind, 2007). So the question arises: If a mother lactates, can she lower the stores of chemicals in her body, thus reducing her internal exposures? (If she disposes of her milk rather than breastfeeding, a process referred to as pumping-and-dumping, can she similarly reduce her exposure?) The reduction in chemical levels in the body via lactation, referred to as depuration, has been studied for such persistent chemicals as dioxins, polychlorinated biphenyls (PCBs), polybrominated diphenyl ethers (PBDEs), and chlorinated organic compounds (LaKind, 2007). Those studies have yielded mixed results (reviewed by LaKind et al., 2001), with some showing substantial declines in breast milk levels over time (Klein et al., 1986; Yakushiji et al., 1978) and others showing either minimal declines, no changes, or increasing levels over the course of lactation (Hooper et al., 2007; LaKind et al., 2009).
If lactation is an effective process for reducing the legacy stores of PFAS in the mother, one would expect to see levels of PFAS in serum and breast milk decline as lactation progressed and the mother’s stores were depleted. We review here the literature on this topic.
In a review of the literature on breastfeeding and serum levels in mothers, VanNoy and colleagues (2018) conclude that the published studies support an association between breastfeeding and serum PFAS concentrations among women. However, they also observe that key aspects of breastfeeding, including duration, exclusivity, and timing of sample collection, should influence the breastfeeding–serum relationship, yet only one study in their review included all three exposure variables. They further describe the importance of parity for predicting maternal serum PFAS levels and note that most of the studies reviewed were unable to disentangle the effects of breastfeeding versus those of parity on PFAS exposure. The ability to fully assess the impact of breastfeeding on maternal PFAS levels is therefore limited.
Another approach to assessing the impact of breastfeeding on maternal PFAS exposure is to examine changes in PFAS levels in breast milk over the course of lactation. If stores of PFAS predominate over current exposures via diet and other sources, and if lactation resulted in mobilization and excretion of those stores, then lactation (with either breastfeeding or “pump-and-dump”) could result in lower internal exposures for the mother. Three studies were identified that followed individual women over the course of lactation and collected multiple breast milk samples, which were analyzed for PFAS.
Lee and colleagues (2018) collected breast milk samples (n = 293) from 127 mothers at four different times postpartum (<7, 15, 30, and 90 days) as part of the Children’s Health and Environmental Chemicals in Korea Cohort study. Samples were measured for 16 PFAS. Of the 127 women, only 15 provided samples across the lactation period, and samples from these women were pooled by sampling time. The concentrations of PFOS, PFOA, PFNA, and ΣPFAS 30 days postpartum were statistically significantly higher than in milk from sampling at <7 days postpartum.
In a study in Norway with nine women (Thomsen et al., 2010), milk samples were collected monthly from approximately 2 weeks postpartum up to 1 year postpartum (n = 3–10 per woman). The authors found a consistent decrease in concentrations of PFOS and PFOA, except for PFOS in one woman (these were the only PFAS >LOQ). The modeled depuration rates were reported as 7.7 percent and 3.1 percent reduction per month for PFOA and PFOS, respectively. Regarding generalizing these results, the authors note that because they did not have information on changes in the mothers’ body weight or diet during the sampling timeframe, they could not evaluate the influence of these factors on depuration rates.
Fromme and colleagues (2010) also measured PFAS in breast milk samples collected monthly over 5 months from seven women. No significant differences in PFOS levels over the 5 months were observed.
In summary, our understanding of PFAS depuration based on breast milk measurements rests on three studies with between 7 and 15 women that yielded conflicting results. This is not necessarily surprising as depuration rates likely depend on numerous factors, such as current exposures, volume of
breast milk excreted, and initial levels of PFAS in the body. Thus, the value of lactation as an intervention is unknown and requires additional study.
Would “Real-Time” Testing of Milk Help Guide Decision Making Regarding Infant Feeding?
It is unclear whether “real-time” testing of breast milk is an advantageous approach to guiding new mothers in decision making regarding infant feeding. First, testing requires sampling, shipping to laboratories, and conducting the analyses, which comes with a monetary cost. But even with unlimited resources, the time component is a critical consideration, as results may not be available until well into the infant’s first few weeks or months. Second, a single measurement may not capture the infant’s actual exposure as PFAS levels in milk may change over the duration of lactation, and the direction and rate of change are not well understood.
INDOOR DUST
Dust is a potential exposure pathway for PFAS compounds (Trudel et al., 2008). One dust-related PFAS intervention study was identified (Young et al., 2021). Dust samples were collected from floors by vacuum in “PFAS-free” refurbished rooms (7 with a full intervention and 28 with a partial intervention) and 12 control rooms at a university in the northeastern United States. Fifteen PFAS compounds were measured (PFOS, PFOA, PFHxA, PFHxS, FOSA, PFHpA, PFPeA, PFNA, PFBS, PFDS, PFBA, PFDA, PFUnDA, PFDoDA, and N-MeFOSAA), with detection limits ranging from 0.06 to 1.5 ng/g. PFAS levels in field blanks were either below the LOD or substantially lower than levels in the samples.
The geometric mean ΣPFAS levels were 481 ng/g (225–1,140 ng/g) in rooms with no intervention, 252 ng/g (18.1–8,310 ng/g) in rooms with partial interventions, and 108 ng/g (43.6–243 ng/g) in rooms with full interventions. Use of PFAS-free furnishing resulted in a statistically significant (78%, 95% CI: 38–92) ΣPFAS reduction in dust compared with control rooms. The results from this study suggest a possible intervention for reducing exposure to PFAS in dust.
While not an intervention study, research conducted by Scher and colleagues (2019) examined associations between PFAS-contaminated soil outside of homes and dust concentrations inside of the homes. The authors collected dust samples from the interior of the house and entryways to determine whether entryway dust levels indicate that “track-in” is an important contributor to house dust PFAS levels. They observed higher PFAS levels in the interior of the homes compared with soil levels, and suggest that soil track-in was not an important source of PFAS in interior dust.
Interpretation of PFAS dust studies is complicated by the lack of standardized sampling techniques for dust collection; the impact of use of different sampling methods on PFAS concentrations is unknown (Scher et al., 2019). Furthermore, for interventions that reduce PFAS in dust, the extent to which overall human intakes of PFAS would be reduced is not known. Estimates of the PFAS intake via dust have varied considerably (Nadal and Domingo, 2014).
OTHER POTENTIAL INTERVENTIONS
Other possible actions that could be considered interventions include limiting the use of PFAS-containing household goods and personal care products and introducing substances to the diet specifically intended to remove PFAS from the body. No intervention studies for these behavioral changes were identified, but here we describe one study on nonstick cookware, one study related to use of dental floss, and one dietary modification approach in the context of future exploration.
Nonstick Cookware
Nonstick cookware has been studied as a source of PFAS exposure. In terms of interventions, at issue is whether replacing nonstick cookware with items that do not contain PFAS would result in a
measurable decrease in human PFAS exposures. While no intervention studies were identified, we briefly describe one study conducted in the United States that compared the release of PFAS into air and water from nonstick versus stainless steel frying pans. Sinclair and colleagues (2007) purchased four brands of domestic and imported nonstick frying pans and one brand of stainless steel frying pan (three to five of each brand) in New York. The pan brand names are not identified. All pans were precleaned with hot, soapy water; rinsed with Milli-Q water; and dried with a towel. The stainless steel pans were used as controls. The authors report that under normal cooking conditions (179°C to 233°C surface temperature), PFOA in the gas phase was measured at 11–503 picograms per square centimeter (pg/cm2) from the nonstick frying pans. (Fluorotelemer alcohols were also detected, but these are not chemicals of focus in this paper and are not discussed further.) Gas-phase PFOA decreased after repeated use of one brand of pan but not the others (n = 1 for each brand). The authors also measured PFOA in Milli-Q water boiled for 10 minutes in selected pans and found inconsistent results (certain pans resulted in measurable levels of PFOA in the water, while others did not).
Since brand names are not included in the publication, this information cannot be used as the basis for specific intervention recommendations. Even if brand names were included, given the small sample size and the lack of study replication, it would be difficult to use this information as the basis for general recommendations. Finally, as neither air nor water concentrations are provided, the extent to which this exposure source contributes to overall intake is unclear.
Dental Floss
One study examined the association between use of dental floss and serum PFAS (PFOA, PFNA, PFDeA, PFHxS, PFOS, and Me-PFOSA-AcOH) levels (Boronow et al., 2019). Serum PFAS levels were measured in 178 middle-aged women. An administered questionnaire included one question on use of dental floss: “In the last month, how often did you use Oral-B Glide dental floss?” Response choices were as follows: “Never or almost never, Several times a month, 2 or more times a week, Every day.” Only “ever” and “never” were used in the regression analysis. While five of the PFAS compounds did not show significant associations, a 24.9 percent (95% CI: 0.2–55.7) higher level of PFHxS was found in subjects who used Oral-B Glide floss. It is worth noting that the questionnaires were administered several years after blood sample collection.
The authors also analyzed 18 dental floss products (only one or two samples per brand were analyzed, except the Oral-B Glide brand [five samples]) for total fluorine (as an indicator for polytetrafluoroethylene or PTFE), 6 of which yielded detectable levels. Given the lag in time between blood collection and questionnaire administration, the small number of floss samples analyzed, and the mostly nonsignificant results, it is not clear whether dental floss is an important route of human exposure to PFAS.
Fiber Intake
Studies have observed relationships between higher fiber intake and lower serum PFAS levels (e.g., PFOA, PFOS, and PFNA [Dzierlenga et al., 2021]; PFOS and PFOA [Halldorsson et al., 2008]; PFOS, PFOA, PFHxS, EtFOSAA, MeFOSAA, and PFNA [Lin et al., 2020]). This finding is based on studies examining associations between dietary recall information and serum levels in cross-sectional study designs. Thus, it is unknown whether other factors (e.g., whether diets with high fiber generally have lower levels of PFAS) influence this relationship.
MODELED INTAKES AS THE BASIS FOR RECOMMENDATIONS FOR REDUCING EXPOSURE TO PFAS
Well-conducted and generalizable intervention studies can be considered the gold standard for recommending approaches to reductions in personal exposure to PFAS. In the absence of such studies, it
may be informative to use results from studies designed to model the relative contributions of exposure pathways to overall PFAS exposure. This approach would focus attention and intervention strategies on the most important exposure pathways. In this section, we discuss results from studies using concentration data from several media and products (e.g., soil, water, and food concentration data) in combination with generic intake factors (e.g., g intake/kg body weight per day) to model human intakes of PFAS. We explore whether any common, generalizable themes emerge from such modeling studies regarding dominant intake pathways.
Because of geographic differences in both environmental media and product concentrations, the emphasis here is on studies conducted for the U.S. population. First, however, we provide a brief synopsis of reviews on studies conducted for populations outside of the United States. Although some of the modeling efforts included less well-studied PFAS (e.g., PFHxS), the most commonly assessed PFAS were PFOA and PFOS. Sunderland and colleagues (2019) recently compiled data from the literature on percent source contribution in adults. The results are summarized in Figures E-7 and E-8. The modeling approaches represented by the underlying papers included different concentration data and intake assumptions. Regardless of the approach used, diet appears to be the major pathway of exposure to PFOS, with the percent contribution ranging from 65 to 96 percent. For PFOA, the range of percentages for dietary contributions is wider (6–86 percent). While these results point to the importance of diet, the location of a study and the presence or absence of point sources will influence the relative contributions of various pathways to overall PFAS intake. Behavioral differences across countries can also impact the results and their generalizability to communities in the United States. We therefore focus on two studies that modeled source contributions for PFOA (Lorber and Egeghy, 2011) and PFOS (Egeghy and Lorber, 2011) in the United States.
For PFOA intake modeling, Lorber and Egeghy (2011) used the following data, assumptions, and approach. Their intakes were developed for adults and 2-year-old children. PFOA concentrations in various media from the published literature were used in combination with EPA exposure contact rates. The authors generated intake distributions by inputting different exposure media concentrations into the model. They assumed that PFOA concentrations in indoor air were 20 times higher than those in outdoor air, with outdoor air data being derived from a study in Albany, New York. Whether these air concentrations represent more general U.S. exposures is not discussed. The authors also used dietary data from the Canadian Total Dietary Survey (Tittlemier et al., 2007); thus, it is not known whether this aspect of the model is representative of exposures to PFOA in the United States. PFOA levels in drinking water were estimated from surface water concentrations in various parts of the United States (New York, North Carolina, New Jersey [drinking water], Great Lakes, Tennessee, and Florida). Dust concentration data were obtained from dust samples from homes and day care centers in Ohio and North Carolina.
Lorber and Egeghy (2011)11 discuss numerous limitations around their estimates of intakes, including the following: no estimates of intake via direct contact with consumer products (e.g., treated carpets or cosmetics), no inclusion of PFOA precursors, and a lack of PFOA data for food in the United States. However, Lorber and Egeghy (2011) also used a simple one-compartment, first-order pharmacokinetic model in combination with National Health and Nutrition Examination Survey (NHANES) 2003–2004 data and back-calculated intakes. Their central tendency intake estimates for adults and children (70 ng/day and 26 ng/day, respectively) are not dissimilar to the intakes back-calculated from the NHANES data (56 ng/day and 37 ng/day for males and females, respectively). These models would benefit from the use of improved measurement data in food and other media specific to—and representative of—the United States (or at least areas or regions of interest within the United States) and the use of more recent NHANES data.
___________________
11 This text has been changed since the release of the pre-publication version of the report to remove reference to a figure that cannot be reproduced due to lack of copyright permissions.
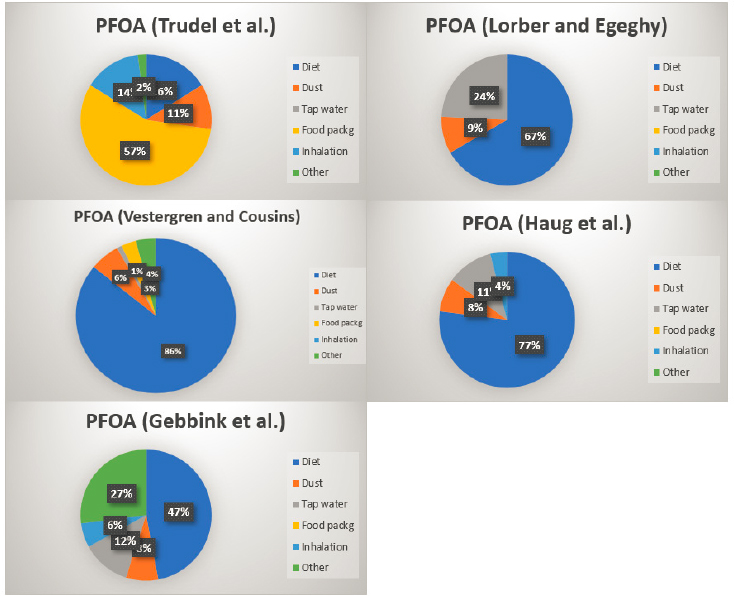
NOTE: Values less than 1 percent were assigned a value of zero.
SOURCE: Data from Sunderland et al., 2019.
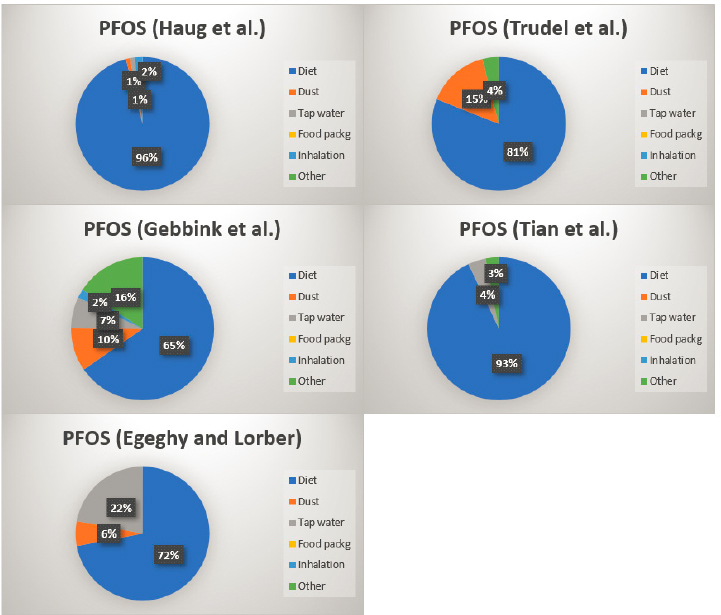
NOTE: Values less than 1 percent were assigned a value of zero.
SOURCE: Data from Sunderland et al., 2019.
Egeghy and Lorber (2011) used a similar approach to model intakes of PFOS and its precursors. In addition to modeling of precursors, this effort differs from the PFOA models described above in that the models were developed for both “typical” and “contaminated” scenarios. (The contaminated scenario was similar to the background scenario except that much higher water concentrations were used.) In terms of available data on environmental concentrations of PFOS and precursors, the authors note that “measurement of PFCs in exposure media in North America was relatively sparse for all media compared with European data with the possible exception of dust. Food data are sparse for both continents. No measurements of PFOS in uncontaminated soil could be found” (Egeghy and Lorber, 2011, p. 158). The authors found that diet was the main route of exposure in the general population, while for children, dust ingestion was almost as important a contributor to intake as diet. Perhaps most important in the context of using modeled uptakes as the basis for recommendations for modifying behaviors to reduce exposure, Egeghy and Lorber (2011) found that the pathway-specific contributions spanned several orders of magnitude and overlapped substantially.12
Use of model estimates of dominant pathways of PFAS exposure for making recommendations to individuals regarding exposure reduction faces a number of challenges. First, while diet appears to be a major pathway of exposure, there is little information on PFAS in commercial foods commonly consumed in the United States. The FDA has released PFAS data for certain foods, which could be used in future studies involving modeling of source contributions to PFAS intake.13 However, the FDA observed that its data for produce, meat, dairy, and grain products are based on a small sample size, and the results “cannot be used to draw definitive conclusions about the levels of PFAS in the general food supply” (para. 3). It is not currently well understood whether the data on commercial foods from other countries used in the intake models are representative of levels in the United States. Wu and colleagues (2015) state, “Information on dietary predictors in U.S. is still limited” and “more data are needed to determine the relative contributions of food and dust to serum PFCs for both adult and child populations” (p. 265). A review of PFAS in foods by Domingo and Nadal (2017) identifies only two recent studies for the United States: one focused on PFAS uptake by lettuce and strawberries irrigated with reclaimed water (Blaine et al., 2014) and the other on concentrations of PFAS in freshwater fish samples from urban rivers and the Great Lakes (Stahl et al., 2014).
Furthermore, the relative importance of different sources varies by study (see Figures E-7 and E-8) and by demographic group and population (Sunderland et al., 2019). In describing the findings of their recent review on nonoccupational intakes via background exposures, De Silva and colleagues (2021) observe that the inconsistency in the relative importance of different exposure sources from one study to the next may be due to differing concentrations of PFAS in media, as well as the assignment of different values for exposure intake factors (e.g., exposure frequency and duration). They conclude, “Without rigorously conducted exposure studies it is challenging to rank order the most important human exposure pathways and without these data, our ability to design evidence-based exposure intervention strategies will be limited” (De Silva, 2021, p. 644).
Within even a small geographic area, one could envision varying exposure characteristics that could, in turn, affect sources of PFAS intakes. Vestergren and Cousins (2009) explored this possibility by estimating relative intakes for those with exposure to background PFAS levels, exposure to higher levels in drinking water or drinking water impacted by a PFAS point source, or occupational exposures; they found substantial differences in the relative contributions to overall intakes (see Figure E-9).
___________________
12 This text has been changed since the release of the pre-publication version of the report to remove reference to a figure that cannot be reproduced due to lack of copyright permissions.
13 See https://www.fda.gov/food/cfsan-constituent-updates/update-fdas-continuing-efforts-understand-andreduce-exposure-pfas-foods (accessed May 12, 2021).
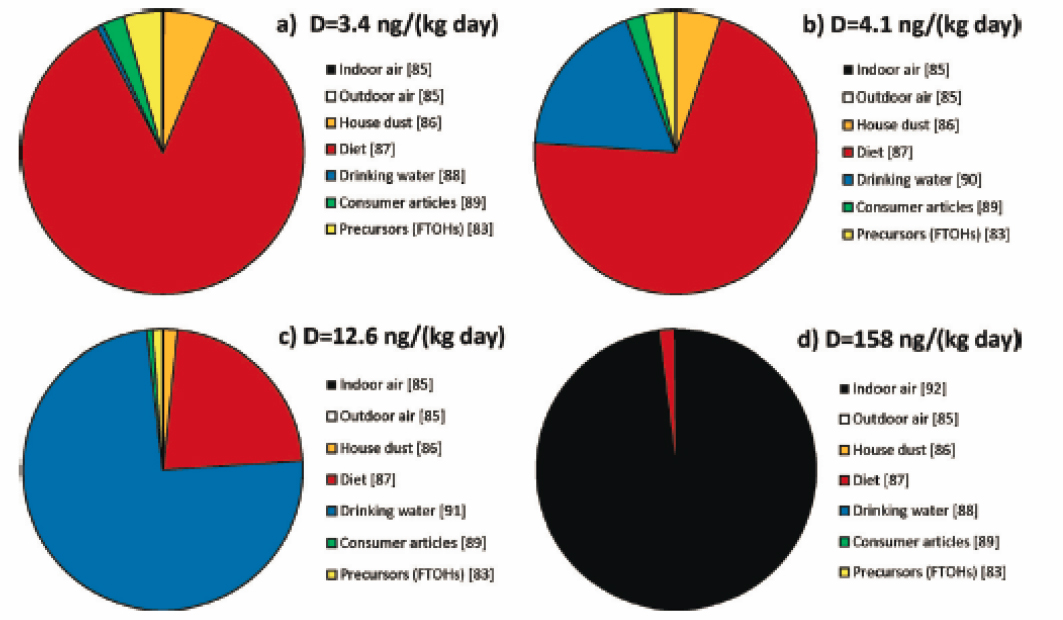
NOTES: Data for sources are derived from different studies and different countries. Bracketed numbers refer to citations in Vestergren and Cousins, 2009. (a) = background concentrations in drinking water (1.3 [nanograms per Liter [ng/L]); (b) = elevated concentrations in drinking water (40 ng/L); (c) = point sources of drinking water contamination (519 ng/L); and (d) = occupationally exposed individuals (indoor air concentrations 1 micrograms per cubic meter [μg/m3]). FTOH = fluorotelomer alcohols; ng/(kg day) = nanograms per kilogram per day.
SOURCE: Reprinted with permission from Vestergren and Cousins, 2009. Copyright 2009 American Chemical Society.
Another factor related to modeling principal sources of exposure is the changes in production and use of individual PFAS over time. Sunderland and colleagues (2019) describe the changes in serum PFAS levels following the phase-out of production of PFOS and its precursors, with PFOS declining, but other PFAS, such as PFHxS, increasing. They observe that while exposures to PFOS and PFOA “have been successfully reduced by product phase-outs for many populations, exposures to C-9-C-11 PFCAs have not followed the same trends” (Sunderland et al., 2019, p. 138). Thus, it is important to use recent environmental and consumer product and dietary data to develop robust estimates of current dominant pathways of exposure.
E-4
Discussion
In this review, we have sought to address the following question: Based on current research, are there interventions or personal modifiable behavioral changes that individuals can make to effectively reduce their PFAS exposure? We have described research on potential ways in which an individual could reduce exposure to PFAS. It is important to acknowledge that communities across the United States have received guidance from state and federal agencies regarding PFAS exposure reduction, including advisories around consumption of drinking water and fish. While it may seem obvious that avoiding exposure to sources of PFAS would result in reduced intake of PFAS and, in turn, lower internal PFAS levels, some caution in assuming that exposure and risk reduction would ensue is warranted. For example, if one is advised to avoid locally caught fish because of known PFAS contamination in that fish, such avoidance could result in reduced exposure. However, if dietary fish is replaced by another food that is also high in PFAS, avoiding the fish may not result in lower PFAS exposure. Another issue to consider is that avoiding one group of chemicals by changing diet or other behaviors can result in increased exposures to other chemicals. Finally, if a certain PFAS source is related to a small portion of overall exposure, then avoidance of that source may not result in appreciable reductions in internal levels of PFAS. Thus, while avoiding known sources of PFAS exposure may be a useful approach to lowering overall exposure, these other considerations should be taken into account; research on the efficacy of various interventions could help shed light on these complexities.
The number of intervention studies available to address the question of whether there are interventions or personal modifiable behavioral changes that individuals can make to effectively reduce their PFAS exposure ranged from 1 to 11, depending on the source of exposure; for some pathways, no studies were found (see Figure E-10). Overall, only the water filtration studies provided relatively consistent evidence of an effective reduction in PFAS levels. No studies were identified that confirmed reduction in human exposure via biomonitoring. To fully demonstrate the efficacy of an intervention, a study would need to be conducted over a timeframe sufficient to account for the long half-lives of PFAS.
Demonstration that PFAS exposures are reduced in a meaningful way through biomonitoring confirmation is an important step. It is possible that an intervention may reduce PFAS levels in a particular medium, but if this medium is not a major source of overall exposure, then that intervention may not contribute significantly to reduction in human exposures. Overall, the intervention literature is sparse and has many limitations. Thus, the committee may have to rely on assumptions and other bodies of evidence to make recommendations to individuals and communities about exposure reduction.
We also considered whether intake models could assess with some degree of confidence the relative source contributions to overall intake and whether this approach could be used to inform decisions regarding community recommendations. While diet appears to be a major contributor to overall intake, dietary data from the United States were not used in these models. It is not known whether the Canadian data used are representative of levels in the United States. As observed by Macheka-Tendenguwo and colleagues (2018), “numerous investigations have attempted to establish the main exposure pathway of PFAS in humans, but differing viewpoints make the results inconclusive” (p. 36066).
In conclusion, other than using certified POE or POU water filters, the available intervention studies generally do not appear to be sufficiently robust to support recommendations for personal behavioral modifications for communities in the United States. The studies reviewed here were limited by small sample sizes, generally inconsistent study designs and results, and a possible lack of generalizability to the United States. It is also important to consider additional factors when developing recommendations for changes in personal behavior, such as the ease and cost of an intervention, associated trade-offs (i.e., If an intervention lowers concentrations of PFAS, does it increase exposures to other chemicals, including
other PFAS?), and whether enough is known about varying PFAS levels in the environment and consumer products to understand the necessary scale of an intervention recommendation (e.g., individual, local, or regional). Information will be needed on local levels of PFAS in drinking water, as well as levels in breast milk, for any recommendations regarding infant nutrition to be well supported.
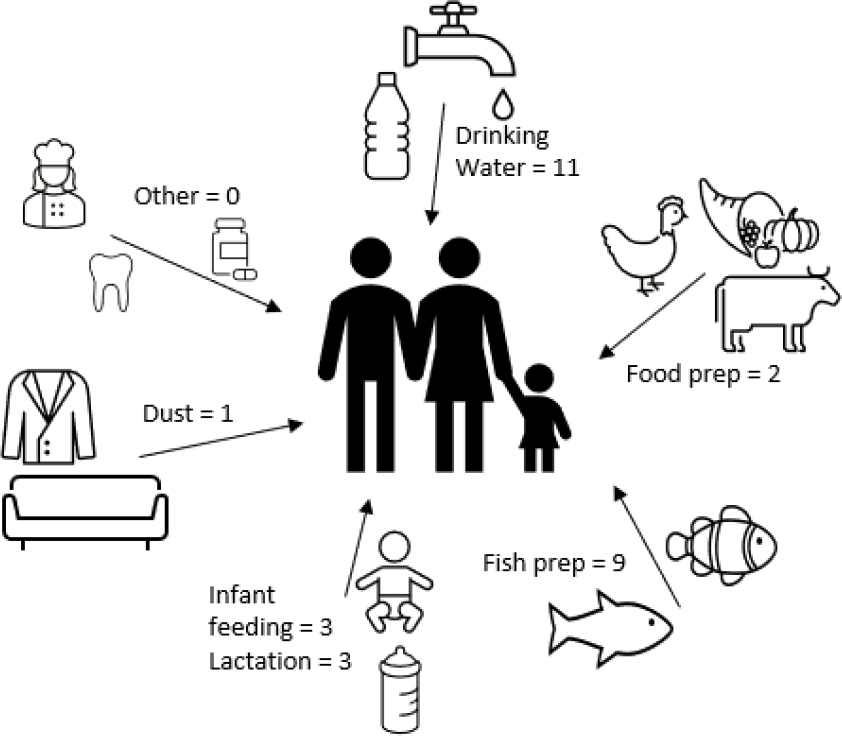
NOTE: “Other” includes nonstick cookware, dental floss, and fiber intake, which these sources are described in the text but for which no intervention studies were identified.
SOURCE: Author generated.
References
AAP (American Academy of Pediatrics). 2012. Policy statement. Breastfeeding and the use of human milk. Section on breastfeeding. Pediatrics 129(3):e827–e841. https://doi.org/10.1542/peds.2011-3552.
Ahrens, L., and M. Bundschuh. 2014. Fate and effects of poly- and perfluoroalkyl substances in the aquatic environment: A review. Environmental Toxicology and Chemistry 33(9):1921–1929. https://doi.org/10.1002/etc.2663. PMID: 24924660.
Akhbarizadeh, R., S. Dobaradaran, T. C. Schmidt, I. Nabipour, and J. Spitz. 2020. Worldwide bottled water occurrence of emerging contaminants: A review of the recent scientific literature. Journal of Hazardous Materials 392:122271.
Alves, R. N., A. L. Maulvault, V. L. Barbosa, S. Cunha, C. J. A. F. Kwadijk, D. Álvarez-Muñoz, S. Rodríguez-Mozaz, Ò. Aznar-Alemany, E. Eljarrat, D. Barceló, M. Fernandez-Tejedor, A. Tediosi, and A. Marques. 2017. Preliminary assessment on the bioaccessibility of contaminants of emerging concern in raw and cooked seafood. Food and Chemical Toxicology 104:69–78. https://doi.org/10.1016/j.fct.2017.01.029. PMID: 28202359.
Andrews, D. Q., and O. V. Naidenko. 2020. Population-wide exposure to per- and polyfluoroalkyl substances from drinking water in the United States. Environmental Science & Technology Letters 7(12):931–936. https://doi.org/10.1021/acs.estlett.0c00713.
Ao, J., T. Yuan, H. Xia, Y. Ma, Z. Shen, R. Shi, Y. Tian, J. Zhang, W. Ding, L. Gao, X. Zhao, and X. Yu. 2019. Characteristic and human exposure risk assessment of per- and polyfluoroalkyl substances: A study based on indoor dust and drinking water in China. Environmental Pollution 254(Pt A):112873. https://doi.org/10.1016/j.envpol.2019.07.041. PMID: 31369910.
ATSDR (Agency for Toxic Substances and Disease Registry). 2019. PFAS: An overview of the science and guidance for clinicians on per- and polyfluoroalkyl substances (PFAS). https://www.atsdr.cdc.gov/pfas/docs/clinical-guidance-12-20-2019.pdf.
ATSDR. 2020. Per- and polyfluoroalkyl substances (PFAS) and your health. https://www.atsdr.cdc.gov/pfas/health-effects/exposure.html (accessed March 10, 2021).
Barbosa, V., A. L. Maulvault, R. N. Alves, C. Kwadijk, M. Kotterman, A. Tediosi, M. FernándezTejedor, J. J. Sloth, K. Granby, R. R. Rasmussen, J. Robbens, B. De Witte, L. Trabalón, J. O. Fernandes, S. C. Cunha, and A. Marques. 2018. Effects of steaming on contaminants of emerging concern levels in seafood. Food and Chemical Toxicology 118:490–504. https://doi.org/10.1016/j.fct.2018.05.047. PMID: 29787848.
Bhavsar, S. P., X. Zhang, R. Guo, E. Braekevelt, S. Petro, N. Gandhi, E. J. Reiner, H. Lee, R. Bronson, and S. A. Tittlemier. 2014. Cooking fish is not effective in reducing exposure to perfluoroalkyl and polyfluoroalkyl substances. Environment International 66:107–114. https://doi.org/10.1016/j.envint.2014.01.024. PMID: 24561272.
Binnington, M. J., Y. D. Lei, L. Pokiak, J. Pokiak, S. K. Ostertag, L. L. Loseto, H. M. Chan, L. W. Y. Yeung, H. Huang, and F. Wania. 2017. Effects of preparation on nutrient and environmental contaminant levels in Arctic beluga whale (Delphinapterus leucas) traditional foods. Environmental Science: Processes & Impacts 19(8):1000–1015. https://doi.org/10.1039/c7em00167c. PMID: 28752885.
Blaine, A. C., C. D. Rich, E. M. Sedlacko, K. C. Hyland, C. Stushnoff, E. R. V. Dickenson, and C. P. Higgins. 2014. Perfluoroalkyl acid uptake in lettuce (Lactuca sativa) and strawberry (Fragaria ananassa) irrigated with reclaimed water. Environmental Science & Technology 48:14361–14368.
Boronow, K. E., J. G. Brody, L. A. Schaider, F. Graham, G. F. Peaslee, L. Havas, A. Barbara, and B. A. Cohn. 2019. Serum concentrations of PFASs and exposure-related behaviors in African American and non-Hispanic white women. Journal of Exposure Science & Environmental Epidemiology 29:206–217. https://doi.org/10.1038/s41370-018-0109-y.
Butenhoff, J. L., G. W. Olsen, and A. Pfahles-Hutchens. 2006. The applicability of biomonitoring data for perfluorooctanesulfonate to the environmental public health continuum. Environmental Health Perspectives 114(11):1776–1782. https://doi.org/10.1289/ehp.9060. PMID: 17107867; PMCID: PMC1665413.
Calafat, A. M., K. Kato, K. Hubbard, T. Jia, J. C. Botelho, and L. Y. Wong. 2019. Legacy and alternative per- and polyfluoroalkyl substances in the U.S. general population: Paired serum-urine data from the 2013–2014 National Health and Nutrition Examination Survey. Environment International 131:105048. https://doi.org/10.1016/j.envint.2019.105048. PMID: 31376596.
CDC (Centers for Disease Control and Prevention). 2009. National report on human exposure to environmental chemicals. https://www.cdc.gov/exposurereport/pdf/fourthreport.pdf.
De Silva, A. O., J. M. Armitage, T. A. Bruton, C. Dassuncao, W. Heiger-Bernays, X. C. Hu, A. Kärrman, B. Kelly, C. Ng, A. Robuck, M. Sun, T. F. Webster, and E. M. Sunderland. 2021. PFAS exposure pathways for humans and wildlife: A synthesis of current knowledge and key gaps in understanding. Environmental Toxicology and Chemistry 40(3):631–657. PMID: 33201517.
Del Gobbo, L., S. Tittlemier, M. Diamond, K. Pepper, B. Tague, F. Yeudall, and L. Vanderlinden. 2008. Cooking decreases observed perfluorinated compound concentrations in fish. Journal of Agricultural and Food Chemistry 56(16):7551–7559. https://doi.org/10.1021/jf800827r. PMID: 18620413.
D’Hollander, W., P. de Voogt, W. De Coen, and L. Bervoets. 2010. Perfluorinated substances in human food and other sources of human exposure. Reviews of Environmental Contamination and Toxicology 208:179–215. https://doi.org/10.1007/978-1-4419-6880-7_4. PMID: 20811865.
Domingo, J. L., and M. Nadal. 2017. Per- and polyfluoroalkyl substances (PFASs) in food and human dietary intake: A review of the recent scientific literature. Journal of Agricultural and Food Chemistry 65(3):533–543. https://doi.org/10.1021/acs.jafc.6b04683. PMID: 28052194.
Domingo, J. L., and M. Nadal. 2019. Human exposure to per- and polyfluoroalkyl substances (PFAS) through drinking water: A review of the recent scientific literature. Environmental Research 177:108648. https://doi.org/10.1016/j.envres.2019.108648. PMID: 31421451.
Ducatman, A., M. Luster, and T. Fletcher. 2021. Perfluoroalkyl substance excretion: Effects of organic anion‐inhibiting and resin‐binding drugs in a community setting. Environmental Toxicology and Pharmacology 85:103650. https://doi.org/10.1016/j.etap.2021.103650.https://www.ncbi.nlm.nih.gov/pubmed/33819618.
Dzierlenga, M. W., D. R. Keast, and M. P. Longnecker. 2021. The concentration of several perfluoroalkyl acids in serum appears to be reduced by dietary fiber. Environment International 146:106292. https://doi.org/10.1016/j.envint.2020.106292. PMID: 33395939.
EFSA (European Food Safety Authority). 2020. Risk to human health related to the presence of perfluoroalkyl substances in food. EFSA Journal 18(9):6223.
Egeghy, P. P., and M. Lorber. 2011. An assessment of the exposure of Americans to perfluorooctane sulfonate: A comparison of estimated intake with values inferred from NHANES data. Journal of Exposure Science & Environmental Epidemiology 21(2):150–168. https://doi.org/10.1038/jes.2009.73. PMID: 20145679.
Eichler, C. M. A., and J. C. Little. 2020. A framework to model exposure to per- and polyfluoroalkyl substances in indoor environments. Environmental Science: Processes & Impacts 22(3):500–511. https://doi.org/10.1039/c9em00556k. PMID:32141451.
Emmett, E. A., F. S. Shofer, H. Zhang, D. Freeman, C. Desai, and L. M. Shaw. 2006. Community exposure to perfluorooctanoate: Relationships between serum concentrations and exposure sources. Journal of Occupational and Environmental Medicine 48(8):759–770. https://doi.org/10.1097/01.jom.0000232486.07658.74. PMID: 16902368; PMCID: PMC3038253.
EPA (U.S. Environmental Protection Agency). 2017. The Third Unregulated Contaminant Monitoring Rule (UCMR 3): Data summary, January 2017. https://www.epa.gov/dwucmr/occurrence-data-unregulated-contaminant-monitoring-rule#3 (accessed March 12, 2021).
EWG (Environmental Working Group). 2016. How can I avoid PFAS chemicals? https://www.ewg.org/avoidpfas (accessed March 10, 2021).
Felton, R. 2020, September 24. What’s really in your bottled water? Consumer reports found toxic PFAS chemicals in several popular water brands, especially carbonated ones. Consumer Reports. https://www.consumerreports.org/bottled-water/whats-really-in-your-bottled-water (accessed March 22, 2021).
Fromme, H., S. A. Tittlemier, W. Völkel, M. Wilhelm, and D. Twardella. 2009. Perfluorinated compounds—Exposure assessment for the general population in Western countries. International Journal of Hygiene and Environmental Health 212(3):239–270. https://doi.org/10.1016/j.ijheh.2008.04.007. PMID: 18565792.
Fromme, H., C. Mosch, M. Morovitz, I. Alba-Alejandre, S. Boehmer, M. Kiranoglu, F. Faber, I. Hannibal, O. Genzel-Boroviczény, B. Koletzko, and W. Völkel. 2010. Pre- and postnatal exposure to perfluorinated compounds (PFCs). Environmental Science & Technology 44(18):7123–7129. https://doi.org/10.1021/es101184f.
Gellrich, V., H. Brunn, and T. Stahl. 2013. Perfluoroalkyl and polyfluoroalkyl substances (PFASs) in mineral water and tap water. Journal of Environmental Science and Health, Part A Toxic/Hazardous Substances and Environmental Engineering 48(2):129–135. https://doi.org/10.1080/10934529.2013.719431. PMID: 23043333.
Genuis, S. J., Y. Liu, Q. I. Genuis, and J. W. Martin. 2014. Phlebotomy treatment for elimination of perfluoroalkyl acids in a highly exposed family: A retrospective case‐series. PLoS One 9(12):e114295. https://doi.org/10.1371/journal.pone.0114295.http://www.ncbi.nlm.nih.gov/pubmed/25504057.
Göckener, B., T. Weber, H. Rüdel, M. Bücking, and M. Kolossa-Gehring. 2020. Human biomonitoring of per- and polyfluoroalkyl substances in German blood plasma samples from 1982 to 2019. Environment International 145:106123. https://doi.org/10.1016/j.envint.2020.106123. PMID: 32949877.
Halldorsson, T. I., C. Fei, J. Olsen, L. Lipworth, J. K. McLaughlin, and S. F. Olsen. 2008. Dietary predictors of perfluorinated chemicals: A study from the Danish National Birth Cohort. Environmental Science & Technology 42(23):8971–8977. https://doi.org/10.1021/es801907r.PMID: 19192827.
Health Canada. 2019, November. Fifth report on human biomonitoring of environmental chemicals in Canada. Results of the Canadian Health Measures Survey Cycle 5 (2016–2017). https://www.canada.ca/content/dam/hc-sc/documents/services/environmental-workplacehealth/reports-publications/environmental-contaminants/fifth-report-human-biomonitoring/pub1eng.pdf (accessed March 21, 2021).
Heo, J. J., J. W. Lee, S. K. Kim, and J. E. Oh. 2014. Foodstuff analyses show that seafood and water are major perfluoroalkyl acids (PFAAs) sources to humans in Korea. Journal of Hazardous Materials 279:402–409. https://doi.org/10.1016/j.jhazmat.2014.07.004. PMID: 25093550.
Herkert, N. J., J. Merrill, C. Peters, D. Bollinger, S. Zhang, K. Hoffman, P. L. Ferguson, D. R. U. Knappe and H. M. Stapleton. 2020. Assessing the effectiveness of point-of-use residential drinking water filters for perfluoroalkyl substances (PFASs). Environmental Science & Technology Letters 7(3):178–184.
Herrick, R. L., J. Buckholz, F. M. Biro, A. M. Calafat, X. Ye, C. Xie, and S. M. Pinney. 2017. Polyfluoroalkyl substance exposure in the Mid-Ohio River Valley, 1991–2012. Environmental Pollution 228:50–60. https://doi.org/10.1016/j.envpol.2017.04.092. PMID: 28505513; PMCID: PMC5540235.
Hooper, K., J. She, M. Sharp, J. Chow, N. Jewell, R. Gephart, and A. Holden. 2007. Depuration of polybrominated diphenyl ethers (PBDEs) and polychlorinated biphenyls (PCBs) in breast milk from California first-time mothers (primiparae). Environmental Health Perspectives 115(9):1271–1275. https://doi.org/10.1289/ehp.10166. PMID: 17805415; PMCID: PMC1964891.
Hu, Y., C. Wei, L. Wang, Z. Zhou, T. Wang, G. Liu, Y. Feng, and Y. Liang. 2020. Cooking methods affect the intake of per- and polyfluoroalkyl substances (PFASs) from grass carp. Ecotoxicology and Environmental Safety 203:111003. https://doi.org/10.1016/j.ecoenv.2020.111003. PMID: 32678765.
Iwabuchi, K., and I. Sato. 2021. Effectiveness of household water purifiers in removing perfluoroalkyl substances from drinking water. Environmental Science and Pollution Research International 28(9):11665–11671. https://doi.org/10.1007/s11356-020-11757-1. PMID: 33410030.
Jogsten, I. E., G. Perelló, X. Llebaria, E. Bigas, R. Martí-Cid, A. Kärrman, and J. L. Domingo. 2009. Exposure to perfluorinated compounds in Catalonia, Spain, through consumption of various raw and cooked foodstuffs, including packaged food. Food and Chemical Toxicology 47(7):1577–1583. https://doi.org/10.1016/j.fct.2009.04.004. PMID: 19362113.
Kannan, K., S. Corsolini, J. Falandysz, G. Fillmann, K. S. Kumar, B. G. Loganathan, M. A. Mohd, J. Olivero, N. Van Wouwe, J. H. Yang, and K. M. Aldoust. 2004. Perfluorooctanesulfonate and related fluorochemicals in human blood from several countries. Environmental Science & Technology 38(17):4489–4495. https://doi.org/10.1021/es0493446. PMID: 15461154.
Kim, M. J., J. Park, L. Luo, J. Min, J. H. Kim, H. D. Yang, Y. Kho, G. J. Kang, M. S. Chung, S. Shin, and B. Moon. 2020. Effect of washing, soaking, and cooking methods on perfluorinated compounds in mackerel (Scomber japonicus). Food Science & Nutrition 8(8):4399–4408. https://doi.org/10.1002/fsn3.1737. PMID: 32884720; PMCID: PMC7455985.
Klein, D., J. C. Dillon, J. L. Jirou-Najou, M. J. Gagey, and G. Debry. 1986. The kinetics of the elimination of organochlorine compounds during the 1st week of breast feeding. Food and Chemical Toxicology 24(8):869–874.
Kuklenyik, Z., J. A. Reich, J. S. Tully, L. L. Needham, and A. M. Calafat. 2004. Automated solid-phase extraction and measurement of perfluorinated organic acids and amides in human serum and milk. Environmental Science & Technology 38(13):3698–3704. https://doi.org/10.1021/es040332u. PMID: 15296323.
LaKind, J. S. 2007. Recent global trends and physiologic origins of dioxins and furans in human milk. Journal of Exposure Science and Environmental Epidemiology 17:510–524.
LaKind, J. S., C. Berlin, and D. Q. Naiman. 2001. Infant exposure to chemicals in breast milk in the United States: What we need to learn from a breast milk monitoring program. Environmental Health Perspectives 109:75–88.
LaKind, J. S., R. L. Brent, M. L. Dourson, S. Kacew, G. Koren, B. Sonawane, A. J. Tarzian, and K. Uhl. 2005. Human milk biomonitoring data: Interpretation and risk assessment issues. Journal of Toxicology and Environmental Health 68(20):1713–1770.
LaKind, J. S., C. M. Berlin, Jr., and D. R. Mattison. 2008. The heart of the matter on breastmilk and environmental chemicals: Essential points for healthcare providers and new parents. Breastfeeding Medicine 3(4):251–259.
LaKind, J. S., C. M. Berlin, Jr., A. Sjödin, W. Turner, R. Y. Wang, L. L. Needham, I. M. Paul, J. L. Stokes, D. Q. Naiman, and D. G. Patterson, Jr. 2009. Do human milk concentrations of persistent organic chemicals really decline during lactation? Chemical concentrations during lactation and milk/serum partitioning. Environmental Health Perspectives 117(4):500–507.
LaKind, J. S., M. Goodman, and D. R. Mattison. 2014. Bisphenol A and indicators of obesity, glucose metabolism/type 2 diabetes and cardiovascular disease: A systematic review of epidemiologic research. Critical Reviews in Toxicology 44(2):121–150.
LaKind, J. S., M. Davis, G. M. Lehmann, E. Hines, S. A. Marchitti, C. Alcala, and M. Lorber. 2018. Infant dietary exposures to environmental chemicals and infant/child health: A critical assessment of the literature. Environmental Health Perspectives 126(9):96002.
Le Coadou, L., K. Le Ménach, P. Labadie, M. H. Dévier, P. Pardon, S. Augagneur, and H. Budzinski. 2017. Quality survey of natural mineral water and spring water sold in France: Monitoring of hormones, pharmaceuticals, pesticides, perfluoroalkyl substances, phthalates, and alkylphenols at
the ultra-trace level. Science of the Total Environment 603–604:651–662. https://doi.org/10.1016/j.scitotenv.2016.11.174. PMID: 28343692.
Lee, S., S. Kim, J. Park, H. J. Kim, G. Choi, S. Choi, S. Kim, S. Y. Kim, S. Kim, K. Choi, and H. B. Moon. 2018. Perfluoroalkyl substances (PFASs) in breast milk from Korea: Time-course trends, influencing factors, and infant exposure. Science of the Total Environment 612:286–292. https://doi.org/10.1016/j.scitotenv.2017.08.094. PMID: 28865262.
Lehmann, G. M., J. S. LaKind, M. Davis, E. Hines, S. A. Marchitti, C. Alcala, and M. Lorber. 2018. Environmental chemicals in breast milk and formula: Exposure and risk assessment implications. Environmental Health Perspectives 126(9):96001.
Li, Y., T. Fletcher, D. Mucs, K. Scott, C. H. Lindh, P. Tallving, and K. Jakobsson. 2018. Half-lives of PFOS, PFHxS and PFOA after end of exposure to contaminated drinking water. Occupational and Environmental Medicine 75(1):46–51. https://doi.org/10.1136/oemed-2017-104651. PMID: 29133598; PMCID: PMC5749314.
Lin, P. D., A. Cardenas, R. Hauser, D. R. Gold, K. P. Kleinman, M. F. Hivert, A. F. Fleisch, A. M. Calafat, M. Sanchez-Guerra, C. Osorio-Yáñez, T. F. Webster, E. S. Horton, and E. Oken. 2020. Dietary characteristics associated with plasma concentrations of per- and polyfluoroalkyl substances among adults with pre-diabetes: Cross-sectional results from the Diabetes Prevention Program Trial. Environment International 137:105217. https://doi.org/10.1016/j.envint.2019.105217. PMID: 32086073; PMCID: PMC7517661.
Liu, Y., A. Li, S. Buchanan, and W. Liu. 2020. Exposure characteristics for congeners, isomers, and enantiomers of perfluoroalkyl substances in mothers and infants. Environment International 144:106012. https://doi.org/10.1016/j.envint.2020.106012. PMID: 32771830.
Llorca, M., M. Farré, Y. Picó, M. L. Teijón, J. G. Alvarez, and D. Barceló. 2010. Infant exposure of perfluorinated compounds: Levels in breast milk and commercial baby food. Environment International 36(6):584–592. https://doi.org/10.1016/j.envint.2010.04.016. PMID: 20494442.
Lorber, M., and P. P. Egeghy. 2011. Simple intake and pharmacokinetic modeling to characterize exposure of Americans to perfluoroctanoic acid, PFOA. Environmental Science & Technology 45(19):8006–8014. https://doi.org/10.1021/es103718h. PMID: 21517063.
Loria, K. 2019. To reduce PFAS levels in food, cook at home. Consumer Reports. https://www.consumerreports.org/food-safety/to-reduce-pfas-levels-in-food-cook-at-home (accessed March 10, 2021).
Luo, L., M. J. Kim, J. Park, H.-D. Yang, Y. Kho, M.-S. Chung, and B. Moon. 2019. Reduction of perfluorinated compound content in fish cake and swimming crab by different cooking methods. Applied Biological Chemistry 62:44. https://doi.org/10.1186/s13765-019-0449-x.
Macheka, L. R., J. O. Olowoyo, L. L. Mugivhisa, and O. A. Abafe. 2021. Determination and assessment of human dietary intake of per and polyfluoroalkyl substances in retail dairy milk and infant formula from South Africa. Science of the Total Environment 755(Pt 2):142697. https://doi.org/10.1016/j.scitotenv.2020.142697. PMID: 33065506.
Macheka-Tendenguwo, L. R., J. O. Olowoyo, L. L. Mugivhisa, and O. A. Abafe. 2018. Per- and polyfluoroalkyl substances in human breast milk and current analytical methods. Environmental Science and Pollution Research International 25(36):36064–36086. https://doi.org/10.1007/s11356-018-3483-z. PMID: 30382519.
MDH (Minnesota Department of Health). 2008, January. MDH evaluation of point-of-use water treatment devices for perfluorochemical removal interim report. Fact Sheet. https://wrl.mnpals.net/islandora/object/WRLrepository%3A1862/datastream/PDF/view (accessed March 21, 2021).
Mozaffarian, D., and E. B. Rimm. 2006. Fish intake, contaminants, and human health: Evaluating the risks and the benefits. Journal of the American Medical Association 296(15):1885–1899. https://doi.org/10.1001/jama.296.15.1885. Erratum in Journal of the American Medical Association 2007; 297(6):590. PMID: 17047219.
Munn, Z., M. D. J. Peters, C. Stern, C. Tufanaru, A. McArthur, and E. Aromataris. 2018. Systematic review or scoping review? Guidance for authors when choosing between a systematic or scoping review approach. BMC Medical Research Methodology 143. https://doi.org/10.1186/s12874-018-0611-x (accessed March 21, 2021).
Myers, A. L., P. W. Crozier, P. A. Helm, C. Brimacombe, V. I. Furdui, E. J. Reiner, D. Burniston, and C. H. Marvin. 2012. Fate, distribution, and contrasting temporal trends of perfluoroalkyl substances (PFASs) in Lake Ontario, Canada. Environment International 44:92–99. https://doi.org/10.1016/j.envint.2012.02.002. PMID: 22406021.
Nadal, M., and J. L. Domingo. 2014. Indoor dust levels of perfluoroalkyl substances (PFASs) and the role of ingestion as an exposure pathway: A review. Current Organic Chemistry 18(17):2200–2208. https://doi.org/10.2174/1385272819666140804230713.
NASEM (National Academies of Sciences, Engineering, and Medicine). 2021. Federal government human health PFAS research workshop: Proceedings of a workshop—in brief. Washington, DC: The National Academies Press. https://doi.org/10.17226/26054.
ODH (Ohio Department of Health). 2020. How to reduce your exposure to PFAS. Health assessment section. https://epa.ohio.gov/Portals/28/documents/pfas/PFASHowtoReduceExposure.pdf (accessed March 10, 2021).
Oliaei, F., D. Kriens, R. Weber, and A. Watson. 2013. PFOS and PFC releases and associated pollution from a PFC production plant in Minnesota (USA). Environmental Science and Pollution Research International 20(4):1977–1992. https://doi.org/10.1007/s11356-012-1275-4. PMID: 23128989.
Patterson, C., J. Burkhardt, D. Schupp, E. R. Krishnan, S. Dyment, S. Merritt, L. Zintek, and D. Kleinmaier. 2019. Effectiveness of point-of-use/point-of-entry systems to remove per- and polyfluoroalkyl substances from drinking water. AWWA Water Science 1(2):1–12. https://doi.org/10.1002/aws2.1131. PMID: 31338490; PMCID: PMC6650157.
Sajid, M., and M. Ilyas. 2017. PTFE-coated non-stick cookware and toxicity concerns: A perspective. Environmental Science and Pollution Research International 24(30):23436–23440. https://doi.org/10.1007/s11356-017-0095-y. PMID: 28913736.
Scher, D. P., J. E. Kelly, C. A. Huset, K. M. Barry, and V. L. Yingling. 2019. Does soil track-in contribute to house dust concentrations of perfluoroalkyl acids (PFAAs) in areas affected by soil or water contamination? Journal of Exposure Science & Environmental Epidemiology 29:218–226. https://doi.org/10.1038/s41370-018-0101-6.
Sinclair, E., S. K. Kim, H. B. Akinleye, and K. Kannan. 2007. Quantitation of gas-phase perfluoroalkyl surfactants and fluorotelomer alcohols released from nonstick cookware and microwave popcorn bags. Environmental Science & Technology 41(4):1180–1185. https://doi.org/10.1021/es062377w.PMID: 17593716.
Stahl, L. L., B. D. Snyder, A. R. Olsen, T. M. Kincaid, J. B. Wathen, and H. B. McCarty. 2014. Perfluorinated compounds in fish from U.S. urban rivers and the Great Lakes. Science of the Total Environment 499:185–195. https://doi.org/10.1016/j.scitotenv.2014.07.126. PMID: 25190044.
Sunderland, E. M., X. C. Hu, C. Dassuncao, A. K. Tokranov, C. C. Wagner, and J. G. Allen. 2019. A review of the pathways of human exposure to poly- and perfluoroalkyl substances (PFASs) and present understanding of health effects. Journal of Exposure Science & Environmental Epidemiology 29(2):131–147. https://doi.org/10.1038/s41370-018-0094-1. PMID: 30470793; PMCID: PMC6380916.
Tao, L., K. Kannan, C. M. Wong, K. F. Arcaro, and J. L. Butenhoff. 2008a. Perfluorinated compounds in human milk from Massachusetts, U.S.A. Environmental Science & Technology 42(8):3096–3101. https://doi.org/10.1021/es702789k. PMID: 18497172.
Tao, L., J. Ma, T. Kunisue, E. L. Libel, S. Tanabe, and K. Kannan. 2008b. Perfluorinated compounds in human breast milk from several Asian countries, and in infant formula and dairy milk from the
United States. Environmental Science & Technology 42(22):8597–8602. https://doi.org/10.1021/es801875v. PMID: 19068854.
Taylor, M. D., S. Nilsson, J. Bräunig, K. C. Bowles, V. Cole, N. A. Moltschaniwskyj, and J. F. Mueller. 2019. Do conventional cooking methods alter concentrations of per- and polyfluoroalkyl substances (PFASs) in seafood? Food and Chemical Toxicology 127:280–287. https://doi.org/10.1016/j.fct.2019.03.032. PMID: 30905867.
Thomsen, C., L. S. Haug, H. Stigum, M. Frøshaug, S. L. Broadwell, and G. Becher. 2010. Changes in concentrations of perfluorinated compounds, polybrominated diphenyl ethers, and polychlorinated biphenyls in Norwegian breast-milk during twelve months of lactation. Environmental Science & Technology 44(24):9550–9556. https://doi.org/10.1021/es1021922. Erratum in Environmental Science & Technology 2011; 45(7):3192. PMID: 21090747.
Tittlemier, S. A., K. Pepper, C. Seymour, J. Moisey, R. Bronson, X. L. Cao, and R. W. Dabeka. 2007. Dietary exposure of Canadians to perfluorinated carboxylates and perfluorooctane sulfonate via consumption of meat, fish, fast foods, and food items prepared in their packaging. Journal of Agricultural and Food Chemistry 55:3203–3210.
Trudel, D., L. Horowitz, M. Wormuth, M. Scheringer, I. T. Cousins, and K. Hungerbühler. 2008. Estimating consumer exposure to PFOS and PFOA. Risk Analysis 28(2):251–269. https://doi.org/10.1111/j.1539-6924.2008.01017.x. Erratum in Risk Analysis 2008; 28(3):807. PMID: 18419647.
Vandenbroucke, J. P., E. von Elm, D. G. Altman, P. C. Gøtzsche, C. D. Mulrow, S. J. Pocock, C. Poole, J. J. Schlesselman, and M. Egger for the STROBE Initiative. 2007. Strengthening the reporting of observational studies in epidemiology (STROBE): Explanation and elaboration. Epidemiology 18:805–835.
VanNoy, B. N., J. Lam, and A. R. Zota. 2018. Breastfeeding as a predictor of serum concentrations of per- and polyfluorinated alkyl substances in reproductive-aged women and young children: A rapid systematic review. Current Environmental Health Reports 5(2):213–224. https://doi.org/10.1007/s40572-018-0194-z. PMID: 29737463.
Vassiliadou, I., D. Costopoulou, N. Kalogeropoulos, S. Karavoltsos, A. Sakellari, E. Zafeiraki, M. Dassenakis, and L. Leondiadis. 2015. Levels of perfluorinated compounds in raw and cooked Mediterranean finfish and shellfish. Chemosphere 127:117–126. https://doi.org/10.1016/j.chemosphere.2014.12.081. PMID: 25676497.
Vestergren, R., and I. T. Cousins. 2009. Tracking the pathways of human exposure to perfluorocarboxylates. Environmental Science & Technology 43(15):5565–5575. https://doi.org/10.1021/es900228k.PMID: 19731646.
von der Trenck, K. T., R. Konietzka, A. Biegel-Engler, J. Brodsky, A. Hädicke, A. Quadflieg, R. Stockerl, and T. Stahl. 2018. Significance thresholds for the assessment of contaminated groundwater: Perfluorinated and polyfluorinated chemicals. Environmental Sciences Europe 30(1):19. https://doi.org/10.1186/s12302-018-0142-4. PMID: 29930891; PMCID: PMC5992233.
von Ehrenstein, O. S., S. E. Fenton, K. Kato, Z. Kuklenyik, A. M. Calafat, and E. P. Hines. 2009. Polyfluoroalkyl chemicals in the serum and milk of breastfeeding women. Reproductive Toxicology 27(3–4):239–245. https://doi.org/10.1016/j.reprotox.2009.03.001. PMID: 19429402.
WHO (World Health Organization). 2000. Consultation on assessment of the health risks of dioxins; reevaluation of the tolerable daily intake (TDI): Executive summary. Food Additives & Contaminants 17:223–240.
WHO. 2020. Infant and young child feeding. https://www.who.int/en/news-room/fact-sheets/detail/infant-and-young-child-feeding (accessed May 12, 2021).
Wu, X. M., D. H. Bennett, A. M. Calafat, K. Kato, M. Strynar, E. Andersen, R. E. Moran, D. J. Tancredi, N. S. Tulve, and I. Hertz-Picciotto. 2015. Serum concentrations of perfluorinated compounds (PFC) among selected populations of children and adults in California. Environmental Research 136:264–273. https://doi.org/10.1016/j.envres.2014.09.026. PMID: 25460645; PMCID: PMC4724210.
Yakushiji, T., I. Watanabe, K. Kuwabara, S. Yoshida, K. Koyama, I. Hara, and N. Kunita. 1978. Long-term studies of the excretion of polychlorinated biphenyls (PCBs) through the mother’s milk of an occupationally exposed worker. Archives of Environmental Contamination and Toxicology 7(4):493–504.
Young, A. S., R. Hauser, T. M. James-Todd, B. A. Coull, H. Zhu, K. Kannan, A. J. Specht, M. S. Bliss, and J. G. Allen. 2021. Impact of “healthier” materials interventions on dust concentrations of per- and polyfluoroalkyl substances, polybrominated diphenyl ethers, and organophosphate esters. Environment International 150:106151. https://doi.org/10.1016/j.envint.2020.106151. PMID: 33092866; PMCID: PMC7940547.
This page intentionally left blank.


