
5
PFAS Testing and Concentrations to Inform Clinical Care of Exposed Patients
The Centers for Disease Control and Prevention (CDC) and various other health agencies routinely conduct biomonitoring, including measuring of exposure biomarkers in human tissues, as an important part of environmental public health surveillance (Latshaw et al., 2017). With the exception of a few environmental exposures, however, such as children’s blood lead measurements, biomonitoring is rarely included in routine clinical care. Biomonitoring integrates all sources and routes of exposure into measurements of internal exposure. In this regard it is advantageous because it is more reflective of aggregate exposure than are measures of external exposure, but as a consequence, it does not identify the specific source of an exposure. Nonetheless, when properly interpreted, biomonitoring data can be used to monitor exposure levels and trends, evaluate potential health risks connected to specific sites or populations, and inform public health decisions (Latshaw et al., 2017).
Biomonitoring can be based on the direct measurement of environmental chemicals or their reaction or breakdown products (metabolites) in human tissues and fluids, such as blood (serum, plasma, and whole blood), urine, hair, nails, and breast milk (CDC, 2021; NRC, 1987). Traditionally, biomarkers have been classified as biomarkers of exposure, effect, or susceptibility (see Figure 5-1).
This chapter addresses options and considerations to guide decision making for per- and polyfluoroalkyl substances (PFAS) testing in a patient’s biological samples, strategies for interpreting biomonitoring data, and PFAS concentrations that could inform clinical care of exposed patients.
OPTIONS AND CONSIDERATIONS TO GUIDE DECISION MAKING FOR PFAS TESTING
PFAS Laboratory Methods
There are no standard methods for PFAS exposure biomonitoring; some, but not all, laboratories use methods similar to those used by the CDC. Unlike most clinical laboratories, laboratories that offer PFAS testing are not subject to measurement standardization through external proficiency testing programs that evaluate laboratory performance against preestablished criteria. Laboratories that offer PFAS testing also need not comply with clinical certification, such as Clinical Laboratory Improvement Amendments (CLIA) certification, for reporting of results to patients. To support the quality and integrity of results, PFAS testing should be conducted in laboratories that meet the following criteria:
- have an extensive quality assurance/quality control (QA/QC) program (Kannan et al., 2021);
- report National Institute of Standards and Technology Standard Reference Material (NIST-SRM)–traceable data (Kannan et al., 2021); and
- employ laboratory methods with relative standard deviations of less than 15 percent and with limits of detection (LODs) in the picogram/mL region, consistent with the LODs of the CDC and academic laboratories (FDA, 2018; SWGTOX, 2013).
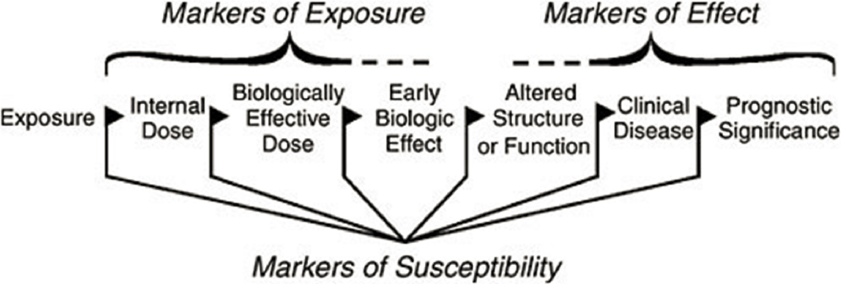
SOURCE: NRC, 1987.
Which PFAS are most important to measure depends on the reasons for testing. A method comparable to that of the CDC that reports the linear and branched isomers of PFAS will allow comparison of individual results with those in the National Report on Human Exposure to Environmental Chemicals (CDC, 2015, 2021)—an informative method for individuals who wish to understand whether their exposure is high or low compared with background exposures in the U.S. population. For people with a past history of exposure to PFAS not included in the CDC panel, laboratory tests need to detect the compounds to which the person is suspected to have been exposed. However, adequate targeted exposure biomonitoring approaches may not currently exist for measuring many PFAS—especially those that are emerging or newly studied—that may be of concern in some communities. Most laboratories can test only for a limited number of PFAS; a typical PFAS panel will include fewer than 25 specific PFAS. SRMs exist for some but not all PFAS. NIST 1957 has reference values for 7 PFAS, and NIST 1958 includes 5 PFAS. The availability of SRMs for a broader range of PFAS would support higher-quality data for more PFAS.
Interpretation of PFAS biomonitoring data depends on the analytical methods being used, the matrix (blood, serum, plasma, urine, breast milk, etc.) in which the PFAS are measured, and the pharmacokinetics of the PFAS being measured.
Analytical Methods
Biological samples are generally analyzed using targeted analytical methods (i.e., for specific PFAS for which methods and standards are available), leaving a wide array of PFAS unaccounted for. Methods for measuring total extractable or adsorbable organofluorine can circumvent the limitations of targeted analytics, but these methods are also plagued by important challenges. Some non-PFAS are merged into the total organofluorine load. Moreover, clear health guidance values for total organofluorine have not been—and may very well never be—derived (see Box 5-1) because toxicological testing and risk assessments are typically conducted on a chemical-by-chemical basis so regulations can be derived for specific chemicals, although it is well known that single-chemical exposures are not reflective of how exposures occur in reality (NRC, 2009). Untargeted testing can also be used to assess exposure to PFAS, but is less standardized and precise than current targeted testing. Untargeted approaches, especially those that employ multiplexing techniques to account for high levels of endogenous chemicals, may provide a better overall picture of total PFAS exposure; as of now, however, those data would not be quantifiable and would provide only a qualitative (presence or absence) estimate of exposure (Guo et al., 2022).
Biological Matrix
The specific PFAS to which a patient is at risk of exposure may also dictate the biological samples (e.g., blood, urine) that should be collected. Most studies measure PFAS in serum, which is likely the best matrix for measuring PFAS with long biological half-lives (Calafat et al., 2019). Other matrices, such as whole blood or urine, may be better suited to the detection of PFAS with short biological half-lives or those whose distribution in the body differs from that of the most commonly studied PFAS, such as perfluorooctanoic acid (PFOA) and perfluorooctanesulfonic (PFOS) (Calafat et al., 2019; Poothong et al., 2017).
PFAS can be measured in multiple biological matrices, including but not limited to whole blood, serum, plasma, urine, breast milk, and hair (Alves et al., 2015). Overall, most studies have used either serum or plasma to evaluate PFAS exposure, and the measured concentrations in serum and plasma are comparable for PFOA, PFOS, and perfluorohexane sulfonate (PFHxS) (Ehresman et al., 2007). PFAS concentrations in other matrices can provide information on exposure during specific periods of life; for example, PFAS levels in segments of hair can help reconstruct historical exposures, and PFAS levels in breast milk make it possible to estimate infants’ intake through breastfeeding (Zheng et al., 2021). On multiple occasions, this study’s town hall participants indicated that they wanted to know not only their serum PFAS levels but also their breast milk levels, as these translate into early-life exposure for their children.
While urine, breast milk, and hair samples can be obtained relatively noninvasively, biomonitoring efforts in the United States have focused largely on serum, which is one of the most important biological compartments for the distribution of many PFAS in the body. Consequently, reference ranges and risk-based biomonitoring levels are limited or unavailable for other matrices. To date, the published literature provides measurements in breast milk for fewer than 200 people in the United States. If breast milk levels are measured, they can be interpreted by comparison with breast milk levels estimated using data from the National Health and Nutrition Examination Survey (NHANES), a series of surveys on the health status, health-related behaviors, and nutrition of the U.S. population (Lakind et al., 2022). Finally, much remains unknown about the distribution of the wide array of PFAS; for some of them, such traditional matrices as serum may not be optimal for estimating exposure to those PFAS whose distribution into these matrices is not significant.
Micro-samples are samples in which blood, usually from a pricked finger or heel stick, is collected into a small cuvette or spotted onto specially prepared filter paper and dried in open air under
ambient conditions. Micro-samples have several advantages: they are minimally invasive, do not have to be collected by a phlebotomist, reduce biohazard risks, and in some cases do not require refrigeration or freezing (Freeman et al., 2018). On the other hand, the blood collected from a pricked finger is capillary blood, which, unlike venous blood, contains interstitial fluid, and research is needed to determine whether capillary blood concentrations are comparable to serum measurements. Capillary blood also requires validation, particularly if collected as dried blood spots because volume is difficult to estimate as a result of hematocrit and chromatographic effects, although K+ standardization is showing promise (Barr et al., 2021). Newborn blood spots have, however, been used successfully in research studies to evaluate exposures to PFAS and assess changes in exposures over time (Gross et al., 2020; Ma et al., 2013; Yeung et al., 2019).
Pharmacokinetics
Some PFAS, including PFOA and PFOS, have a relatively long biological half-life, and measurement of these PFAS in serum may represent chemical exposures that occurred in past years. For some other PFAS, half-lives are on the order of days. For example, GenX is estimated to have a biological half-life of 81 hours (Clark and TCS, 2021); as a result, its measurement in serum or urine likely represents exposure that occurred much more recently, such as in the last few weeks. In such cases, samples taken at different times may be needed to derive an adequate representation of long-term exposure. Alternative measures for estimating long-term exposure include exposure reconstruction of drinking water levels. Also, some physiological events may influence biological levels of PFAS. Pregnancy and breastfeeding can increase PFAS excretion, for example, so levels in mothers may not be reflective of levels prior to pregnancy (Kato et al., 2014).
Sample Contamination
The concentrations of PFAS measured in most human tissues can be considered trace concentrations, making sample contamination an issue. Contamination occurring during sample collection, transport, storage, or preparation can impact the ability to interpret a laboratory result. For example, PFAS are commonly used in medical collection equipment, such as Teflon-capped blood test tubes. Teflon should therefore be avoided in sample collection equipment intended for PFAS measurement (NASEM, 2018a), and field blanks may need to be performed to ensure that contamination is negligible.
Commercially Available PFAS Testing Laboratories
A few laboratories currently offer PFAS testing. NMS labs (Horsham, Pennsylvania) offers PFAS testing through a clinician request for out-of-pocket payment (Test Code 39307, CPT Code[s] 82542; reported by town hall speakers to cost more than $600) or reimbursement from insurance. NMS can measure six PFAS in serum: perfluorobutanesulfonic acid (as the linear isomer) (PFBS), perfluoroheptanoic acid (as the linear isomer) (PFHpA), perfluorohexanesulfonic acid (as the linear isomer) (PFHxS), perfluorononanoic acid (as the linear isomer) (PFNA), perfluorooctanesulfonic acid (as the linear isomer) (PFOS), and perfluorooctanoic acid (as the linear isomer) (PFOA).1 It is important to note that although the NMS panel does not completely overlap with the specific PFAS the committee was charged to evaluate, it does include PFOA, PFOS, and PFNA, three of the PFAS that are commonly reported as detected in NHANES and therefore typically contribute the most to exposure. The NMS panel would be more comparable to NHANES if it included the branched isomers of PFOS and PFOA, and PFHxS.
___________________
1 See https://www.nmslabs.com/tests/3427SP (accessed June 16, 2022).
EMPower DX (Framingham, Massachusetts), a subsidiary of Eurofins Scientific (Luxembourg City, Luxembourg), recently began offering direct-to-consumer testing for more than 40 PFAS via self-collected finger prick sample at a cost of $399.2 The website for this lab reports that the test will “quantitatively determine PFAS concentrations … and positive or negative detections are reported with 99% confidence” (para. 4). In an email communication, company representatives reported that NIST reference standards are used, and that coefficients of variation are being developed for all PFAS in the panel.3 As discussed above, method validation is needed for PFAS measurements from capillary blood to know how comparable they are to measurements from other PFAS tests.
Harms and Benefits of PFAS Testing
Based on the committee’s principle of proportionality (see Chapter 2), it is necessary to consider the plausible harms and benefits associated with PFAS testing, although the weight of each will depend on the individual. Harms of PFAS testing include fear induced by blood draw, a small risk of injury or infection at the draw site, difficulties in interpreting results, and psychological stress that may occur when people who are tested learn that they or their family members have high levels of PFAS exposure. On the other hand, biomonitoring for PFAS blood levels may also alleviate fears associated with not knowing one’s PFAS levels. Another potential benefit is increasing awareness of exposure so that exposures can be reduced. If sources of exposure are identified, actions taken to reduce these exposures, such as using a water filter, may also benefit family members in addition to the person who was tested. Community-level benefits may be associated with PFAS testing as well, such as empowering communities to respond to contamination and providing a baseline with which to evaluate the impact of community-level interventions to reduce exposure. Additionally, biomonitoring for PFAS in the context of epidemiologic studies could provide more information about PFAS-associated health effects.
To evaluate these potential harms and benefits associated with biomonitoring, the committee considered research studies evaluating the harms and benefits of reporting biomonitoring results to study participants (report-back). Report-back has been an active area of research by multidisciplinary teams, focused on whether and how to report study results to participants. These studies have varied in design, but methods used generally include interviews with study participants, investigators, and/or institutional review boards. They may also include focus groups; advisory councils; stakeholder workshops; observations at community meetings; one-on-one user testing of reports; and digital analytics, such as page views or time spent interacting with digital results pages. Investigators in these studies have identified harms associated with reporting of biomonitoring results, such as stress or concerns about the health effects associated with exposures, but the levels of stress reported have not been high enough to be considered extreme worry or panic (Emmett et al., 2009; Ohayon et al., 2017; Ramirez-Andreotta et al., 2016). Report-back studies have found further that when biomonitoring results are returned with information about how study participants could be exposed to the chemicals, what health effects are potentially associated with exposure, and what strategies could reduce exposure, participants express appreciation for receiving the results and feel empowered by the information (Adams et al., 2011; Altman et al., 2008; Brody et al., 2014; Giannini et al., 2018; Hernick et al., 2011; Perovich et al., 2018; Ramirez-Andreotta et al., 2016; Tomsho et al., 2019). Moreover, research studies have found that participants appreciate receiving test results even when the health implications of those results are unclear (Adams et al., 2011; Hernick et al., 2011; NASEM, 2018b). One study that compared the benefits of receiving individual versus aggregate biomonitoring results found that the former motivated participants to access information about environmental sources of chemical exposure and their health effects. The study also found that personal report-back increased engagement with exposure reports among Black participants.
___________________
2 See https://empowerdxlab.com/products/product/pfas-exposure-test (accessed June 16, 2022).
3 Personal communication, R. Mitzel, President Eurofins Air Toxics, LLC SVP Eurofins Specialty Services, December 6, 2021.
Report-back was associated with a small increase in psychological stress, but the authors suggest that this stress could motivate appropriate behavior change to reduce exposure (Brody et al., 2021).
In many cases, community members who provided testimony at the committee’s town halls were strongly in favor of PFAS testing and described being frustrated with the numerous difficulties encountered in accessing the testing (see Appendix B). Kristen Mello of Westfield Residents Advocating for Themselves (WRAFT) said to the committee:
You don’t have a problem getting an insurance assessor when your car is hit, you don’t have a problem getting an insurance assessor when you have a tornado, but this slow motion unfolding environmental and public health disaster … is intentionally keeping the information from us so that we cannot take action.
Furthermore, Emily Donovan of Clean Cape Fear, said:
Sadly it feels like guinea pigs are treated better, because at least their exposures are thoroughly studied for the betterment of humanity.
And Cathy Wusterbarth of Need Our Water said:
We’ve tested the fish; we’ve tested the deer; we’ve tested the groundwater, the waterways, and the foam. When are we going to test the people?… The only risk [of testing] is to the polluters who do not want us to link them to our exposure.
Community members stated that they want access to PFAS testing so that they can understand their personal level of exposure and, as suggested by Ayesha Khan of Nantucket PFAS Action Group, “help those who are exposed to be proactive in reducing exposure and managing risk.” An example of the how PFAS testing can help people manage health risks was presented by Sandy Wynn-Stelt, who learned that the drinking water in her home was contaminated with PFAS at a level more than 1,000 times the current U.S. Environmental Protection Agency (EPA) health advisory and paid out of pocket for PFAS testing. She shared her results with her clinician, and they decided to conduct clinical follow-up for any of the conditions associated with PFAS, including impacts on thyroid hormone levels. The results of her thyroid tests led to other follow-up and ultimately to her diagnosis of thyroid cancer. Wynn-Stelt believes her PFAS testing led to an earlier diagnosis and better outcomes for her cancer.
Social and Ethical Implications of PFAS Testing
Many town hall speakers voiced frustration about not having access to testing for PFAS. Speakers mentioned the injustices related to having been exposed to PFAS without their consent or knowledge and their frustration with being unable to access testing. They shared that PFAS testing, when available, is expensive. Town hall speakers also suggested that discussion of PFAS testing should be conducted in a culturally sensitive manner, be available in a variety of languages, and be at a reading level that the average American can understand (e.g., 4th-grade level).
Another important social consideration is that people who are tested for PFAS may experience social and economic conflicts related to their testing. If a PFAS blood test identifies community contamination, business revenue and property values may be adversely affected (Harclerode et al., 2021). People who draw attention to the contamination may experience anger and social isolation from other community members. Indeed, one town hall speaker asked that their name be removed from the town hall agendas and the committee’s website because they were worried about angering neighbors by talking about their contaminated well.
Art Schaap, a dairy farmer in New Mexico, discovered that his farm was unknowingly subjected to severe PFAS contamination due to use of military aqueous film-forming foam (AFFF). After learning
of the contamination, Schaap voluntarily tested his herd for PFAS and discovered that his cows were highly exposed. The PFAS contamination on Schaap’s farm devastated his livelihood because he had limited options available for getting rid of the contaminated animals in any profitable way. The dairy, beef, and rendering industries do not want PFAS-contaminated animals or products. The result for Schaap was the stranding of at least 4,000 cows, the death of 1,200, and the dumping of 1,500 loads of milk (see Appendix B for Schaap’s complete testimony).
PFAS Testing: Findings and Recommendations
Applying the principle of proportionality, the committee believes that the benefits of PFAS testing for those who request it typically outweigh the harms (see Box 5-2). The harms reported in studies of report-back of biomonitoring results are worry about the harms of exposure, decreased property values, and potential social isolation or ostracism. In many cases, people who request testing are already worried about their exposure, which is why they are requesting the testing, and they may already be at risk of decreased property values associated with contamination. People in exposed communities have been “contaminated without consent” and “poisoned without permission.”4
An important element of the principle of justice is making PFAS testing easily accessible and readily available to all regardless of ability to pay, race, ethnicity, age, occupation, or location. Some populations are at increased risk of PFAS exposure and therefore may be at increased risk for a wide range of health conditions. These factors favor making exposure biomonitoring available to all who desire it. The principle of autonomy (i.e., respect for the ability of people to make their own health decisions) also favors allowing people who are likely to have a history of elevated exposure to PFAS and want PFAS testing to receive it and those who do not, to refuse it. These decisions require shared decision making5 between patient and clinician and should include clarifying that exposure biomonitoring results
___________________
4 Quotes from Andrea Amico, speaker at the committee’s meeting on July 13, 2021.
5 Barry and colleagues (2012) build on concepts in Charles (1997) and the Institute of Medicine’s (2001) Crossing the Quality Chasm: A New Health System for the 21st Century, describing shared decision making as the pinnacle of patient-centered care: “The process by which the optimal decision may be reached … is called shared decision-making and involves, at minimum, a clinician and the patient…. In shared decision-making, both parties share information: the clinician offers options and describes their risks and benefits, and the patient expresses his or her preferences and values. Each participant is thus armed with a better understanding of the relevant factors and shares responsibility in the decision about how to proceed” (p. 780).
do not predict future health conditions and can only indicate the potential for an increased risk for certain conditions associated with exposures. Allowing people the opportunity to discuss with their clinicians whether they should undergo PFAS testing shows respect for patient values and is particularly important for people who have experienced environmental injustice as a result of PFAS contamination in their community.
The committee acknowledges that important factors need to be addressed. There are deficiencies in the current cost payment model, and the availability of PFAS testing may need to be addressed. Clinicians and health care facilities will also need to be made aware of reimbursement policies and laboratory codes (e.g., CPT; Reference Lab Order Code). New Hampshire recently required that health insurance cover PFAS blood testing.6 PFAS testing can currently be ordered online without a provider, and the committee believes the testing and interpretation of its results are most beneficial if done with the guidance of a clinician.
The committee makes the following recommendations:
Recommendation 5-1: As communities with PFAS exposure are identified, government entities (e.g., Centers for Disease Control and Prevention [CDC]/Agency for Toxic Substances and Disease Registry [ATSDR], public health departments) should support clinicians with educational materials about PFAS testing so they can discuss testing with their patients. These educational materials should include the following information:
- How people can be exposed to PFAS: Exposure routes include occupational exposures and work with fluorochemicals or as a firefighter; consumption of contaminated drinking water in communities that obtain their water from sources near commercial airports, military bases, fluorochemical manufacturing plants, wastewater treatment plants, landfills, or incinerators where PFAS-containing waste may have been disposed of or farms where sewage sludge may have been used; and consumption of contaminated fish or game if fishing or hunting occurs in contaminated areas. Individuals living near fluorochemical plants may also be exposed via inhalation of air emissions.
- Potential health effects of PFAS exposure and strategies for reducing exposure.
- Limitations of PFAS blood testing: PFAS blood testing does not identify the sources of exposure or predict future health outcomes; it only assesses body burden at the time of sample collection. For example, a person with low blood levels today may have had higher levels in the past.
- The benefits and harms of PFAS testing.
Recommendation 5-2: Clinicians should offer PFAS testing to patients likely to have a history of elevated exposure. In all discussions of PFAS testing, clinicians should describe the potential benefits and harms of the testing and the potential clinical consequences (such as additional follow-up), related social implications, and limitations of the testing so that patient and clinician can make a shared, informed decision. Patients who are likely to have a history of elevated exposure to PFAS include those who have
___________________
6 See https://providernews.anthem.com/new-hampshire/article/coverage-for-pfas-and-pfc-blood-tests-for-newhampshire-residents (accessed June 17, 2022).
- had occupational exposure to PFAS (such as those who have worked with fluorochemicals or served as a firefighter);
- lived in communities where environmental and public health authorities (Centers for Disease Control and Prevention [CDC], Agency for Toxic Substances and Disease Registry [ATSDR], U.S. Environmental Protection Agency [EPA], state and local environmental or health authorities), or academic researchers have documented PFAS contamination; or
- lived in areas where PFAS contamination may have occurred, such as near facilities that use or have used fluorochemicals, commercial airports, military bases, wastewater treatment plants, farms where sewage sludge may have been used, or landfills or incinerators that have received PFAS-containing waste.
When clinicians discuss results of PFAS with patients, the results will be most useful if accompanied by information on how exposure occurs, the potential associated health effects, and strategies that may reduce exposure—the same contextual information included in the report-back literature reviewed by the committee. Clinicians may also want to consider the frequency of PFAS testing based on the considerations in Box 5-3.
STRATEGIES FOR INTERPRETING BIOMONITORING DATA
There are two general strategies for interpreting chemical concentrations for exposure biomonitoring: reference-based (or descriptive) and risk-based (NRC, 2006). Both approaches can be useful to inform clinical care of exposed patients. Reference-based approaches can allow a clinician to understand whether the concentration of a chemical in the patient’s biological sample is within or outside of the normal background range, while risk-based approaches can allow a clinician to determine whether a patient’s biological concentration is below or above a value associated with tolerable, negligible, or minimal risk. Note that comparing concentrations of individual PFAS against reference- or risk-based levels may underestimate overall exposure to a complex mixture of PFAS and associated risk, such as in areas contaminated with PFAS used to replace other PFAS that have been phased out.
Figure 5-2 illustrates the distribution of biomarker concentrations in a generic reference population, expressed as cumulative frequency. As is commonly done in a clinical test, the 95th percentile of the distribution can be used to determine the upper-limit value of the test result. However, a different percentile may be chosen, depending on the circumstances, the characteristics of the reference population, the distribution of the results, and the purpose of the study. It is important to be aware that a particular
cutpoint does not represent a level that separates the population into typical versus highly exposed (NRC, 2006). Box 5-4 describes the use of reference ranges to interpret other environmental exposures, such as exposures to lead and arsenic (see Box 5-4).
Reference-Based Approaches
Use of a reference-based approach to interpret biomonitoring data requires descriptive statistics from a reference population against which to compare the data. Typically, an individual’s result would be compared with a statistical review of the reference data, typically in the form of a data distribution, such as 10th, 25th, 50th, 75th, and 95th percentiles within the reference population. The reference range offers a point of comparison, although some people or subgroups within that range may be subject to more or less exposure. This section describes a number of interpretive issues that arise with this approach. The validity and utility of biomonitoring values for use as reference ranges depend on the design of the studies from which those values were derived and the quality of the data, with special attention to the availability and comparability of data on the reference population in relation to the study population (NRC, 2006).
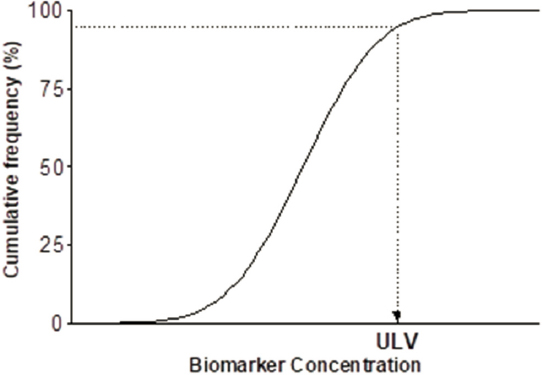
NOTE: ULV = upper limit value.
SOURCE: NRC, 2006.
The reference range approach depends on data availability and data comparability for both the method used to measure PFAS and the population with which the results are being compared. Ideally, the reference population includes people similar in age, race or ethnicity, sex, and other demographic factors to the person whose PFAS testing result is being interpreted. Additionally, it is important that the PFAS be analyzed in the same tissues or fluids (blood, serum, breast milk, urine, etc.) and that the chemical analysis methods used are comparable and measure the same PFAS (NRC, 2006).
Note that interindividual variability in PFAS testing results may be a function of differences not only in exposure but also in pharmacokinetics with respect to excretory clearance. Such host factors as parity, breastfeeding status, menstrual status, age, genetic polymorphisms, concurrent acute or chronic disease, and medication use can affect pharmacokinetics.
Because NHANES is conducted in only a few communities each year, regional estimates or even urban versus rural comparisons cannot be made. Table 5-1 provides the most recent years of NHANES data (in serum ng/mL) for the total population sampled (ages 12 and older) for the four most predominant PFAS: PFOA, PFOS, PFHxS, and PFNA. These PFAS have been detected in almost all NHANES participants. Since the production and use of PFOS and PFOA were phased out, their levels have been declining (Brennan et al., 2021). Important limitations of NHANES data are that data for vulnerable populations, such as children younger than 12 years old and pregnant persons, are not always available. Children younger than 12 also are not included in the National Report on Human Exposure to Environmental Chemicals, although there are published estimates of PFAS exposure for children aged 3–11 years for 2013 and 2014 (Ye et al., 2018). Pregnant people are also not included in large numbers in NHANES, so multiple years of NHANES data will need to be combined to obtain a large enough sample for comparison (Watson et al., 2020); it may be more appropriate to compare pregnant people with the data for females in the same age range and time period. NHANES also does not specifically enroll participants in PFAS-exposed communities.
Distribution of PFAS Concentrations in Exposed Communities
While NHANES provides descriptive statistics for the general U.S. population, it is noteworthy that clinicians in exposed communities will likely encounter higher PFAS levels in their patients. Discussed below are examples from some of the contaminated communities throughout the United States. The first community identified as having known PFOA (C-8) exposure was residents living near the DuPont Teflon-manufacturing plant in Parkersburg, West Virginia. Contamination of six nearby public water districts and hundreds of private drinking water wells in West Virginia and Ohio was discovered, leading to public health concerns. As part of a settlement for a large class action lawsuit against DuPont, the C-8 Science Panel was established to determine potential health effects of PFOA exposure, and a 1-year cross-sectional survey (2005–2006), known as the C-8 Health Project, was conducted among approximately 70,000 residents with contaminated drinking water (Frisbee et al., 2009). The average measured serum PFOA level among residents in Little Hocking, Ohio, with the highest PFOA drinking water contamination was 227.6 ng/mL; for the entire C-8 Health Project survey, the average value for PFOA was 82.9 ng/mL. For comparison, the average PFOA serum level in the general U.S. population was 4.2 (ng/mL) in 2005 (CDC, 2015).
The 3M Company (Maplewood, Minnesota) produced PFAS at its Cottage Grove facility from the late 1940s until 2002. PFOA was a prominent PFAS made at this site. In late 2003, the Minnesota Pollution Control Agency discovered groundwater contamination near Cottage Grove and several other sites in the suburbs east of St. Paul, Minnesota (the 3M Chemolite site, 3M Woodbury site, and 3M Oakdale site, as well as the Washington County Landfill).7 In 2006, water filtration systems for polluted public and private wells were installed to reduce PFAS exposure. The Minnesota Department of Health completed three projects to test blood levels of PFAS in people living in the east metro area of St. Paul (see Figure 5-3).
| PFAS Chemical | NHANES Survey Years | Geometric Mean (95% confidence interval [CI]) | 50th Percentile (95% CI) | 95th Percentile (95% CI) |
|---|---|---|---|---|
| PFOA | 2011–2012 | 2.08 (1.95–2.22) | 2.08 (1.96–2.26) | 5.68 (5.02–6.49) |
| 2013–2014 | 1.94 (1.76–2.14) | 2.07 (1.87–2.20) | 5.57 (4.60–6.27) | |
| 2015–2016 | 1.56 (1.47–1.66) | 1.57 (1.47–1.77) | 4.17 (3.87–4.67) | |
| 2017–2018 | 1.42 (1.33–1.52) | 1.47 (1.37–1.57) | 3.77 (3.17–5.07) | |
| PFOS | 2011–2012 | 6.31 (5.84–6.82) | 6.53 (5.99–7.13) | 21.7 (19.3–23.9) |
| 2013–2014 | 4.99 (4.50–5.52) | 5.20 (4.80–5.70) | 18.5 (15.4–22.0) | |
| 2015–2016 | 4.72 (4.40–5.07) | 4.80 (4.40–5.30) | 18.3 (15.5–22.7) | |
| 2017–2018 | 4.25 (3.90–4.62) | 4.30 (3.80–4.90) | 14.6 (13.1–16.5) | |
| PFNA | 2011–2012 | 0.881 (0.801–0.968) | 0.860 (0.750–0.960) | 2.54 (2.28–2.89) |
| 2013–2014 | 0.675 (0.613–0.742) | 0.700 (0.600–0.800) | 2.00 (1.80–2.30) | |
| 2015–2016 | 0.577 (0.535–0.623) | 0.600 (0.500–0.600) | 1.90 (1.50–2.20) | |
| 2017–2018 | 0.411 (0.364–0.464) | 0.400 (0.400–0.500) | 1.40 (1.10–1.80) | |
| PFHxS | 2011–2012 | 1.28 (1.15–1.43) | 1.27 (1.11–1.45) | 5.44 (4.61–6.82) |
| 2013–2014 | 1.35 (1.20–1.52) | 1.40 (1.20–1.60) | 5.60 (4.70–7.10) | |
| 2015–2016 | 1.18 (1.08–1.30) | 1.20 (1.10–1.40) | 4.90 (4.10–5.80) | |
| 2017–2018 | 1.08 (0.996–1.18) | 1.10 (1.00–1.20) | 3.70 (3.30–5.60) |
___________________
7 See https://www.pca.state.mn.us/waste/pfas-investigation-and-clean-up (accessed June 17, 2022).
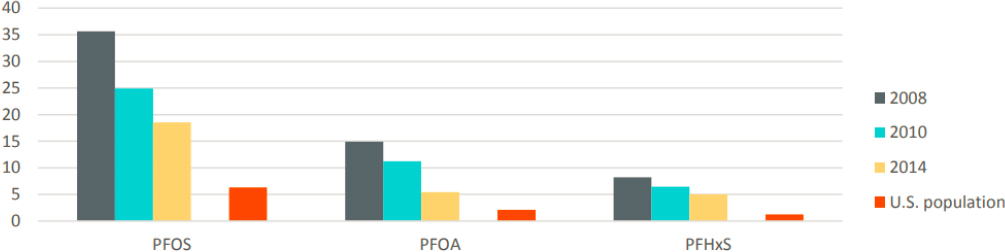
SOURCE: U.S. population levels are from the 2011–2012 National Health and Nutrition Examination Survey (NHANES).
In Hoosick Falls, New York, high PFOA levels in water led to a public outcry, and a federal class action lawsuit was filed against Saint-Gobain Performance Plastics and Honeywell International. In 2016, the geometric mean PFOA serum level among participants in the Hoosick Falls Biomonitoring Study who used village water was 43.5 ng/mL (N = 1,640).8 In the aftermath of Hoosick Falls, impacted community members voiced significant concern that the EPA’s recommended health advisory level for drinking water at the time (400 ng/L9) provided insufficient protection. In January 2016, the EPA recommended that the community not drink water with PFOA in excess of 100 ng/L,10 and in May 2016, after reviewing the existing body of PFOA and PFOS data,11 it revised its health advisory level for drinking water to 70 ng/L for the sum of PFOA and PFOS. In New Hampshire, the state conducted biomonitoring in Merrimack Village District, where another Saint-Gobain plant had contaminated local drinking water. The average PFOA serum levels among participants was 3.9 ng/mL (N = 217).
In 2014, it was discovered that a public water supply well in Pease, New Hampshire, was contaminated with PFOS, PFOA, and PFHxS as a result of the use of firefighting foams at Pease Tradeport, a former Air Force Base. Beginning in April 2015, the New Hampshire Department of Health and Human Services conducted blood testing for people in communities where PFAS had been found in drinking water above lifetime health advisory levels. Between April and October 2015, 1,578 members of the Pease Tradeport community had their blood tested for PFAS. Results of biomonitoring from all individuals in the study showed that the geometric mean of PFAS exceeded that of the general U.S. population for PFOS (Pease: 8.59 ng/mL, NHANES: 6.31 ng/mL), PFOA (Pease: 3.09 ng/mL, NHANES: 2.08 ng/mL), and PFHxS (Pease: 4.12 ng/mL, NHANES: 1.28 ng/mL).12
Communities in Bucks and Montgomery counties in Pennsylvania have detected PFOS in their drinking water from use of firefighting foams during military activities. In response to this water contamination, the state health department conducted biomonitoring for PFOS exposure. The average PFOS serum level in this community was 10.2 ng/mL (N = 235).13 A military base in Newburgh, New
___________________
8 See https://www.health.ny.gov/environmental/investigations/hoosick/docs/infosheetgrouplong.pdf (accessed June 17, 2022).
9 See https://www.epa.gov/sites/default/files/2015-12/documents/hoosickfallsmayorpfoa.pdf (accessed June 17, 2022).
10 See https://www.epa.gov/sites/default/files/2016-01/documents/epa_statement_on_private_wells_in_the_town_of_hoosick.pdf (accessed June 16, 2022).
11 See https://www.epa.gov/sites/default/files/2016-06/documents/drinkingwaterhealthadvisories_pfoa_pfos_updated_5.31.16.pdf (accessed June 16, 2022).
12 See https://www.dhhs.nh.gov/dphs/documents/pease-pfc-blood-testing.pdf (accessed June 16, 2022).
13 See https://www.health.pa.gov/topics/Documents/Environmental%20Health/PEATT%20Pilot%20Project%20Final%20Report%20April%2029%202019.pdf (accessed June 16, 2022).
York, also contaminated drinking water in that community, resulting in a median PFOS serum level of 16.3 ng/mL (N = 1,917).14
The primary manufacturer of PFOS, 3M, has also been implicated in drinking water contamination, in Decatur, Alabama. In a community study there, the median level was 39.3 ng/mL (N = 121) among participants with contaminated drinking water.15
Risk-Based Approaches
The most complex approaches for interpreting biomonitoring data are those that evaluate the risk associated with a biomonitoring result. Evaluation of risk may be desirable given the importance of the question of how risky a blood concentration is, as well as the fact that the descriptive approaches provide only relative information without assessing the risk to human health (NRC, 2006). Some exposure disease processes are thought to have a “threshold” or exposure level that needs to be exceeded before a response occurs, while others are thought to have a “nonthreshold” response such that there is no level at which no harm occurs. Examples of nonthreshold dose responses at a population level include lead, particulate matter, radon, and secondhand smoke. To set standards for nonthreshold effects, an acceptable risk needs to be determined (NRC, 2009). The standard reflects the expected daily intake associated with an acceptable risk for one or more adverse outcomes. Drinking water health advisories are risk-based standards that use dose estimates associated with daily consumption to predict long-term health effects. As a result, they should not be used to interpret biomonitoring results that represent an integration of multiple exposure sources over different periods depending on PFAS-specific half-lives (see Box 5-5).
___________________
14 See https://www.health.ny.gov/environmental/investigations/newburgh/docs/infosheetgroupresults.pdf (accessed June 16, 2022).
15 See https://www.atsdr.cdc.gov/hac/pha/Decatur/Perfluorochemical_Serum%20Sampling.pdf (accessed June 16, 2022).
There are several options for deriving serum or plasma concentrations that are consistent with health-based guidance values. In the most straightforward risk-based approach, epidemiologic studies with exposure-response relationships could be used to conduct biomonitoring-based risk assessment. As presented below, the German Human Biomonitoring Commission (HBM Commission) reviewed the epidemiologic literature to compile serum or plasma levels with and without observable effects. Contrasting patient serum PFAS levels with levels with or without effects in an epidemiologic study can facilitate understanding risk for the given response endpoint (Apel et al., 2020).
Another option is to derive serum or plasma concentrations that are consistent with health-based guidance values such as reference doses (RfDs) and tolerable daily intakes (TDIs), commonly referred to as biomonitoring equivalents (BEs) (Hays et al., 2008). Because these values are frequently based on animal experiments, some with no measure of serum concentrations, pharmacokinetic modeling is often used to translate a point of departure (e.g., the benchmark dose) into animal serum levels, which can be converted into BEs by adjusting for uncertainty factors. For this report, the committee focused on the human data to evaluate risk levels.
The committee reviewed the International Human Biomonitoring (i-HBM) Working Group dashboard to search for biomonitoring guidance values for PFAS and found that the only risk-based standards were the German HBM values for PFOS and PFOA. The committee also searched for RfDs based on human data in the tables in the Environmental Council of the States White Paper on Setting State PFAS Standards and in the authoritative reviews considered in the committee’s review of PFAS health effects (see Chapter 3). The committee found that only the European Food Safety Authority (EFSA) scientific opinion contained a risk-based value estimated in humans.
German HBM Values
The German HBM Commission develops human biomonitoring (HBM) values for interpretation of the concentrations of environmental chemicals measured in biological samples. These values, which are derived for the general population (including vulnerable subgroups) with chronic exposure, represent concentrations below which no observed risk of adverse health effects is expected (HBM-I) or above which adverse health effects are possible (HBM-II) (Schulz et al., 2011).
In 2021, the HBM Commission published HBM-I values for PFOS and PFOA in plasma, which is assumed to have concentrations similar to those of serum (Ehresman et al., 2007; Hölzer et al., 2021). To derive HBM-I values, the HBM Commission conducted a literature review for studies of the health effects of PFOS and PFOA. It then selected epidemiological studies and identified points of departure for various health effects for use in quantifying an association between exposure and critical effects. The determination of these points of departure varied depending on the methods of each study. Where epidemiological analyses were based on quantiles of exposure, the point of departure represented the lower limit of the quantile for which significantly increased risk was observed. For studies using continuous measures of exposure, points of departure were based on either benchmark dose-response modeling or a qualitative assessment of the effects and dose-response relationship. Health outcomes in the reviewed studies included fertility (time to pregnancy), pregnancy-induced hypertension and diabetes, reduced birthweight, serum cholesterol concentrations, serum uric acid concentrations, reduced antibody response to vaccination, pubertal development, thyroid metabolism, and onset of menopause. Once points of departure for each compound, study, and outcome had been selected, HBM-I values were selected in the low range of points of departure for both chemicals. The points of departure identified represented a wide range of exposure values. It was determined that the HBM-1 values were 2 ng/mL for plasma PFOA and 5 ng/mL for plasma PFOS. The HBM Commission considers these HBM-I values to be precautionary. Exceedance of these levels should not be interpreted as increasing risk, but may warrant efforts to reduce exposure (Hölzer et al., 2021).
The HBM Commission also established HBM-II values in 2021, based on epidemiological studies on PFOA or PFOS and adverse health outcomes, including reduced birthweight, developmental effects, reduced fertility, reduced antibody response to vaccination, increased cholesterol concentrations
(low-density lipoprotein [LDL] and total cholesterol), and type 2 diabetes. Because HBM-II values represent levels above which adverse health effects are possible, the points of departure for those values differed from those identified for HBM-I values. Where appropriate, benchmark dose-response modeling was used to determine a level for a given effect level. For studies with continuous exposure data in which benchmark dose-response modeling could not be performed, risk estimates from adjusted regression analyses were used. In the case of studies in which analyses were based on quantiles of exposure, the median value of the lowest quantile with a significant association with an adverse health outcome was used as the point of departure.
The points of departure chosen represent quantitatively defined changes (such as 5–10 percent, calculated with a confidence interval for a population) in certain target parameters (e.g., morbidity, laboratory values). In the evaluation of reduced birthweight, for example, the points of departure of 10 ng PFOA/mL and 15 ng PFOS/mL were determined from a meta-analysis that observed a reduction in birthweights by approximately 20 g per ng PFOA/mL and 20 g per ng PFOS/mL. Compiled points of departure were 3–10 ng/mL for PFOA and 1–30 ng/mL for PFOS. HBM-II values for plasma PFOA (10 ng/mL) and PFOS (20 ng/mL) were established as the mid- to high values in these ranges for the general population, excluding women of childbearing age. Lower values were derived for plasma PFOA (5 ng/mL) and PFOS (10 ng/mL) in women of childbearing age, mainly because studies indicated associations with developmental toxicity, reduced fertility, and increased incidence of gestational diabetes. However, the HBM Commission indicated that there is ample uncertainty around HBM-II values for PFOA and PFOS (Schümann et al., 2021).
European Food Safety Authority’s Human Point of Departure
In 2020, EFSA published a scientific opinion on the derivation of a tolerable weekly intake for the sum of four predominant PFAS: PFOA, PFOS, PFHxS, and PFNA. Following a review of the animal and epidemiological literature on adverse health effects of PFAS, immunological endpoints were considered the most robust and sensitive for risk assessment. An epidemiological study in German children was used as the critical study for deriving the health-based guidance value. In this study, children’s serum PFAS levels at 1 year of age were associated with lower antibody titers against diphtheria at a BMDL10 (the lower one-sided confidence limit of the benchmark dose for a 10 percent response) value of 17.5 ng/mL for the sum of PFOS, PFOA, PFHxS, and PFNA (Abraham et al., 2020). Physiologically based pharmacokinetic (PBPK) modeling was used to translate this value in children’s serum into a daily dose in their mothers, assuming that levels at 1 year of age in breastfed children reflect primarily the body burden acquired through placental and lactational transfer. To reach this BMDL10 value in children’s serum at the end of 12 months of breastfeeding, EFSA estimated that the maternal level at 35 years of age would need to be 6.9 ng/mL for the sum of the four PFAS, a level associated with an estimated maternal intake of 0.631 ng/kg body weight/day. Although EFSA did not specifically aim to determine acceptable serum PFAS levels, the 6.9 ng/mL serum concentration could be considered a serum level for women of reproductive age below which risk is negligible.
PFAS Concentrations That Could Inform Clinical Care: Findings and Recommendations
The HBM Commission has identified risk-based levels for two PFAS chemicals—PFOS and PFOA—while EFSA has established such values for the sum of PFOA, PFOS, PFHxS, and PFNA. No individual values are available for PFHxS and PFNA, and no values could be found for methylperfluorooctane sulfonamide (MeFOSAA), perfluorodecanoic acid (PFDA), and perfluoroundecanoic acid (PFUnDA). The lowest PFAS risk-based level is 2 ng/mL (HBM-I for PFOA), and the highest PFAS risk level is 20 ng/mL (HBM-II for PFOS in the general population), demonstrating that risks are unexpected below 2 ng/mL and that the risk of PFAS-associated effects at the population level is increased at 20 ng/mL. The risk-based levels for sensitive populations fall between 2 ng/mL and 20 ng/mL (see Figure 5-4).
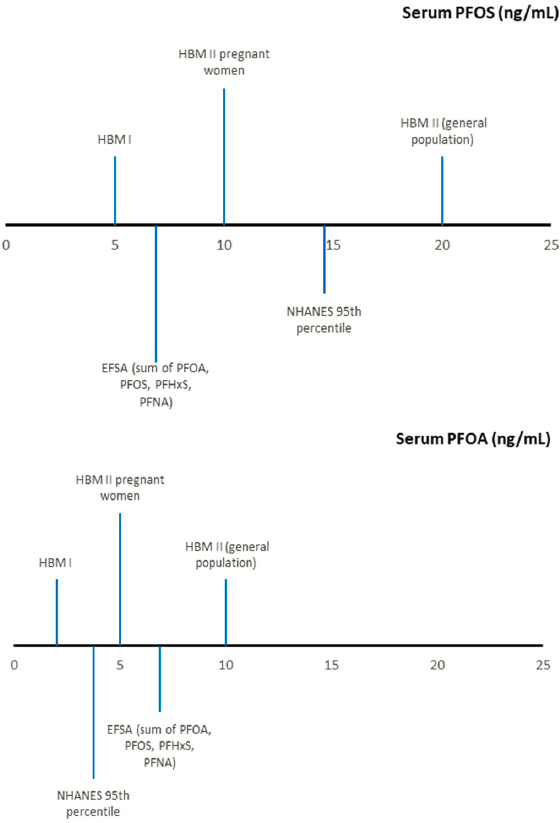
NOTES: Human biomonitoring (HBM) values are risk-based values derived from a compilation of epidemiological studies and represent levels at which no effect is expected (HBM-I) and above which effects are possible (HBM-II). The European Food Safety Authority (EFSA) risk-based value is a maternal serum PFAS concentration derived from an epidemiological study of children’s prenatal and postnatal PFAS exposure and decreased antibody response to vaccines; maternal levels below this value are expected to have negligible impact on children’s response to vaccines. The National Health and Nutrition Examination Survey (NHANES) reference-based serum concentration represents the 95th percentile of serum levels in a representative sample of the population aged 12 and older. PFHxS = perfluorohexanesulfonic acid; PFNA = perfluorononanoic acid; PFOA = perfluorooctanoic acid; PFOS = perfluorooctanesulfonic acid.
The committee used weighted data from NHANES to estimate PFAS exposures in the U.S. population. The HBM-I value, or the value below which effects are not expected, for PFOA (2 ng/mL) is the 73rd percentile, and the corresponding value for PFOS (5 ng/mL) is the 57th percentile. The HBM-II value, or the value above which effects may be expected for PFOA (10 ng/mL) is the 99th percentile and for PFOS (20 ng/mL) is the 98th percentile. For women of childbearing age (15–49), the HBM-II values for pregnant women for PFOS and PFOA are the 99th and 98th percentile, respectively. The committee observed that 25 percent of the U.S. population is exposed to PFAS above the EFSA point of departure (6.9 ng/mL sum of PFOA, PFOS, PFHxS, and PFNA).
Given the large number of PFAS and the fact that all humans are exposed to mixtures of PFAS, an approach that accounts for mixtures of PFAS would better inform clinical care than do single-chemical
exposure values. Because the toxicities of different PFAS may not be equal, an approach using potency factors (e.g., dioxins) may be optimal for determining how a mixture of PFAS may exert its toxic effects. However, EFSA did not identify studies comparing the dose-response curves for different PFAS that would allow derivation of their potencies, and interspecies and sex differences also would complicate that effort. Thus EFSA assumed equal potencies for the four selected PFAS, which in humans share half-lives on the order of years. To facilitate easier comparison with estimated exposure, this calculation was performed on a weight rather than a molar basis. Bil and colleagues (2021) recently developed relative potency factors for several PFAS, which when applied result in the sum of PFOA equivalents in a mixture. Overall, the approach entails uncertainties, as the potency factors are derived from animal studies using mainly liver endpoints, which may correlate with effects in humans but to what degree is unknown. The additive approach used by EFSA has advantages. It is simple to apply and has been used in other efforts to regulate exposures to mixtures.16 Also, there is evidence that many PFAS have similar toxic effects (Kwiatkowski et al., 2020). The committee believes the additive approach could be applied to the PFAS currently measured in the NHANES (MeFOSAA, PFHxS, PFOA [linear and branched isomers], PFDA, PFUnDA, PFOS [linear and branched isomers], and PFNA). Applying this approach of weight-based dose additivity, and using the HBM Commission’s values, the committee makes the following recommendations (see Figure 5-5):
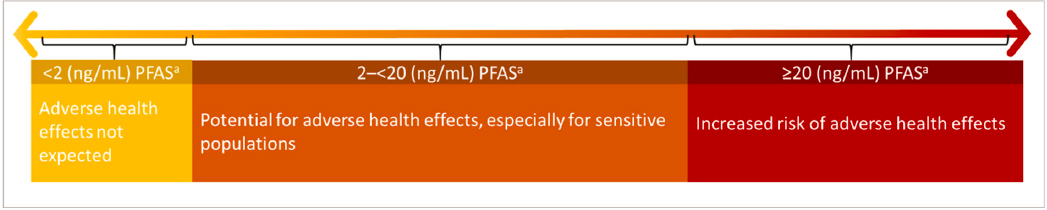
Recommendation 5-3: Clinicians should use serum or plasma concentrations of the sum of PFAS* to inform clinical care of exposed patients, using the following guidelines for interpretation:
- Adverse health effects related to PFAS exposure are not expected at less than 2 nanograms per milliliter (ng/mL).
- There is a potential for adverse effects, especially in sensitive populations, between 2 and 20 ng/mL.
- There is an increased risk of adverse effects above 20 ng/mL.
* Simple additive sum of MeFOSAA, PFHxS, PFOA (linear and branched isomers), PFDA, PFUnDA, PFOS (linear and branched isomers) and PFNA in serum or plasma. Caution is warranted when using capillary blood measurements as levels may differ from serum or plasma levels.
The committee estimated that for the sum of PFAS in the NHANES, 2 ng/mL corresponds to the 2nd percentile, and 20 ng/mL corresponds to the 91st percentile, indicating that 89 percent of the U.S. population falls in the orange area in Figure 5-5, and 9 percent in the red area. Choosing cutoffs, as the committee has done, reflects ethical decisions and risks overstating or understating the risk of PFAS exposure given the uncertainty of the available information. Values suggested herein were derived from epidemiological studies evaluating associations at the population level, and the relevance of these values to interpret risk in individuals is uncertain. Also, these values were derived in part from studies in vulnerable populations (e.g., children, pregnant women), and so should account for many sensitive populations, but they may not protect all populations. Moreover, the assumption of weight-based dose additivity is likely an oversimplification. The molar sum may be more appropriate if the equal potency of all PFAS is assumed, and future research to produce toxic equivalency data or identify relevant potency factors could help refine the calculation (Bil et al., 2021). Furthermore, regardless of how the dose is calculated, there may not even be a level of PFAS exposure without some biological effect. Still, the increased risk from low levels of exposure is better addressed through population-health efforts than through individual action. The cutoff levels should be updated as more information becomes available.
___________________
16 See https://www.epa.gov/sites/default/files/2014-11/documents/chem_mix_1986.pdf (accessed June 8, 2022).
The committee acknowledges that, in many communities, a large percentage of the population may have exposures to PFAS that would be considered high using the cutoffs presented here. This does not mean that health effects will occur, but likely relates to increased risk. More reference- and risk-based values are needed for other PFAS and other biological matrices, but given the expansiveness of the class, approaches based on relative potency factors may be more successful than developing risk-based levels for each PFAS in addressing this gap.
The committee also acknowledges the existence of data gaps with respect to reference populations. Appropriate PFAS reference populations may not be available for vulnerable populations such as pregnant people and young children, as pregnant people are included in low numbers in NHANES, and children younger than 12 are not routinely included in the publicly available data. Therefore, the committee makes the following recommendation:
Recommendation 5-4: The National Health and Nutrition Examination Survey should begin collecting and sharing more data on children younger than 12 years of age and pregnant people to generate reference populations for those groups.
CONCLUSION
Determining options and considerations to guide decision making for PFAS testing and PFAS concentrations that could inform clinical care of exposed patients will be beneficial in helping communities identify those who have elevated exposure to those chemicals. Testing for PFAS offers an opportunity to identify those who may be at increased risk of certain health outcomes. The recommendations in this chapter could expand PFAS testing among people already integrated into the health system (i.e., those with reliable insurance or other health care coverage). The committee acknowledges, however, that PFAS testing is expensive. Race, age, and other social and demographic characteristics already have disadvantaged many patients from accessing clinical preventive services. That disadvantage would be compounded by the expansion of PFAS testing services, as those services should be linked to counseling on steps for mitigating exposure and its impacts. Therefore, encouraging testing primarily among people with relatively stable access to care could have the unintended effect of aggravating disparities in exposure to PFAS, a severe disadvantage of encouraging testing without a funded, national PFAS testing program.
REFERENCES
Abraham, K., H. Mielke, H. Fromme, W. Völkel, J. Menzel, M. Peiser, F. Zepp, S. N. Willich, and C. Weikert. 2020. Internal exposure to perfluoroalkyl substances (PFASs) and biological markers in 101 healthy 1-year-old children: Associations between levels of perfluorooctanoic acid (PFOA)
and vaccine response. Archives of Toxicology 94(6):2131–2147. https://doi.org/10.1007/s00204-020-02715-4.
Adams, C., P. Brown, R. Morello-Frosch, J. G. Brody, R. Rudel, A. Zota, S. Dunagan, J. Tovar, and S. Pattonand. 2011. Disentangling the exposure experience: The roles of community context and report-back of environmental exposure data. Journal of Health and Social Behavior 52(2):180–196. https://doi.org/10.1177/0022146510395593.
Altman, R. G., R. Morello-Frosch, J. G. Brody, R. Rudel, P. Brown, and M. Averick. 2008. Pollution comes home and gets personal: Women’s experience of household chemical exposure. Journal of Health and Social Behavior 49(4):417–435. https://doi.org/10.1177/002214650804900404.
Alves, A., G. Jacobs, G. Vanermen, A. Covaci, and S. Voorspoels. 2015. New approach for assessing human perfluoroalkyl exposure via hair. Talanta 144:574–583. https://doi.org/10.1016/j.talanta.2015.07.009.
Apel, P., C. Rousselle, R. Lange, F. Sissoko, M. Kolossa-Gehring, and E. Ougier. 2020. Human biomonitoring initiative (HBM4EU)—Strategy to derive human biomonitoring guidance values (HBM-GVs) for health risk assessment. International Journal of Hygiene and Environmental Health 230:113622. https://doi.org/10.1016/j.ijheh.2020.113622.
Aro, R., U. Eriksson, A. Kärrman, and L. W. Y. Yeung. 2021. Organofluorine mass balance analysis of whole blood samples in relation to gender and age. Environmental Science & Technology 55(19):13142–13151. https://doi.org/10.1021/acs.est.1c04031.
Aro, R., U. Eriksson, A. Kärrman, K. Jakobsson, and L. W. Y. Yeung. 2022. Extractable organofluorine analysis: A way to screen for elevated per- and polyfluoroalkyl substance contamination in humans? Environment International 159:107035. https://doi.org/10.1016/j.envint.2021.107035.
Baker, B., V. Cassano, and C. Murray. 2018. Arsenic exposure, asessment, toxicity, diagnosis, and management: Guidance for occupational and environmental physicians. Journal of Occupational and Environmental Medicine 60(12):e634–e639. https://acoem.org/acoem/media/NewsLibrary/Arsenic_Exposure_Assessment_Toxicity_Diagnosis.pdf (accessed June 17, 2022).
Barr, D. B., K. Kannan, Y. Cui, L. Merrill, L. Petrick, J. Meeker, T. Fennell, and E. Faustman. 2021. The use of dried blood spots for characterizing children’s exposure to organic environmental chemicals. Environmental Research 195:110796. https://doi.org/10.1016/j.envres.2021.110796.
Barry, M. J., and S. Edgman-Levitan. 2012. Shared decision making—pinnacle of patient-centered care. New England Journal of Medicine. 366(9):780–781. https://doi.org/10.1056/NEJMp1109283.
Bil, W., M. Zeilmaker, S. Fragki, J. Lijzen, E. Verbruggen, and B. Bokkers. 2021. Risk assessment of per‐and polyfluoroalkyl substance mixtures: A relative potency factor approach. Environmental Toxicology and Chemistry 40(3):859–870.
Brennan, N. M., A. T. Evans, M. K. Fritz, S. A. Peak, and H. von Holst. 2021. Trends in the regulation of per- and polyfluoroalkyl substances (PFAS): A scoping review. International Journal of Environmental Research and Public Health 18(20):10900. https://doi.org/10.3390/ijerph182010900.
Brody, J. G., S. C. Dunagan, R. Morello-Frosch, P. Brown, S. Patton, and R. A. Rudel. 2014. Reporting individual results for biomonitoring and environmental exposures: Lessons learned from environmental communication case studies. Environmental Health 13:40. https://doi.org/10.1186/1476-069x-13-40.
Brody, J. G., P. M. Cirillo, K. E. Boronow, L. Havas, M. Plumb, H. P. Susmann, K. Z. Gajos, and B. A. Cohn. 2021. Outcomes from returning individual versus only study-wide biomonitoring results in an environmental exposure study using the Digital Exposure Report-Back Interface (DERBI). Enviornmental Health Perspectives 129(11):117005. https://doi.org/10.1289/ehp9072.
Calafat, A. M., K. Kato, K. Hubbard, T. Jia, J. C. Botelho, and L. Y. Wong. 2019. Legacy and alternative per- and polyfluoroalkyl substances in the U.S. general population: Paired serum-urine data from the 2013-2014 National Health and Nutrition Examination Survey. Environment International 131:105048. https://doi.org/10.1016/j.envint.2019.105048.
CDC (Centers for Disease Control and Prevention). 2021. Fourth national report on human exposure to environmental chemicals, updated tables. Atlanta, GA: U.S. Department of Health and Human Services.
CDC. 2022. National report on human exposure to environmental chemicals. Atlanta, GA: U.S. Department of Health and Human Services. https://www.cdc.gov/exposurereport/overview_ner.html (accessed June 28, 2022).
Charles, C., A. Gafni, and T. Whelan. 1997. Shared decision-making in the medical encounter: What does it mean? (or it takes at least two to tango). Sociological Science in Medicine 44:681–692. https://doi.org.10.1016/s0277-9536(96)00221-3.
Clark, D., and TCS (The Chemours Company). 2021, March 17. Letter to EPA, Office of Pollution Prevention and Toxics regarding propanoic acid, 2,3,3,3-tetrafluoro-2-(1,1,2,2,3,3,3-heptafluoropropoxy)-CAS RN 13252-13-6 (also known as HFPO-DA). https://www.documentcloud.org/documents/21093350-chemours-tsca-fyi-letter-3-17-2021-v2 (accessed June 16, 2022).
Ehresman, D. J., J. W. Froehlich, G. W. Olsen, S-C. Chang, and J. L. Butenhoff. 2007. Comparison of human whole blood, plasma, and serum matrices for the determination of perfluorooctanesulfonate (PFOS), perfluorooctanoate (PFOA), and other fluorochemicals. Environmental Research 103(2):176–184. https://doi.org/10.1016/j.envres.2006.06.008.
Emmett, E. A., H. Zhang, F. S. Shofer, N. Rodway, C. Desai, D. Freeman, and M. Hufford. 2009. Development and successful application of a “Community-First” communication model for community-based environmental health research. Journal of Occupational and Environmental Medicine 51(2):146–156. https://doi.org/10.1097/JOM.0b013e3181965d9b.
FDA (U.S. Food and Drug Administration). 2018. Bioanalytical method validation guidance for industry. Washington, DC: U.S. Department of Health and Human Services.
Freeman, J. D., L. M. Rosman, J. D. Ratcliff, P. T. Strickland, D. R. Graham, and E. K. Silbergeld. 2018. State of the science in dried blood spots. Clinical Chemistry 64(4):656–679. https://doi.org/10.1373/clinchem.2017.275966.
Frisbee, S. J., A. P. Brooks, Jr., A. Maher, P. Flensborg, S. Arnold, T. Fletcher, K. Steenland, A. Shankar, S. S. Knox, C. Pollard, J. A. Halverson, V. M. Vieira, C. Jin, K. M. Leyden, and A. M. Ducatman. 2009. The C-8 health project: Design, methods, and participants. Environmental Health Perspectives 117(12):1873–1882. https://doi.org/10.1289/ehp.0800379.
Giannini, C. M., R. L. Herrick, J. M. Buckholz, A. R. Daniels, F. M. Biro, and S. M. Pinney. 2018. Comprehension and perceptions of study participants upon receiving perfluoroalkyl substance exposure biomarker results. International Journal of Hygiene and Environmental Health 221(7):1040–1046. https://doi.org/10.1016/j.ijheh.2018.07.005.
Gross, R. S., A. Ghassabian, S. Vandyousefi, M. J. Messito, C. Gao, K. Kannan, and L. Trasande. 2020. Persistent organic pollutants exposure in newborn dried blood spots and infant weight status: A case-control study of low-income Hispanic mother-infant pairs. Environmental Pollution 267:115427. https://doi.org/10.1016/j.envpol.2020.115427.
Guo, P., T. Furnary, V. Vasiliou, Q. Yan, K. Nyhan, D. P. Jones, C. H. Johnson, and Z. Liew. 2022. Non-targeted metabolomics and associations with per- and polyfluoroalkyl substances (PFAS) exposure in humans: A scoping review. Environment International 162(2022):107159.
Harclerode, M., S. Baryluk, H. Lanza, and J. Frangos. 2021. Preparing for effective, adaptive risk communication about per- and polyfluoroalkyl substances in drinking water. AWWA Water Science 3(5):e1236. https://doi.org/10.1002/aws2.1236.
Hays, S., L. Aylward, J. Lakind, M. Bartels, H. Barton, P. Boogaard, C. Brunk, S. Dizio, M. Dourson, D. Goldstein, J. Lipscomb, M Kilpatrick, D. Krewski, K Krishnan, M. Nordberg, M. Okino, Y-M. Tan, C. Viau, and J. Yager. 2008. Guidelines for the derivation of biomonitoring equivalents: Report from the Biomonitoring Equivalents Expert Workshop. Regulatory Toxicology and Pharmacology 51:S4–S15.
Hernick, A. D., M. Kathryn Brown, S. M. Pinney, F. M. Biro, K. M. Ball, and R. L. Bornschein. 2011. Sharing unexpected biomarker results with study participants. Environmental Health Perspectives 119(1):1–5. https://doi.org/10.1289/ehp.1001988.
Hölzer, J., H. Lilienthal, and M. Schümann. 2021. Human biomonitoring (HBM)-I values for perfluorooctanoic acid (PFOA) and perfluorooctane sulfonic acid (PFOS)—Description, derivation and discussion. Regulatory Toxicology and Pharmacology 121:104862. https://doi.org/10.1016/j.yrtph.2021.104862.
IOM (Institute of Medicine). 2001. Crossing the quality chasm: A new health system for the 21st century. Washington, DC: National Academy Press. https://doi.org/10.17226/10027.
Kannan, K., A. Stathis, M. J. Mazzella, S. S. Andra, D. Boyd Barr, S. S. Hecht, L. S. Merrill, A. L. Galusha, and P. J. Parsons. 2021. Quality assurance and harmonization for targeted biomonitoring measurements of environmental organic chemicals across the Children’s Health Exposure Analysis Resource laboratory network. International Journal of Hygiene and Environmental Health 234:113741.
Kato, K., L. Y. Wong, A. Chen, C. Dunbar, G. M. Webster, B. P. Lanphear, and A. M. Calafat. 2014. Changes in serum concentrations of maternal poly- and perfluoroalkyl substances over the course of pregnancy and predictors of exposure in a multiethnic cohort of Cincinnati, Ohio pregnant women during 2003–2006. Environmental Science and Technology 48(16):9600–9608. https://doi.org/10.1021/es501811k.
Kwiatkowski, C. F., D. Q. Andrews, L. S. Birnbaum, T. A. Bruton, J. C. DeWitt, D. R. U. Knappe, M. V. Maffini, M. F. Miller, K. E. Pelch, A. Reade, A. Soehl, X. Trier, M. Venier, C. C. Wagner, Z. Wang, and A. Blum. 2020. Scientific basis for managing PFAS as a chemical class. Environmental Science & Technology Letters 7(8):532–543. https://doi.org/10.1021/acs.estlett.0c00255.
LaKind, J. S., M-A. Verner, R. D. Rogers, H. Goeden, D. Q. Naiman, S. A. Marchitti, G. M. Lehmann, E. P. Hines, and S. E. Fenton. 2022. Current breast milk PFAS levels in the United States and Canada: After all this time, why don’t we know more? Environmental Health Perspectives 130(2):025002.
Latshaw, M. W., R. Degeberg, S. Sutaria Patel, B. Rhodes, E. King, S. Chaudhuri, and J. Nassif. 2017. Advancing environmental health surveillance in the US through a national human biomonitoring network. International Journal of Hygiene and Environmental Health 220(2):98–102.
Lu, S., and S. M. Bartell. 2020. Serum PFAS calculator for adults, web-based software, version 1.2. https://www.ics.uci.edu/~sbartell/pfascalc.html (accessed June 28, 2022).
Ma, W., K. Kannan, Q. Wu, E. M. Bell, C. M. Druschel, M. Caggana, and K. M. Aldous. 2013. Analysis of polyfluoroalkyl substances and bisphenol A in dried blood spots by liquid chromatography tandem mass spectrometry. Analytical and Bioanalytical Chemistry 405(12):4127–4138. https://doi.org/10.1007/s00216-013-6787-3.
NASEM (National Academies of Sciences, Engineering, and Medicine). 2018a. Feasibility of addressing environmental exposure questions using department of defense biorepositories: Proceedings of a workshop—in brief. Washington, DC: The National Academies Press. https://doi.org/10.17226/25287.
NASEM. 2018b. Returning individual research results to participants: Guidance for a new research paradigm. Washington, DC: The National Academies Press. https://doi.org/10.17226/25094.
NRC (National Research Council). 1987. Biological markers in environmental health research. Environmental Health Perspectives 74:3–9. https://doi.org/10.1289/ehp.74-1474499.
NRC. 2006. Human biomonitoring for environmental chemicals. Washington, DC: The National Academies Press. https://doi.org/10.17226/11700.
NRC. 2009. Science and decisions: Advancing risk assessment. Washington, DC: The National Academies Press. https://doi.org/10.17226/12209.
Ohayon, J. L., E. Cousins, P. Brown, R. Morello-Frosch, and J. G. Brody. 2017. Researcher and institutional review board perspectives on the benefits and challenges of reporting back
biomonitoring and environmental exposure results. Environmental Research 153:140–149. doi: https://doi.org/10.1016/j.envres.2016.12.003.
Perovich, L. J., J. L. Ohayon, E. M. Cousins, R. Morello-Frosch, P. Brown, G. Adamkiewicz, and J. G. Brody. 2018. Reporting to parents on children’s exposures to asthma triggers in low-income and public housing, an interview-based case study of ethics, environmental literacy, individual action, and public health benefits. Environmental Health: A Global Access Science Source 17(1):48. https://doi.org/10.1186/s12940-018-0395-9.
Poothong, S., C. Thomsen, J. A. Padilla-Sanchez, E. Papadopoulou, and L. S. Haug. 2017. Distribution of novel and well-known poly- and perfluoroalkyl substances (PFASs) in human serum, plasma, and whole blood. Environmental Science & Technology 51(22):13388–13396. https://doi.org/10.1021/acs.est.7b03299.
Ramirez-Andreotta, M. D., J. G. Brody, N. Lothrop, M. Loh, P. I. Beamer, and P. Brown. 2016. Improving environmental health literacy and justice through environmental exposure results communication. International Journal of Environmental Research and Public Health 13(7):690. https://doi.org/10.3390/ijerph13070690.
Schulz, C., M. Wilhelm, U. Heudorf, and M. Kolossa-Gehring. 2011. Update of the reference and HBM values derived by the German Human Biomonitoring Commission. International Journal of Hygiene and Environmental Health 215(1):26–35. https://doi.org/10.1016/j.ijheh.2011.06.007.
Schümann, M., H. Lilienthal, and J. Hölzer. 2021. Human biomonitoring (HBM)-II values for perfluorooctanoic acid (PFOA) and perfluorooctane sulfonic acid (PFOS)—Description, derivation and discussion. Regulatory Toxicology and Pharmacology 121:104868. https://doi.org/10.1016/j.yrtph.2021.104868.
SWGTOX (Scientific Working Group for Forensic Toxicology). 2013. Scientific Working Group for Forensic Toxicology (SWGTOX) standard practices for method validation in forensic toxicology. Journal of Analytical Toxicology 37(7):452–474.
Tomsho, K. S., C. Schollaert, T. Aguilar, R. Bongiovanni, M. Alvarez, M. K. Scammell, and G. Adamkiewicz. 2019. A mixed methods evaluation of sharing air pollution results with study participants via report-back communication. International Journal of Environmental Research and Public Health 16(21):4183. https://doi.org/10.3390/ijerph16214183.
Watson, C. V., M. Lewin, A. Ragin-Wilson, R. Jones, J. M. Jarrett, K. Wallon, C. Ward, N. Hilliard, and E. Irvin-Barnwell. 2020. Characterization of trace elements exposure in pregnant women in the United States, NHANES 1999–2016. Environmental Research 183:109208. https://doi.org/10.1016/j.envres.2020.109208.
Ye, X., K. Kato, L. Y. Wong, T. Jia, A. Kalathil, J. Latremouille, and A. M. Calafat. 2018. Per- and polyfluoroalkyl substances in sera from children 3 to 11 years of age participating in the National Health and Nutrition Examination Survey 2013–2014. International Journal of Hygiene and Environmental Health 221(1):9–16. https://doi.org/10.1016/j.ijheh.2017.09.011.
Yeung, E. H., E. M. Bell, R. Sundaram, A. Ghassabian, W. Ma, K. Kannan, and G. M. Louis. 2019. Examining endocrine disruptors measured in newborn dried blood spots and early childhood growth in a prospective cohort. Obesity (Silver Spring, MD) 27(1):145–151. https://doi.org/10.1002/oby.22332.
Zheng, G., E. Schreder, J. C. Dempsey, N. Uding, V. Chu, G. Andres, S. Sathyanarayana, and A. Salamova. 2021. Per- and polyfluoroalkyl substances (PFAS) in breast milk: Concerning trends for current-use PFAS. Environmental Science & Technology 55(11):7510–7520.


