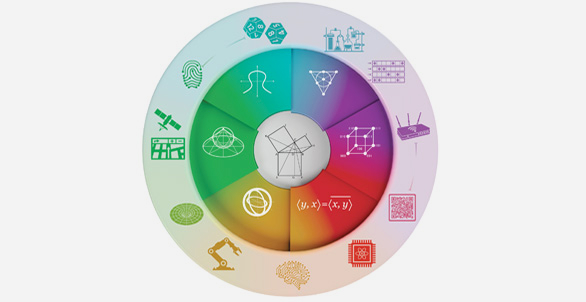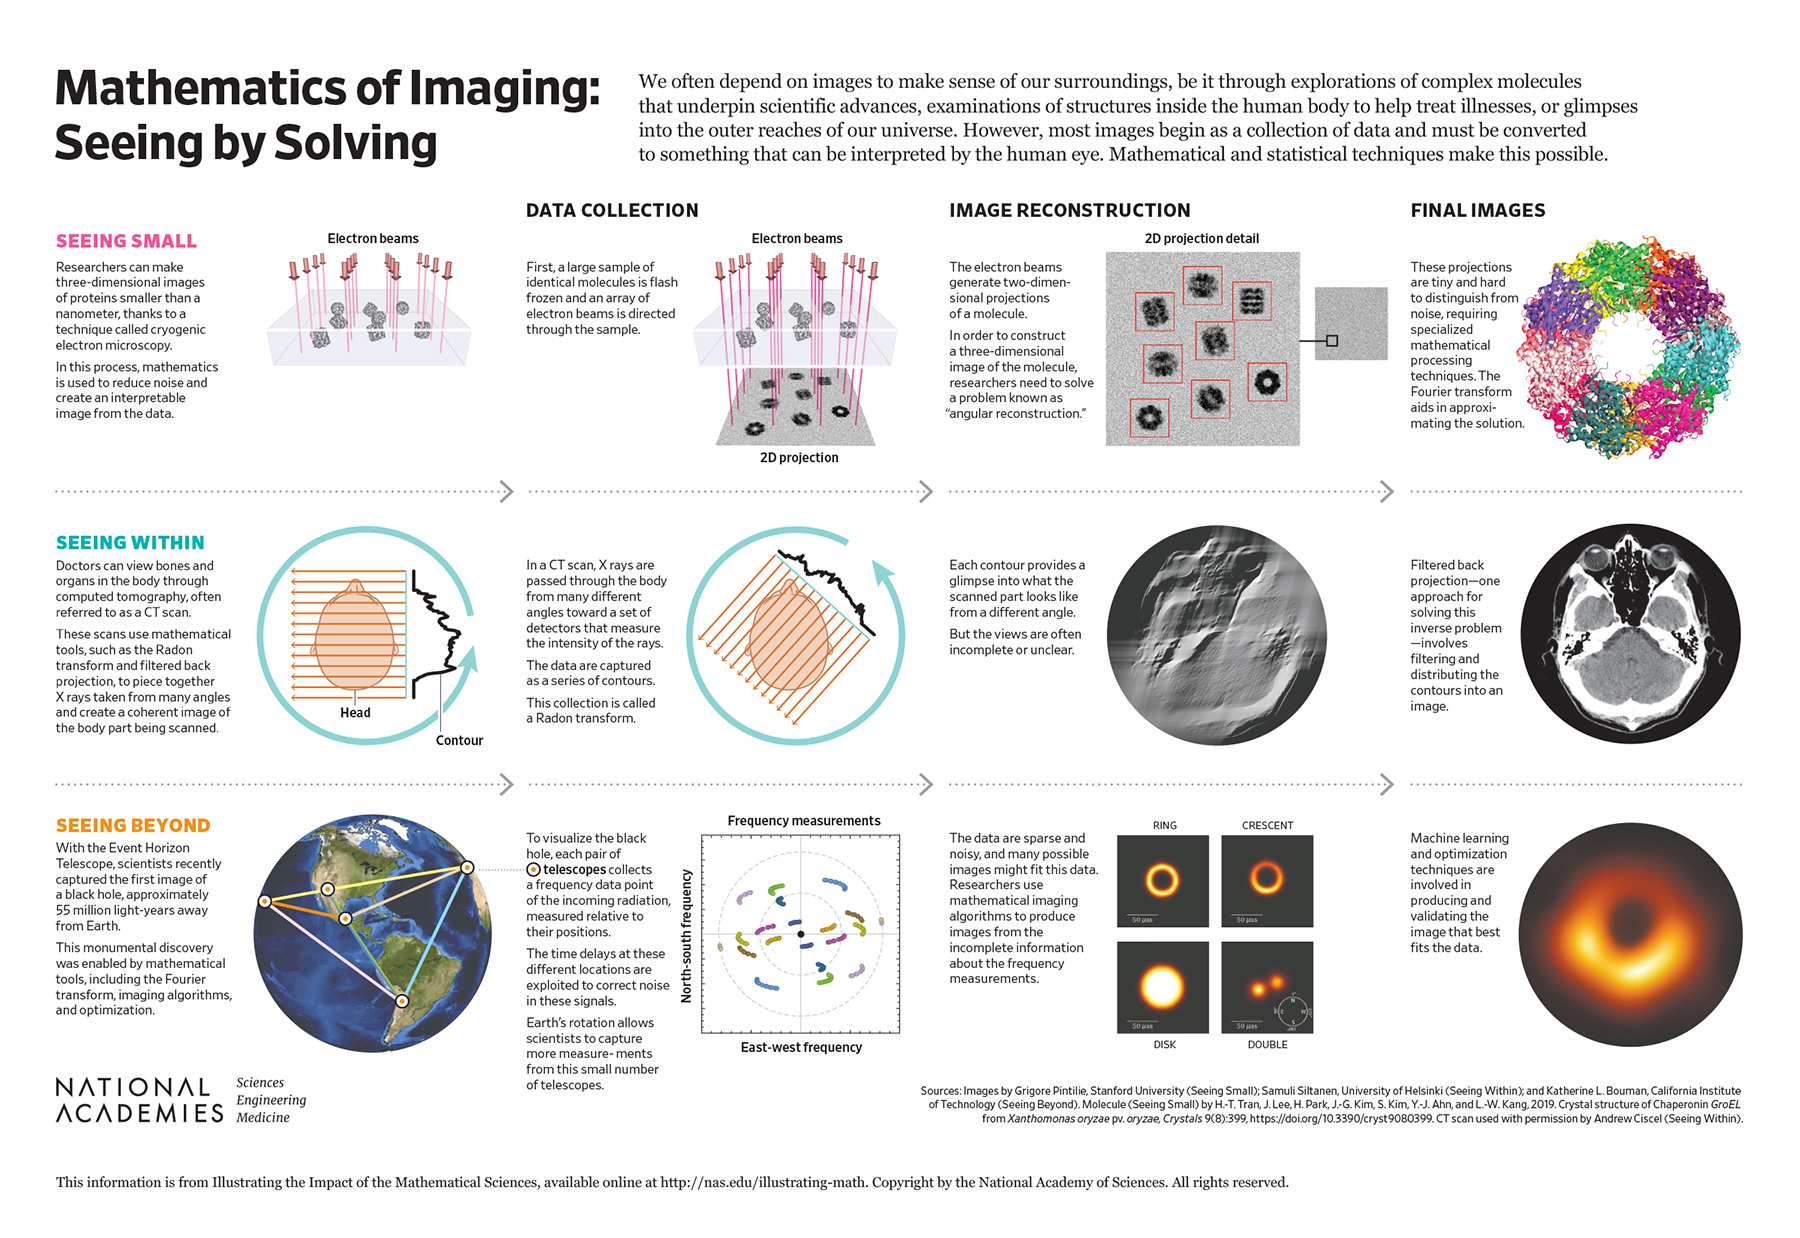
Mathematics of Imaging: Seeing by Solving
Scientists and engineers have created incredible tools that allow us to see in new ways—electron microscopes, magnetic resonance imaging (MRI), computed tomography (CT) scanners, and large telescopic arrays. What do all these tools and machines have in common? Mathematics and statistics—including the Fourier transform (developed in the early 19th century), the modern theory of compressed sensing (developed early in the 21st century), statistical theory, and data analysis—are needed to turn these data into images that we can see and use.
The impact of discrete and continuous transforms, such as the Fourier transform, has been tremendous. One reason for this is that in some applications (such as image processing), using the transformed versions of functions makes the math work a lot easier, better, and faster. Apart from Fourier transforms, many other transforms can be generated that give similar advantages.
Let’s take a closer look at how these mathematical tools give us new views of our universe, from small to large, from molecular systems to brains and bones, and on to black holes and gravitational waves.
Medical Imaging
X rays are high-energy photon beams that pass through most substances but not through high-density solids such as bone. They were discovered accidentally at the end of the 19th century by Wilhelm Conrad Röntgen, who was experimenting with cathode rays. The medical applications were recognized immediately, and X-ray analysis is a building block of some modern medical imaging systems.
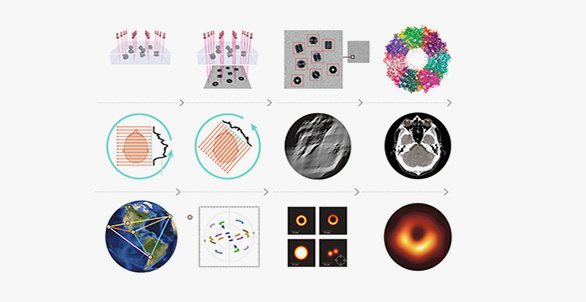
In CT, the information from X-ray scans at multiple angles is mathematically integrated to create an image. A beam is passed that gives density measurements of two-dimensional (2D) slices of a three-dimensional (3D) object, like a brain. To get a full picture of the brain slice, the beam is rotated in the same plane as the slice, and at each angle, a density measurement is obtained. The collection of all these individual density measurements can be represented by a contour, as shown in the graphic. The problem is how to reconstruct the slices, and then the actual 3D brain image, from these measurements. This reconstruction problem is an example of an inverse problem: from indirectly measured data, finding the object that produced the data.
In the case of CT scans, the mathematical problem involves inverting the Radon transform. The “transform” refers to how the data is generated—that is, the density measurements produced by passing a beam through that object from many different angles. Johann Radon developed this transform in 1917, and showed that the inverse problem could be solved using another mathematical tool, the Fourier transform. Although there is an exact mathematical formula that solves this theoretical inverse problem, in practice the reconstruction requires making some approximations. For example, it is not possible to collect the densities at all of the infinite number of possible rotations—and so the sample data will be incomplete. The image actually reproduced in reconstruction will be blurred instead of sharp. Fortunately, a further application of Fourier transform techniques can remove this blurring. This is a technique that applies to many other inverse or reconstruction problems.
MRI scans do not use X rays to generate data about an image. Instead, powerful magnets cause subatomic particles to change their magnetic orientation; in reverting to their original state, they radiate energy. It takes some time to create and detect these signals, which makes it hard to get a clear MRI image from a patient who is not perfectly still. The reconstruction, or inverse, problem is different from CT reconstruction but still relies upon the Fourier transform.
Modern MRI has been revolutionized by the theory of compressed sensing, developed by Emmanuel Candès, Justin Romberg, Terence Tao, and David Donoho in the early 2000s. This mathematical innovation allows high-quality images to be captured more quickly because fewer data points are needed. In 2017, the U.S. Food and Drug Administration approved new MRI devices that dramatically speed up important MRI applications. Pediatric MRI scan times were reduced in representative tasks from 8 minutes to 70 seconds, while preserving the diagnostic quality of images.
Today, compressed sensing has wide applications even beyond medicine—it plays an important role in the reconstruction of images of cracks in mechanical equipment, in revealing ancient texts, in capturing images through electron microscopy, and in measuring astronomical phenomena, among many others.
Electron Microscopy
Electron microscopy visualization allows us to see objects that are too small for magnification from a traditional microscope. In the past few years, near-atomic resolution has been achieved through revolutionary advances in hardware detectors coupled with innovative mathematical tools in statistics, Fourier analysis, optimization, and linear algebra.
In cryogenic electron microscopy (cryo-EM), the mathematical reconstruction problem is a lot like the Radon transform inverse problem of CT, with a twist. In cryo-EM, the data collected from the flash freezing of many identical molecules involve their 2D projections, similar to recording their shadows on a wall. The twist is this: unlike CT data, where the machine is rotating and recording its orientations with respect to the fixed object, the frozen molecules have been detected at unknown orientations. The 2D projections are recorded without knowing the position of these objects relative to the detector. The inverse problem asks how to find the object from the data collected on the projections, absent information about the directions. To solve this problem, geometric ideas play a big role. In order to reconstruct the 3D object, the “angular reconstitution” problem (finding the directions) has to be solved. Mathematical tools, like Fourier transform methods, help solve these reconstruction problems.
Gravitational Waves, Black Holes, and Radio Astronomy
In April 2019, Katie Bouman and the Event Horizon team gave the world its first glimpse of a black hole, an image painstakingly reconstructed from hundreds of terabytes of data collected from several interconnected special telescopes around the world. The joining of these specialized telescopes, linked through precise timing of atomic clocks, is a system known as Very Long Baseline Interferometry. This linkage creates the “Earth-size telescope” required to achieve the desired resolution for an object as far away as a black hole. Each pair of telescopes captures a single measurement at a single point in time from the light source. This measurement, or spatial frequency, is the Fourier transform of the incoming radiation relative to the projected baseline (line of sight) between the two telescopes. To augment the sparsity of the data that can be collected in this way, scientists use the rotation of Earth. Measuring how these projected baselines change in time produces short elliptical paths of data, as the graphic shows. The data obtained is still sparse (from very few telescopes) and noisy (from the atmosphere and other sources of corruption). We now arrive at our mathematical problem: how to reconstruct the image that generated this sparse and exceedingly noisy data. This large-scale inverse problem was solved using a classical technique involving the Fourier transform for image reconstruction and regularized maximum likelihood, a modern method using tools from probability and statistics.