
12
Prevalence of Attention Deficit Hyperactivity Disorder
Attention deficit hyperactivity disorder (ADHD) is important for the Social Security Administration (SSA) and related stakeholders because it tops the list of mental health diagnoses for Supplemental Security Income (SSI) determinations, allowances, and recipients (see Chapter 3) in the under-18 population. While the number of recipients for ADHD increased by more than 60 percent during the 2004–2013 decade, the percent of recipients for ADHD among all recipients for the 10 major childhood mental disorders increased more modestly, from 26 to 34 percent, and plateaued in the final 3 years of the decade. Because allowances did not increase over the decade, the conclusion must be that the average duration of time spent as a child recipient of SSI benefits for ADHD has increased, and the corollary is that allowances and reentries exceeded suspensions, terminations, and age-18 transitions on an annual basis. Another inference from the data in Chapter 3 is that growth in ADHD SSI benefits as a percentage of all SSI benefits may be reaching a steady state or even peaking as the result of gradual restriction of SSI ADHD allowances.
Questions have been raised publicly about the validity of ADHD as a major reason for the increases in SSI benefits for mental health conditions in children. While the large ADHD contribution is a fact, it should be noted that ADHD allowances usually include a comorbid condition that may have a substantial effect on functional impairment in the SSI disability program. ADHD may be listed as the primary diagnosis, but it is often not the sole reason for functional impairment (GAO, 2012).
ESTIMATES OF ADHD PREVALENCE AND PREVALENCE TRENDS FROM THE GENERAL POPULATION
The information available on changes in the prevalence of ADHD in children varies in quality depending on the data source. There are no population-wide, longitudinal epidemiologic studies of the prevalence of ADHD in the United States in the under-18 population; however, there are several cross-sectional national surveys that have produced estimates of the prevalence of ADHD in children over several different years, relying on either diagnostic interviews (National Health and Nutrition Examination Survey [NHANES]) or parental reports of diagnoses (National Health Interview Survey {NHIS], National Survey of Children’s Health {NSCH]).
Prevalence of ADHD
Prevalence of ADHD Based on National Surveys of Parents
The prevalence of ADHD has been reported from several nationally representative surveys, but rarely using clinical criteria, which require multiple informants, a range of symptoms, and significant functional impairment (Birmaher et al., 2007). The survey that meets these criteria most closely was the 2001–2004 NHANES (N = 3,042 aged 8–15), based on parent reports using the Diagnostic Interview Schedule for Children (Froehlich et al., 2007; Merikangas et al., 2010). The prevalence of ADHD with impairment over the past 12 months was 7.8 percent (8.6 percent if impairment was not considered).
Other nationally-representative surveys have tended to use one or two questions that do not ask about specific symptoms or directly assess the child. The Centers for Disease Control and Prevention’s NSCH in 2007 (91,642 children aged 0–17) and 2011/2012 (95,677 children aged 0–17) used a sequence of questions directed to parents to evaluate whether a child had ADHD (Blumberg et al., 2012). The first question in the survey was, “Has a doctor or health professional ever told you that (child’s name) has Attention Deficit Disorder or Attention Deficit Hyperactive Disorder, that is, ADD or ADHD?” If the parent responded yes to the first question, then several follow-up questions were asked: “Does (child’s name) currently have the condition?” “Would you describe his/her condition as mild, moderate, or severe?” and “Is (child’s name) currently taking medication for ADD or ADHD?” (Visser et al., 2014). Results of the 2007 and 2011–2012 NSCH are summarized in Table 12-1.
Since 1997, the NHIS has included a question assessing ADHD in children (National Health Interview Survey and National Center for Health Statistics, 2010). Parents of children aged 2–17 are asked, “Has a doctor
TABLE 12-1 NSCH, Parent Report of Children Who Currently Have ADHD
| Source | Year | Question | Percent of Children with ADHD | Age Range |
| NSCH, 2007 | 2007 | Current ADHD | 6.4% (CI 6.0–6.8%) | 2–17 |
| NSCH, 2012a | 2011/2012 | Current ADHD, no current medication treatment | 2.5 (CI 2.2–2.7%) | 2–17 |
| NSCH, 2012a | 2011/2012 | Current ADHD, current medication treatment | 5.4% (CI 5.1–5.7%) | 2–17 |
| Visser et al., 2007 | 2007 | Current ADHD, no current medication treatment | 7.8% (95% CI 7.4%–8.1%) | 4–17 |
| Visser et al., 2007 | 2007 | Current ADHD, current medication treatment | 4.3% (95% CI 4.1%–4.6%) | 4–17 |
| Visser et al., 2014 | 2011 | Current ADHD and current medication treatment | 8.8% (CI 8.4–9.3%) | 4–17 |
| Visser et al., 2014 | 2011 | Current ADHD, no current medication treatment | 6.1% (CI 5.7–6.5%) | 4–17 |
| Perou et al., 2013 | 2007 | Current ADHD and current medication treatment | 6.8% (C.I. 6.4–7.2%) | 3–17 |
NOTE: CI = confidence interval.
SOURCES: NSCH, 2007, 2012a; Perou et al., 2013; Visser et al., 2007, 2014.
or health professional ever told you that [the child] had attention-deficit/hyperactivity disorder (ADHD) or attention deficit disorder (ADD)?” (Perou et al., 2013). Findings from the NHIS are summarized below, in Tables 12-2 and 12-3.
As discussed in Chapter 2, survey data from NHIS and NSCH identify those children thought by a parent to have been diagnosed with ADHD, and may not accurately reflect the prevalence of those whose symptoms have been directly assessed or diagnosed by a professional. The NHIS data include some evidence of potential bias and error in the ADHD survey results. Beginning in 2001, the NHIS included questions from the Strengths and Difficulties Questionnaire (SDQ), which is a screening tool for identifying emotional and behavioral problems in children (Goodman, 1997).
TABLE 12-2 NHIS Parent Reports of Children Who Have Ever Received a Diagnosis or Have Ever Had a Doctor or Health Professional Tell Them That Their Child Has ADHD
| Source | Year | Percent of Children with ADHD | Age Range |
| Boyle et al., 1996 | 1997–1999 | 5.70% | (3–17) |
| Boyle et al., 2011 | 2000–2002 | 6.70% | (3–17) |
| Boyle et al., 2011 | 2003–2005 | 6.80% | (3–17) |
| Boyle et al., 2011 | 2006–2008 | 7.60% | (3–17) |
| Perou et al., 2013 | 2007–2008 | 7.6% (CI 7.1–8.2%) | (3–17) |
| Perou et al., 2013 | 2009–2010 | 8.5% (CI 8.0–9.0%) | (3–17) |
| Perou et al., 2013 | 2011 | 8.4% (CI 7.8–9.1%) | (3–17) |
NOTE: CI = confidence interval.
SOURCES: Boyle et al., 1996, 2011; Perou et al., 2013.
TABLE 12-3 Percentage of Children Ages 3 to 17 Reported to Have Ever Been Diagnosed by a School or a Health Professional as Having ADHD: 1997–2013
| Year | 1997 | 1998 | 1999 | 2000 | 2001 | 2002 | 2003 | 2004 |
| Total | 5.5 | 5.9 | 5.6 | 6.6 | 6.4 | 7.2 | 6.4 | 7.4 |
| Sex | ||||||||
| Male | 8.3 | 8.5 | 8.4 | 9.3 | 9.1 | 10.3 | 9.0 | 10.2 |
| Female | 2.6 | 3.2 | 2.7 | 3.8 | 3.5 | 4.0 | 3.6 | 4.5 |
| Race/Hispanic origin | ||||||||
| Non-Hispanic white | 6.5 | 7.0 | 6.7 | 8.0 | 7.4 | 8.3 | 7.5 | 8.7 |
| Non-Hispanic black | 4.3 | 4.9 | 4.3 | 5.0 | 5.7 | 7.8 | 6.0 | 8.1 |
| Hispanic | 3.3 | 3.5 | 2.7 | 3.8 | 3.5 | 3.7 | 3.7 | 4.0 |
| Non-Hispanic other | 2.4 | 2.2 | 3.8 | 2.1 | 3.7 | 1.8 | 3.1 | 2.6 |
| Age group | ||||||||
| Ages 3–4 | 0.5 | 0.7 | 0.6 | 1.0 | 0.8 | 1.0 | 0.7 | 1.9 |
| Ages 5–11 | 5.9 | 6.1 | 5.3 | 6.5 | 6.3 | 6.8 | 6.3 | 6.5 |
| Ages 12–17 | 6.8 | 7.5 | 7.7 | 8.6 | 8.3 | 9.6 | 8.3 | 10.3 |
| Poverty status | ||||||||
| Below federal poverty level (FPL) | – | 6.7 | 7.7 | 7.0 | 7.1 | 9.7 | 7.0 | 7.5 |
| At or above the FPL | – | 6.0 | 5.8 | 7.3 | 6.5 | 7.2 | 6.8 | 7.7 |
| 100–199% of the FPL | – | – | – | – | – | – | – | – |
| Above 199% of the FPL | – | – | – | – | – | – | – | – |
SOURCE: Child Trends, 2014; used with permission.
The SDQ questions used in the NHIS were related to attention span and concentration. A study of the NHIS results from 2001 to 2007 showed that approximately 50 percent of children who either had a high score on the SDQ or had serious overall difficulties as reported by parents, also had a diagnosis of ADHD as reported by the same parents (Pastor et al., 2012). In addition, there is also evidence that health care professionals frequently do not fully comply with accepted guidelines for diagnosis (Epstein et al., 2014). There is also evidence that children who are treated for ADHD may not meet the diagnostic criteria for ADHD in many cases (Zima et al., 2010).
Prevalence of ADHD Based on Direct Interviews of Adolescents
The nationally representative National Comorbidity Survey-Replication Adolescent Supplement (NCS-A) generated estimates of the prevalence of ADHD based on face-to-face surveys of more than 10,000 adolescents, ages 13–17. ADHD was assessed using a modified version of the World Health
| 2005 | 2006 | 2007 | 2008 | 2009 | 2010 | 2011 | 2012 | 2013 |
| 6.6 | 7.4 | 7.3 | 8.0 | 8.6 | 8.4 | 8.4 | 9.5 | 8.8 |
| 9.2 | 10.7 | 10.0 | 11.1 | 11.8 | 11.2 | 12.0 | 13.5 | 12.0 |
| 3.8 | 4.0 | 4.3 | 4.8 | 5.3 | 5.5 | 4.7 | 5.4 | 5.5 |
| 7.4 | 8.6 | 8.4 | 9.8 | 10.0 | 9.9 | 10.0 | 9.4 | 10.7 |
| 7.1 | 7.5 | 7.9 | 8.4 | 10.6 | 10.7 | 8.6 | 5.7 | 8.4 |
| 4.6 | 5.0 | 4.0 | 4.2 | 5.0 | 4.3 | 5.6 | 11.7 | 6.3 |
| 2.4 | 2.4 | 4.7 | 3.5 | 2.3 | 2.8 | 3.8 | 5.1 | 3.0 |
| 0.7 | 0.6 | 2.0 | 2.0 | 1.5 | 1.7 | 1.8 | 1.7 | 1.7 |
| 6.1 | 7.4 | 5.9 | 7.3 | 7.6 | 7.6 | 7.5 | 9.5 | 8.6 |
| 8.9 | 9.7 | 10.5 | 11.1 | 12.2 | 11.6 | 11.9 | 12.1 | 11.4 |
| 7.9 | 9.4 | 9.0 | 10.1 | 10.5 | 10.5 | 10.4 | 12.3 | 11.6 |
| 6.7 | 7.7 | 7.6 | 8.3 | 8.2 | 7.4 | 8.1 | 9.2 | 8.1 |
| – | – | – | – | 10.5 | 10.5 | 7.0 | 9.6 | 8.5 |
| – | – | – | – | 7.3 | 7.3 | 8.6 | 9.0 | 8.0 |
Organization Composite International Diagnostic interview. The NCS-A survey produced a 30-day estimate of 4.5 percent, and a 12-month estimate of 6.5 percent (Kessler et al., 2012). The NCS-A survey also produced a lifetime estimate of 8.7 percent, where 4.2 percent of adolescents with ADHD had severe impairment (Merikangas et al., 2010).
Prevalence Trends of ADHD Based on Assessments of a Child’s Symptoms
The most recent review of prevalence trends is Polanczyk and colleagues’ 2014 meta-regression analysis of 135 studies using Diagnostic and Statistical Manual of Mental Disorders (DSM) or International Classification of Diseases criteria for ADHD. The review incorporates a test of whether there has been evidence of changing rates of ADHD over time, by year of assessment (or year of publication if year of assessment was not provided). This study may be the best available scientific effort to assess the trends in the prevalence of ADHD while controlling for variations in survey methodology and survey population. The studies were published between 1985 and 2012, and controlled for several methodological factors that contribute to variation in estimates, including geographic location. The mean prevalence estimate was just over 5 percent, and this did not vary significantly between 1985 and 2012. Studies using DSM-IV produced higher rates than those using other taxonomies. Estimates are, however, widely varied, for reasons that are both methodological and based on differences among populations sampled. For example, variation in educational policies may influence local rates of ADHD (Fulton et al., 2015).
TRENDS IN THE RATES OF ADHD AMONG SSI AND MEDICAID POPULATIONS
This section of the report presents data on trends in the rates of ADHD in the SSI program for children from 2004 to 2013 and in Medicaid from 2001 to 2010.
SSI
Table 12-4 presents the SSI administrative data on ADHD in children. Column 1 shows the number of child allowances made on the basis of ADHD at the initial level for each year. Column 2 shows the number of child recipients who received SSI benefits on the basis of ADHD in December of each year. Column 3 shows the estimated number of children in households with family income below 200 percent of the federal poverty level (FPL) for each year. To control for the changes in the magnitude of child poverty, the numbers shown are for the allowances and recipients as a percentage of the number of children in households under 200 percent FPL
TABLE 12-4 SSI Child Initial Allowances and Recipient Numbers for ADHD
| Year | 1 | 2 | 3 | 4 | 5 |
| # of Child SSI Allowances for ADHD | # of Child SSI Recipients for ADHD | # of Children in Households Under 200% FPL | % of Children Under 200% FPL Allowed SSI Benefits for ADHD | % of Children Under 200% FPL Who Are Recipients of SSI Benefits for ADHD | |
| 2004 | 28,739 | 138,921 | 28,753,000 | 0.10% | 0.48% |
| 2005 | 28,023 | 155,847 | 28,539,000 | 0.10% | 0.55% |
| 2006 | 25,959 | 169,863 | 28,757,000 | 0.09% | 0.59% |
| 2007 | 24,630 | 180,665 | 28,999,000 | 0.09% | 0.62% |
| 2008 | 26,303 | 189,868 | 30,064,000 | 0.09% | 0.63% |
| 2009 | 27,668 | 199,866 | 31,505,000 | 0.09% | 0.63% |
| 2010 | 30,106 | 211,478 | 32,254,000 | 0.09% | 0.66% |
| 2011 | 29,871 | 220,708 | 32,678,000 | 0.09% | 0.68% |
| 2012 | 27,772 | 225,035 | 32,269,000 | 0.09% | 0.70% |
| 2013 | 24,181 | 226,363 | 31,364,000 | 0.08% | 0.72% |
NOTE: The Current Population Survey table creator was used to generate numbers of children below 200 percent of the federal poverty level. Parameters used to generate the numbers include get count of: persons in poverty universe (everyone except unrelated individuals under 15); years: 2004 to 2013; Census 2010 weights; row variable: age; column variable: income-to-poverty ratio; and customized formatting: income-to-poverty ratio percent cutoff of 200 percent.
SOURCES: U.S. Census Bureau, 2015; unpublished data set provided by the SSA.
for each year. Column 4 shows the percentage of children in households under 200 percent FPL who were allowed benefits for ADHD (i.e., were found to be severely impaired with a primary diagnosis of ADHD) in each year. Column 5 shows the percentage of children in households under 200 percent FPL who were recipients of SSI payments for ADHD in December of each year. Figure 12-1 plots the percentages from columns 4 and 5 along with the 10-year average of the percentages of allowances and recipients for ADHD as a visual reference point.
Over the 10-year period from 2004 to 2013, the rate of child SSI ADHD recipients increased, while the rate of child SSI ADHD allowances may have decreased. The rate of child ADHD allowances among children in households under 200 percent FPL between 2004 and 2013 decreased from 0.10 to 0.08 percent, a 23 percent decrease. In contrast, the rate of child ADHD recipients between 2004 and 2013 increased from 0.48 to 0.72 percent, a 50 percent increase.
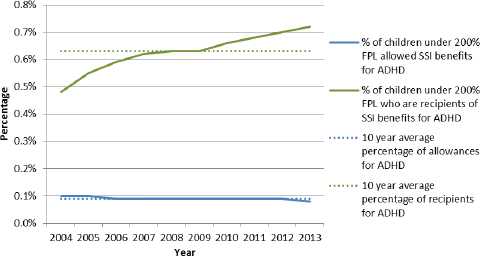
FIGURE 12-1 Percentages of SSI child initial allowances and recipients for ADHD under 200 percent FPL.
NOTE: The Current Population Survey table creator was used to generate numbers of children below 200 percent of the federal poverty level. Parameters used to generate the numbers include get count of: persons in poverty universe (everyone except unrelated individuals under 15); years: 2004 to 2013; Census 2010 weights; row variable: age; column variable: income-to-poverty ratio; and customized formatting: income-to-poverty ratio percent cutoff of 200 percent.
SOURCES: U.S. Census Bureau, 2015; unpublished data set provided by the SSA.
Trends in the number of ADHD allowances and recipients should be interpreted cautiously, keeping in mind that the ADHD impairment code contributes by far the largest number determinations every year in the SSI program. As mentioned in Chapter 3, the ADHD impairment code is 40 to 50 percent of all determinations each year, and more than triple any other mental disorder impairment code reviewed in this study. In addition, the allowance rate for the ADHD impairment code is low, approximately 22 percent, and the approximately 70 percent of ADHD allowances are allowances that functionally equal the listings. Several conclusions might be drawn from these findings. First, it might be the case that the majority of the child SSI applications for mental disorders include either evidence of ADHD or a record of a diagnosis for ADHD. Second, it might be the case that disability examiners use the ADHD impairment code as a catch-all category, assigning the impairment code to cases where the other impairment codes may not fit. The use of ADHD as a catch-all category may be both for denials and for allowances. In the case of allowances, it may be the
TABLE 12-5 Percentage of Child Medicaid Enrollees and SSI Medicaid Enrollees Diagnosed with ADHD
| Year | 1 | 2 |
| % of All Child Medicaid Enrollees with ADHD Diagnosis | % of Child SSI Medicaid Enrollee Subpopulation with ADHD Diagnosis | |
| 2001 | 3.0% | 10.7% |
| 2002 | 3.2% | 11.3% |
| 2003 | 3.5% | 12.3% |
| 2004 | 3.9% | 13.1% |
| 2005 | 4.2% | 14.4% |
| 2006 | 4.3% | 14.2% |
| 2007 | 4.7% | 14.5% |
| 2008 | 5.1% | 15.7% |
| 2009 | 5.4% | 17.3% |
| 2010 | 5.5% | 17.7% |
SOURCE: MAX data.
case that the ADHD listing is the most flexible or permissive, and may accommodate cases where the applicant has unspecified or comorbid mental disorders that result in severe impairment, but do not fit within any other listing. Currently, there are no data available from the SSI program to further elucidate the role of comorbidity in ADHD allowances and recipients.
Medicaid
Table 12-5 shows the percentage of children who were diagnosed with ADHD in two different groups of Medicaid enrollees for each year from 2001 to 2010. Column 1 shows the percentage of ADHD diagnoses among all Medicaid enrollees1 for each year. Column 2 shows the percentage of ADHD diagnoses among the smaller subpopulation of Medicaid enrollees who were eligible to be enrolled in Medicaid on the basis of receiving SSI benefits.2
As shown in Figure 12-2, the rates of ADHD diagnoses among all child Medicaid enrollees and among child SSI-eligible Medicaid enrollees both increased between 2001 and 2010. The rate of ADHD diagnoses among all Medicaid enrollees increased by 81 percent from 2001 to 2010; the absolute increase was 2.5 percentage points. The rate of ADHD diagnoses
_________________
1 Refer to Appendix F for Rutgers methods section.
2 Ibid.
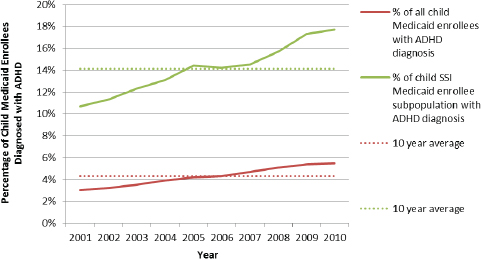
FIGURE 12-2 Percentage of child Medicaid enrollees and SSI Medicaid enrollees diagnosed with ADHD.
SOURCE: MAX data.
among the SSI-eligible subpopulation of Medicaid enrollees increased by 66 percent; the absolute increase was 7 percentage points. The greater frequency of ADHD in the SSI-eligible subpopulation is expected, because that subpopulation is defined by being disabled, while many in the general Medicaid population are not disabled.
For the years in which the Medicaid data and the SSI administrative data overlapped, 2004–2010, the rate of ADHD diagnoses among all Medicaid-enrolled children increased by 40 percent; the rate of ADHD diagnoses among SSI-eligible Medicaid-enrolled children increased by 35 percent; and the rate of SSI recipients for ADHD among children in households under 200 percent FPL increased by 38 percent. These trends are remarkably similar and confirm that the numbers of children who received SSI benefits on the basis of an ADHD diagnosis have not grown faster than comparison populations.
DISCUSSION
The consensus committee assessed changes or trends in prevalence of ADHD seen in the SSI data and compared these with trends in the Medicaid population (using billing data) and in the general population (using surveys and interviews with parents and/or children). The data presented in this chapter demonstrate two trends: (1) increasing rates where diagnoses are
based on actual or parent-reported clinician judgment and (2) no evidence of increasing rates (from the meta-regression analysis) where diagnoses are based on parent- and/or child-reported symptoms. There are no studies of Medicaid or SSI populations that use diagnoses based on parent- and/or child-reported symptoms.
To be clear, some surveys ask parents whether a professional has told them that the child has ADHD, and these show increased prevalence over time, while the meta-analysis of direct parent/child interviews indicates that the prevalence of ADHD is not increasing after controlling for a number of variables, including methodological differences. The increases observed within the SSI program, within the Medicaid population, and in some surveys of the general population may be related to changes in diagnostic access and practices that are leading to children being identified as having ADHD at a higher frequency. Since the SSI program requires a “medically determinable impairment” and relies on a diagnosis—or diagnoses, in the case of comorbid conditions—from an “acceptable medical source,” changes in medical diagnostic practice will directly affect the rates of disorders in the SSI program. In other words, the changes in diagnostic access and practices that have resulted in an increase in the number of ADHD diagnoses will be observed in the Medicaid data, and reflected in the national survey data and SSI program, because these latter two sources rely on reports of a diagnosis from a health care provider. The meta-regression data do not rely on diagnoses from health care providers, but rather on assessment of a child’s symptoms, and therefore do not show the same increase. The implication of these findings is that the increase in ADHD observed within the SSI program is consistent with an increase in the diagnosis of ADHD in the general population, but not necessarily an increase in the rates of children who have symptoms that meet various criteria for ADHD.
Furthermore, based on general population estimates of ADHD and the rate of child poverty, it may be the case that the SSI program is providing benefits to a relatively small proportion of the population of children who would otherwise be eligible to receive benefits. The NSCH 2011–2012 estimate of the prevalence of children (age 2–17) with severe or moderate ADHD, as reported by parents, was 4.6 percent (NSCH, 2012b). The estimated number of children under 200 percent FPL in 2012 was 32,269,000 (U.S. Census Bureau, 2015).3 Therefore, the estimated number of children with current moderate to severe ADHD under 200 percent FPL would be
_________________
3 The Current Population Survey table creator was used to generate numbers of children below 200 percent of the federal poverty level. Parameters used to generate the numbers include get count of: persons in poverty universe (everyone except unrelated individuals under 15); years: 2004 to 2013; Census 2010 weights; row variable: age; column variable: income-to-poverty ratio; and customized formatting: income-to-poverty ratio percent cutoff of 200 percent.
1,484,374. (This probably underestimates the number, because the NSCH estimate is for the whole population, and ADHD occurs in higher frequencies in low-income populations.) In 2012 there were 225,035 child recipients of the SSI benefits for ADHD. Based on these assumptions, approximately 15 percent of children in low-income households with moderate or severe ADHD were recipients of SSI benefits for ADHD in 2012. Figure 12-3 illustrates these relationships.
FINDINGS
- Prevalence estimates for ADHD in the general population of youth fall into the 5 percent or greater range, depending on the source of the estimate and survey methodology.
- Estimates of the prevalence of ADHD that apply diagnostic criteria based on assessment of a child’s symptoms, are lower than estimates derived from parent reports of health care provider diagnoses of ADHD. There is no evidence of an increase in the prevalence of ADHD based on assessments of a child’s symptoms; however, there is evidence of an increase in the frequency of diagnoses for ADHD based on parent report and from Medicaid billing records.
- The increase in the prevalence of ADHD diagnoses found by the national surveys based on parent interviews approaches that of the increase in the number of youth with ADHD in the SSI recipients group (approximately 60 percent over 10 years). Similarly, the cumulative percentage increase in the percentage of ADHD diagnoses in child Medicaid enrollees from 2004 to 2010 is similar to the increase in the percentage of children in low-income households who are recipients of SSI benefits for ADHD.
CONCLUSIONS
- The available evidence on the prevalence of ADHD in children shows (1) increasing rates where diagnoses are based on actual or parent-reported clinician judgment and, (2) no evidence of increasing rates (from the meta-regression analysis) where diagnoses are based on parent- and/or child-reported symptoms. The implication of these findings is that the increase in ADHD observed within the SSI program is consistent with an increase in the diagnosis of ADHD in the general population, but not necessarily an increase in the rates of children who have symptoms that meet various criteria for ADHD. The frequency of ADHD diagnoses relative to that of other mental disorders (and, in particular, mood disorders and oppositional defiant disorder/conduct disorder) is greater in the SSI
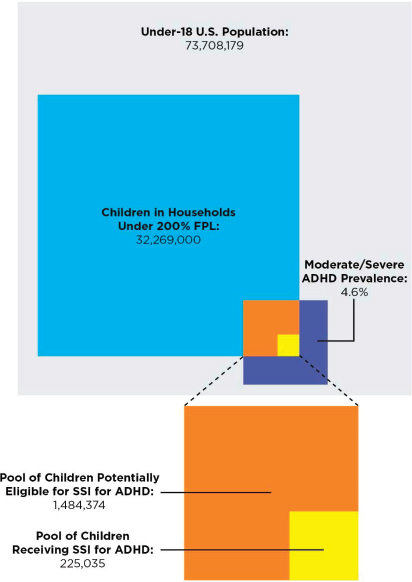
FIGURE 12-3 Children potentially eligible for SSI for ADHD versus children receiving SSI for ADHD in 2012, according to the NSCH.
NOTE: The Current Population Survey table creator was used to generate numbers of children below 200 percent of the federal poverty level. Parameters used to generate the numbers include get count of: persons in poverty universe (everyone except unrelated individuals under 15); years: 2004 to 2013; Census 2010 weights; row variable: age; column variable: income-to-poverty ratio; and customized formatting: income-to-poverty ratio percent cutoff of 200 percent.
SOURCES: NSCH, 2012b; U.S. Census Bureau, 2014, 2015; unpublished data set provided by the SSA.
- population than in the general population. A possible explanation is that ADHD serves as a catch-all diagnostic category for children with multiple and unspecified mental disorders within the SSI program.
- Based on 2012 estimates of the number of children below 200 percent of the federal poverty level and the prevalence of moderate to severe ADHD in children nationally, it appears that only a small proportion of children who were potentially eligible for SSI benefits due to ADHD were in fact recipients.
REFERENCES
Birmaher, B., D. Brent, W. Bernet, O. Bukstein, H. Walter, R.S. Benson, A. Chrisman, T. Farchione, L. Greenhill, J. Hamilton, H. Keable, J. Kinlan, U. Schoettle, S. Stock, K. K. Ptakowski, and J. Medicus. 2007. Practice parameter for the assessment and treatment of children and adolescents with depressive disorders. Journal of the American Academy of Child & Adolescent Psychiatry 46(11):1503–1526.
Blumberg, S. J., E. B. Foster, A. M. Frasier, J. Satorius, B. J. Skalland, K. L. Nysse-Carris, H. M. Morrison, S. R. Chowdhury, and K. S. O’Connor. 2012. Design and operation of the National Survey of Children’s Health, 2007. National Center for Health Statistics. Vital and Health Statistics 1(55):1–149. http://purl.fdlp.gov/GPO/gpo46838 (accessed July 15, 2015).
Boyle, C. A., M. Yeargin-Allsop, N. S. Doernberg, C. C. Murphy, and D. E. Schendel. 1996. Prevalence of selected developmental disabilities in children 3–10 years of age: The Metropolitan Atlanta Developmental Disabilities Surveillance program, 1991. Morbidity and Mortality Weekly Report 45(SS-2):1–14.
Boyle, C. A., S. Boulez, L. A. Schieve, R. A. Cohen, S. J. Blumberg, M. Yeargin-Allsopp, S. Visser, and M. D. Kogan. 2011. Trends in the prevalence of developmental disabilities in U.S. children, 1997–2008. Pediatrics 127(6):1034–1042.
Child Trends. 2014. Original analysis by Child Trends of National Health Interview Survey data 1997–2013. ADHD. www.childtrends.org/?indicators=ADHD (accessed July 11, 2015).
Epstein, J. N., K. J. Kelleher, R. Baum, W. B. Brinkman, J. Peugh, W. Gardner, P. Lichtenstein, and J. Langberg. 2014. Variability in ADHD care in community-based pediatrics Pediatrics 134(6):1136–1143.
Froehlich, T. E., B. P. Lanphear, J. N. Epstein, W. J. Barbaresi, S. K. Katusic, and R. S. Kahn. 2007. Prevalence, recognition, and treatment of attention-deficit/hyperactivity disorder in a national sample of US children. Archives of Pediatrics & Adolescent Medicine 161(9):857–864.
Fulton, B. D., R. M. Scheffler, and S. P. Hinshaw. 2015. State variation in increased ADHD prevalence: Links to NCLB school accountability and state medication laws. Psychiatric Services 66(10):1074–1082.
GAO (U.S. Government Accountability Office). 2012. Supplemental Security Income: State trends in applications, allowances, and benefit receipts for children with mental impairments (GAO-12-498SP, June 2012), an e-supplement to GAO-12-497. Washington, DC: GAO. http://purl.fdlp.gov/GPO/gpo25627 (accessed July 11, 2015).
Goodman, R. 1997. The Strengths and Difficulties Questionnaire: A research note. Journal of Child Psychology and Psychiatry 38(5):581–586.
Kessler, R. C., M. Petukhova, N. A. Sampson, A. M. Zaslavsky, and H.-U. Wittchen. 2012. Twelve-month and lifetime prevalence and lifetime morbid risk of anxiety and mood disorders in the United States. International Journal of Methods in Psychiatric Research 21(3):169–184.
Merikangas, K. R., J. P. He, M. Burstein, S. A. Swanson, S. Avenevoli, L. Cui, C. Benjet, K Georgiades, and J. Swendsen. 2010. Lifetime prevalence of mental disorders in US adolescents: Results from the National Comorbidity Survey Replication-Adolescent Supplement (NCS-A). Journal of the American Academy of Child & Adolescent Psychiatry 49(10):980–989.
National Health Interview Survey and National Center for Health Statistics. 2010. National Health Interview Survey. Hyattsville, MD: The Center.
NRC and IOM (National Research Council and Institute of Medicine). 2009. Preventing mental, emotional, and behavioral disorders among young people: Progress and possibilities. Washington, DC: The National Academies Press.
NSCH (National Survey of Children’s Health). 2007. Data query from the child and adolescent health measurement initiative. www.childhealthdata.org/browse/survey/results?q=1208 (accessed July 29, 2015).
NSCH. 2012a. Data query from the child and adolescent health measurement initiative. www.childhealthdata.org/browse/survey/results?q=2482&r=1 (accessed July 29, 2015).
NSCH. 2012b. Data query from the child and adolescent health measurement initiative. http://childhealthdata.org/browse/survey/results?q=2484&r=1 (accessed July 29, 2015).
Pastor, P. N., C. A. Reuben, and C. R. Duran. 2012. Identifying emotional and behavioral problems in children aged 4–17 years: United States, 2001–2007. National Health Statistics Reports (48):1–17.
Perou, R., R. H. Bitsko, S. J. Blumberg, P. Pastor, R. M. Ghandour, J. C. Gfroerer, S. L. Hedden, A. E. Crosby, S. N. Visser, L. A. Schieve, S. E. Parks, J. E. Hall, D. Brody, C. Simile, W. W. Thompson, J. Baio, S. Avenevoli, M. D. Kogan, and L. N. Huang. 2013. Mental health surveillance among children—United States, 2005–2011. Morbidity and Mortality Weekly Report 62(2):1–35.
Polanczyk, G. V., E. G. Willcutt, G. A. Salum, C. Kieling, and L. A. Rohde. 2014. ADHD prevalence estimates across three decades: An updated systematic review and meta-regression analysis. International Journal of Epidemiology 43(2):434–442.
U.S. Census Bureau. 2014. Total population by child and adult populations. http://datacenter.kidscount.org/data/tables/99-total-population-by-child-and-adult-populations?loc=1&loct=1#detailed/1/any/false/35,18,17,16,15/39,41/416,417 (accessed November 14, 2014).
U.S. Census Bureau. 2015. CPS table creator. www.census.gov/cps/data/cpstablecreator.html (accessed July 13, 2015).
Visser, S. N., C. A. Lesesne, and R. Perou. 2007. National estimates and factors associated with medication treatment for childhood attention-deficit/hyperactivity disorder. Pediatrics 119(Suppl 1):S99–S106.
Visser, S. N., M. L. Danielson, R. H. Bitsko, J. R. Holbrook, M. D. Kogan, R. M. Ghandour, R. Perou, and S. J. Blumberg. 2014. Trends in the parent-report of health care provider-diagnosed and medicated attention-deficit/hyperactivity disorder: United States, 2003-2011. Journal of the American Academy of Child and Adolescent Psychiatry 53(1): 34–46.
Zima, B. T., R. Bussing, L. Tang, L. Zhang, S. Ettner, T. R. Belin, and K. B. Wells. 2010. Quality of care for childhood attention-deficit/hyperactivity disorder in a managed care Medicaid program. Journal of the American Academy of Child and Adolescent Psychiatry 49(12):1225–1237.
This page intentionally left blank.


