
13
Prevalence of Oppositional Defiant Disorder and Conduct Disorder
Among the selected mental disorders, disruptive behavior disorders (DBDs) of childhood (oppositional defiant disorder and conduct disorder, or ODD/CD) are the basis for a relatively small percentage of Supplemental Security Income (SSI) allowances and for a relatively small percentage of the children who are receiving SSI benefits. Of the selected mental disorders for all years between 2004 and 2013, approximately 5 percent of the allowances were for either ODD or CD. The DBDs were the basis for 4.8 percent of all child SSI recipients in 2013, up from 4.9 percent in 2004. In 2009 a meta-analysis reported by an Institute of Medicine consensus committee estimated that the childhood prevalence of any DBD was 6.1 percent1 (confidence interval [CI] 5.4–7.3 percent) (NRC and IOM, 2009). The prevalence of CD was estimated to be 3.5 percent2 (CI 2.7–4.7 percent), and the prevalence of ODD was estimated to be 2.8 percent3 (CI 2.1–3.7 percent) (NRC and IOM, 2009).
_________________
1 Prevalence estimates for DBD, CD, and ODD were retrieved from Table 2-2 in Preventing Mental, Emotional, and Behavioral Disorders Among Young People: Progress and Possibilities (NRC and IOM, 2009). Table 2-2 presents the results of a meta-analysis of data on the prevalence of mental, emotional, and behavioral disorders in young people from more than 50 community surveys around the world, published in the past 15 years (updated from Costello et al., 2003). The analysis controlled for sample size, number of prior months that subjects were asked about in reporting their symptoms, and age of participants (NRC and IOM, 2009). A list of the data sets used in the meta-analysis is included in the above-mentioned report (NRC and IOM, 2009).
2 Ibid.
3 Ibid.
Although the DBDs represent a relatively small portion of all the SSI disability in children, they likely play an important and significant role in causing disability as a co-occurring or comorbid condition. As discussed in Chapter 7, CD and ODD rarely occur in isolation, and both have very high rates of comorbidity with attention deficit hyperactivity disorder (ADHD) and mood and anxiety disorders. However, due to the nature of the adjudication process (see Chapter 2), and the type of data and quality of data that are collected about SSI allowances, it is not possible to evaluate the amount and severity of disability caused by ODD or CD as a secondary disorder within the SSI program. Nevertheless, an understanding of the prevalence of ODD and CD will be important for the SSI disability benefit program for children because of the relationship between DBDs and other mental disorders in children (in particular ADHD and depression) and because of the nature and severity of the impairments that can be caused by CD/ODD, both independently and in combination with others disorders.
ESTIMATES OF ODD AND CD PREVALENCE AND PREVALENCE TRENDS FROM THE GENERAL POPULATION
Prevalence of ODD and CD
As is the case with other psychiatric disorders of children, prevalence estimates of ODD and CD in the general population primarily employ surveys of parents, children, or both to arrive at diagnoses within a cohort and weights that estimate to the larger population. Some of these surveys, such as the National Comorbidity Survey, gather lifetime prevalence estimates among adults, while others focus on point-in-time estimates using parent surveys with or without teacher surveys and child interviews (Kessler, 2013).
The lifetime prevalence of ODD was 10.2 percent in an adult community sample, with men at 11.2 percent and women at 9.2 percent (Nock et al., 2007). Almost all respondents with ODD reported comorbid mood, anxiety, or drug disorders, but, for the most part, the ODD occurred prior to the onset of other symptoms. The median duration of symptoms was 5 to 6 years. The adolescent replication of the National Comorbidity Study provided higher estimates of lifetime prevalence, with 12.6 percent of the sample positive for ODD (6.5 percent severe) and 6.8 percent positive for CD (Merikangas et al., 2010). Point prevalence estimates of ODD in children from community samples range from 2 to 16 percent, but most estimates from stratified community samples range from 1 to 3 percent.
Cross-sectional prevalence varies by study design, ascertainment, and analyses, but the Centers for Disease Control and Prevention employed the National Survey of Children’s Health (NSCH) to provide a combined prevalence estimate for ODD and CD. In 2007, parent-reported data asking
TABLE 13-1 Prevalence of ODD and CD According to the National Survey of Children’s Health
| Source | Year | Question | Percent of Children with Behavioral or Conduct Problems | Age Range |
| NSCH (2007) | 2007 | Currently have behavioral or conduct problems? | 3.3 (C.I. 3.0–3.6) | 2–17 |
| Perou et al. (2013) | 2007 | Current | 3.5 (C.I. 3.1–3.8) | 3–17 |
| Perou et al. (2013) | 2007 | Ever | 4.6 (C.I. 4.3–5.0) | 3–17 |
| NSCH (2012a) | 2011/2012 | Current behavioral or conduct problems such as ODD or CD? | 3.2 (C.I. 2.9–3.5) | 2–17 |
NOTE: CI = confidence interval.
SOURCES: NSCH, 2007, 2012a; Perou et al., 2013.
about prior diagnoses and conditions identified 4.6 percent (CI of 4.3–5.0 percent) of children aged 3–17 years with ODD or conduct disorder. An estimated 3.5 percent (CI of 3.1–3.8 percent) had a current condition (Perou et al., 2013). Boys were twice as likely as girls to have these conditions. Age was associated with an increased reporting of ODD and CD. There was no regional variability in parent-reported prevalence. Results from the 2007 and 2011–2012 NSCH are summarized in Table 13-1. Results of the survey are organized by the question that parents were asked regarding whether their child currently or ever had behavioral or conduct problems. Further information about the limitations of these data can be found in Chapter 2, and additional methodological information can be found in Appendix D.
Prevalence Trends
It is important to acknowledge that there are no perfect sources of data for evaluating trends in the prevalence of ODD and CD in the United States. An ideal source that would allow evaluation of trends over time might be generated by large-scale, nationally representative, population-based epidemiologic studies conducted periodically, and using validated and comparable methods and diagnostic criteria over time. No such data source exists.
However, there are cross-cultural studies. In a review of 25 studies, meta-regression analyses found no remarkable differences across countries and geography. The majority of differences in prevalence estimate were due to methodological differences in disorder assessment or calculation (Canino et al., 2010). Several of these methodological differences are worth highlighting because they underscore why estimates of prevalence do vary across studies. For example, one of the largest factors influencing prevalence rates of CD across countries in the cross-cultural comparison was the intensity of impairment required. Studies of significant impairment had low prevalence rates, but studies with no impairment had much higher rates of prevalence for CD. Maughan notes that the prevalence of conduct disorder varies by the survey of parent, child, teacher, or combinations of the aforementioned (Maughan et al., 2004). Parents and teachers often provide different ratings of ODD symptoms in children (O’Laughlin et al., 2010). Similarly, the strong predilection for males means that samples with larger portions of boys have higher rates.
In 2000, Loeber and others examined several studies and concluded that trend data over several decades were suspect because of an increase in prevalence over time due to rising arrest rates and the use of retrospective recall studies (Loeber et al., 2000). They noted that recall studies might favor a trend toward greater recent prevalence. Since that time, arrest rates have actually declined for many crimes.
In an effort to respond to studies postulating longitudinal increases in the prevalence of these conditions and other mental disorders, de Graaf and a team in the Netherlands looked at trends over time in the Netherlands Mental Health Survey and Incidence Study (NEMESIS) I and II (de Graaf et al., 2012). In the mid-1990s and again 10 years later, two cross-sectional surveys of adults were carried out that assessed lifetime prevalence of mental disorders in the Dutch population. The Dutch team found almost no changes in prevalence of any disorders that reached statistical or clinical significance. Their 2006 estimate of CD prevalence was 5.6 percent, and their estimate for ODD was 2.9 percent, with exclusivity between the two categories. They concluded that the prevalence of mental disorder was stable in the Dutch population over time, a conclusion echoed in the American population by Glied and colleagues (2010), although they did not look specifically at ODD and CD in children.
TRENDS IN THE RATES OF ODD AND CD AMONG SSI AND MEDICAID POPULATIONS
This section of the report presents data on trends in the rates of ODD and CD in the SSI program for children from 2004 to 2013 and in Medicaid from 2001 to 2010.
SSI
Table 13-2 presents the SSI administrative data on ODD in children. Column 1 shows the number of child allowances made on the basis of ODD at the initial level for each year. Column 2 shows the number of child recipients who received SSI benefits on the basis of ODD in December of each year. Column 3 shows the estimated number of children in households under 200 percent of the federal poverty level (FPL) for each year. To control for the changes in child poverty, allowances and recipients are also presented as a percentage of the number of children in households under 200 percent FPL for each year. Column 4 shows the percentage of children in households under 200 percent FPL who were allowed benefits for disabilities associated with a diagnosis of ODD in each year. Column 5 shows the percentage of children in households under 200 percent FPL who were recipients of SSI payments for ODD in December of each year. Figure 13-1
TABLE 13-2 SSI Child Initial Allowances and Recipient Numbers for ODD
| Year | 1 | 2 | 3 | 4 | 5 |
| # of Child Allowances for ODD | # of Child SSI Recipients for ODD | # of Children Under 200% FPL | % of Children Under 200% FPL Allowed SSI Benefits for ODD | % of Children Under 200% FPL Who Are Recipients of SSI Benefits for ODD | |
| 2004 | 2,913 | 12,976 | 28,753,000 | 0.010% | 0.045% |
| 2005 | 2,807 | 14,158 | 28,539,000 | 0.010% | 0.050% |
| 2006 | 2,653 | 14,967 | 28,757,000 | 0.009% | 0.052% |
| 2007 | 2,590 | 15,501 | 28,999,000 | 0.009% | 0.053% |
| 2008 | 2,628 | 15,919 | 30,064,000 | 0.009% | 0.053% |
| 2009 | 2,860 | 16,570 | 31,505,000 | 0.009% | 0.053% |
| 2010 | 2,950 | 17,293 | 32,254,000 | 0.009% | 0.054% |
| 2011 | 3,252 | 18,281 | 32,678,000 | 0.010% | 0.056% |
| 2012 | 3,281 | 19,588 | 32,269,000 | 0.010% | 0.061% |
| 2013 | 3,072 | 20,259 | 31,364,000 | 0.010% | 0.065% |
NOTE: The Current Population Survey table creator was used to generate numbers of children below 200 percent of the federal poverty level. Parameters used to generate the numbers include get count of: persons in poverty universe (everyone except unrelated individuals under 15); years: 2004 to 2013; Census 2010 weights; row variable: age; column variable: income-to-poverty ratio; and customized formatting: income-to-poverty ratio percent cutoff of 200 percent.
SOURCES: U.S. Census Bureau, 2015; unpublished data provided by the SSA.
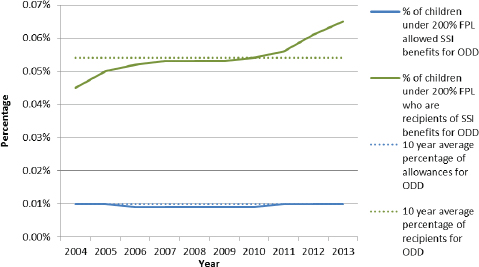
FIGURE 13-1 Percentages of SSI child initial allowances and recipients for ODD under 200 percent FPL.
NOTE: The Current Population Survey table creator was used to generate numbers of children below 200 percent of the federal poverty level. Parameters used to generate the numbers include get count of: persons in poverty universe (everyone except unrelated individuals under 15); years: 2004 to 2013; Census 2010 weights; row variable: age; column variable: income-to-poverty ratio; and customized formatting: income-to-poverty ratio percent cutoff of 200 percent.
SOURCES: U.S. Census Bureau, 2015; unpublished data provided by the SSA.
plots the percentages from columns 4 and 5 of Table 13-2 along with the 10-year average of the percentage of allowances and recipients for ODD as a visual reference point.
Over the 10-year period from 2004 to 2013, the rate of child SSI ODD recipients increased, while the rate of child SSI ODD allowances was flat. There was no change in the rate of allowances for ODD from 2004 to 2013. The rate of child ODD recipients increased by almost 43 percent between 2004 and 2013, from 0.045 to 0.065 percent. Table 13-3 presents the SSI administrative data on CD in children. Table 13-3 is organized identically to Table 13-2. Figure 13-2 plots the percentages from columns 4 and 5 of Table 13-3 along with the 10-year average of the percentage of allowances and recipients for CD as a visual reference point.
Over the 10-year period from 2004 to 2013, the rate of the child SSI CD recipients increased by 23 percent, from 0.029 to 0.035 percent, while the rate of the child SSI CD allowances decreased slightly, by 34 percent, from 0.007 in 2004 to 0.005 in 2013.
TABLE 13-3 SSI Child Initial Allowances and Recipient Numbers for CD
| Year | Child SSI Allowances for CD | Child SSI Recipients for CD | # of Children Under 200% FPL | % of Children Under 200% FPL Allowed SSI Benefits for CD | % of Children Under 200% FPL Who Are Recipients of SSI Benefits for CD |
| 2004 | 2,041 | 8,280 | 28,753,000 | 0.007% | 0.029% |
| 2005 | 1,927 | 8,907 | 28,539,000 | 0.007% | 0.031% |
| 2006 | 1,717 | 9,256 | 28,757,000 | 0.006% | 0.032% |
| 2007 | 1,761 | 9,577 | 28,999,000 | 0.006% | 0.033% |
| 2008 | 1,753 | 9,884 | 30,064,000 | 0.006% | 0.033% |
| 2009 | 1,873 | 10,202 | 31,505,000 | 0.006% | 0.032% |
| 2010 | 1,959 | 10,561 | 32,254,000 | 0.006% | 0.033% |
| 2011 | 1,880 | 10,889 | 32,678,000 | 0.006% | 0.033% |
| 2012 | 1,802 | 11,203 | 32,269,000 | 0.006% | 0.035% |
| 2013 | 1,469 | 11,077 | 31,364,000 | 0.005% | 0.035% |
NOTE: The Current Population Survey table creator was used to generate numbers of children below 200 percent of the federal poverty level. Parameters used to generate the numbers include get count of: persons in poverty universe (everyone except unrelated individuals under 15); years: 2004 to 2013; Census 2010 weights; row variable: age; column variable: income-to-poverty ratio; and customized formatting: income-to-poverty ratio percent cutoff of 200 percent.
SOURCES: U.S. Census Bureau, 2015; unpublished data provided by the SSA.
Medicaid
Tables 13-4 and 13-5 show the percentage of children who were diagnosed with ODD and CD, respectively, in two different groups of Medicaid enrollees for each year from 2001 to 2010. For both tables, column 1 shows the percentage of ODD or CD diagnoses, respectively, among all Medicaid enrollees4 for each year, while column 2 shows the percentage of either ODD or CD diagnoses among the smaller subpopulation of Medicaid enrollees who were eligible to be enrolled in Medicaid on the basis of receiving SSI benefits.5
As shown in Figure 13-3, the rate of ODD diagnoses among all child Medicaid enrollees and among child SSI-eligible Medicaid enrollees both increased between 2001 and 2010. The rate of ODD diagnoses among all Medicaid enrollees increased by 69 percent, from 0.8 to 1.4 percent,
_________________
4 Refer to Appendix F for Rutgers methods section.
5 Ibid.
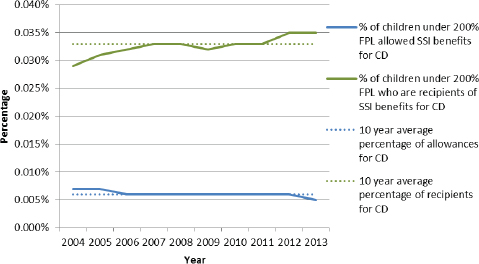
FIGURE 13-2 Percentages of SSI child initial allowances and recipients for CD under 200 percent FPL.
NOTE: The Current Population Survey table creator was used to generate numbers of children below 200 percent of the federal poverty level. Parameters used to generate the numbers include get count of: persons in poverty universe (everyone except unrelated individuals under 15); years: 2004 to 2013; Census 2010 weights; row variable: age; column variable: income-to-poverty ratio; and customized formatting: income-to-poverty ratio percent cutoff of 200 percent.
SOURCES: U.S. Census Bureau, 2015; unpublished data set provided by the SSA.
while the rate of ODD diagnoses among the SSI-eligible subpopulation of Medicaid enrollees increased by 63 percent, from 2.7 to 4.5 percent.
As shown in Figure 13-4, the rate of CD diagnoses among all child Medicaid enrollees and among child SSI-eligible Medicaid enrollees both increased between 2001 and 2010. The rate of CD diagnoses among all Medicaid enrollees increased by 29 percent, from 1.1 to 1.4 percent. The rate of CD diagnoses among the SSI-eligible subpopulation of Medicaid enrollees increased by 33 percent, from 3.5 to 4.6 percent.
For the years where the ODD Medicaid data and the SSI administrative data overlapped, that is, 2004–2010, the rate of ODD diagnoses among all Medicaid-enrolled children increased by 56 percent, the rate of ODD diagnoses among SSI-eligible Medicaid-enrolled children increased by 50 percent, and the rate of SSI recipients for ADHD among children in households under 200 percent FPL increased by 20 percent. For CD over the same time
TABLE 13-4 Percentage of Child Medicaid Enrollees and SSI Medicaid Enrollees Diagnosed with ODD
| Year | 1 | 2 |
| % of All Child Medicaid Enrollees with ODD Diagnosis | % of Child SSI Medicaid Enrollee Subpopulation with ODD Diagnosis | |
| 2001 | 0.8% | 2.7% |
| 2002 | 0.9% | 2.9% |
| 2003 | 0.9% | 3.0% |
| 2004 | 0.9% | 3.0% |
| 2005 | 1.1% | 3.5% |
| 2006 | 1.2% | 3.7% |
| 2007 | 1.4% | 4.0% |
| 2008 | 1.4% | 4.2% |
| 2009 | 1.5% | 4.6% |
| 2010 | 1.4% | 4.5% |
SOURCE: MAX data.
TABLE 13-5 Percentage of Child Medicaid Enrollees and SSI Medicaid Enrollees Diagnosed with CD
| Year | 1 | 2 |
| % of All Child Medicaid Enrollees with CD Diagnosis | % of Child SSI Medicaid Enrollee Subpopulation with CD Diagnosis | |
| 2001 | 1.1% | 3.5% |
| 2002 | 1.1% | 3.7% |
| 2003 | 1.1% | 3.8% |
| 2004 | 1.2% | 4.0% |
| 2005 | 1.2% | 4.0% |
| 2006 | 1.2% | 3.9% |
| 2007 | 1.3% | 3.9% |
| 2008 | 1.3% | 4.2% |
| 2009 | 1.4% | 4.7% |
| 2010 | 1.4% | 4.6% |
SOURCE: MAX data.
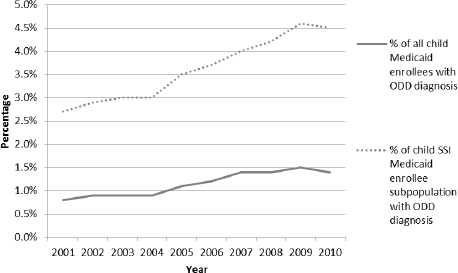
FIGURE 13-3 Percentage of child Medicaid enrollees and SSI Medicaid enrollees diagnosed with ODD.
SOURCE: MAX data.
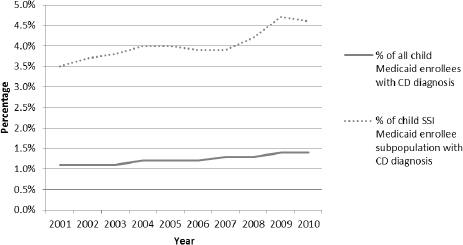
FIGURE 13-4 Percentage of child Medicaid enrollees and SSI Medicaid enrollees diagnosed with CD.
SOURCE: MAX data.
period, 2004–2010, the rate of CD diagnoses among all Medicaid-enrolled children increased by 17 percent, the rate of CD diagnoses among SSI-eligible Medicaid-enrolled children increased by 15 percent, and the rate of SSI recipients for ADHD among children in households under 200 percent FPL increased by 14 percent.
DISCUSSION
Generally speaking, there are limited data on national or population trends in the rates of the disruptive behavioral disorders of childhood. As a result, direct comparisons with the SSI disability program trends are not possible. Some comparisons can be made between trends observed in the SSI population with trends observed in the broader Medicaid population. Both the SSI program data and the Medicaid data suggest that the rates of the diagnosis of ODD and CD are increasing among low-income children. A notable observation is that the rates of ODD are higher than the rates of CD in the SSI population, while the rates of CD are slightly higher than the rates of ODD in the Medicaid population. It is unclear why this difference exists.
Overall, the modest increases in the numbers of recipients with ODD and CD in the SSI program for children are consistent with trends observed among children enrolled in Medicaid. The reported growth rate is not the result of more inclusive SSI allowance rates, which actually decreased during the analysis period. Given that the reported median duration of benefits is approximately 6 years, low rates of terminations from the SSI program during childhood might explain the expanding recipient population.
Based on general population estimates of ADHD and the rate of child poverty, it may be the case that the SSI program is providing benefits to a relatively small proportion of the population of children who would otherwise be eligible to receive benefits. In 2011–2012, the NSCH estimate of the prevalence of children ages 2–17 with moderate or severe “behavioral or conduct problems,” as reported by parents, was 2.2 percent (NSCH, 2012b). The estimated number of children under 200 percent FPL in 2012 was 32,269,000. Therefore, the estimated number of children with combined moderate and severe ODD and CD living in households with income under 200 percent FPL would be 709,918. In 2012 there were 11,203 child recipients of SSI benefits for CD. In 2012, there were 19,588 child recipients of SSI benefits for ODD. Combined, there were 30,791 child recipients for ODD/CD. Figure 13-5 illustrates these relationships.
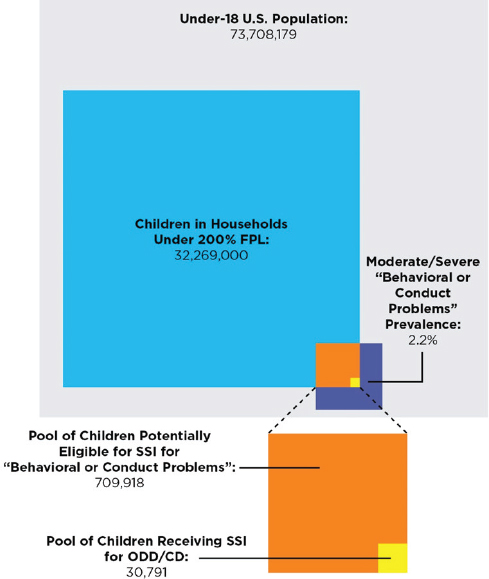
FIGURE 13-5 Children potentially eligible for SSI for “behavioral or conduct problems” versus children receiving SSI for ODD/CD in 2012, according to the National Survey of Children’s Health.
NOTE: The Current Population Survey table creator was used to generate numbers of children below 200 percent of the federal poverty level. Parameters used to generate the numbers include get count of: persons in poverty universe (everyone except unrelated individuals under 15); years: 2004 to 2013; Census 2010 weights; row variable: age; column variable: income-to-poverty ratio; and customized formatting: income-to-poverty ratio percent cutoff of 200 percent.
SOURCES: NSCH, 2012b; U.S. Census Bureau, 2014, 2015; unpublished data provided by the SSA.
FINDINGS
- Estimates of the prevalence of ODD and CD range from 3 to 5 percent. A recent meta-analysis estimated the combined prevalence of ODD/CD to be 6.1 percent.
- Currently there are no population- or national-level data on the prevalence trends of ODD and CD among U.S. children.
- While ODD/CD constitutes a small number of mental disorder cases in SSI, from 2004 to 2013 the rates of allowances among poor children for ODD increased slightly, while the rates of allowances among children in low-income households for CD decreased. Over the same period, the rate of SSI recipients for both ODD and CD increased.
CONCLUSION
- Based on rough approximations of the prevalence of moderate to severe behavioral and conduct problems among children in households below 200 percent FPL, in 2011 and 2012 only an estimated 4 percent of children who were potentially eligible for SSI benefits on the basis of ODD/CD disorders were actually recipients.
REFERENCES
Canino, G., G. Polanczyk, J. J. Bauermeister, L. A. Rohde, and P. J. Frick. 2010. Does the prevalence of CD and ODD vary across cultures? Social Psychiatry and Psychiatric Epidemiology 45(7):695–704.
Costello, E. J., S. Mustillo, A. Erkanli, G. Keeler, and A. Angold. (2003), Prevalence and development of psychiatric disorders in childhood and adolescence. Archives of General Psychiatry 60:837–844.
de Graaf, R., M. ten Have, C. van Gool, and S. van Dorsselaer. 2012. Prevalence of mental disorders and trends from 1996 to 2009: Results from the Netherlands Mental Health Survey and Incidence Study-2. Social Psychiatry and Psychiatric Epidemiology 47(2):203–213.
Glied, S., K. Herzog, and R. Frank. 2010. Review: The net benefits of depression management in primary care. Medical Care Research and Review 67(3):251–274.
Kessler, R. C. 2013. National Comorbidity Survey-Adolescent Supplement (NCS-A), 2001–2004. www.icpsr.umich.edu/icpsrweb/HMCA/studies/28581/version/4 (accessed July 13, 2015).
Loeber, R., J. D. Burke, B. B. Lahey, A. Winters, and M. Zera. 2000. Oppositional defiant and conduct disorder: A review of the past 10 years, part I. Journal of the American Academy of Child & Adolescent Psychiatry 39(12):1468–1484.
Maughan, B., R. Rowe, J. Messer, R. Goodman, and H. Meltzer. 2004. Conduct disorder and oppositional defiant disorder in a national sample: Developmental epidemiology. Journal of Child Psychology and Psychiatry 45(3):609–621.
Merikangas, K. R., J. P. He, M. Burstein, S. A. Swanson, S. Avenevoli, L. Cui, C. Benjet, K. Georgiades, and J. Swendsen. 2010. Lifetime prevalence of mental disorders in U.S. adolescents: Results from the National Comorbidity Survey Replication-Adolescent Supplement (NCS-A). Journal of the American Academy of Child & Adolescent Psychiatry 49(10):980–989.
Nock, M. K., A. E. Kazdin, E. Hiripi, and R. C. Kessler. 2007. Lifetime prevalence, correlates, and persistence of oppositional defiant disorder: Results from the National Comorbidity Survey Replication. Journal of Child Psychology and Psychiatry 48(7):703–713.
NRC and IOM (National Research Council and Institute of Medicine). 2009. Preventing mental, emotional, and behavioral disorders among young people: Progress and possibilities. Washington, DC: The National Academies Press.
NSCH (National Survey of Children’s Health). 2007. Data query from the Child and Adolescent Health Measurement Initiative. http://childhealthdata.org/browse/survey/results?q=1213 (accessed August 3, 2015).
NSCH. 2012a. Data query from the Child and Adolescent Health Measurement Initiative. http://childhealthdata.org/browse/survey/results?q=2409&r=1 (accessed August 3, 2015).
NSCH. 2012b. Data query from the Child and Adolescent Health Measurement Initiative. http://childhealthdata.org/browse/survey/results?q=2413&r=1 (accessed August 3, 2015).
O’Laughlin, E. M., J. L. Hackenberg, and M. M. Riccardi. 2010. Clinical usefulness of the oppositional defiant disorder rating scale (ODDRS). Journal of Emotional and Behavioral Disorders 18(4):247–255.
Perou, R., R. H. Bitsko, S. J. Blumberg, P. Pastor, R. M. Ghandour, J. C. Gfroerer, S. L. Hedden, A. E. Crosby, S. N. Visser, and L. A. Schieve. 2013. Mental health surveillance among children—United States, 2005–2011. Morbidity and Mortality Weekly Report 62(Suppl 2):1–35.
U.S. Census Bureau. 2014. Total population by child and adult populations. http://datacenter.kidscount.org/data/tables/99-total-population-by-child-and-adult-populations?loc=1&loct=1#detailed/1/any/false/35,18,17,16,15/39,41/416,417 (accessed November 14, 2014).
U.S. Census Bureau. 2015. CPS table creator. www.census.gov/cps/data/cpstablecreator.html (accessed July 13, 2015).


