
Table G-1a
Medicaid Basis of Eligibility (BoE)1 ‐ Enrollees with ADHD
| BoE | 2001 | 2002 | 2003 | 2004 | 2005 | 2006 | 2007 | 2008 | 2009 | 2010 |
| Foster Care | 13.4% | 12.5% | 11.6% | 10.8% | 12.3% | 12.9% | 12.4% | 11.5% | 9.8% | 9.2% |
| Other | 62.2% | 64.0% | 66.1% | 67.7% | 66.4% | 66.0% | 67.1% | 68.7% | 70.2% | 72.0% |
| SSI/Disability | 24.4% | 23.5% | 22.2% | 21.5% | 21.3% | 21.1% | 20.5% | 19.8% | 20.0% | 18.8% |
| 100% | 100% | 100% | 100% | 100% | 100% | 100% | 100% | 100% | 100% | |
| N | 361,106 | 376,196 | 395,718 | 407,703 | 416,367 | 426,454 | 431,901 | 440,135 | 468,735 | 478,822 |
Table G-1b
Medicaid Basis of Eligibility (BoE)1 ‐ Enrollees without ADHD
| BoE | 2001 | 2002 | 2003 | 2004 | 2005 | 2006 | 2007 | 2008 | 2009 | 2010 |
| Foster Care | 4.6% | 4.4% | 4.2% | 4.1% | 4.0% | 4.0% | 4.0% | 3.8% | 3.2% | 3.0% |
| Other | 89.1% | 89.6% | 89.9% | 90.1% | 90.4% | 90.2% | 90.1% | 90.5% | 91.3% | 92.0% |
| SSI/Disability | 6.4% | 6.0% | 5.9% | 5.8% | 5.6% | 5.8% | 5.9% | 5.7% | 5.4% | 5.1% |
| 100% | 100% | 100% | 100% | 100% | 100% | 100% | 100% | 100% | 100% | |
| N | 5,074,216 | 5,568,409 | 5,926,814 | 6,108,254 | 6,378,130 | 6,343,426 | 6,286,656 | 6,550,711 | 7,139,286 | 7,759,711 |
Table G-1c
Medicaid Basis of Eligibility (BoE)1 ‐ All enrollees
| BoE | 2001 | 2002 | 2003 | 2004 | 2005 | 2006 | 2007 | 2008 | 2009 | 2010 |
| Foster Care | 4.8% | 4.7% | 4.5% | 4.4% | 4.3% | 4.4% | 4.4% | 4.2% | 3.6% | 3.3% |
| Other | 88.3% | 88.8% | 89.1% | 89.2% | 89.4% | 89.2% | 89.1% | 89.4% | 90.2% | 90.9% |
| SSI/Disability | 6.9% | 6.5% | 6.4% | 6.4% | 6.3% | 6.4% | 6.6% | 6.4% | 6.2% | 5.8% |
| 100% | 100% | 100% | 100% | 100% | 100% | 100% | 100% | 100% | 100% | |
| N | 5,232,083 | 5,749,809 | 6,144,784 | 6,356,411 | 6,658,353 | 6,630,423 | 6,593,490 | 6,899,748 | 7,545,081 | 8,208,507 |
Inclusion criteria: youth age 3‐17 with 11+ months of Medicaid eligibility and no dual eligibility in the year.
SOURCE: Medicaid Analytic Extract (MAX) data for 20 states: AK, AL, AR, CA, FL, ID, IL, IN, LA, MI, MS, MT, NC, ND, NH, NM, SD, VA, VT, WY.
_________________
1 In the last month of observation for the enrollee.
Table G-2a
Diagnoses ‐ All Enrollees
| Diagnosis | 2001 | 2002 | 2003 | 2004 | 2005 | 2006 | 2007 | 2008 | 2009 | 2010 |
| ADHD | 3.0% | 3.2% | 3.5% | 3.9% | 4.2% | 4.3% | 4.7% | 5.1% | 5.4% | 5.5% |
| Conduct disorder | 1.1% | 1.1% | 1.1% | 1.2% | 1.2% | 1.2% | 1.3% | 1.3% | 1.4% | 1.4% |
| Emotional disturbances | 1.4% | 1.4% | 1.4% | 1.5% | 1.5% | 1.6% | 1.7% | 1.8% | 1.8% | 1.8% |
| Oppositional defiant disorder | 0.8% | 0.9% | 0.9% | 0.9% | 1.1% | 1.2% | 1.4% | 1.4% | 1.5% | 1.4% |
| Depression | 1.7% | 1.7% | 1.9% | 2.0% | 1.9% | 1.9% | 2.0% | 2.1% | 2.2% | 2.2% |
| Bipolar disorders | 0.3% | 0.3% | 0.4% | 0.5% | 0.5% | 0.6% | 0.6% | 0.6% | 0.6% | 0.6% |
| Anxiety disorders | 0.5% | 0.5% | 0.6% | 0.6% | 0.8% | 0.9% | 1.0% | 1.1% | 1.2% | 1.3% |
| Autism spectrum disorders | 0.2% | 0.2% | 0.3% | 0.3% | 0.4% | 0.5% | 0.6% | 0.6% | 0.7% | 0.7% |
| Intellectual disorders | 0.6% | 0.6% | 0.6% | 0.5% | 0.5% | 0.6% | 0.6% | 0.6% | 0.6% | 0.5% |
| Learning disorders | 1.2% | 1.1% | 1.1% | 1.0% | 1.0% | 1.1% | 1.1% | 1.1% | 1.1% | 1.2% |
| Any of the above | 7.9% | 8.0% | 8.4% | 8.8% | 9.2% | 9.4% | 10.0% | 10.6% | 11.0% | 11.1% |
| Speech and language disorders | 1.6% | 1.6% | 1.6% | 1.8% | 2.0% | 2.1% | 2.0% | 2.2% | 2.4% | 2.7% |
| Hearing disorders | 4.9% | 4.9% | 5.1% | 4.3% | 4.7% | 4.6% | 4.8% | 5.2% | 5.7% | 5.4% |
| Cerebral palsy | 0.5% | 0.5% | 0.5% | 0.5% | 0.5% | 0.5% | 0.5% | 0.5% | 0.5% | 0.4% |
| Asthma | 2.3% | 2.5% | 2.8% | 2.9% | 3.2% | 3.3% | 3.4% | 3.7% | 4.3% | 4.2% |
| N | 5,232,083 | 5,749,809 | 6,144,784 | 6,356,411 | 6,658,353 | 6,630,423 | 6,593,490 | 6,899,748 | 7,545,081 | 8,208,507 |
Inclusion criteria: youth age 3‐17 with 11+ months of Medicaid eligibility and no dual eligibility in the year.
Source: Medicaid Analytic Extract (MAX) data for 20 states: AK, AL, AR, CA, FL, ID, IL, IN, LA, MI, MS, MT, NC, ND, NH, NM, SD, VA, VT, WY.
A diagnosis was established based on the presence of one or more inpatient or two or more non‐inpatient claims with qualifying ICD‐9‐CM codes.
Table G-2a (Ns)
Diagnoses ‐ All Enrollees
| Diagnosis | 2001 | 2002 | 2003 | 2004 | 2005 | 2006 | 2007 | 2008 | 2009 | 2010 |
| ADHD | 157,867 | 181,400 | 217,970 | 248,157 | 280,223 | 286,997 | 306,834 | 349,037 | 405,795 | 448,796 |
| Conduct disorder | 56,189 | 63,443 | 69,909 | 73,841 | 76,985 | 78,507 | 82,497 | 92,676 | 107,546 | 113,367 |
| Emotional disturbances | 72,318 | 78,655 | 86,569 | 94,186 | 98,804 | 103,241 | 110,256 | 121,807 | 137,217 | 145,629 |
| Oppositional defiant disorder | 44,399 | 49,045 | 54,325 | 59,301 | 74,345 | 82,324 | 90,149 | 99,998 | 113,359 | 118,009 |
| Depression | 88,177 | 100,314 | 114,817 | 124,624 | 126,300 | 128,527 | 131,713 | 145,324 | 167,063 | 182,931 |
| Bipolar disorders | 15,923 | 19,417 | 24,416 | 29,740 | 34,189 | 36,616 | 40,266 | 43,427 | 46,999 | 48,018 |
| Anxiety disorders | 26,957 | 31,009 | 35,776 | 40,385 | 54,941 | 62,256 | 66,570 | 77,325 | 91,666 | 105,234 |
| Autism spectrum disorders | 11,746 | 13,465 | 16,373 | 18,753 | 28,486 | 32,772 | 38,155 | 44,804 | 49,699 | 57,758 |
| Intellectual disorders | 33,110 | 33,856 | 33,877 | 33,811 | 35,988 | 36,553 | 39,146 | 42,123 | 42,346 | 43,137 |
| Learning disorders | 62,126 | 64,606 | 66,378 | 66,428 | 68,794 | 72,325 | 69,711 | 75,656 | 85,646 | 101,565 |
| Any of the above | 411,670 | 458,502 | 515,838 | 561,252 | 612,024 | 626,073 | 659,001 | 731,818 | 831,780 | 907,731 |
| Speech and language disorders | 82,362 | 90,749 | 100,442 | 113,563 | 131,657 | 138,423 | 134,313 | 151,430 | 177,688 | 222,132 |
| Hearing disorders | 257,026 | 279,457 | 311,864 | 275,211 | 310,570 | 305,634 | 316,366 | 355,360 | 432,264 | 446,534 |
| Cerebral palsy | 27,694 | 28,937 | 31,612 | 32,373 | 33,028 | 33,582 | 34,440 | 35,134 | 35,811 | 36,488 |
| Asthma | 117,849 | 141,537 | 171,114 | 185,860 | 214,890 | 215,554 | 225,655 | 254,077 | 323,083 | 342,512 |
Inclusion criteria: youth age 3‐17 with 11+ months of Medicaid eligibility and no dual eligibility in the year.
Source: Medicaid Analytic Extract (MAX) data for 20 states: AK, AL, AR, CA, FL, ID, IL, IN, LA, MI, MS, MT, NC, ND, NH, NM, SD, VA, VT, WY.
A diagnosis was established based on the presence of one or more inpatient or two or more non‐inpatient claims with qualifying ICD‐9‐CM codes.
Table G-2b
Diagnoses ‐ SSI/Disability Enrollees
| Diagnosis | 2001 | 2002 | 2003 | 2004 | 2005 | 2006 | 2007 | 2008 | 2009 | 2010 |
| ADHD | 10.7% | 11.3% | 12.3% | 13.1% | 14.4% | 14.2% | 14.5% | 15.7% | 17.3% | 17.7% |
| Conduct disorder | 3.5% | 3.7% | 3.8% | 4.0% | 4.0% | 3.9% | 3.9% | 4.2% | 4.7% | 4.6% |
| Emotional disturbances | 4.2% | 4.4% | 4.5% | 4.7% | 4.7% | 4.7% | 4.9% | 5.2% | 5.4% | 5.4% |
| Oppositional defiant disorder | 2.7% | 2.9% | 3.0% | 3.0% | 3.5% | 3.7% | 4.0% | 4.2% | 4.6% | 4.5% |
| Depression | 4.0% | 4.3% | 4.5% | 4.6% | 4.5% | 4.4% | 4.4% | 4.8% | 5.4% | 5.5% |
| Bipolar disorders | 1.4% | 1.7% | 1.9% | 2.3% | 2.4% | 2.5% | 2.7% | 2.8% | 3.0% | 2.8% |
| Anxiety disorders | 0.8% | 0.8% | 0.9% | 1.0% | 1.2% | 1.3% | 1.5% | 1.6% | 1.8% | 2.0% |
| Autism spectrum disorders | 2.2% | 2.4% | 2.7% | 3.0% | 3.8% | 4.2% | 4.9% | 5.7% | 6.0% | 6.7% |
| Intellectual disorders | 6.6% | 6.5% | 6.2% | 6.2% | 6.4% | 6.4% | 6.8% | 7.1% | 6.6% | 6.4% |
| Learning disorders | 5.6% | 5.7% | 5.8% | 5.9% | 5.9% | 6.0% | 5.7% | 5.8% | 6.0% | 6.8% |
| Any of the above | 29.2% | 30.2% | 31.0% | 32.2% | 33.7% | 33.3% | 34.0% | 36.0% | 37.8% | 38.6% |
| Speech and language disorders | 6.3% | 6.6% | 6.9% | 7.5% | 8.4% | 8.8% | 8.6% | 9.5% | 10.3% | 11.9% |
| Hearing disorders | 8.6% | 8.5% | 8.4% | 7.6% | 7.7% | 7.5% | 7.7% | 8.1% | 8.6% | 8.5% |
| Cerebral palsy | 6.2% | 6.2% | 6.3% | 6.3% | 6.1% | 6.1% | 6.1% | 6.1% | 5.8% | 5.7% |
| Asthma | 4.9% | 5.3% | 5.7% | 5.9% | 6.3% | 6.3% | 6.5% | 7.0% | 8.0% | 7.9% |
| N | 361,106 | 376,196 | 395,718 | 407,703 | 416,367 | 426,454 | 431,901 | 440,135 | 468,735 | 478,822 |
Inclusion criteria: youth age 3‐17 with 11+ months of Medicaid eligibility and no dual eligibility in the year.
Source: Medicaid Analytic Extract (MAX) data for 20 states: AK, AL, AR, CA, FL, ID, IL, IN, LA, MI, MS, MT, NC, ND, NH, NM, SD, VA, VT, WY.
A diagnosis was established based on the presence of one or more inpatient or two or more non‐inpatient claims with qualifying ICD‐9‐CM codes.
Table G-2b (Ns)
Diagnoses ‐ SSI/Disability Enrollees
| Diagnosis | 2001 | 2002 | 2003 | 2004 | 2005 | 2006 | 2007 | 2008 | 2009 | 2010 |
| ADHD | 38,466 | 42,603 | 48,485 | 53,357 | 59,756 | 60,492 | 62,787 | 69,149 | 81,051 | 84,519 |
| Conduct disorder | 12,473 | 14,083 | 15,228 | 16,226 | 16,788 | 16,478 | 16,730 | 18,506 | 21,835 | 22,067 |
| Emotional disturbances | 15,180 | 16,534 | 17,907 | 19,168 | 19,628 | 20,184 | 21,117 | 22,702 | 25,464 | 25,870 |
| Oppositional defiant disorder | 9,884 | 10,902 | 11,781 | 12,412 | 14,565 | 15,840 | 17,246 | 18,639 | 21,331 | 21,320 |
| Depression | 14,478 | 16,198 | 17,769 | 18,745 | 18,576 | 18,669 | 19,004 | 21,295 | 25,213 | 26,251 |
| Bipolar disorders | 5,211 | 6,337 | 7,640 | 9,206 | 10,167 | 10,693 | 11,511 | 12,364 | 13,846 | 13,550 |
| Anxiety disorders | 2,916 | 3,150 | 3,557 | 3,970 | 5,117 | 5,677 | 6,295 | 7,234 | 8,522 | 9,473 |
| Autism spectrum disorders | 8,072 | 9,075 | 10,859 | 12,273 | 15,685 | 18,056 | 21,284 | 25,203 | 28,132 | 31,876 |
| Intellectual disorders | 23,872 | 24,371 | 24,499 | 25,079 | 26,506 | 27,407 | 29,515 | 31,153 | 30,956 | 30,563 |
| Learning disorders | 20,266 | 21,352 | 22,941 | 23,992 | 24,758 | 25,742 | 24,419 | 25,650 | 28,195 | 32,546 |
| Any of the above | 105,298 | 113,586 | 122,609 | 131,420 | 140,233 | 141,913 | 146,859 | 158,246 | 177,280 | 184,856 |
| Speech and language disorders | 22,787 | 24,742 | 27,333 | 30,509 | 35,141 | 37,667 | 37,256 | 41,885 | 48,361 | 57,106 |
| Hearing disorders | 30,919 | 32,074 | 33,438 | 30,981 | 31,853 | 32,106 | 33,110 | 35,497 | 40,537 | 40,861 |
| Cerebral palsy | 22,426 | 23,212 | 24,956 | 25,610 | 25,598 | 25,953 | 26,504 | 26,872 | 27,266 | 27,361 |
| Asthma | 17,622 | 19,885 | 22,719 | 24,144 | 26,243 | 26,893 | 28,078 | 30,708 | 37,307 | 38,034 |
Inclusion criteria: youth age 3‐17 with 11+ months of Medicaid eligibility and no dual eligibility in the year.
Source: Medicaid Analytic Extract (MAX) data for 20 states: AK, AL, AR, CA, FL, ID, IL, IN, LA, MI, MS, MT, NC, ND, NH, NM, SD, VA, VT, WY.
A diagnosis was established based on the presence of one or more inpatient or two or more non‐inpatient claims with qualifying ICD‐9‐CM codes.
Figure G-1
Diagnoses ‐ All Enrollees
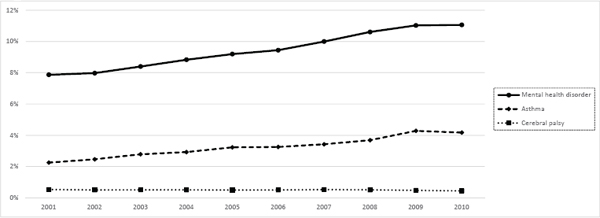
Mental health disorder: ADHD, conduct disorders, emotional disturbances, oppositional defiant disorder, depression, bipolar disorders, anxiety disorders, intellectual disorders, learning disorders, autism spectrum disorders.
Inclusion criteria: youth age 3‐17 with 11+ months of Medicaid eligibility and no dual eligibility in the year.
Source: Medicaid Analytic Extract (MAX) data for 20 states: AK, AL, AR, CA, FL, ID, IL, IN, LA, MI, MS, MT, NC, ND, NH, NM, SD, VA, VT, WY.
A diagnosis was established based on the presence of one or more inpatient or two or more non‐inpatient claims with qualifying ICD‐9‐CM codes.
(Data for Figure G-1)
Diagnoses ‐ All Enrollees
| Diagnosis | 2001 | 2002 | 2003 | 2004 | 2005 | 2006 | 2007 | 2008 | 2009 | 2010 |
| ADHD | 3.0% | 3.2% | 3.5% | 3.9% | 4.2% | 4.3% | 4.7% | 5.1% | 5.4% | 5.5% |
| Other mental health disorder | 6.3% | 6.5% | 7.0% | 7.5% | 7.8% | 8.0% | 8.5% | 9.0% | 9.5% | 9.5% |
| Mental health disorder (broad) | 7.9% | 8.0% | 8.4% | 8.8% | 9.2% | 9.4% | 10.0% | 10.6% | 11.0% | 11.1% |
| Developmental disorder | 7.8% | 7.7% | 7.9% | 7.2% | 7.8% | 7.9% | 8.1% | 8.6% | 9.2% | 9.3% |
| Cerebral palsy | 0.5% | 0.5% | 0.5% | 0.5% | 0.5% | 0.5% | 0.5% | 0.5% | 0.5% | 0.4% |
| Asthma | 2.3% | 2.5% | 2.8% | 2.9% | 3.2% | 3.3% | 3.4% | 3.7% | 4.3% | 4.2% |
| N | 5,232,083 | 5,749,809 | 6,144,784 | 6,356,411 | 6,658,353 | 6,630,423 | 6,593,490 | 6,899,748 | 7,545,081 | 8,208,507 |
Other mental health disorder: conduct disorder, emotional disturbances, oppositional defiant disorder, depression, bipolar disorders, anxiety disorders (ADHD excluded).
Mental health disorder (broad): ADHD, conduct disorders, emotional disturbances, oppositional defiant disorder, depression, bipolar disorders, anxiety disorders, intellectual disorders, learning disorders, autism spectrum disorders.
Developmental disorder: autism spectrum disorders, intellectual disorders, speech and language disorders, hearing disorders, learning disorders.
Inclusion criteria: youth age 3‐17 with 11+ months of Medicaid eligibility and no dual eligibility in the year.
Source: Medicaid Analytic Extract (MAX) data for 20 states: AK, AL, AR, CA, FL, ID, IL, IN, LA, MI, MS, MT, NC, ND, NH, NM, SD, VA, VT, WY.
A diagnosis was established based on the presence of one or more inpatient or two or more non‐inpatient claims with qualifying ICD‐9‐CM codes.
Figure G-2
Diagnoses ‐ SSI/Disability Enrollees
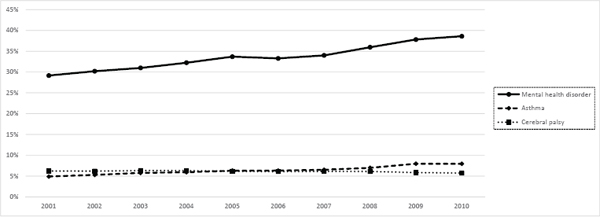
Mental health disorder: ADHD, conduct disorders, emotional disturbances, oppositional defiant disorder, depression, bipolar disorders, anxiety disorders, intellectual disorders, learning disorders, autism spectrum disorders.
Inclusion criteria: youth age 3‐17 with 11+ months of Medicaid eligibility and no dual eligibility in the year.
Source: Medicaid Analytic Extract (MAX) data for 20 states: AK, AL, AR, CA, FL, ID, IL, IN, LA, MI, MS, MT, NC, ND, NH, NM, SD, VA, VT, WY.
A diagnosis was established based on the presence of one or more inpatient or two or more non‐inpatient claims with qualifying ICD‐9‐CM codes.
(Data for Figure G-2)
Diagnoses ‐ SSI/Disability Enrollees
| Diagnosis | 2001 | 2002 | 2003 | 2004 | 2005 | 2006 | 2007 | 2008 | 2009 | 2010 |
| ADHD | 10.7% | 11.3% | 12.3% | 13.1% | 14.4% | 14.2% | 14.5% | 15.7% | 17.3% | 17.7% |
| Other mental health disorder | 18.5% | 19.6% | 20.6% | 21.7% | 22.7% | 21.9% | 22.2% | 23.7% | 25.8% | 26.0% |
| Mental health disorder (broad) | 29.2% | 30.2% | 31.0% | 32.2% | 33.7% | 33.3% | 34.0% | 36.0% | 37.8% | 38.6% |
| Developmental disorder | 23.8% | 24.2% | 24.2% | 24.2% | 25.4% | 25.9% | 26.2% | 27.5% | 28.3% | 29.9% |
| Cerebral palsy | 6.2% | 6.2% | 6.3% | 6.3% | 6.1% | 6.1% | 6.1% | 6.1% | 5.8% | 5.7% |
| Asthma | 4.9% | 5.3% | 5.7% | 5.9% | 6.3% | 6.3% | 6.5% | 7.0% | 8.0% | 7.9% |
| N | 361,106 | 376,196 | 395,718 | 407,703 | 416,367 | 426,454 | 431,901 | 440,135 | 468,735 | 478,822 |
Other mental health disorder: conduct disorder, emotional disturbances, oppositional defiant disorder, depression, bipolar disorders, anxiety disorders (ADHD excluded).
Mental health disorder (broad): ADHD, conduct disorders, emotional disturbances, oppositional defiant disorder, depression, bipolar disorders, anxiety disorders, intellectual disorders, learning disorders, autism spectrum disorders.
Developmental disorder: autism spectrum disorders, intellectual disorders, speech and language disorders, hearing disorders, learning disorders.
Inclusion criteria: youth age 3‐17 with 11+ months of Medicaid eligibility and no dual eligibility in the year.
Source: Medicaid Analytic Extract (MAX) data for 20 states: AK, AL, AR, CA, FL, ID, IL, IN, LA, MI, MS, MT, NC, ND, NH, NM, SD, VA, VT, WY.
A diagnosis was established based on the presence of one or more inpatient or two or more non‐inpatient claims with qualifying ICD‐9‐CM codes.
Table G-3a
ADHD Type ‐ All Enrollees
| ADHD Type | 2001 | 2002 | 2003 | 2004 | 2005 | 2006 | 2007 | 2008 | 2009 | 2010 |
| ADHD with no other mental health/developmental dxs | 1.9% | 2.0% | 2.2% | 2.4% | 2.6% | 2.5% | 2.7% | 2.9% | 3.1% | 3.1% |
| ADHD with one or more other mental health/developmental dxs | 1.2% | 1.2% | 1.4% | 1.5% | 1.6% | 1.8% | 1.9% | 2.1% | 2.3% | 2.4% |
| Proportion with one or more other mental health dxs | 38.2% | 37.8% | 38.4% | 37.8% | 38.7% | 41.2% | 41.6% | 42.2% | 42.7% | 43.3% |
| ADHD without externalizing disorder (CD/ODD) | 2.5% | 2.7% | 3.0% | 3.3% | 3.5% | 3.6% | 3.8% | 4.1% | 4.4% | 4.5% |
| ADHD with externalizing disorder (CD/ODD) | 0.5% | 0.5% | 0.6% | 0.6% | 0.7% | 0.8% | 0.8% | 0.9% | 1.0% | 1.0% |
| Proportion with externalizing disorder (CD/ODD) | 15.8% | 15.7% | 15.5% | 15.2% | 15.7% | 17.5% | 18.1% | 18.4% | 18.6% | 18.3% |
| N | 5,232,083 | 5,749,809 | 6,144,784 | 6,356,411 | 6,658,353 | 6,630,423 | 6,593,490 | 6,899,748 | 7,545,081 | 8,208,507 |
Table G-3b
ADHD Type ‐ SSI/Disability Enrollees
| ADHD Type | 2001 | 2002 | 2003 | 2004 | 2005 | 2006 | 2007 | 2008 | 2009 | 2010 |
| ADHD with no other mental health/developmental dxs | 5.7% | 6.0% | 6.3% | 6.8% | 7.4% | 6.8% | 6.7% | 7.1% | 7.9% | 7.8% |
| ADHD with one or more other mental health/developmental dxs | 4.9% | 5.4% | 5.9% | 6.3% | 6.9% | 7.4% | 7.8% | 8.6% | 9.4% | 9.8% |
| Proportion with one or more other mental health dxs | 46.3% | 47.3% | 48.3% | 48.1% | 48.3% | 52.1% | 53.9% | 54.5% | 54.5% | 55.8% |
| ADHD without externalizing disorder (CD/ODD) | 8.6% | 9.1% | 9.8% | 10.5% | 11.5% | 11.0% | 11.2% | 12.0% | 13.2% | 13.5% |
| ADHD with externalizing disorder (CD/ODD) | 2.0% | 2.2% | 2.5% | 2.6% | 2.9% | 3.1% | 3.4% | 3.7% | 4.1% | 4.1% |
| Proportion with externalizing disorder (CD/ODD) | 19.2% | 19.8% | 20.3% | 19.7% | 19.9% | 22.1% | 23.2% | 23.5% | 23.8% | 23.4% |
| N | 361,106 | 376,196 | 395,718 | 407,703 | 416,367 | 426,454 | 431,901 | 440,135 | 468,735 | 478,822 |
Inclusion criteria: youth age 3‐17 with 11+ months of Medicaid eligibility and no dual eligibility in the year.
Source: Medicaid Analytic Extract (MAX) data for 20 states: AK, AL, AR, CA, FL, ID, IL, IN, LA, MI, MS, MT, NC, ND, NH, NM, SD, VA, VT, WY.
Row groups are not all mutually exclusive, but each “with/without” pair is.
Table G-4a
Comorbid diagnoses ‐ All Enrollees with ADHD
| Diagnosis | 2001 | 2002 | 2003 | 2004 | 2005 | 2006 | 2007 | 2008 | 2009 | 2010 |
| ADHD | ||||||||||
| Conduct disorder | 8.1% | 8.0% | 7.9% | 7.8% | 7.9% | 8.4% | 8.5% | 8.7% | 8.8% | 8.6% |
| Emotional disturbances | 11.6% | 11.4% | 11.2% | 10.9% | 11.4% | 12.8% | 13.2% | 13.4% | 13.5% | 13.4% |
| Oppositional defiant disorder | 9.4% | 9.4% | 9.3% | 9.1% | 9.6% | 11.1% | 11.6% | 11.8% | 11.9% | 11.7% |
| Depression | 9.3% | 9.1% | 9.5% | 9.8% | 9.6% | 10.4% | 10.2% | 10.4% | 10.8% | 11.2% |
| Bipolar disorders | 3.4% | 3.6% | 4.0% | 4.6% | 4.9% | 5.4% | 5.4% | 5.3% | 5.0% | 4.7% |
| Anxiety disorders | 2.7% | 2.7% | 3.0% | 3.1% | 3.4% | 3.8% | 3.9% | 4.2% | 4.6% | 5.1% |
| Autism spectrum disorders | 1.0% | 1.1% | 1.2% | 1.3% | 1.9% | 2.2% | 2.6% | 2.9% | 2.9% | 3.2% |
| Intellectual disorders | 2.1% | 2.0% | 1.8% | 1.6% | 1.6% | 1.7% | 1.7% | 1.6% | 1.4% | 1.4% |
| Learning disorders | 4.1% | 4.1% | 3.8% | 3.7% | 3.6% | 3.8% | 3.5% | 3.5% | 3.6% | 3.9% |
| Speech and language disorders | 4.5% | 4.4% | 4.7% | 4.9% | 4.9% | 5.2% | 5.1% | 5.3% | 5.6% | 6.4% |
| Hearing disorders | 7.7% | 7.6% | 7.9% | 6.9% | 6.9% | 6.6% | 6.6% | 6.8% | 7.0% | 6.7% |
| Cerebral palsy | 0.5% | 0.4% | 0.5% | 0.4% | 0.4% | 0.5% | 0.5% | 0.4% | 0.4% | 0.4% |
| Asthma | 4.2% | 4.6% | 5.1% | 5.4% | 6.0% | 6.1% | 6.2% | 6.3% | 7.0% | 6.9% |
| N | 157,867 | 181,400 | 217,970 | 248,157 | 280,223 | 286,997 | 306,834 | 349,037 | 405,795 | 448,796 |
Inclusion criteria: youth age 3‐17 with 11+ months of Medicaid eligibility and no dual eligibility in the year.
Source: Medicaid Analytic Extract (MAX) data for 20 states: AK, AL, AR, CA, FL, ID, IL, IN, LA, MI, MS, MT, NC, ND, NH, NM, SD, VA, VT, WY.
A diagnosis was established based on the presence of one or more inpatient or two or more non‐inpatient claims with qualifying ICD‐9‐CM codes.
Table G-4b
Comorbid diagnoses ‐ SSI/Disability Enrollees with ADHD
| Diagnosis | 2001 | 2002 | 2003 | 2004 | 2005 | 2006 | 2007 | 2008 | 2009 | 2010 |
| ADHD | ||||||||||
| Conduct disorder | 10.2% | 10.6% | 10.8% | 10.8% | 10.6% | 11.2% | 11.2% | 11.4% | 11.6% | 11.4% |
| Emotional disturbances | 13.5% | 13.6% | 14.1% | 13.6% | 13.9% | 15.8% | 16.8% | 17.0% | 16.9% | 16.7% |
| Oppositional defiant disorder | 11.2% | 11.5% | 11.9% | 11.4% | 11.9% | 13.9% | 15.0% | 15.2% | 15.3% | 14.9% |
| Depression | 9.7% | 9.9% | 10.4% | 10.6% | 10.4% | 11.3% | 11.3% | 12.2% | 12.7% | 13.4% |
| Bipolar disorders | 5.4% | 5.8% | 6.5% | 7.3% | 7.7% | 8.5% | 8.9% | 8.6% | 8.3% | 8.0% |
| Anxiety disorders | 2.0% | 2.0% | 2.2% | 2.5% | 2.6% | 3.0% | 3.3% | 3.6% | 3.7% | 4.2% |
| Autism spectrum disorders | 2.6% | 2.8% | 3.3% | 3.7% | 4.4% | 5.4% | 6.4% | 7.4% | 7.4% | 8.2% |
| Intellectual disorders | 5.5% | 5.5% | 5.3% | 4.8% | 4.8% | 5.3% | 5.4% | 5.2% | 4.4% | 4.4% |
| Learning disorders | 6.3% | 6.6% | 6.4% | 6.4% | 6.2% | 6.4% | 6.0% | 6.1% | 6.1% | 6.8% |
| Speech and language disorders | 6.7% | 6.9% | 7.3% | 8.1% | 8.1% | 8.7% | 8.8% | 9.5% | 10.1% | 11.5% |
| Hearing disorders | 7.8% | 7.8% | 7.8% | 7.0% | 6.9% | 6.7% | 7.0% | 7.1% | 7.2% | 6.9% |
| Cerebral palsy | 1.3% | 1.3% | 1.4% | 1.4% | 1.3% | 1.5% | 1.5% | 1.4% | 1.3% | 1.3% |
| Asthma | 4.7% | 5.5% | 6.2% | 6.5% | 7.3% | 7.5% | 7.6% | 7.9% | 8.6% | 8.6% |
| N | 38,466 | 42,603 | 48,485 | 53,357 | 59,756 | 60,492 | 62,787 | 69,149 | 81,051 | 84,519 |
Inclusion criteria: youth age 3‐17 with 11+ months of Medicaid eligibility and no dual eligibility in the year.
Source: Medicaid Analytic Extract (MAX) data for 20 states: AK, AL, AR, CA, FL, ID, IL, IN, LA, MI, MS, MT, NC, ND, NH, NM, SD, VA, VT, WY.
A diagnosis was established based on the presence of one or more inpatient or two or more non‐inpatient claims with qualifying ICD‐9‐CM codes.
Table G-5a
Diagnoses by Age, in 2010 ‐ SSI/Disability Enrollees
| Diagnosis | Age 3‐5 | Age 6‐11 | Age 12‐17 |
| ADHD | 6.5% | 21.9% | 17.6% |
| Conduct disorder | 3.0% | 4.4% | 5.3% |
| Emotional disturbances | 1.9% | 5.2% | 6.8% |
| Oppositional defiant disorder | 1.0% | 4.3% | 5.8% |
| Depression | 0.6% | 3.8% | 8.7% |
| Bipolar disorders | 0.2% | 1.9% | 4.6% |
| Anxiety disorders | 0.7% | 2.0% | 2.3% |
| Autism spectrum disorders | 7.9% | 7.8% | 5.2% |
| Intellectual disorders | 2.9% | 6.3% | 7.6% |
| Learning disorders | 12.1% | 7.4% | 4.4% |
| Speech and language disorders | 20.7% | 15.3% | 5.8% |
| Hearing disorders | 19.8% | 8.6% | 4.6% |
| Cerebral palsy | 7.3% | 6.0% | 5.0% |
| Asthma | 12.8% | 8.8% | 5.5% |
| N | 72,940 | 193,479 | 212,403 |
Inclusion criteria: youth age 3‐17 with 11+ months of Medicaid eligibility and no dual eligibility in the year. Source: Medicaid Analytic Extract (MAX) data for 20 states: AK, AL, AR, CA, FL, ID, IL, IN, LA, MI, MS, MT, NC, ND, NH, NM, SD, VA, VT, WY.
A diagnosis was established based on the presence of one or more inpatient or two or more non‐inpatient claims with qualifying ICD‐9‐CM codes. Some sex and race/ethnicity data were missing.
Table G-5b
Diagnoses by Sex, in 2010 ‐ SSI/Disability Enrollees
| Diagnosis | Female | Male |
| ADHD | 11.7% | 20.6% |
| Conduct disorder | 3.2% | 5.3% |
| Emotional disturbances | 4.3% | 6.0% |
| Oppositional defiant disorder | 3.4% | 5.0% |
| Depression | 5.8% | 5.3% |
| Bipolar disorders | 2.7% | 2.9% |
| Anxiety disorders | 2.2% | 1.9% |
| Autism spectrum disorders | 4.0% | 8.0% |
| Intellectual disorders | 7.1% | 6.0% |
| Learning disorders | 6.8% | 6.8% |
| Speech and language disorders | 11.1% | 12.4% |
| Hearing disorders | 10.0% | 7.8% |
| Cerebral palsy | 7.3% | 4.9% |
| Asthma | 7.9% | 8.0% |
| N | 159,270 | 319,549 |
Inclusion criteria: youth age 3‐17 with 11+ months of Medicaid eligibility and no dual eligibility in the year.
Source: Medicaid Analytic Extract (MAX) data for 20 states: AK, AL, AR, CA, FL, ID, IL, IN, LA, MI, MS, MT, NC, ND, NH, NM, SD, VA, VT, WY.
A diagnosis was established based on the presence of one or more inpatient or two or more non-inpatient claims with qualifying ICD-9-CM codes.
Some sex and race/ethnicity data were missing.
Table G-5c
Diagnoses by Race/ethnicity, in 2010 ‐ SSI/Disability Enrollees
| Diagnosis | White | Black/Af. Am. | Am. Indian/AK Native | Asian | Hispanic/Latino | More than 1/Unknown |
| ADHD | 23.3% | 18.8% | 18.4% | 4.5% | 10.3% | 15.7% |
| Conduct disorder | 5.2% | 5.1% | 4.3% | 2.1% | 3.7% | 4.1% |
| Emotional disturbances | 6.9% | 6.6% | 7.6% | 1.0% | 3.2% | 4.1% |
| Oppositional defiant disorder | 5.6% | 5.8% | 5.7% | 0.7% | 2.2% | 3.3% |
| Depression | 8.0% | 5.5% | 8.1% | 1.9% | 5.2% | 3.9% |
| Bipolar disorders | 5.6% | 2.2% | 3.4% | 0.7% | 1.9% | 1.9% |
| Anxiety disorders | 3.5% | 1.3% | 2.8% | 1.0% | 2.1% | 1.7% |
| Autism spectrum disorders | 12.5% | 3.7% | 5.1% | 11.0% | 6.0% | 5.8% |
| Intellectual disorders | 10.6% | 3.8% | 3.5% | 25.9% | 11.6% | 3.9% |
| Learning disorders | 8.5% | 5.5% | 10.4% | 5.3% | 5.5% | 7.3% |
| Speech and language disorders | 14.6% | 9.0% | 17.1% | 10.9% | 8.4% | 14.0% |
| Hearing disorders | 11.4% | 4.8% | 10.6% | 7.4% | 10.1% | 9.7% |
| Cerebral palsy | 8.6% | 3.3% | 5.1% | 12.8% | 9.1% | 4.9% |
| Asthma | 6.3% | 9.2% | 8.5% | 4.2% | 7.4% | 8.1% |
| N | 104,116 | 152,011 | 5,320 | 3,635 | 49,189 | 161,876 |
Inclusion criteria: youth age 3‐17 with 11+ months of Medicaid eligibility and no dual eligibility in the year.
Source: Medicaid Analytic Extract (MAX) data for 20 states: AK, AL, AR, CA, FL, ID, IL, IN, LA, MI, MS, MT, NC, ND, NH, NM, SD, VA, VT, WY.
A diagnosis was established based on the presence of one or more inpatient or two or more non‐inpatient claims with qualifying ICD‐9‐CM codes.
Table G-6a
ADHD Treatment ‐ All Enrollees with ADHD
| Treatment status | 2001 | 2002 | 2003 | 2004 | 2005 | 2006 | 2007 | 2008 | 2009 | 2010 |
| Not Treated | 13.1% | 12.2% | 10.3% | 8.5% | 9.9% | 10.0% | 9.8% | 9.3% | 8.8% | 8.0% |
| Treated with medication only | 65.2% | 66.8% | 60.9% | 52.6% | 53.2% | 52.5% | 51.7% | 51.8% | 52.4% | 53.2% |
| Treated with psychotherapy only | 3.2% | 2.9% | 4.6% | 6.1% | 6.2% | 7.0% | 7.2% | 7.2% | 7.0% | 6.7% |
| Treated with both medication and psychotherapy | 18.5% | 18.1% | 24.2% | 32.8% | 30.8% | 30.6% | 31.4% | 31.7% | 31.8% | 32.1% |
| N | 157,867 | 181,400 | 217,970 | 248,157 | 280,223 | 286,997 | 306,834 | 349,037 | 405,795 | 448,796 |
Table G-6b
ADHD Treatment ‐ SSI/Disability Enrollees with ADHD
| Treatment status | 2001 | 2002 | 2003 | 2004 | 2005 | 2006 | 2007 | 2008 | 2009 | 2010 |
| Not Treated | 15.3% | 14.6% | 12.6% | 11.0% | 11.5% | 10.2% | 9.5% | 9.3% | 8.6% | 7.6% |
| Treated with medication only | 67.6% | 68.4% | 60.2% | 49.6% | 50.7% | 50.5% | 48.6% | 48.0% | 50.1% | 50.2% |
| Treated with psychotherapy only | 2.2% | 1.9% | 3.6% | 5.0% | 5.2% | 6.1% | 6.6% | 6.9% | 6.0% | 8.2% |
| Treated with both medication and psychotherapy | 14.9% | 15.1% | 23.6% | 34.4% | 32.6% | 33.1% | 35.3% | 35.8% | 35.3% | 36.4% |
| N | 38,466 | 42,603 | 48,485 | 53,357 | 59,756 | 60,492 | 62,787 | 69,149 | 81,051 | 84,519 |
Inclusion criteria: youth age 3‐17 with 11+ months of Medicaid eligibility and no dual eligibility in the year.
Source: Medicaid Analytic Extract (MAX) data for 20 states: AK, AL, AR, CA, FL, ID, IL, IN, LA, MI, MS, MT, NC, ND, NH, NM, SD, VA, VT, WY.
A diagnosis was established based on the presence of one or more inpatient or two or more non‐inpatient claims with qualifying ICD‐9‐CM codes.
Medications are limited to those on the ADHD medication list.
Table G-7a
Mental Health Treatment ‐ All Enrollees with One or More Mental Health/Developmental Diagnoses, in 2010
| Diagnosis | Not Treated | Treated with medication only | Treated with psychotherapy only | Treated with both medication and psychotherapy | |
| ADHD | 6.9% | 54.3% | 5.2% | 33.6% | 100% |
| Conduct disorder | 27.4% | 21.7% | 18.2% | 32.7% | 100% |
| Emotional disturbances | 22.8% | 19.6% | 19.1% | 38.4% | 100% |
| Oppositional defiant disorder | 20.6% | 19.9% | 18.4% | 41.1% | 100% |
| Depression | 21.8% | 25.2% | 14.1% | 38.9% | 100% |
| Bipolar disorders | 4.6% | 35.4% | 4.2% | 55.8% | 100% |
| Anxiety disorders | 26.2% | 15.3% | 29.5% | 29.0% | 100% |
| Autism spectrum disorders | 28.8% | 31.7% | 12.0% | 27.5% | 100% |
| Intellectual disorders | 42.0% | 35.3% | 7.3% | 15.3% | 100% |
| Learning disorders | 49.9% | 19.2% | 17.2% | 13.8% | 100% |
| Any of the above | 24.3% | 36.6% | 13.9% | 25.3% | 100% |
| Speech and language disorders | 70.4% | 15.1% | 7.0% | 7.5% | 100% |
| Hearing disorders | 84.4% | 8.3% | 3.7% | 3.7% | 100% |
Inclusion criteria: youth age 3‐17 with 11+ months of Medicaid eligibility and no dual eligibility in the year.
Source: Medicaid Analytic Extract (MAX) data for 20 states: AK, AL, AR, CA, FL, ID, IL, IN, LA, MI, MS, MT, NC, ND, NH, NM, SD, VA, VT, WY.
A diagnosis was established based on the presence of one or more inpatient or two or more non‐inpatient claims with qualifying ICD‐9‐CM codes.
Medication types include: ADHD medications, antipsychotics, antidepressants, mood stabilizers, anxiolytics/hypnotics.
Table G-7b Mental Health Treatment ‐ SSI/Disability Enrollees with One or More Mental Health/Developmental Diagnoses, in 2010
| Diagnosis | Not Treated | Treated with medication only | Treated with psychotherapy only | Treated with both medication and psychotherapy | |
| ADHD | 5.4% | 52.3% | 3.6% | 38.6% | 100% |
| Conduct disorder | 16.1% | 33.4% | 8.9% | 41.7% | 100% |
| Emotional disturbances | 13.1% | 26.3% | 10.3% | 50.3% | 100% |
| Oppositional defiant disorder | 10.7% | 26.0% | 9.4% | 54.0% | 100% |
| Depression | 10.3% | 33.5% | 6.5% | 49.8% | 100% |
| Bipolar disorders | 3.1% | 40.3% | 1.9% | 54.7% | 100% |
| Anxiety disorders | 15.3% | 26.4% | 14.5% | 43.9% | 100% |
| Autism spectrum disorders | 30.8% | 38.1% | 7.2% | 23.9% | 100% |
| Intellectual disorders | 43.9% | 39.1% | 4.4% | 12.6% | 100% |
| Learning disorders | 45.9% | 29.7% | 10.0% | 14.5% | 100% |
| Any of the above | 25.3% | 41.5% | 6.9% | 26.3% | 100% |
| Speech and language disorders | 56.7% | 25.9% | 6.2% | 11.3% | 100% |
| Hearing disorders | 61.8% | 24.3% | 4.6% | 9.3% | 100% |
Inclusion criteria: youth age 3‐17 with 11+ months of Medicaid eligibility and no dual eligibility in the year.
Source: Medicaid Analytic Extract (MAX) data for 20 states: AK, AL, AR, CA, FL, ID, IL, IN, LA, MI, MS, MT, NC, ND, NH, NM, SD, VA, VT, WY.
A diagnosis was established based on the presence of one or more inpatient or two or more non‐inpatient claims with qualifying ICD‐9‐CM codes.
Medication types include: ADHD medications, antipsychotics, antidepressants, mood stabilizers, anxiolytics/hypnotics.
Project conducted by:
Center for Health Services Research on Pharmacotherapy, Chronic Disease Management, and
Outcomes, and Center for Education and Research on Mental Health Therapeutics
Institute for Health, Health Care Policy, and Aging Research
Rutgers University


